Abstract
Background
Tools in image reconstruction, motion correction, and segmentation have enabled the accurate volumetric characterization of fetal brain growth at MRI.
Purpose
To evaluate the volumetric growth of intracranial structures in healthy fetuses, accounting for gestational age (GA), sex, and laterality with use of a spatiotemporal MRI atlas of fetal brain development.
Materials and Methods
T2-weighted 3.0-T half-Fourier acquired single-shot turbo spin-echo sequence MRI was performed in healthy fetuses from prospectively recruited pregnant volunteers from March 2013 to May 2019. A previously validated section-to-volume reconstruction algorithm was used to generate intensity-normalized superresolution three-dimensional volumes that were registered to a fetal brain MRI atlas with 28 anatomic regions of interest. Atlas-based segmentation was performed and manually refined. Labels included the bilateral hippocampus, amygdala, caudate nucleus, lentiform nucleus, thalamus, lateral ventricle, cerebellum, cortical plate, hemispheric white matter, internal capsule, ganglionic eminence, ventricular zone, corpus callosum, brainstem, hippocampal commissure, and extra-axial cerebrospinal fluid. For fetuses younger than 31 weeks of GA, the subplate and intermediate zones were delineated. A linear regression analysis was used to determine weekly age-related change adjusted for sex and laterality.
Results
The final analytic sample consisted of 122 MRI scans in 98 fetuses (mean GA, 29 weeks ± 5 [range, 20–38 weeks]). All structures had significant volume growth with increasing GA (P < .001). Weekly age-related change for individual structures in the brain parenchyma ranged from 2.0% (95% CI: 0.9, 3.1; P < .001) in the hippocampal commissure to 19.4% (95% CI: 18.7, 20.1; P < .001) in the cerebellum. The largest sex-related differences were 22.1% higher volume in male fetuses for the lateral ventricles (95% CI: 10.9, 34.4; P < .001). There was rightward volumetric asymmetry of 15.6% for the hippocampus (95% CI: 14.2, 17.2; P < .001) and leftward volumetric asymmetry of 8.1% for the lateral ventricles (95% CI: 3.7, 12.2; P < .001).
Conclusion
With use of a spatiotemporal MRI atlas, volumetric growth of the fetal brain showed complex trajectories dependent on structure, gestational age, sex, and laterality.
© RSNA, 2021
Online supplemental material is available for this article.
See also the editorial by Rollins in this issue.
Summary
MRI volumetric growth of the emerging fetal brain followed a complex trajectory dependent on structure, gestational age, sex, and laterality; recognition of this pattern may aid prenatal diagnosis.
Key Results
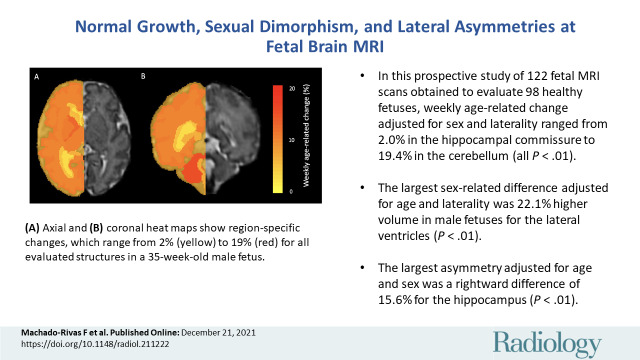
■ In this prospective study of 122 MRI scans obtained to evaluate 98 healthy fetuses, weekly age-related change adjusted for sex and laterality ranged from 2.0% in the hippocampal commissure to 19.4% in the cerebellum (all P < .001).
■ The largest sex-related difference adjusted for age and laterality was 22.1% higher volume in male fetuses for the lateral ventricles (P < .001).
■ The largest asymmetry adjusted for age and sex was a rightward difference of 15.6% for the hippocampus (P < .001).
Introduction
MRI has emerged as the dominant modality for evaluation of normal brain development, cerebral malformations, and brain injury prenatally. The high tissue contrast of fetal MRI allows for differentiation of the various constituents of the brain, including the cerebral cortex, deep gray matter, white matter, posterior fossa structures, and cerebrospinal fluid (CSF) spaces. Fetal MRI depicts age-related change in the transient fetal white matter zones (subplate, intermediate zone, proliferative compartments) and demonstrates the onset of myelination. In clinical practice, interpretation of fetal MRI is performed subjectively by expert readers. Tools in image reconstruction, motion correction, and segmentation have enabled the quantitative characterization of fetal brain growth (1,2); these tools hold the prospect of developing normative data for fetal brain development that could substantially improve prenatal diagnosis and disease-specific prognostication (3).
The need to better characterize fetal brain development was recognized by investigators including Andescavage et al (4), Clouchoux et al (5), and Jarvis et al (6). These authors used various image processing pipelines and segmentation algorithms to characterize volumetric changes in the fetal brain. Their results made valuable contributions by providing evidence of complex prenatal trajectories and preliminary evidence of scattered hemispheric asymmetries. However, many of these studies used segmentation labels that divided the brain parenchyma into major constituents (eg, gray matter, white matter, CSF), grouped smaller structures based on anatomic proximity (deep gray nuclei and internal capsule), and did not evaluate the transient white matter zones (4,6,7). The recent development of spatiotemporal atlases of neuroanatomic brain growth has substantially improved the level of anatomic detail (2), which is now comparable with that of neonatal segmentation pipelines (2,8). This level of detail is required to better understand normal development and to accurately identify abnormalities at their early stages.
We hypothesized that we would identify structure-specific developmental trajectories that serve as a prelude to infant brain growth and that we would observe widespread sexual dimorphism. Thus, the purpose of our study was to evaluate the volumetric growth of intracranial fetal structures using segmentations from a detailed MRI atlas of fetal brain development enriched to include the transient fetal white matter zones (2) in a cohort of normal pregnancies and account for the effects of gestational age (GA), sex, and hemispheric laterality.
Materials and Methods
Volunteer Recruitment
This study was compliant with the Health Insurance Portability and Accountability Act and approved by the institutional review board. All participants were prospectively recruited from March 2013 to May 2019, and informed consent was obtained for each fetal MRI examination. Participation in the study was advertised with use of pamphlets at outpatient obstetrics and gynecology clinics, pamphlets at our institution, and banners on the hospital’s intranet. Criteria for inclusion were (a) normal pregnancy between 19 and 40 weeks of GA and (b) age of mother between 18 and 45 years. Exclusion criteria were (a) any pregnancy or fetal abnormality (including congenital infection, multiple-gestation pregnancy, fetal abnormalities in the brain or in other organs, and chromosomal aberrations), (b) any contraindication to MRI, and (c) maternal comorbidities (eg, diabetes, hypertension, substance abuse).
Fetal MRI Protocol
Images were acquired with 3.0-T MRI scanners (Skyra and Prisma, Siemens Medical Solutions) with spine and 18-channel body coils. The imaging protocol consisted of multiple T2-weighted half-Fourier acquired single-shot turbo spin-echo (HASTE) scans along orthogonal planes. The sequence parameters were as follows: repetition time, 1400–2000 msec; echo time, 100–120 msec; in-plane resolution, 0.9–1.1 mm; section thickness, 2–3 mm, with no space between sections; and acquisition matrix size, 256 × 204, 256 × 256, or 320 × 320, with two- or four-section interleaved acquisitions. Additional multiplanar images of the fetal body with use of steady-state free precession sequences and HASTE were also acquired; these were used to verify that there were no fetal abnormalities but were not directly used in data processing.
Image Processing
We used a section-to-volume reconstruction algorithm introduced by Kainz et al (1) to process the two-dimensional HASTE acquisitions and to generate an intensity-normalized superresolution three-dimensional volume with an isotropic resolution of 1 mm3. The three-dimensional reconstructed volumes were subsequently registered with a six–degree of freedom rigid transformation to the Computational Radiology Laboratory fetal brain MRI atlas (2) to bring them into the standard atlas orientation and coordinates. The images then underwent automated atlas-based segmentation using the previously validated procedure and the spatiotemporal fetal brain atlas described in reference 2. The Computational Radiology Laboratory spatiotemporal fetal brain MRI atlas involves 28 manually defined labels of fetal brain structures across gestation (2). The atlas-based segmentation process involves diffeomorphic deformable registration between each query image and the atlas images followed by label propagation and probabilistic label fusion (9). Subsequently, the atlas-generated labels were manually refined (by J.G. and F.M.R, with 3 years and 2 years of experience, respectively) using ITK-SNAP (version 3.8.0) (10). Review for quality and accuracy of label propagation was performed by a board-certified pediatric neuroradiologist (C.J., with 5 years of experience in fetal imaging).
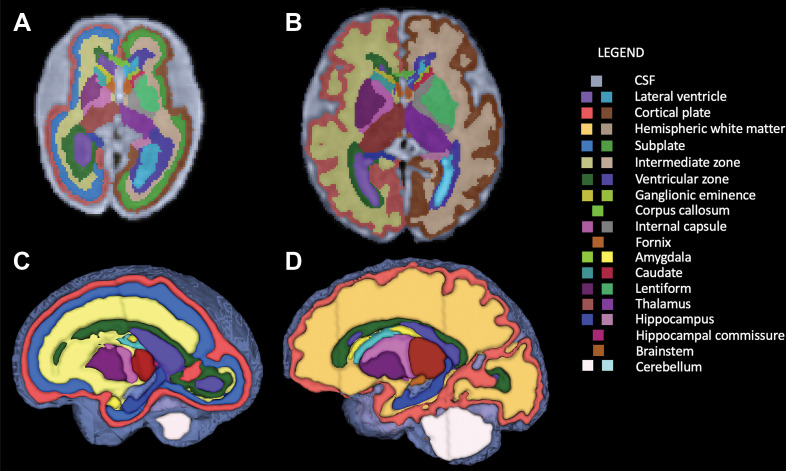
For all fetuses, the automated segmentation algorithm defined 28 regions of interest, summarized in Table 1. Additionally, for individuals younger than 31 weeks of GA, the subplate and the intermediate zones, also known as transient fetal white matter zones, were delineated. Figure 1 shows segmentations for fetuses of 31 weeks of GA or older and those younger than 31 weeks of GA (including white matter fetal transient zones).
Table 1:
Fetal Segmentations according to Anatomic Structure
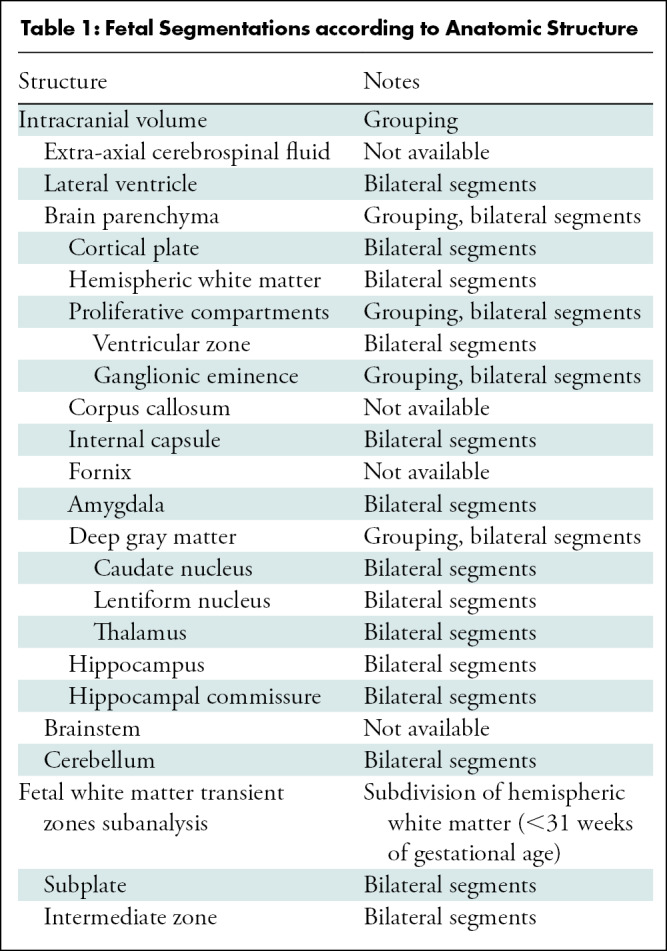
Figure 1:
Segmentation of fetal brain structures. Twenty-eight individual structures were segmented and refined for all fetuses, and for fetuses less than 31 weeks of gestational age, the fetal white matter transient zones were additionally segmented. Image shows two-dimensional axial fetal segmentations for (A) a 25-week-old fetus and (B) a 36-week-old fetus, as well as (C, D) the three-dimensional volumetric segmentations (C corresponds with A, and D with B). A color bar is shown with labels for all structures.
Statistical Analysis
For each fetus, we recorded region-of-interest volume, GA, sex, and scan number. For structures with double representation (left and right), a nested mixed effects regression with random intercept to account for repeated measurements (scan number nested within individual) was used to analyze GA, sex, and laterality as predictors of volume for each structure. For midline structures, a mixed effects regression with random intercept to account for repeated measurements (scan number) was used to analyze GA and sex as predictors of volume for each structure. We implemented a logarithmic conversion of the dependent variable (volume), the GA variable was centered at 31 weeks (26 weeks for the white matter transient zone analysis), and interactions between GA and sex and GA and laterality were evaluated. Subsequently, the coefficients and 95% CIs were converted to express percentage change by using [exp(coefficient) – 1] × 100. All calculations were performed using StataIC (version 16.1, StataCorp) with an α level of significance of .05; Bonferroni correction was performed for multiple comparisons.
Results
Study Sample Characteristics
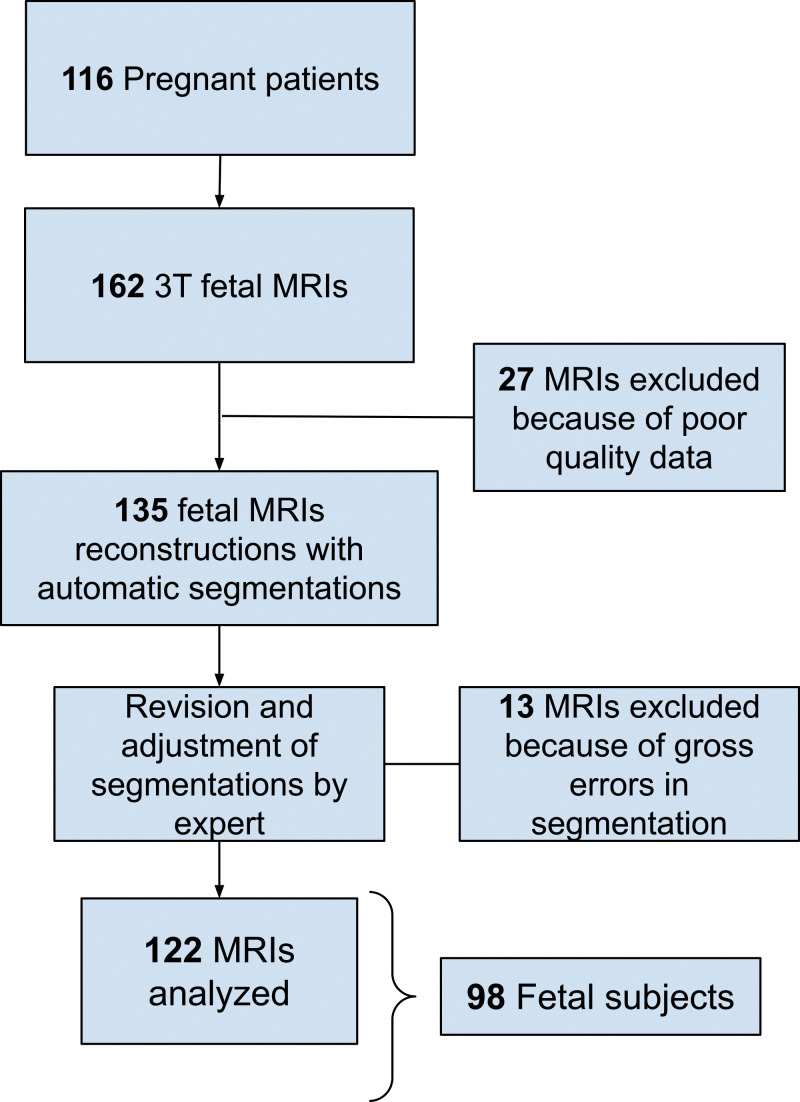
Of 162 fetal MRI examinations contributed by pregnant volunteers, 27 were excluded due to excessive motion that resulted in low-quality data and 13 for gross errors in segmentation. The final study sample consisted of 122 fetal MRI examinations in 98 fetuses (mean GA ± standard deviation, 29 weeks ± 5 [range, 20–38 weeks]; 58 female fetuses) from 116 pregnant volunteers (mean age ± standard deviation, 32 years ± 4). Characteristics of all pregnant volunteers and the analyzed fetal cohort are summarized in Table 2. A flowchart with inclusion and exclusion criteria is presented in Figure 2.
Table 2:
Study Sample Characteristics
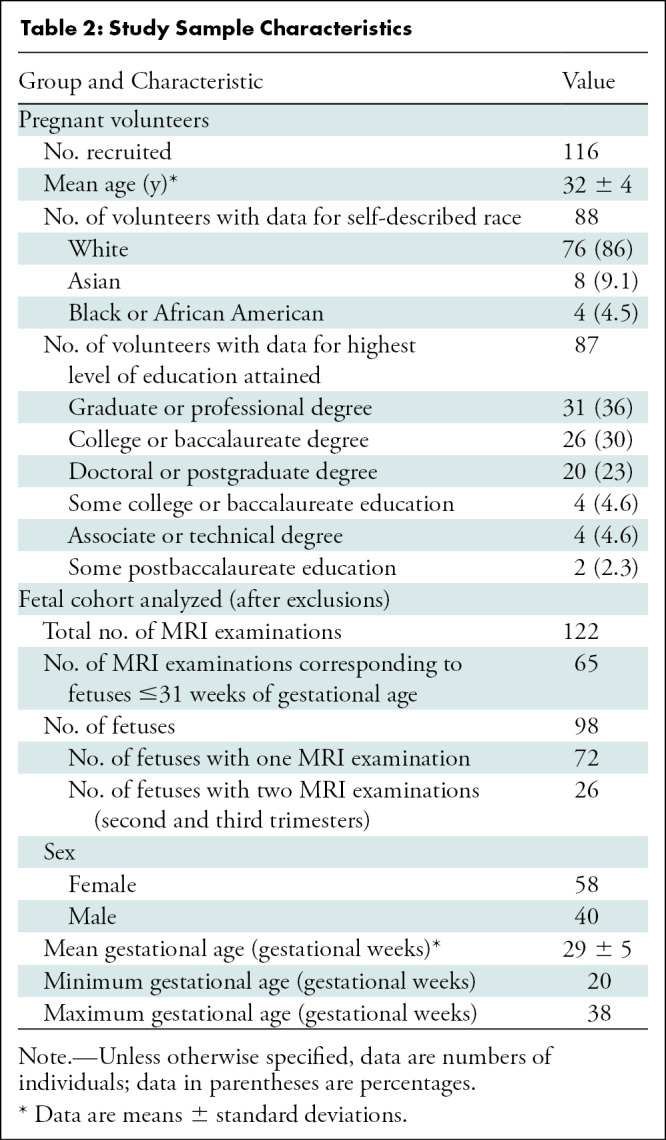
Figure 2:
Flowchart of our study sample shows inclusion and exclusion. There was a total of 116 pregnant patients who were imaged, resulting in 162 fetal MRI examinations. Twenty-seven MRI examinations were excluded because of poor-quality data, resulting in 135 MRI examinations that were reconstructed and segmented. Then, 13 MRI examinations were excluded because of gross errors in segmentation, resulting in 122 MRI examinations analyzed (corresponding to 98 fetuses).
Volumetric Analysis and Age-related Change
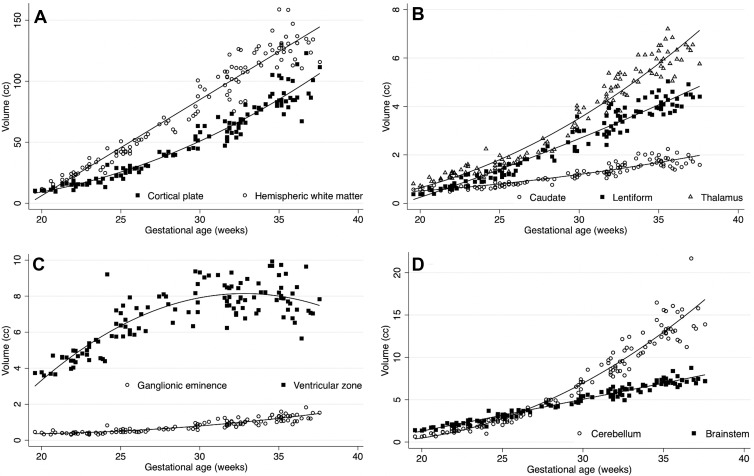
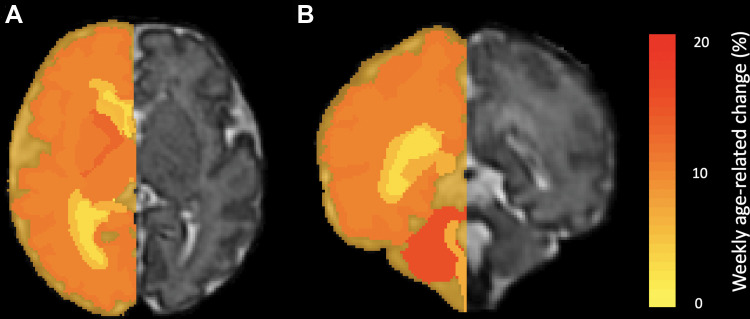
All evaluated structures had significant volume growth with increasing GA (Fig 3). The age-related change per week for intracranial volume was 11.7% (95% CI: 11.1, 12.2; P < .001); for brain parenchyma, 12.9% (95% CI: 12.4, 13.4; P < .001); for extra-axial CSF, 9.6% (95% CI: 8.9, 10.3; P < .001); and for lateral ventricles, 5.5% (95% CI: 4.8, 6.1; P < .001). For individual labels in the brain parenchyma, age-related change varied for each structure, ranging from 2% (95% CI: 0.9, 3.1; P < .001) in the hippocampal commissure to 19.4% (95% CI: 18.7, 20.1; P < .001) in the cerebellum (Table 3). Figure 4 shows label-specific age-related change. Table E1 (online) details the unadjusted volumetric analysis for each individual label.
Figure 3:
Plots show volumetric age-related change. Age-related change had high variability between the structures evaluated. (A) Cortical plate and hemispheric white matter; (B) the deep gray matter structures: caudate nucleus, lentiform nucleus, and thalamus; (C) the proliferative compartments: ganglionic eminence and ventricular zone; and (D) the cerebellum and brainstem.
Table 3:
Mean Volume Increase Per Gestational Week
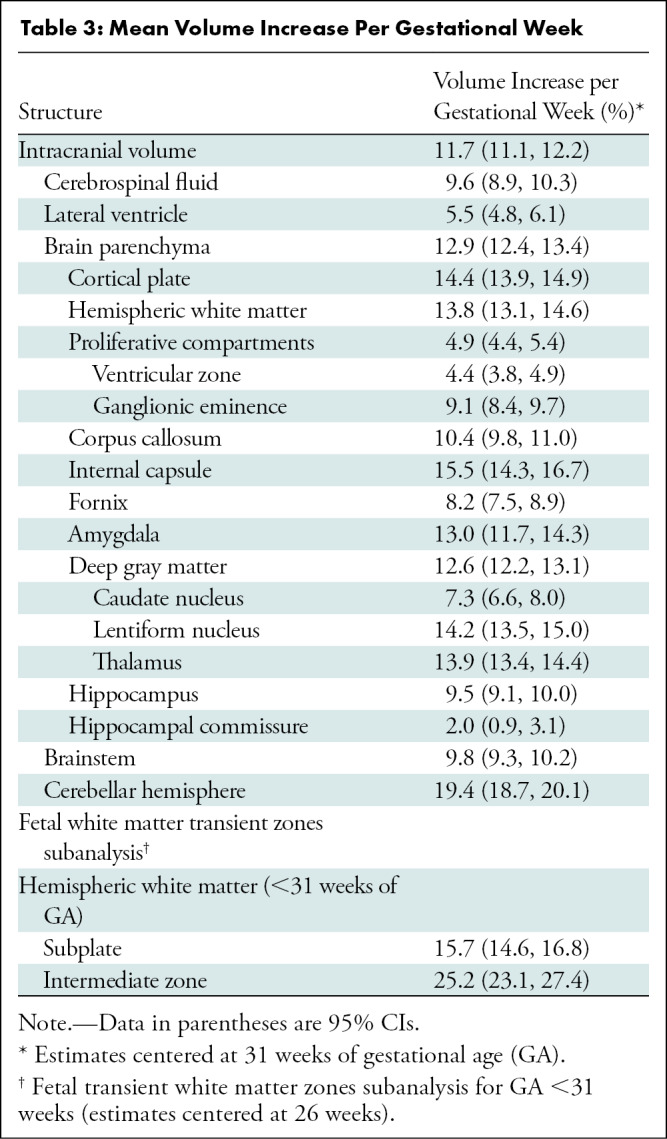
Figure 4:
Heat maps show volumetric age-related change. Weekly age-related percentage change is overlaid in a 35-week-old male fetus. (A) Axial and (B) coronal heat maps show region-specific changes, which range from 2% (yellow) to 19% (red) for all evaluated structures.
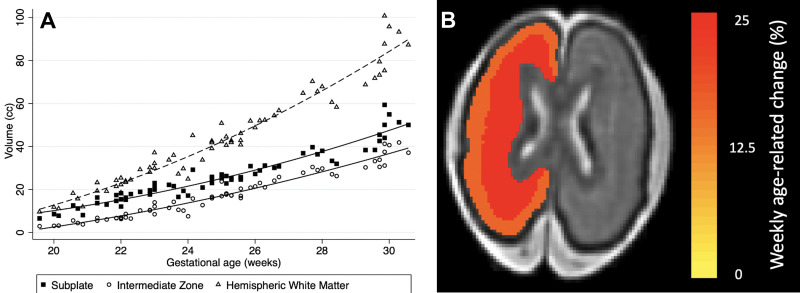
A subanalysis of the fetal hemispheric white matter transient zones for GA younger than 31 weeks showed rapid growth of the subplate and intermediate zone (Table 3, Fig 5). The rate of growth per week was 15.7% for the subplate (95% CI: 14.6, 16.8; P < .001) and 25.2% for the intermediate zone (95% CI: 23.1, 27.4; P < .001).
Figure 5:
Subanalysis of the fetal hemispheric white matter transient zones in fetuses younger than 31 weeks of gestational age. (A) Plot shows volumetric age-related change for the fetal white matter transient zones (subplate and intermediate zone). (B) Heat map depicts weekly age-related change of the subplate (25.2%) and the intermediate zone (15.7%) overlaid in a 25-week-old female fetus.
Sexual Dimorphism
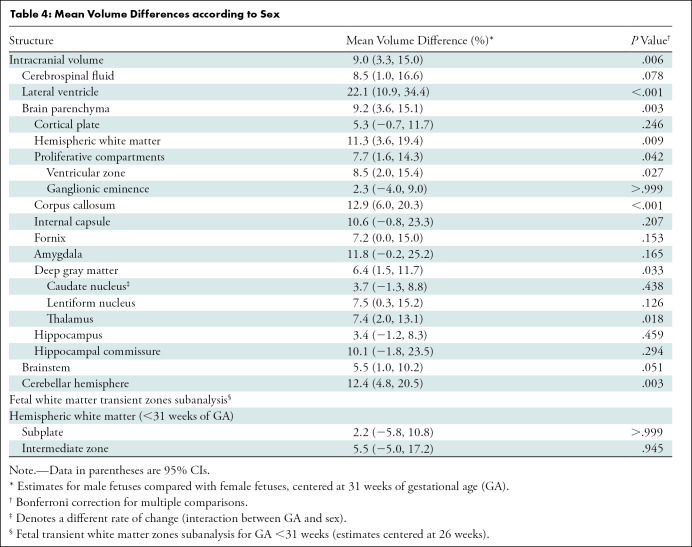
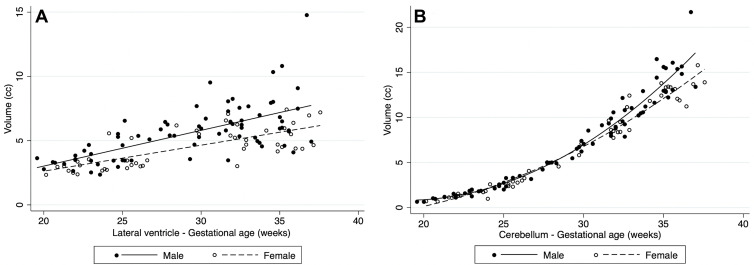
Table 4 summarizes mean volume differences by sex. On average, male fetuses had higher volumes in all structures where significant sexual dimorphism was found (intracranial volume, CSF, lateral ventricles, brain parenchyma, hemispheric white matter, proliferative compartment, ventricular zone, corpus callosum, deep gray matter, lentiform nucleus, thalamus, brainstem, and cerebellar hemisphere). The largest sex-related differences were 22.1% for the lateral ventricles (95% CI: 10.9, 34.4; P < .001), 12.9% for the corpus callosum (95% CI: 6.0, 20.3; P < .001), and 12.4% for the cerebellar hemispheres (95% CI: 4.8, 20.5; P = .003) (Fig 6). Table E2 (online) details the unadjusted volume according to sex.
Table 4:
Mean Volume Differences according to Sex
Figure 6:
Plots show volumetric differences by sex. In structures with sexual dimorphism, male fetuses had higher volumes on average: (A) shows rates for the lateral ventricles and (B) for the cerebellum.
When evaluating the effect of sex on the rate of volume change per gestational week (GA-sex interaction), we found a 1% higher slope in males for the caudate nucleus (95% CI: 0.2, 1.9; P = .021). No sex-related difference was observed in the volume of the subplate (2.2%; 95% CI: –5.8, 10.8; P > .999) or the intermediate zone (5.5%; 95% CI: –5, 17.2; P = .945).
Lateral Asymmetries
Table 5 summarizes mean volume differences by laterality (left and right) for structures with bilateral representation. Structures with rightward volumetric asymmetry included the hippocampus, with a mean difference of 15.6% (95% CI: 14.2, 17.2; P < .001) and the lentiform nucleus, with a mean difference of 3.3% (95% CI: 1.5, 5.1; P < .001). There was a leftward volumetric asymmetry (mean difference relative to the right hemisphere) of –8.1% for the lateral ventricles (95% CI: –12.2, –3.7; P < .001), –7.6% for the caudate nucleus (95% CI: –9.3, –5.9; P < .001), –4.4% for the internal capsule (95% CI: –6.5, –2.3; P < .001), and –1.7% for the cortical plate (95% CI: –2.9, –0.4; P = .030). Table E3 (online) details the unadjusted volume according to laterality.
Table 5:
Mean Volume Differences according to Structure Laterality
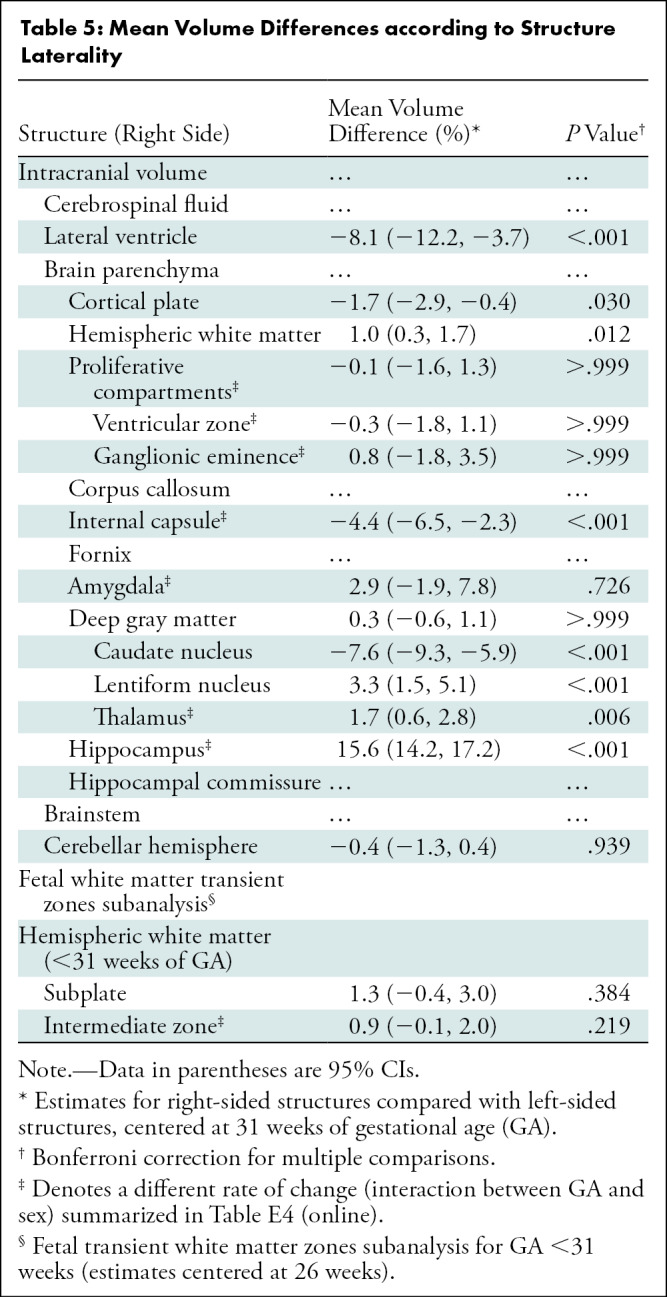
The effect of laterality on the rate of volume change is summarized in Table E4 (GA-laterality interaction) (online). The greatest change in slope favoring right-sided structures was seen in the amygdala, with a 3.1% higher slope (95% CI: 2.1, 4; P < .001). The greatest change in slope favoring left-sided structures was seen in the ventricular zone, with –0.6% (95% CI: –0.9, –0.4; P < .001) (relative to the right side).
The mean difference in laterality for the subplate (1.3%; 95% CI: –0.4, 3.0; P = .384) and intermediate zone (0.9%; 95% CI: –0.1, 2.0; P = .219) was not significant. However, the rate of change of volume for the intermediate zone was –0.6% (95% CI: –0.9, 0.3; P < .001) for the right side.
Discussion
Recent advances in image processing for fetal MRI have improved our ability to quantitatively study normal brain development in vivo (1,2). This study aimed to evaluate normal age-related change, sexual dimorphism, and lateral asymmetries in healthy fetuses with use of retrospective motion correction and automated segmentations derived from a detailed spatiotemporal MRI atlas of fetal brain development. Our results show that in the second half of pregnancy, age-related growth varies between structures, ranging from 2.0% per week (P < .001) in the hippocampal commissure to 19.4% per week (P < .001) in the cerebellar hemisphere. For structures where sexual dimorphism was found, male fetuses had a higher volume, ranging from a 6.4% mean difference in the deep gray matter (P = .033) to a 22.1% mean difference in the lateral ventricles (P < .001). The largest rightward asymmetry was found in the hippocampus, where there was a 15.6% mean difference (P < .001), and the largest leftward asymmetry was found in the lateral ventricles, where there was a 8.1% mean difference (P < .001).
Prior research in the field of fetal developmental neuroimaging relied on image processing pipelines that used fewer labels to segment the brain. Andescavage and colleagues (4) used a pipeline that parcellated the supratentorial brain into three labels, Scott and colleagues (7) used four labels, and Jarvis and colleagues (6) used a binary label system (parenchyma, CSF). Our study builds on previous knowledge by using an atlas with a rich set of anatomic labels, allowing for the analysis of multiple additional structures (2,11). The individualized segmentation of the components of the white matter (internal capsule, corpus callosum), proliferative compartments, amygdala, deep gray matter (caudate nucleus, lentiform nucleus, thalamus, and so on), hippocampus, lateral ventricles, and extra-axial CSF space provides normative data on the growth trajectories of these structures; many of these were previously grouped into tissue labels based on signal intensity similarities and proximity, despite important histologic differences (eg, deep gray nuclei and internal capsule) (4). For example, our study shows varying rates of growth between the various deep gray structures, the amygdala, hippocampus, and brainstem, which are not well captured on other segmentation pipelines. This level of detail is increasingly required in clinical fetal medicine for adequate diagnosis and prognostication of prenatal abnormalities.
Our analysis also demonstrated significant and widespread sexual dimorphism, with male fetuses having higher absolute volumes for most structures, confirming a prenatal origin of these differences. The observed 6.4% sex-related difference in overall brain volume approaches the 8.3% reported by Dean et al (12) in newborns at 1 month of postnatal age. Sex-related dimorphism in ventricular size was the largest difference documented, approaching 25%. This result is supported by extensive obstetric US data, which consistently report that the standard two-dimensional sonographic measurement of ventricular diameter at the level of the atria is 2–3 mm larger in male fetuses (13). This observation is critical, as fetal ventriculomegaly is frequently encountered at MRI, either as a primary reason for the referral or as a secondary finding associated with noncerebral abnormalities (14). The difference in ventricular volume between fetuses of different sexes suggests that this variable should be considered in the evaluation of ventriculomegaly.
Hemispheric asymmetries were observed for a variety of structures. The leftward asymmetry of the cortex and the left lateral ventricle are consistent with the observations reported by Andescavage et al (4) and Achiron et al (15), respectively. We also observed leftward asymmetry in the internal capsule and rightward asymmetries in the thalamus and hippocampus; although prior morphometric analyses of the fetal brain did not include these structures, the observations are consistent with neonatal data from Dean and colleagues (12). Our observations suggest that prenatal hemispheric asymmetries may be more widespread than previously believed, constituting the earliest evidence of functional specialization.
The use of 3.0-T imaging and superresolution reconstruction facilitate the reliable identification of the transient fetal white matter zones up to 31 weeks of GA; thereafter, the border between the subplate and the intermediate zone becomes indistinct, reflecting the histologic changes referred to as resolution of the subplate (16). As described by Vasung et al (17), at ex vivo imaging, the subplate undergoes rapid growth in the second trimester, with a peak near 30 weeks of GA. We observed a higher weekly rate of growth for the intermediate zone, which stems from the active radial neuronal migration taking place in the late second trimester. We did not find sex-related differences or lateral asymmetries in the volume of the subplate; this contrasts with Vasung et al, who found larger subplate zones in male fetuses in the limbic, occipital, and frontal lobes and in the left inferior frontal gyrus. It is likely that the differences reported by Vasung et al are localized to the segments mentioned earlier and are therefore below the threshold for detection with our global zonal segmentation.
This study has several limitations. First, our sample size is limited and carries a risk of type 2 error. However, our sample consists of a carefully curated cohort of typically developing fetuses, which makes these observations particularly valuable for the field. Second, atlas-based segmentations for small, narrow structures (eg, the corpus callosum) in younger fetuses (<27 weeks of GA) have been demonstrated to have lower accuracy. Such structures are susceptible to partial volumes because their size is comparable with that of the spatial resolution of in vivo fetal MRI at an early GA (2). Third, the demographic and socioeconomic composition of our sample does not mirror that of the general population. Our study had an overrepresentation of White participants when compared with the general population (18). Similarly, the highest level of education attained by our participants was considerably higher than that of the general population (all of our participants had some education above high school, while that is the case for only 63% of women in the United States) (19).
In conclusion, volumetric growth of the fetal brain follows a complex trajectory that is dependent on structure, gestational age, sex, and laterality. Longitudinal studies that have a larger sample size and greater racial diversity and that control for socioeconomic factors are necessary to fully describe normative fetal age-related change. However, recognition of the normal rate of fetal brain development presented in this study may aid prenatal diagnosis and counseling.
Supported in part by the National Institute of Biomedical Imaging and Bioengineering, the National Institute of Neurological Disorders and Stroke, and the National Institute of Dental and Craniofacial Research of the National Institutes of Health (NIH) under award numbers R01EB031849, R01NS106030, R01EB018988, R01EB013248, and R03DE022109; in part by the Office of the Director of the NIH under award number S10OD0250111; and in part by a Technological Innovations in Neuroscience Award from the McKnight Foundation. The content of this publication is solely the responsibility of the authors and does not necessarily represent the official views of the NIH, the McKnight Foundation, or the American Roentgen Ray Society.
C.J. was supported in part by the scholarship of the American Roentgen Ray Society and a career development award from the Office of Faculty Development at Boston Children’s Hospital.
Disclosures of conflicts of interest: F.M.R. No relevant relationships. J.G. No relevant relationships. J.J.C. No relevant relationships. C.V.A. No relevant relationships. O.A. Participation on the data safety monitoring board or advisory board of Boston Children’s Hospital and Harvard Medical School. S.K.W. No relevant relationships. A.G. No relevant relationships. C.J. No relevant relationships.
Abbreviations:
- CSF
- cerebrospinal fluid
- GA
- gestational age
- HASTE
- half-Fourier acquired single-shot turbo spin-echo
References
- 1. Kainz B , Steinberger M , Wein W , et al . Fast volume reconstruction from motion corrupted stacks of 2D slices . IEEE Trans Med Imaging 2015. ; 34 ( 9 ): 1901 – 1913 . [DOI] [PMC free article] [PubMed] [Google Scholar]
- 2. Gholipour A , Rollins CK , Velasco-Annis C , et al . A normative spatiotemporal MRI atlas of the fetal brain for automatic segmentation and analysis of early brain growth . Sci Rep 2017. ; 7 ( 1 ): 476 . [DOI] [PMC free article] [PubMed] [Google Scholar]
- 3. Kyriakopoulou V , Vatansever D , Davidson A , et al . Normative biometry of the fetal brain using magnetic resonance imaging . Brain Struct Funct 2017. ; 222 ( 5 ): 2295 – 2307 . [DOI] [PMC free article] [PubMed] [Google Scholar]
- 4. Andescavage NN , du Plessis A , McCarter R , et al . Complex trajectories of brain development in the healthy human fetus . Cereb Cortex 2017. ; 27 ( 11 ): 5274 – 5283 . [DOI] [PMC free article] [PubMed] [Google Scholar]
- 5. Clouchoux C , Guizard N , Evans AC , du Plessis AJ , Limperopoulos C . Normative fetal brain growth by quantitative in vivo magnetic resonance imaging . Am J Obstet Gynecol 2012. ; 206 ( 2 ): 173.e1 – 173.e8 . [DOI] [PubMed] [Google Scholar]
- 6. Jarvis DA , Finney CR , Griffiths PD . Normative volume measurements of the fetal intra-cranial compartments using 3D volume in utero MR imaging . Eur Radiol 2019. ; 29 ( 7 ): 3488 – 3495 . [DOI] [PMC free article] [PubMed] [Google Scholar]
- 7. Scott JA , Habas PA , Kim K , et al . Growth trajectories of the human fetal brain tissues estimated from 3D reconstructed in utero MRI . Int J Dev Neurosci 2011. ; 29 ( 5 ): 529 – 536 . [DOI] [PMC free article] [PubMed] [Google Scholar]
- 8. Gousias IS , Hammers A , Counsell SJ , et al . Magnetic resonance imaging of the newborn brain: automatic segmentation of brain images into 50 anatomical regions . PLoS One 2013. ; 8 ( 4 ): e59990 . [DOI] [PMC free article] [PubMed] [Google Scholar]
- 9. Akhondi-Asl A , Warfield SK . Simultaneous truth and performance level estimation through fusion of probabilistic segmentations . IEEE Trans Med Imaging 2013. ; 32 ( 10 ): 1840 – 1852 . [DOI] [PMC free article] [PubMed] [Google Scholar]
- 10. Yushkevich PA , Yang Gao , Gerig G . ITK-SNAP: an interactive tool for semi-automatic segmentation of multi-modality biomedical images . Annu Int Conf IEEE Eng Med Biol Soc 2016. ; 2016 ( 3342 ): 3345 . [DOI] [PMC free article] [PubMed] [Google Scholar]
- 11. Rollins CK , Ortinau CM , Stopp C , et al . Regional brain growth trajectories in fetuses with congenital heart disease . Ann Neurol 2021. ; 89 ( 1 ): 143 – 157 . [DOI] [PMC free article] [PubMed] [Google Scholar]
- 12. Dean DC 3rd , Planalp EM , Wooten W , et al . Mapping white matter microstructure in the one month human brain . Sci Rep 2017. ; 7 ( 1 ): 9759 . [DOI] [PMC free article] [PubMed] [Google Scholar]
- 13. Salomon LJ , Bernard JP , Ville Y . Reference ranges for fetal ventricular width: a non-normal approach . Ultrasound Obstet Gynecol 2007. ; 30 ( 1 ): 61 – 66 . [DOI] [PubMed] [Google Scholar]
- 14. Radhakrishnan R , Merhar SL , Su W , et al . Prenatal factors associated with postnatal brain injury in infants with congenital diaphragmatic hernia . AJNR Am J Neuroradiol 2018. ; 39 ( 3 ): 558 – 562 . [DOI] [PMC free article] [PubMed] [Google Scholar]
- 15. Achiron R , Yagel S , Rotstein Z , Inbar O , Mashiach S , Lipitz S . Cerebral lateral ventricular asymmetry: is this a normal ultrasonographic finding in the fetal brain? Obstet Gynecol 1997. ; 89 ( 2 ): 233 – 237 . [DOI] [PubMed] [Google Scholar]
- 16. Kostovic I , Rakic P . Developmental history of the transient subplate zone in the visual and somatosensory cortex of the macaque monkey and human brain . J Comp Neurol 1990. ; 297 ( 3 ): 441 – 470 . [DOI] [PubMed] [Google Scholar]
- 17. Vasung L , Lepage C , Radoš M , et al . Quantitative and qualitative analysis of transient fetal compartments during prenatal human brain development . Front Neuroanat 2016. ; 10 11 . [DOI] [PMC free article] [PubMed] [Google Scholar]
- 18. U.S. Census Bureau . U.S. Census Bureau QuickFacts: United States . https://www.census.gov/quickfacts/fact/table/US/RHI125219. Accessed January 31, 2021 .
- 19. U.S. Census Bureau . Educational Attainment in the United States: 2019. . The United States Census Bureau . https://www.census.gov/data/tables/2019/demo/educational-attainment/cps-detailed-tables.html. Accessed April 26, 2021 .


