Abstract
In recent years, copper-64 and copper-67 have been considered as a useful theranostic pair in nuclear medicine, due to their favourable and complementary decay properties. As 67Cu and 64Cu are chemically identical, development of both existing and new bifunctional chelators for 64Cu imaging agents can be readily adapted for the 67Cu-radionuclide. In this study, we explored the use of photoactivatable copper chelators based on the asymmetric bis(thiosemicarbazone) scaffold, H2ATSM/en, for the photoradiolabelling of protein. Photoactivatable 64CuATSM-derivatives were prepared by both direct synthesis and transmetallation from the corresponding natZn complex. Then, irradiation with UV light in the presence of a protein of interest in a pH buffered aqueous solution afforded the 64Cu-labelled protein conjugates in decay-corrected radiochemical yield of 86.9 ± 1.0% via the transmetallation method and 35.3 ± 1.7% from the direct radiolabelling method. This study successfully demonstrates the viability of photochemically induced conjugation methods for the development of copper-based radiotracers for potential applications in diagnostic positron emission tomography (PET) imaging and targeted radionuclide therapy.
In recent years, copper-64 and copper-67 have been considered as a useful theranostic pair in nuclear medicine. Here, we report a photochemically-mediated approach for radiolabelling biologically relevant protein with copper radionuclides.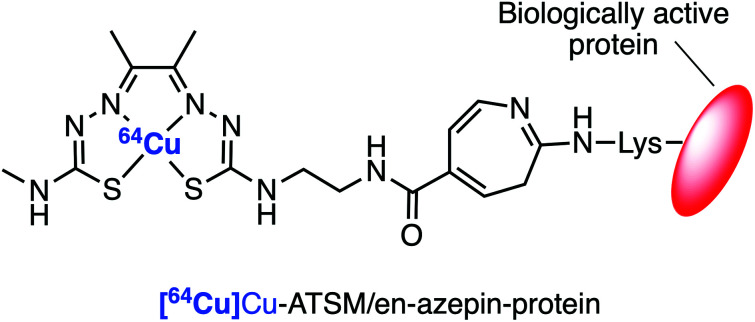
Introduction
Copper has at least 6 different radionuclides that hold potential for the development of diagnostic and radiotherapeutic tracers for applications in Nuclear Medicine (Fig. 1).1,2 The radionuclides 60Cu (half-life t1/2 = 23.7 min), 61Cu (t1/2 = 3.336 h), and 62Cu (t1/2 = 9.67 min) are short-lived positron-emitters. Aside from 61Cu, for which recent cyclotron-based production methods have proven efficient,3 limited access and the rapid decay times hinder radiotracer development with 60Cu and 62Cu. Copper-64 (t1/2 = 12.7 h) is the most well-known radionuclide of element 29 and undergoes branched decay whereby electron capture (ε; intensity I = 43.9%) or positron emission (β+; I = 17.6%) produce the stable daughter 64Ni, whereas beta decay (β−; I = 38.5%) releases 64Zn. Based on the branched decay and concomitant release of both imageable positrons and radiotherapeutic β− particles (and Auger electrons), 64Cu has been proposed to hold potential for applications in both diagnostic imaging and molecularly targeted radionuclide therapy.4 However, this concept is controversial because at the typical doses required during the administration of a β− radiotherapeutic compound, such as the somatostatin targeted radiotracer 177Lu-DOTATATE (3 to 5 cycles of 5.55–7.4 GBq over 6–12 weeks), an equivalent 64Cu radiotracer would present a much higher radiation burden to the patient due to the emission of 511 keV annihilation photons.5,6 An alternative approach is to take advantage of the fact that copper also has two β− emitting radionuclides: 66Cu (t1/2 = 9.67 min) and 67Cu (t1/2 = 61.83 h). Until recently, only a small number of reports have explored the use of 67Cu for developing radiotherapeutic agents.7–10 Low production yields, high costs, and limited availability of 67Cu are the principle reasons why this radionuclide has been underutilised but 67Cu is becoming increasingly available.11 Nevertheless, 67Cu was evaluated as therapeutic agent in the 1980s for the treatment of a variety of cancers including human B-cell lymphoma.12,13
Fig. 1. Copper (radio)nuclides with potential applications in diagnostic and radiotherapeutic nuclear medicine.
More recently, 64Cu/67Cu have been considered as an almost ideal theranostic pair.14,15 Given that 64Cu and 67Cu are chemically identical, the same bifunctional chelators can be used for radiolabelling with these radioisotopes. Therefore, the development of existing or novel PET imaging agents can be readily adapted for 67Cu-radionuclide therapy by exchanging the radionuclide. This theranostic approach is likely to be useful in a clinical setting, as physicians can easily use PET scans to pre-screen patients for targeted 67Cu therapy, and refine administered doses.
Prominent examples of the use of 64Cu/67Cu radiotracers include ‘sarcophagine’ caged chelators for peptide receptor 67Cu radiotherapy from the Donnelly group,16,17 and the synthesis of 67Cu-labelled pertuzumab for simultaneous immunotherapy and single photon emission computed tomography (SPECT) from the Sun group.15 Keinänen et al. also reported the sequential pre-targeted 64Cu PET imaging and 67Cu-radionuclide therapy in mouse models bearing subcutaneous tumours derived from the SW1222 human colon adenocarcinoma cell line.18
Expanding on our recent developments in the use of photochemically driven reactions to create functionalised bioconjugates,19–23 we decided to adapt our photoradiosynthesis methods for use with copper radionuclides. Radiotracers constructed from 64Cu- or 67Cu-radiolabelling of monoclonal antibodies (mAb) or related protein fragments could find potential applications for theranostic PET imaging and radioimmunotherapy. Our ultrafast, photochemical reactions can be controlled under physiologically relevant conditions to produce viable radiotracers with various nuclides including 68Ga, 89Zr and 111In, but experimentally, changing the nature of the radionuclide, the protein substrate, and also of the photoactivatable chelate leads to wide variations in the radiochemical yield of the labelled protein.
Pro-ligands derived from the bis(thiosemicarbazone) scaffold, such as H2ATSM, are known to be biologically active against a range of diseases, and also display high binding affinity for several metal cations, especially Zn2+ and Cu2+. Indeed, [64Cu]CuATSM has been studied for nearly three decades as a potential PET radiotracer for imaging tissue hypoxia in the context of stroke, myocardial infarction and certain cancers.24–34 The synthesis of bis(thiosemicarbazone) ligands is well-established and asymmetric structures such as H2ATSM/A35 and H2ATSM/en,36 which feature convenient reactive handles for bioconjugation, are readily accessible. Here, we describe the synthesis, characterisation, and 64Cu-radiochemistry of two photoactivatable derivatives of diacetyl-bis(thiosemicarbazone) H2ATSM. Light-induced reactions produced 64Cu-labelled protein conjugates using human serum albumin (HSA) as a model substrate. In addition, we explored the 64Cu-radiolabelling via the use of either direct radiolabelling of the pro-ligands or transmetallation from the corresponding Zn2+ complexes. These data suggest that Cu-radiochemistry combined with photochemical labelling of proteins is a viable route toward theranostic protein-based radiotracers.
Results and discussion
Synthesis of H2ATSM/en-ArN3 (7) and H2ATSM-PEG3-ArN3 (8)
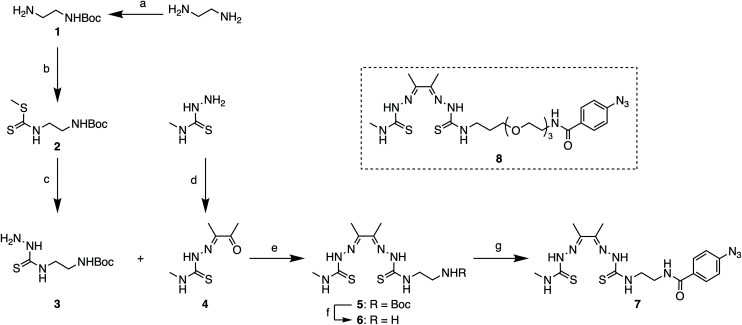
For the synthesis of the photoactivatable H2ATSM/en derivatives 7 and 8, a 7-step synthetic procedure was implemented that proceeds via the previously reported intermediate compound 6 (Scheme 1).36 Full experimental details and characterisation data (including UV/Vis, HPLC, HR-ESI-MS, and NMR spectroscopy) of both compounds 7 and 8 (and associated intermediates) are provided in the ESI (Fig. S1–S46†). Briefly for the synthesis of 7, treatment of the commercially available ethylenediamine (en) with di-tert-butyl dicarbonate (Boc2O; to give 1), followed by reaction with CS2 and MeI, and then treatment with hydrazine hydrate afforded the thiosemicarbazide derivative compound 3. Acid catalysed imine condensation of 4-methyl-3-thiosemicarbazide with a large excess of 2,3-butadione (diacetal) furnished the monoketothiosemicarbazone compound 4. Then, condensation of compounds 3 and 4, followed by TFA deprotection to remove the Boc group of compound 5 gave the asymmetrical bis(thiosemicarbazone), compound 6. The bifunctional bis(thiosemicarbazone) pro-ligand H2ATSM/en (compound 6; Scheme 1) presents a reactive primary amine handle for further conjugation, whilst maintaining the ability of the ligand core to form stable coordination complexes with Zn2+ and Cu2+ ions.36 The photochemically active pro-ligand H2ATSM/en-ArN3 was synthesised by reacting compound 6 with 4-azidobenzoic acid to give compound 7 in 35% overall yield. In parallel, we also synthesised another derivative, H2ATSM-PEG3-ArN3 (compound 8; Scheme 1 and ESI Scheme S1†) which incorporates a tris-polyethylene glycol (PEG3) spacer between the ATSM/en moiety and the ArN3 group to enhance water solubility of the pro-ligand.37
Scheme 1. Synthesis of H2ATSM/en-ArN3 (compound 7). Reagents and conditions: (a) Boc2O, CHCl3, 0 °C to rt, 5 h (89% yield); (b) CS2, Et3N, MeI, EtOH, rt, 4 h (91% yield); (c) H2NNH2·H2O, reflux, 3 h, EtOH (94% yield); (d) diacetyl, conc HCl(aq.), H2O, 0 °C to rt, 1 h (76% yield); (e) conc HCl(aq.), EtOH, reflux, 5 h (83% yield); (f) TFA, rt, 2 h (76% yield); (g) 4-azidobenzoic acid, BOP, DIPEA, DMF, rt, 12 h (56% yield). Note: Synthesis of H2ATSM-PEG3-ArN3 (compound 8) is shown in the ESI Scheme S1.†.
Direct Zn2+ and Cu2+ metallation of compounds 6, 7 and 8
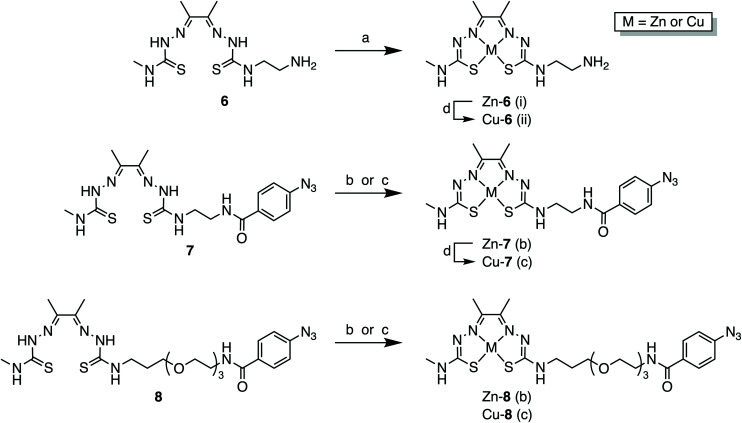
With the pro-ligands 7 and 8 in hand, we synthesised the corresponding Zn2+ and Cu2+ complexes (Scheme 2 and ESI Fig. S41–S46†). Both Zn-6 and Cu-6 formed readily upon treatment of 6 with the corresponding metal acetate M(OAc)2 (where M = Zn2+ or Cu2+) in either MeOH or DMF at room temperature (Scheme 2). Similarly, compounds 7 and 8 readily formed stable coordination complexes with Zn2+ and Cu2+ to give the corresponding M-ATSM/en-ArN3 and M-ATSM/en-PEG3-ArN3 (Scheme 2).
Scheme 2. Zn2+ and Cu2+ metallation of the bis(thiosemicarbazone), or ATSM, derivatives, compounds 6, 7 and 8. Reagents and conditions: (a) (i) Zn(OAc)2, MeOH, rt, 1 h (73% yield); (ii) Cu(OAc)2, MeOH, rt, 1 h (85% yield); (b) Zn(OAc)2, MeOH, reflux, 16 h (76% yield for Zn-7; 97% yield for Zn-8); (c) Cu(OAc)2, DMF, rt, 1 h (75% yield for Cu-7; 82% yield for Cu-8); (d) transmetallation from the corresponding Zn complex: Cu(OAc)2, 5% DMSO in H2O, or EtOH, rt, 1 h.
Transmetallation of ZnATSM/en-ArN3 (7) with Cu2+
In addition to the direct synthesis method, the copper complexes Cu-6, Cu-7, and Cu-8 can also be produced by transmetallation from the respective Zn2+ complexes (Scheme 2 and Fig. 2).35,38 Briefly, a solution of Zn-7 (9.05 × 10⁻⁵ M) in EtOH (1 mL) was treated with 0.1 mole equivalent aliquots of a Cu(OAc)2 (8.85 × 10⁻⁵ M) stock solution in EtOH, until a total of 2.0 mole equivalents of Cu2+ was added. Note, the transmetallation reaction also proceeds in water. After each addition, the sample was shaken for one minute before recording the electronic absorbance spectrum of the reaction mixture (Fig. 2A).
Fig. 2. Solution-phase synthesis of Cu-7 by the transmetallation method followed by UV/vis analysis. (A) Electronic absorption spectra showing the evolution of the spectrum during the titration of Zn-7 (blue curve) with increasing amounts of Cu2+ to afford Cu-7 (red curve); and (B) analysis of change in absorbance (λ = 476 nm; corresponding to the peak absorbance of Cu-7) versus Cu2+ equivalents added.
As the concentration of Cu2+ ions increased, the characteristic Zn absorbance peak at λ = 435 nm decreased. Simultaneously, the characteristic absorbance peak of the CuATSM motif which appears at λ = 476 nm increased, resulting in a clean isosbestic point in the visible region of the spectrum at λ = 465 nm. A plot of the change in absorbance at 476 nm versus the mole equivalents of Cu2+ ions added during the titration experiment showed a linear relationship up to 1 equivalent (Fig. 2B). No further change in absorbance was observed when adding between 1.0 and 2.0 equivalents of Cu(OAc)2, confirming that the transmetallation proceeds with a 1 : 1 stoichiometry between the Zn species and Cu2+ ions.
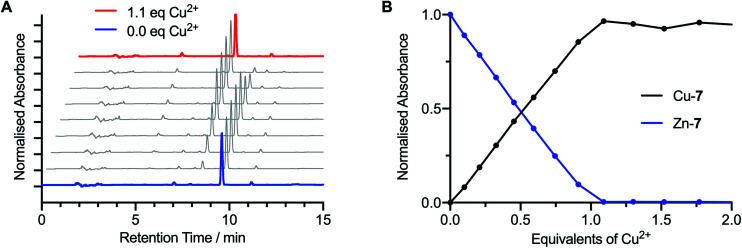
In addition to the measured electronic absorption spectra, the transmetallation titration of Zn-7 to Cu-7 was analysed by HPLC (Fig. 3). To a 1 mL solution of Zn-7 (9.57 × 10⁻⁵ M) in EtOH, was added successive 0.1 mole equivalent aliquots of a Cu(OAc)2 (9.96 × 10⁻⁵ M) stock solution in EtOH until a total of 2.0 mole equivalents of Cu2+ was added. After each addition, the sample was shaken for one minute and a 40 μL aliquot was taken for HPLC analysis (Fig. 3A).
Fig. 3. Solution-phase synthesis of Cu-7 by the transmetallation method followed by HPLC analysis. (A) Normalised reverse-phase HPLC chromatograms measured following the successive addition of 0.1 mole equivalents of Cu2+ to Zn-7 (blue trace) to a total of 1.1 mole equivalents (red trace). Note: chromatograms are staggered for clarity. (B) A plot showing the sum of the normalised HPLC peak intensities associated with the Zn-7 and Cu-7 species measured during the titration of Zn-7 with increasing equivalents of Cu2+.
Analysis of the HPLC data obtained during the transmetallation experiment corroborated the conclusions from the electronic absorption measurements. Transmetallation proceeded linearly with 1 : 1 stoichiometry between the Zn2+ and Cu2+ species. A crossing point was observed at 0.5 equivalents of Cu2+ ions added, between the integrated summation of the peak intensities associated with the Zn-7 and Cu-7 species (Fig. 3B), and no further change in the chromatogram was observed after the addition of 1.0 equivalents of Cu(OAc)2. Crystal field stabilisation effects which are present in the d9 pseudo-square planar Cu2+ complexes of bis(thiosemicarbazonato) ligands, but absent in the corresponding d10 Zn2+ complexes, provide the thermodynamic driving for quantitative synthesis of the Cu2+ complexes by transmetallation. These data confirm that transmetallation from the corresponding Zn-complex is a fast and reliable method for the synthesis of Cu-bis(thiosemicarbazonato) complexes in solution phase.
Photochemical activation
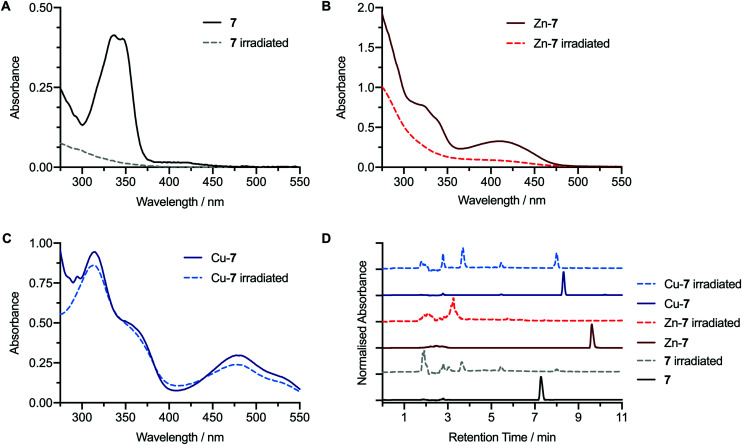
Prior to performing photochemical reactions in the presence of protein, the photochemical activation of the pro-ligands 7 and 8, as well as the corresponding Zn2+ and Cu2+ complexes under irradiation with 365 nm light from a powerful light-emitting diode (LED) were assessed (Fig. 4, and ESI Fig. S47–S51†). Photochemical activation of aryl azide groups leads to the spontaneous dissociation of dinitrogen and the formation of a transient open-shell singlet nitrene species. Intramolecular rearrangement of the singlet nitrene is fast and produces a 7-membered heterocyclic ketenimine electrophile. The ketenimine reacts readily with amine-based nucleophiles to form a 2-aminoazepin. Alternatively, in the presence of water, slow quenching to form a 2-hydroxyazepin can occur. For the pro-ligand 7 and the Zn-7 complex, irradiation of the ethanolic solution induced degradation of the compounds where the change in the experimental electronic absorption spectra indicated that chromophores associated with the bis(thiosemicarbazone) unit and the ZnATSM-/en core were lost completely. In the case of Zn-7, the intense bright yellow solution also changed to an almost colourless solution which was supported by the decrease in absorbance in the visible region of the UV/vis spectrum (Fig. 4B). In contrast, irradiation of the photoactivatable complex Cu-7 in EtOH showed only a minor change in the UV/vis spectra between the initial and irradiated samples (Fig. 4C). The electronic absorption spectrum of Cu-7 after irradiation showed all characteristic features (peaks and shoulders) of the CuATSM/en chromophore with only a small decrease in the peak intensity at 476 nm. These data indicate that irradiation only has a minor influence on the stability of the CuATSM/en core. The corresponding HPLC chromatograms of Cu-7 measured before and after irradiation (Fig. 4D) confirmed that the original complex had photoreacted. In the irradiated mixture, the sharp peak corresponding to the starting complex Cu-7 at ∼8.3 min was absent and at least three new peaks were observed at shorter retention times. The emergence of multiple new peaks at shorter retention times has been observed in our previous studies with Ga- and Zr-labelled complexes19,21 and is consistent with established photochemical activation mechanism of compounds bearing ArN3 groups.39
Fig. 4. Photochemical activation of compound 7 (black: before; and grey: after irradiation) and the corresponding metal ion complexes Zn-7 (dark red: before; and red: after irradiation) and Cu-7 (dark blue: before; and blue: after irradiation) in EtOH. Irradiation was performed at 365 nm for 15 min. Electronic absorption spectra before and after irradiation of (A) compound 7, (B) Zn-7, (C) Cu-7. (D) Stack plot showing the reverse-phase HPLC chromatograms (λ = 254 nm) for compounds 7, Zn-7, and Cu-7 measured before (solid lines) and after (dashed lines) irradiation.
Equivalent photochemical activation experiments were performed with compound 6 and the corresponding metal complexes Zn-6 and Cu-6 (ESI Fig. S47†). These control experiments confirmed that the pro-ligand 6 and Zn-6 undergo quantitative photodegradation whereas the CuATSM/en complex (Cu-6) remains fully intact under the irradiation conditions.
Interestingly, when we performed the same photochemical activation studies with compound 8 and Cu-8, which feature the PEG3 spacer, 8 degraded (as expected), but we also noted that the Cu-complex (Cu-8) showed evidence of photodegradation (ESI Fig. S48†). The characteristic CuATSM/en absorption bands in the electronic absorption spectrum were suppressed after irradiation and the chromatogram of the irradiated sample showed the presence of a very large number of species with low absorption intensities. It appears that the presence of the PEG3-chain facilitates alternative degradation pathways for the electronically excited state of CuATSM/en-PEG3-ArN3 (Cu-8) which are not accessible for CuATSM/en (Cu-6) or CuATSM/en-ArN3 (Cu-7).
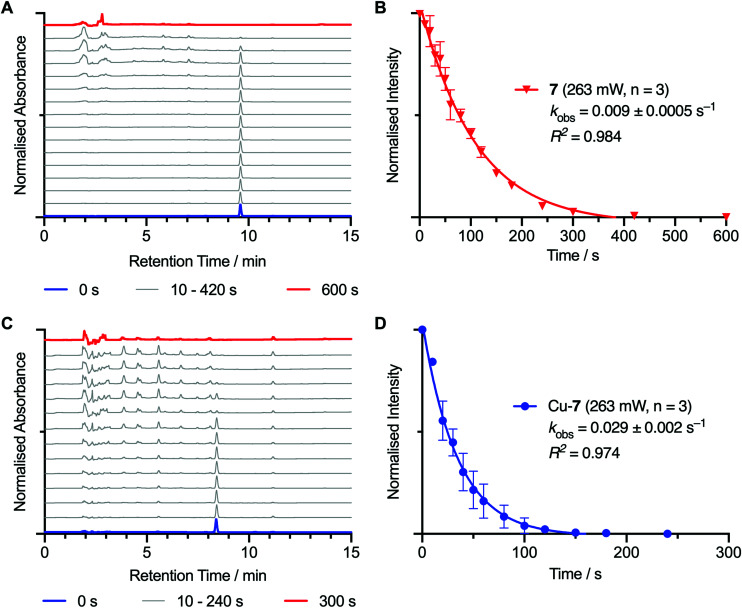
Photochemical activation kinetics were also measured for compounds 7 and Cu-7 in EtOH (Fig. 5 and Table 1), and in water and DMF solutions (ESI Fig. S49 and S50,† respectively), as well as for compound 8 and Cu-8 in EtOH (ESI Fig. S51†). During irradiation in EtOH, the peaks associated with the starting materials, 7 and Cu-7, decayed at slightly different rates with first-order kinetics yielding observed rate constants, kobs, of 0.009 ± 0.0005 s−1 (correlation coefficient, R2 = 0.984) and 0.029 ± 0.002 s−1 (R2 = 0.974), respectively. These data confirm that photon absorption is the rate determining step in the photodegradation which is consistent with previous observations.19,39 Indeed, these two compounds showed higher photo-reactivity than the previously reported photoactive derivatives of aza-macrocyclic,19,40 acyclic desferrioxamine B (DFO),20–22,41N,N′-bis[2-hydroxy-5-(carboxyethyl)benzyl] ethylenediamine-N,N′-diacetic acid (HBED-CC)42 and diethylenetriamine pentaacetate (DTPA)23 chelates bearing ArN3 groups. Interestingly, photochemical activation of Cu-7 in water was found to be ∼4.3 times faster than in EtOH, and ∼5.6 times faster than in DMF. Reasons for these changes in photochemical activation rates in the different solvents are not clear but are likely associated with a change in the solvation environment of the ArN3 unit which may influence the photon absorption efficiency.
Fig. 5. Photochemical activation kinetics measured by HPLC analysis during the photolysis of solutions of H2ATSM/en-ArN3 (7) and Cu-7 in EtOH at 365 nm for up to 600 seconds at room temperature. (A) Stack plots showing the change in the reverse-phase HPLC chromatograms of (A) 7, and (C) Cu-7versus irradiation time. The corresponding kinetic plots produced from integration and normalisation of the peak intensity associated with the starting materials are show for (B) 7, and (D) Cu-7. All data points are the mean (with error bars representing 1 standard deviation) derived from independent measurements that were performed in triplicate. Data were fitted with a mono-exponential function to derive the experimentally observed first-order rate constants, kobs/s−1, for photoinduced degradation.
Measured rate constants for photolysis of compound 7 and Cu-7 in different solvents (see also ESI Fig. S49–S51†).
| Measured rate constant, kobs/s−1 | Correlation coefficient, R2 | |||
|---|---|---|---|---|
| Solvent | 7 | Cu-7 | 7 | Cu-7 |
| H2O | 0.109 ± 0.009 | 0.124 ± 0.008 | 0.972 | 0.973 |
| EtOH | 0.009 ± 0.0005 | 0.029 ± 0.002 | 0.984 | 0.974 |
| DMF | 0.019 ± 0.0005 | 0.022 ± 0.005 | 0.998 | 0.925 |
For compound 8 and Cu-8, the photodegradation rate constants in EtOH gave kobs values of 0.329 ± 0.031 s−1 (R2 = 0.985) and 0.830 ± 0.054 s−1 (R2 = 0.981), respectively, which in both cases, showed much faster degradation than compound 7 and Cu-7. The faster rate of photodegradation for 8 and Cu-8 is consistent with the HPLC analysis which indicated that many more degradation products were observed, and suggests that additional degradation pathways exist for these electronically excited PEGylated species.
Radiosynthesis of [64Cu]CuATSM/en-ArN3, [64Cu]Cu-7
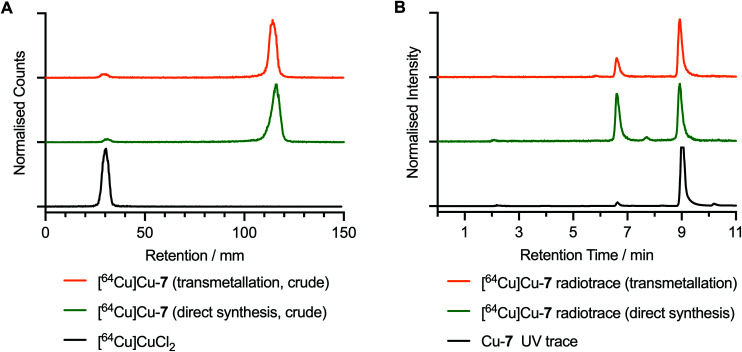
The radiosynthesis of [64Cu]CuATSM/en-ArN3, [64Cu]Cu-7, was performed at room temperature by addition of an aliquot of neutralised stock solution of [64Cu]CuCl2 (20 μL, 4.5 MBq) to a solution of either compound 7 or Zn-7 (10 μL, 2.76 μM, in 5% DMSO in water). Radiolabelling reactions were incubated for 5 min in the presence of sodium acetate buffer (90 μL, 0.25 M, pH 4.4). The characterisation of [64Cu]Cu-7 was performed by using radioactivity detection coupled with instant thin layer chromatography (radio-iTLC) and radio-HPLC analysis experiments (Fig. 6). The chemical identity and radiochemical purity (RCP) of [64Cu]Cu-7 was confirmed by comparison of the HPLC elution profiles to that of the corresponding non-radioactive species (Fig. 6B; black versus green and yellow traces). Notably, in the radiosynthesis of [64Cu]Cu-7via both transmetallation from Zn-7 and direct radiolabelling of 7, the major radioactive peak at ∼9.0 min was associated with the desired product (with radiochemical purities of 78.9% and 51.5%, respectively). Radiolabelled byproducts were also observed with peak retention times of 6.61 min and 7.80 min. The direct synthesis method gave a higher proportion of these impurities (42.5% and 5.9%), than synthesis of [64Cu]Cu-7 by transmetallation (24.1% and 3.0%). Complexes associated with these byproducts were found to be non-photoactive, and therefore, are likely to be either thermal degradation species produced during the radiosynthesis or labelled minor impurities present in the samples of 7 or Zn-7. The radiosynthesis of [64Cu]Cu-8 was also performed with details presented in ESI Fig. S52.†
Fig. 6. Radiochemical characterisation of [64Cu]Cu-7. (A) Radio-iTLC chromatograms developed in EtOAc of [64Cu]Cu-7 produced by transmetallation from Zn-7 (yellow trace) and direct synthesis from 7 (green trace), as well as the profile of [64Cu]CuCl2 as a control. (B) Radio-HPLC chromatograms of the reaction mixtures of [64Cu]Cu-7 produced by transmetallation (radiotrace = yellow trace) and by direct synthesis (radiotrace = green trace). The HPLC chromatogram of the authenticated sample of Cu-7 (254 nm; black trace) is also shown as a control.
Photochemical conjugation and 64Cu-radiolabelling of human serum albumin
Next, we evaluated the efficiency of [64Cu]Cu-7 and [64Cu]Cu-8 to form conjugate bonds to a model protein (human serum albumin, HSA) via a photo-induced labelling process.19 A one-pot, two-step radiolabelling and photochemical bioconjugation procedure was adopted whereby the first step involves in situ radiosynthesis of [64Cu]Cu-7 by either direct synthesis from the free ligand or transmetallation from the Zn complex (Scheme 3).
Scheme 3. One-pot photochemical bioconjugation and 64Cu-radiolabelling of human serum albumin with [64Cu]Cu-7 produced via (a) direct radiolabelling of 7 or (b) transmetallation from Zn-7. Reagents and conditions: [64Cu]Cu-7, HSA stock solution (30 μL, 75 mg mL−1), irradiation at 365 nm, 15 min, room temperature, pH 8.5, reaction total volume 150 μL.
Following the preparation of the photoactivatable compounds [64Cu]Cu-7 and [64Cu]Cu-8 the pH was adjusted to 8.2–8.5 by the addition of aliquots of 1.0 M Na2CO3(aq.). Then, an aliquot of HSA stock solution (30 μL; 75 mg mL−1) was added to the transparent glass vial to give a final reaction volume of 150 μL and an initial chelate-to-protein ratio of 1.05-to-1. Reaction mixtures were stirred gently and irradiated (365 nm) for 15 min at room temperature to ensure complete photoactivation. No temperature change was observed during the irradiation. Aliquots of the crude reaction mixtures were retained for analysis and fractions were purified by preparative size-exclusion gel filtration (PD-10) methods. Crude and purified samples of the radiolabelled protein mixtures were analysed by radio-iTLC, analytical size-exclusion chromatography (SEC) using PD-10 desalting columns (Sephadex G-25 medium), and automated HPLC coupled to a SEC gel-filtration column. Data obtained from the photoradiosynthesis of [64Cu]CuATSM/en-azepin-HSA via transmetallation from Zn-7 are presented in Fig. 7 while radio-iTLC and manual PD-10 chromatograms obtained from the direct synthesis route (starting from compound 7) are presented in ESI Fig. S53.†
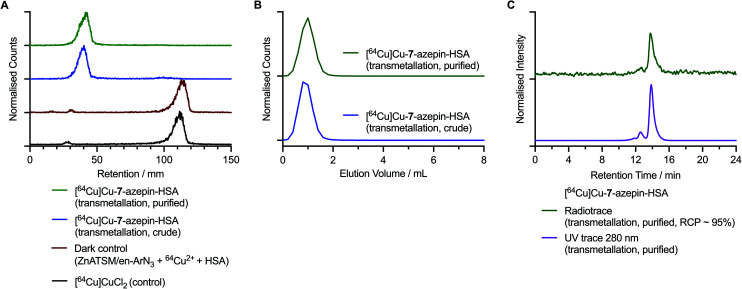
Fig. 7. Radiochemical characterisation data of the 64Cu-labelled protein conjugate [64Cu]CuATSM/en-azepin-HSA starting from [64Cu]Cu-7 that was produced via transmetallation. (A) Radio-iTLC chromatograms of the crude (blue trace) purified (green trace) samples of [64Cu]CuATSM/en-azepin-HSA. Chromatograms of [64Cu][Cu(DTPA)]3− (black trace) and the dark control reaction containing Zn-7, [64Cu]CuCl2 and HSA (dark red trace) confirm that the 64Cu-radiolabelling of HSA is specific to the photoinduced reactions. Note: radio-iTLC chromatograms were developed by using a DTPA eluent (50 mM, pH 7.4) where the [64Cu]CuCl2 complex forms the [64Cu][Cu(DTPA)]3− complex in situ. (B) Size-exclusions chromatograms obtained by manual radio-PD-10, analysis of the crude (blue trace) and purified (green trace) samples of [64Cu]CuATSM/en-azepin-HSA. (C) SEC-HPLC chromatograms showing the radioactive peak associated with [64Cu]CuATSM/en-azepin-HSA (green trace) and the chromatogram of the same measured by using electronic absorption at 280 nm. Corresponding data for the synthesis of [64Cu]CuATSM/en-PEG3-azepin-HSA starting from [64Cu]Cu-8 produced via the direct synthesis method is given in the ESI Fig. S53.†.
After the photoradiosynthesis, [64Cu]CuATSM/en-azepin-HSA was isolated by using manual size-exclusion separation (PD-10 columns) in a decay-corrected radiochemical yield (RCYs) of 86.9 ± 1.0% via the transmetallation method and 35.3 ± 1.7% from the direct radiolabelling method (n = 3 independent measurements for each reaction). By comparison, the photoradiosynthesis of [64Cu]CuATSM-PEG3-azepin-HSA was achieved in a decay-corrected RCY of 65.3 ± 12.2% via the direct radiolabelling method (n = 3 independent measurements, Fig. S53†). For each reaction the radiochemical purity (RCP) of the isolated products was >95% (determined by integration of the radioactive HPLC chromatograms of the purified products). Protein aggregation, which appears as a minor peak or shoulder to shorter retention time in the radio-HPLC chromatograms was <5%, and when compared to the analysis of the protein stock solutions, did not increase after the photoradiosynthesis. Like our previous photoconjugation studies bearing ArN3 functionalities,22,41 the addition of DMSO (<1% final volume) does not interfere with the photoactivation or protein-conjugation steps.
Importantly, we also performed ‘dark’ control reactions in which Zn-7 (or compound 7) was incubated with [64Cu]CuCl2 and HSA, and the reactions were stirred for 15 minutes without exposure to light. Separation of the protein fraction from the dark control reaction using transmetallation of Zn-7 gave a decay-corrected RCY of 10.2% for the labelled protein. For comparison, the decay-corrected RCY from dark control using direct labelling of 7 was 12.4%. We note that the activity obtained in these samples was not bound to the protein but was likely present due to imperfect separation of the small-molecule activity from the protein fraction when using the PD-10 desalting columns.43 In our experience, reaction mixtures that contain a large fraction of radioactive small-molecules are difficult to purify using PD-10 columns alone.43
Chromatographic analysis of [64Cu]CuATSM/en-azepin-HSA produced from transmetallation of Zn-7 revealed that in the radio-iTLC analysis developed by using a DTPA eluent, the labelled protein samples were retained at the baseline (retention factor, Rf = 0.0–0.1; Fig. 7A crude [blue trace] and purified samples [green trace]). Control chromatograms confirmed that ‘free’ 64Cu2+ ions, which are present in the radio-iTLC analysis as [64Cu][Cu(DTPA)]3− anions, elute to the solvent front (Rf = 0.9–1.0). Radio-iTLC analysis of the control reaction performed in the dark (containing Zn-7, [64Cu]CuCl2, and HSA, Fig. 7A red trace) revealed that in the absence of irradiation at 365 nm, any 64Cu2+ ions that may have bound non-specifically to the HSA protein were effectively complexed by the DTPA in the eluent and migrated to the solvent front. This dark control experiment confirms that the protein labelling observed in the crude and purified samples of [64Cu]CuATSM/en-azepin-HSA was produced via a light-induced reaction. Analytical PD-10 size-exclusion chromatograms of the crude (blue trace) and purified (green trace samples of [64Cu]CuATSM/en-azepin-HSA are shown in Fig. 7B. Data confirm that the activity elutes in the first 0.0–2.0 mL fraction which contains the high-molecular weight protein fraction (HSA molecular weight = 66.5 kDa). Analytical HPLC chromatograms of [64Cu]CuATSM/en-azepin-HSA confirm that the purified product contains 64Cu-labelled protein with a major peak observed (∼95%) at 14.0 min in the radiotrace (Fig. 7C, green trace). The radiochemical purity of the product was estimated to be >95% by integration of the radio-HPLC chromatograms. The radioactive peak co-eluted with the peak observed in the chromatogram measured by electronic absorption at 280 nm (Fig. 7C, purple trace; monitoring the protein at 280 nm). These data provide convincing evidence that photoradiosynthesis using [64Cu]Cu-7 can produce radiolabelled proteins in high radiochemical and chemical purity. Chromatographic data obtained by using radio-iTLC and PD-10 analysis of [64Cu]CuATSM/en-azepin-HSA produce via the direct synthesis route from 7 are given in ESI Fig. S53.† Equivalent data obtained from the synthesis of [64Cu]CuATSM/en-PEG3-azepin-HSA via [64Cu]Cu-8 which was produced from direct radiosynthesis are presented in ESI Fig. S54.†
Conclusions
The photoactive pro-ligands H2ATSM/en-ArN3 (7) and H2ATSM-PEG3-ArN3 (8) were synthesised, characterised, and evaluated for their efficiency to produce 64Cu-radiolabelled protein via light-induced photochemical bioconjugation. Incubation of 7 and 8 (or Zn-7 and Zn-8) with [64Cu]CuCl2 in sodium acetate buffer afforded the desired 64Cu-radiolabelled complexes by either direct synthesis or transmetallation. Photoradiosynthesis gave the desired 64Cu-radiolabelled HSA-proteins from the light-induced activation of the aryl azide group which results in the formation of a protein bioconjugate featuring a covalent azepin linker. Overall, the experimental data confirm that photoradiosynthesis methods can be expanded for use with copper radionuclides and bis(thiosemicarbazone) pro-ligands. These data suggest that in the future, theranostic radiotracers featuring 64Cu for PET imaging and 67Cu for radiotherapy can be accessed by using photochemistry.
Methods and materials
General
Unless otherwise stated, all chemicals were of reagent grade and were purchased from SigmaAldrich (St Louis, MO), Merck (Darmstadt, Germany), Tokyo Chemical Industry (Eschborn, Germany), abcr (Karlsruhe, Germany). Water (>18.2 MΩ cm at 25 °C, Puranity TU 3 UV/UF, VWR International, Leuven, Belgium) was used without further purification. Solvents for reactions were of reagent grade, and where necessary, were dried over molecular sieves. Evaporation of the solvents was performed under reduced pressure by using a rotary evaporator (Rotavapor R-300, Büchi Labortechnik AG, Flawil, Switzerland). 1H and 13C{1H} NMR spectra were measured in deuterated solvents on a Bruker AV-400 (1H: 400 MHz, 13C: 100.6 MHz) or a Bruker AV-500 (1H: 500 MHz, 13C: 125.8 MHz) spectrometer. Chemical shifts (δ) are expressed in parts per million (ppm) relative to the resonance of the residual solvent peaks. Coupling constants (J) are reported in Hz. Peak multiplicities are abbreviated as follows: s (singlet), d (doublet), dd (doublet of doublets), t (triplet), q (quartet), p (pentet), m (multiplet), and br s (broad singlet). High-resolution electrospray ionisation mass spectra (HR-ESI-MS) were measured by the mass spectrometry service at the Department of Chemistry, University of Zurich. Column chromatography was performed by using Merck silica gel 60 (63–200 μm) with eluents indicated in the Experimental section. Analytical high-performance liquid chromatography (HPLC) experiments were performed by using a Hitachi Chromaster Ultra Rs system fitted with a reverse-phase VP 250/4 Nucleodur C18 HTec (4 mm ID × 250 mm, 5 μm) column. Size-exclusion high-performance liquid chromatography (SEC-HPLC) experiments (for protein samples) were performed using a Rigol HPLC system (Contrec AG, Dietikon, Switzerland) equipped with an Enrich SEC 650 size-exclusion column (24 mL volume, 10 mm ID × 300 mm, Bio-Rad Laboratories, Basel, Switzerland). Electronic absorption was measured at 280 nm. Electronic absorption spectra were recorded using a Nanodrop™ OneC Microvolume UV-Vis Spectrophotometer (ThermoFisher Scientific, supplied by Witec AG, Sursee, Switzerland).
Photochemistry
Photochemical conjugation experiments were performed in transparent glass vials at the specified concentrations. Unless otherwise stated, photochemical reactions were typically stirred gently by adding a small magnetic stir bar to the reaction vial and employing a slow stirring rate (<1000 rpm) to avoid potential damage to the protein. Detailed procedures and reaction times are indicated in the Experimental section. Ultra-violet irradiations were performed by using portable, light-emitting diodes (LED; 365 and 395 nm). The LED intensity was adjusted using a digital UV-LED controller (Opsytec Dr Gröbel GmbH, Ettlingen, Germany), where 100% corresponded to a power of approximately 263 mW at 365 nm, and 355 mW at 395 nm. LED intensity was measured by using a S470C Thermal Power Sensor Head Volume Absorber, 0.25–10.6 μm, 0.1 mW–5 W, ∅ 15 mm. The LED (365 nm) had a maximum emission intensity at 364.5 nm (FWHM of 9.1 nm). The LED (395 nm) had a maximum emission intensity at 389.9 nm (FWHM of 9.1 nm). The temperature of all photochemical conjugation reactions was typically 23 ± 2 °C (ambient conditions).
Radioactivity and radioactive measurements
All instruments for measuring radioactivity were calibrated and maintained in accordance with previously reported routine quality control procedures.44 [64Cu][CuCl2] was obtained as a solution in ∼3.0 M HCl(aq.) (Strasbourg, France). Radioactive reactions were monitored by using instant thin-layer chromatography (radio-iTLC). Glass-fibre iTLC plates impregnated with silica-gel (iTLC-SG, Agilent Technologies) were developed by using either EtOAc or an aqueous mobile phase containing DTPA (50 mM, pH 7.4), and were analysed on a radio-TLC detector (SCAN-RAM, LabLogic Systems Ltd, Sheffield, United Kingdom). When using aqueous mobile phases containing DTPA (50 mM, pH 7.4), radiochemical conversion (RCC) was determined by integrating the data obtained by the radio-TLC plate reader and determining both the percentage of radiolabelled product (Rf = 0.0) and ‘free’ 64Cu (Rf = 1.0; present in the analyses as [64Cu][Cu(DTPA)]3−). When using EtOAc, RCC was determined by integrating the data obtained by the radio-TLC plate reader and determining both the percentage of radiolabelled product (Rf = 0.75–0.85) and ‘free’ 64Cu2+ (Rf = 0.0). Integration and data analysis were performed by using Laura software (version 5.0.4.29; LabLogic). Appropriate background and decay corrections were applied as necessary. Radiochemical purities (RCPs) of labelled protein samples were determined by size-exclusion chromatography (SEC) using two different columns and techniques. First, a manual procedure involving size-exclusion column chromatography and a PD-10 desalting column (Sephadex G-25 resin, 85–260 μm, 14.5 mm ID × 50 mm, >30 kDa, GE Healthcare). For analytical procedures, PD-10 columns were eluted with PBS. A total of 40 × 200 μL fractions were collected up to a final elution volume of 8 mL. Note that the loading/dead-volume of the PD-10 columns is precisely 2.50 mL which was discarded prior to aliquot collection. For quantification of radioactivity, each fraction was measured on a gamma counter (Hidex Automatic Gamma Counter, Hidex AMG, Turku, Finland) using an energy window between 480–558 keV for 64Cu (511 keV emission) and a counting time of 30 s. Appropriate background and decay corrections were applied throughout. PD-10 SEC columns were also used for preparative purification and reformulation of radiolabelled products (in sterile PBS; pH 7.4) by collecting a fraction of the eluate corresponding to the high molecular weight protein (>30 kDa fraction eluted in the range 0.0 mL to 1.6 mL as indicated for each experiment). Second, an automated size-exclusion column (Bio-Rad Laboratories, ENrich SEC 70, 10 ± 2 μm, 10 mm ID × 300 mm) connected to a Rigol HPLC system (Contrec AG, Dietikon, Switzerland) equipped with a UV/visible detector (absorption measured at 220, 254 and 280 nm) as well as a radioactivity detector (FlowStar2 LB 514, Berthold Technologies, Zug, Switzerland). Isocratic elution with phosphate buffered saline (PBS, pH 7.4) was used.
64Cu-radioactive stocks
As an example, a stock solution of [64Cu][CuCl2] was prepared by aliquoting (200 μL; in ∼1.0 M HCl(aq.)) of radioactivity from the transport vial (37.13 MBq) to an Eppendorf tube. The solution was neutralised by the addition of 1.0 M Na2CO3 (aq.) (200 μL) to achieve a final pH of 7.0–7.5. Caution: neutralisation with Na2CO3 solution releases CO2, care should be taken to avoid any spillages.
Author contributions
J. E. F. and D. F. E. synthesised and characterised the ligands and intermediates. J. E. F., D. F. E. and A. G. performed the radiochemistry, characterisation, and analysis of the 64Cu-radiolabelled protein conjugates. J. P. H. supervised the project. D. F. E., J. E. F. and J. P. H. prepared the manuscript. All authors have read and agreed to the published version of the manuscript.
Conflicts of interest
The authors declare no conflicts of interest.
Supplementary Material
Acknowledgments
This research was funded by Swiss National Science Foundation (SNSF Professorships PP00P2_163683 and PP00P2_190093), and the University of Zurich (UZH). This project also received funding from the European Union's Horizon 2020 research and innovation programme/from the European Research Council (grant Agreement numbers 676904, ERC-StG-2015, NanoSCAN; 101001734, ERC-CoG-2020, PhotoPHARMA).
Electronic supplementary information (ESI) available. See DOI: 10.1039/d2dt00209d
References
- Holland J. P. Williamson M. J. Lewis J. S. Mol. Imaging. 2010;9:1–20. doi: 10.2310/7290.2010.00008. [DOI] [PMC free article] [PubMed] [Google Scholar]
- Blower P. J. Dalton Trans. 2015;44:4819–4844. doi: 10.1039/C4DT02846E. [DOI] [PMC free article] [PubMed] [Google Scholar]
- do Carmo S. J. C. Alves V. H. P. Alves F. Abrunhosa A. J. Dalton Trans. 2017;46:14556–14560. doi: 10.1039/C7DT01836C. [DOI] [PubMed] [Google Scholar]
- Bolzati C. Duatti A. Q. J. Nucl. Med. Mol. Imaging. 2020;64:329–337. doi: 10.23736/S1824-4785.20.03292-6. [DOI] [PubMed] [Google Scholar]
- Zaknun J. J. Bodei L. Mueller-Brand J. Pavel M. E. Baum R. P. Hörsch D. O'Dorisio M. S. O'Dorisiol T. M. Howe J. R. Cremonesi M. Kwekkeboom D. J. Eur. J. Nucl. Med. Mol. Imaging. 2013;40:800–816. doi: 10.1007/s00259-012-2330-6. [DOI] [PMC free article] [PubMed] [Google Scholar]
- Kim K. Kim S.-J. Nucl. Med. Mol. Imaging. 2018;52:208–215. doi: 10.1007/s13139-017-0505-6. [DOI] [PMC free article] [PubMed] [Google Scholar]
- Smith-Jones P. M. Fridrich R. Kaden T. A. Novak-Hofer I. Siebold K. Tschudin D. Maecke H. R. Bioconjugate Chem. 1991;2:415–421. doi: 10.1021/bc00012a006. [DOI] [PubMed] [Google Scholar]
- Connett J. M. Anderson C. J. Guo L. W. Schwarz S. W. Zinn K. R. Rogers B. E. Siegel B. A. Philpott G. W. Welch M. J. Proc. Natl. Acad. Sci. U. S. A. 1996;93:6814–6818. doi: 10.1073/pnas.93.13.6814. [DOI] [PMC free article] [PubMed] [Google Scholar]
- Bischof Delaloye A. Delaloye B. Buchegger F. Gillet M. Mach J.-P. Smith A. Schubiger P. A. J. Nucl. Med. 1997;38:847–853. [PubMed] [Google Scholar]
- Hughes O. D. M. Bishop M. C. Perkins A. C. Frier M. Price M. R. Denton G. Smith A. Rutherford R. Schubiger P. A. Eur. J. Nucl. Med. Mol. Imaging. 1997;24:439–443. doi: 10.1007/s002590050075. [DOI] [PubMed] [Google Scholar]
- Nigron E. Guertin A. Haddad F. Sounalet T. Front. Med. 2021;8:674617. doi: 10.3389/fmed.2021.674617. [DOI] [PMC free article] [PubMed] [Google Scholar]
- Deshpande S. V. DeNardo S. J. Meares C. F. McCall M. J. Adams G. P. Moi M. K. DeNardo G. L. J. Nucl. Med. 1988;29:217–225. [PubMed] [Google Scholar]
- DeNardo G. DeNardo S. Kukis D. Diril H. Suey C. Meares C. Int. J. Radiat. Appl. Instrum., Part B. 1991;18:633–640. doi: 10.1016/0883-2897(91)90033-H. [DOI] [PubMed] [Google Scholar]
- Hao G. Singh A. N. Liu W. Sun X. Curr. Top. Med. Chem. 2010;10:1096–1112. doi: 10.2174/156802610791384289. [DOI] [PubMed] [Google Scholar]
- Hao G. Mastren T. Silvers W. Hassan G. Öz O. K. Sun X. Sci. Rep. 2021;11:3622. doi: 10.1038/s41598-021-82812-1. [DOI] [PMC free article] [PubMed] [Google Scholar]
- Cullinane C. Jeffery C. M. Roselt P. D. van Dam E. M. Jackson S. Kuan K. Jackson P. Binns D. van Zuylekom J. Harris M. J. Hicks R. J. Donnelly P. S. J. Nucl. Med. 2020;61:1800–1805. doi: 10.2967/jnumed.120.243543. [DOI] [PubMed] [Google Scholar]
- Kelly J. M. Ponnala S. Amor-Coarasa A. Zia N. A. Nikolopoulou A. Williams C. Schlyer D. J. DiMagno S. G. Donnelly P. S. Babich J. W. Mol. Pharm. 2020;17:1954–1962. doi: 10.1021/acs.molpharmaceut.0c00060. [DOI] [PubMed] [Google Scholar]
- Keinänen O. Fung K. Brennan J. M. Zia N. Harris M. van Dam E. Biggin C. Hedt A. Stoner J. Donnelly P. S. Lewis J. S. Zeglis B. M. Proc. Natl. Acad. Sci. U. S. A. 2020;117:28316–28327. doi: 10.1073/pnas.2009960117. [DOI] [PMC free article] [PubMed] [Google Scholar]
- Patra M. Eichenberger L. S. Fischer G. Holland J. P. Angew. Chem., Int. Ed. 2019;58:1928–1933. doi: 10.1002/anie.201813287. [DOI] [PubMed] [Google Scholar]
- Patra M. Klingler S. Eichenberger L. S. Holland J. iScience. 2019;13:416–431. doi: 10.1016/j.isci.2019.03.004. [DOI] [PMC free article] [PubMed] [Google Scholar]
- Klingler S. Fay R. Holland J. P. J. Nucl. Med. 2020;61:1072–1078. doi: 10.2967/jnumed.119.237180. [DOI] [PMC free article] [PubMed] [Google Scholar]
- Guillou A. Earley D. F. Patra M. Holland J. P. Nat. Protoc. 2020;15:3579–3594. doi: 10.1038/s41596-020-0386-5. [DOI] [PubMed] [Google Scholar]
- Gut M. Holland J. P. Inorg. Chem. 2019;58:12302–12310. doi: 10.1021/acs.inorgchem.9b01802. [DOI] [PubMed] [Google Scholar]
- Holland J. P. Barnard P. J. Collison D. Dilworth J. R. Edge R. Green J. C. McInnes E. J. L. Chem. – Eur. J. 2008;14:5890–5907. doi: 10.1002/chem.200800539. [DOI] [PubMed] [Google Scholar]
- Fujibayashi Y. Taniuchi H. Yonekura Y. Ohtani H. Konishi J. Yokoyama A. J. Nucl. Med. 1997;38:1155–1160. [PubMed] [Google Scholar]
- Vāvere A. L. Lewis J. S. Dalton Trans. 2007:4893. doi: 10.1039/B705989B. [DOI] [PubMed] [Google Scholar]
- Dehdashti F. Mintun M. A. Lewis J. S. Bradley J. Govindan R. Laforest R. Welch M. J. Siegel B. A. Eur. J. Nucl. Med. Mol. Imaging. 2003;30:844–850. doi: 10.1007/s00259-003-1130-4. [DOI] [PubMed] [Google Scholar]
- O'Donoghue J. A. Zanzonico P. Pugachev A. Wen B. Smith-Jones P. Cai S. Burnazi E. Finn R. D. Burgman P. Ruan S. Lewis J. S. Welch M. J. Ling C. C. Humm J. L. Int. J. Radiat. Oncol., Biol., Phys. 2005;61:1493–1502. doi: 10.1016/j.ijrobp.2004.12.057. [DOI] [PubMed] [Google Scholar]
- Obata A. Kasamatsu S. Lewis J. S. Furukawa T. Takamatsu S. Toyohara J. Asai T. Welch M. J. Adams S. G. Saji H. Yonekura Y. Fujibayashi Y. Nucl. Med. Biol. 2005;32:21–28. doi: 10.1016/j.nucmedbio.2004.08.012. [DOI] [PubMed] [Google Scholar]
- Dearling J. L. Lewis J. S. Mullen G. E. Welch M. J. Blower P. J. J. Biol. Inorg. Chem. 2002;7:249–259. doi: 10.1007/s007750100291. [DOI] [PubMed] [Google Scholar]
- Bowen S. R. van der Kogel A. J. Nordsmark M. Bentzen S. M. Jeraj R. Nucl. Med. Biol. 2011;38:771–780. doi: 10.1016/j.nucmedbio.2011.02.002. [DOI] [PMC free article] [PubMed] [Google Scholar]
- Pérès E. A. Toutain J. Paty L.-P. Divoux D. Ibazizène M. Guillouet S. Barré L. Vidal A. Cherel M. Bourgeois M. Bernaudin M. Valable S. EJNMMI Res. 2019;9:114. doi: 10.1186/s13550-019-0586-6. [DOI] [PMC free article] [PubMed] [Google Scholar]
- Green M. A. Klippenstein D. L. Tennison J. R. J. Nucl. Med. 1988;29:1549–1557. [PubMed] [Google Scholar]
- Holland J. P. Ferdani R. Anderson C. J. Lewis J. S. PET Clin. 2009;4:49–67. doi: 10.1016/j.cpet.2009.04.013. [DOI] [PMC free article] [PubMed] [Google Scholar]
- Holland J. P. Aigbirhio F. I. Betts H. M. Bonnitcha P. D. Burke P. Christlieb M. Churchill G. C. Cowley A. R. Dilworth J. R. Donnelly P. S. Green J. C. Peach J. M. Vasudevan S. R. Warren J. E. Inorg. Chem. 2007;46:465–485. doi: 10.1021/ic0615628. [DOI] [PubMed] [Google Scholar]
- Bonnitcha P. D. Bayly S. R. Theobald M. B. M. Betts H. M. Lewis J. S. Dilworth J. R. J. Inorg. Biochem. 2010;104:126–135. doi: 10.1016/j.jinorgbio.2009.10.009. [DOI] [PMC free article] [PubMed] [Google Scholar]
- Guillou A. Earley D. F. Klingler S. Nisli E. Nüesch L. J. Fay R. Holland J. P. Bioconjugate Chem. 2021;32:1263–1275. doi: 10.1021/acs.bioconjchem.1c00172. [DOI] [PubMed] [Google Scholar]
- Betts H. M. Barnard P. J. Bayly S. R. Dilworth J. R. Gee A. D. Holland J. P. Angew. Chem., Int. Ed. 2008;47:8416–8419. doi: 10.1002/anie.200801936. [DOI] [PubMed] [Google Scholar]
- Gritsan N. P. Platz M. S. Chem. Rev. 2006;106:3844–3867. doi: 10.1021/cr040055+. [DOI] [PubMed] [Google Scholar]
- Eichenberger L. S. Patra M. Holland J. P. Chem. Commun. 2019;55:2257–2260. doi: 10.1039/C8CC09660K. [DOI] [PubMed] [Google Scholar]
- Guillou A. Earley D. F. Holland J. P. Chem. – Eur. J. 2020;26:7185–7189. doi: 10.1002/chem.202001755. [DOI] [PubMed] [Google Scholar]
- Fay R. Gut M. Holland J. P. Bioconjugate Chem. 2019;30:1814–1820. doi: 10.1021/acs.bioconjchem.9b00342. [DOI] [PubMed] [Google Scholar]
- Klingler S. Holland J. P. Sci. Rep. 2022;12:668. doi: 10.1038/s41598-021-04626-5. [DOI] [PMC free article] [PubMed] [Google Scholar]
- Zanzonico P. J. Nucl. Med. 2008;49:1114–1131. doi: 10.2967/jnumed.107.050203. [DOI] [PMC free article] [PubMed] [Google Scholar]
Associated Data
This section collects any data citations, data availability statements, or supplementary materials included in this article.


