Abstract
Recent studies have shown that a strategy aiming for containment, not elimination, can control tumour burden more effectively in vitro, in mouse models and in the clinic. These outcomes are consistent with the hypothesis that emergence of resistance to cancer therapy may be prevented or delayed by exploiting competitive ecological interactions between drug-sensitive and drug-resistant tumour cell subpopulations. However, although various mathematical and computational models have been proposed to explain the superiority of particular containment strategies, this evolutionary approach to cancer therapy lacks a rigorous theoretical foundation. Here we combine extensive mathematical analysis and numerical simulations to establish general conditions under which a containment strategy is expected to control tumour burden more effectively than applying the maximum tolerated dose. We show that containment may substantially outperform more aggressive treatment strategies even if resistance incurs no cellular fitness cost. We further provide formulas for predicting the clinical benefits attributable to containment strategies in a wide range of scenarios and compare the outcomes of theoretically optimal treatments with those of more practical protocols. Our results strengthen the rationale for clinical trials of evolutionarily informed cancer therapy, while also clarifying conditions under which containment might fail to outperform standard of care.
The justification for aggressive anticancer therapies is to maximize the probability of a cure1,2. This rationale disappears if a cure cannot be expected. In some if not many cases, treating aggressively could be suboptimal due to treatment toxicity and selection for resistance3,4. A better strategy might be to use the minimal effective dose that contains the tumour subject to ensuring sufficient quality of life5-7.
The logic of aiming for containment rather than elimination is based on evolutionary principles. At the beginning of therapy, a tumour contains cells with different sensitivities to treatment. An aggressive treatment eliminates the most sensitive cells but can enable resistant cells—freed from competing with sensitive cells for space and resources—to thrive uncontrollably. This phenomenon, called competitive release, is well understood in ecology and pest management8-10. By maintaining a large population of treatment-sensitive tumour cells, a containment strategy aims to exploit cell–cell competition to prevent or delay the emergence of resistance.
Various protocols in this spirit have been found to be superior to conventional therapy in experimental models6,11,12, a preclinical trial13 and a small clinical trial in metastatic castrate-resistant prostate cancer4. Other clinical trials are active or recruiting (NCT03511196, NCT04388839). Yet, the underlying evolutionary theory is only imprecisely characterized in the cancer context. With the exception of Martin et al.5, previous mathematical and simulation studies4,6,11,12,14-22 have focused on particular model formulations, specific therapeutic protocols and typically untested assumptions about tumour growth rate, cell–cell interactions, treatment effects and resistance costs. Many previous findings are not readily generalizable because they are based on simulations rather than mathematical analysis. Sufficient conditions for successful tumour containment have not been established. In this study, we address this knowledge gap by synthesizing, generalizing and extending previous results to form a solid theoretical basis for pursuing evolutionary approaches to cancer therapy. Our work thus provides timely guidance for empirical research including the design of clinical trials.
Results
This study proves formal results for general models (Models 1 and 2; described in Methods). These models have two kinds of tumour cells: sensitive and fully resistant, with the subpopulation sizes S(t) and R(t), respectively. The total tumour size is N(t) = S(t)+R(t). Mutations occurring after treatment initiation are neglected, for reasons we will explain. Results are illustrated for a Gompertzian model5,14:
| (model 3) |
where C(t) is the drug dos, λ is a sensitivity parameter, K is the tumour carrying capacity (the hypothetical size at which the tumour would cease to grow) and ρ is the baseline per-cell growth rate. The parameters are described in Methods and Table 2; values are mostly taken from a previous study14.
Table 2 ∣.
Parameter values
| Parameter | Meaning | Value | Model(s) |
|---|---|---|---|
| K | Tumour carrying capacity | 2 × 10¹² | Model 3 |
| K s | Carrying capacity of a fully susceptible tumour | 2 × 10¹² | Model 4 |
| K r | Carrying capacity of a fully resistant tumour | Varied | Model 4 |
| ρ, ρr, ρs | Baseline per-cell growth rate (per day) | 0.005928 | Models 3 and 4 |
| α | Competition coefficient | 1 | Model 4 |
| β | Competition coefficient | Varied | Model 4 |
| λ | Treatment sensitivity | 1 | Models 3 and 4 |
| C max | Maximal instantaneous tolerated dose | 2 | Models 3 and 4 |
| N 0 | Initial tumour size | 1010 | Models 3 and 4 |
| R 0 | Initial resistant cell population size | 2.3 × 10⁵ | Models 3 and 4 |
| N tol | Tumour size corresponding to treatment failure | 7 × 10¹⁰ | Models 3 and 4 |
| N crit | Lethal tumour size | 5 × 10¹¹ | Models 3 and 4 |
Except when otherwise specified, numerical results use the following parameter values. Model 4 is introduced later on. The initial size of the resistant subpopulation is derived through the Goldie–Coldman formula2: , where τ=10−6 is the mutation and back mutation rate of Monro and Gaffney14 and N0 is the initial tumour size. The value of Ntol is arbitrary (in log scale, this is almost the average of N0 and Ncrit). The value of Cmax is for consistency with the clinical trial results reported by Zhang et al.4. On average, the cumulative dose given in that trial was 47% of the MTD, which is consistent with values of Cmax between 2 and 2.5 assuming the initial tumour is highly sensitive (higher values otherwise). Since λCmax = 2, it takes as much time for a fully sensitive tumour size to double in the absence of treatment as to be halved under MTD; the dose C = Cmax/2 would precisely stabilize a fully sensitive tumour.
We compared the effect of various treatments including: containment at the initial tumour size, which stabilizes the tumour at its initial size as long as possible, subject to a maximum tolerated dose constraint C(t)≤Cmax (or as long as some sensitive cells remain in an idealized case, called ideal containment); containment at a larger size N*, which lets the tumour grow until size N* before stabilizing it; intermittent containment, which does not treat until N=Nmax, then treats at Cmax until N=Nmin and iterates as long as possible4; maximum tolerated dose (MTD), which is C(t) = Cmax throughout; and ideal MTD, which eliminates sensitive cells at treatment initiation.
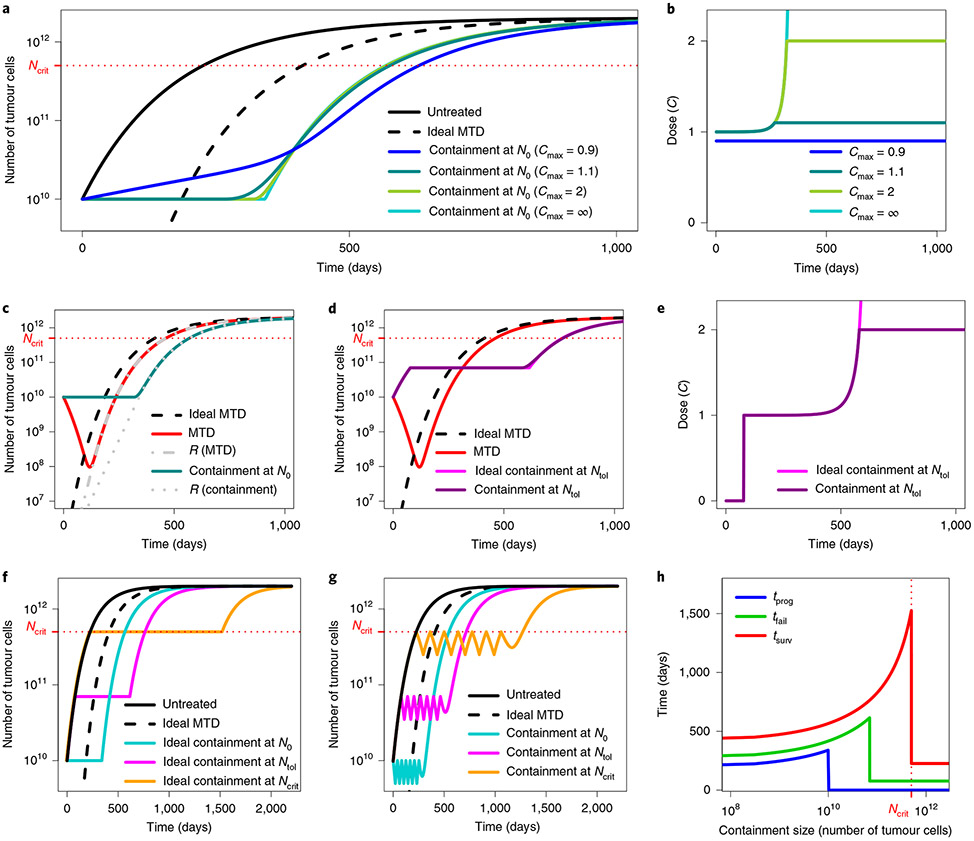
These treatments are illustrated in Fig. 1. The outcomes considered are: time to progression, which is the time until the tumour exceeds its initial size, N0; time to treatment failure, until the tumour exceeds a threshold size Ntol, which we call the maximal tolerable size; and survival time, until the tumour reaches an hypothetical lethal size, Ncrit. Details are given in Methods.
Fig. 1 ∣. Illustration of containment and MTD treatments in Model 3.
a, Tumour size under no treatment (black), ideal MTD (dashed) and containment at the initial size for various values of the maximum tolerated dose Cmax. The case Cmax = ∞ (light blue) corresponds to ideal containment. The patient is assumed to die shortly after tumour size becomes greater than Ncrit. b, Drug dose under the containment treatments of a. If Cmax < 1, the tumour cannot be stabilized and containment boils down to MTD. c, Tumour size under MTD, ideal MTD and containment at the initial size and resistant population size under MTD and containment. The effect of varying R0 is illustrated in Extended Data Fig. 3. d, Tumour size under MTD, containment at the maximum tolerable size and their idealized counterparts. The effect of varying Cmax is illustrated in Extended Data Fig. 6. e, Drug dose under containment and ideal containment at the maximum tolerable size, as represented in d. f, Tumour size under no treatment, ideal MTD and ideal containment at three different tumour sizes. g, Tumour size under no treatment, ideal MTD and intermittent containment between Nmax and Nmin = Nmax/2 for 3 different values of Nmax. h, Times to progression (blue), treatment failure (green) and survival time (red) under ideal containment at a threshold size varied from R0 to Ncrit (ideal containment at R0 is equivalent to ideal MTD). The time until the tumour exceeds a certain size is maximized by ideal containment at that size. The exact formulas for the idealized treatments are found in the Supplementary Information, section 3.
When is containment optimal?
The optimal treatment strategy depends on the clinical objective. If the emphasis is on rapidly reducing tumour burden then MTD is clearly superior to containment. However, if the aim is to maximize time to progression, then our formal mathematical analysis proves that containment is likely to be optimal, or at least close to optimal, in a broad range of cases.
To see why, consider a tumour containing sensitive and fully resistant cells. The growth rates of these two subpopulations are expected to depend on the subpopulation sizes; the growth rate of sensitive cells will also vary with the treatment dose. Furthermore, if resource competition is the dominant ecological interaction between subpopulations, then it is reasonable to assume that, all else being equal, the larger the sensitive population, the lower the growth rate of the resistant population. To the best of our knowledge, this latter assumption holds for all proposed mathematical models with two cell types where the impact of mutations after treatment initiation can be neglected (see section 1 of the Supplementary Information for a review of previous studies).
If the objective is to maximize time to progression then, under the above assumptions, the best possible treatment is the containment strategy that precisely maintains the original tumour burden for as long as some sensitive cells remain, which we called ideal containment. Moreover, among the treatment strategies that eventually eliminate the sensitive population, the worst option is to eliminate sensitive cells from the start, that is, the ideal MTD treatment. Instead of maximizing time to progression, an alternative objective is to maximize the time until tumour burden exceeds a certain threshold. In this case, the optimal treatment maintains the tumour at precisely this threshold size. Formally, let tidContN* and talt denote the times at which tumour size exceeds N* under ideal containment at size N* ≥ N0 and under an arbitrary alternative treatment, respectively. Then tidContN* ≥ talt (Supplementary Information, proposition 3). Besides standard regularity assumptions, this result requires only that the population of sensitive cells be maximized by not treating and the resistant cell growth rate function is non-increasing in S. The result is independent of our other assumptions.
The intuitive explanation is that, whereas we can always reduce the sensitive population by using a sufficiently aggressive treatment, the only way to impair the growth of resistant cells is to exploit competition with sensitive cells. By assumption, this ecological form of control is most effective when the sensitive population is as high as can be permitted, that is, under containment. Conversely, competition is least effective when the sensitive population is smallest, that is, under MTD.
Which containment strategy works best depends on the objective (Fig. 1f,h). Time to progression is maximized by ideal containment at the initial size; time to treatment failure is maximized by ideal containment at the maximal tolerable size. In theory, survival time would be maximized by ideal containment just below the lethal tumour size. However, attempting this would be extremely dangerous, both due to adverse effects on patient’s quality of life and because too optimistic a guess of the lethal burden would lead to quick patient death.
Clinical gains strongly depend on competition intensity.
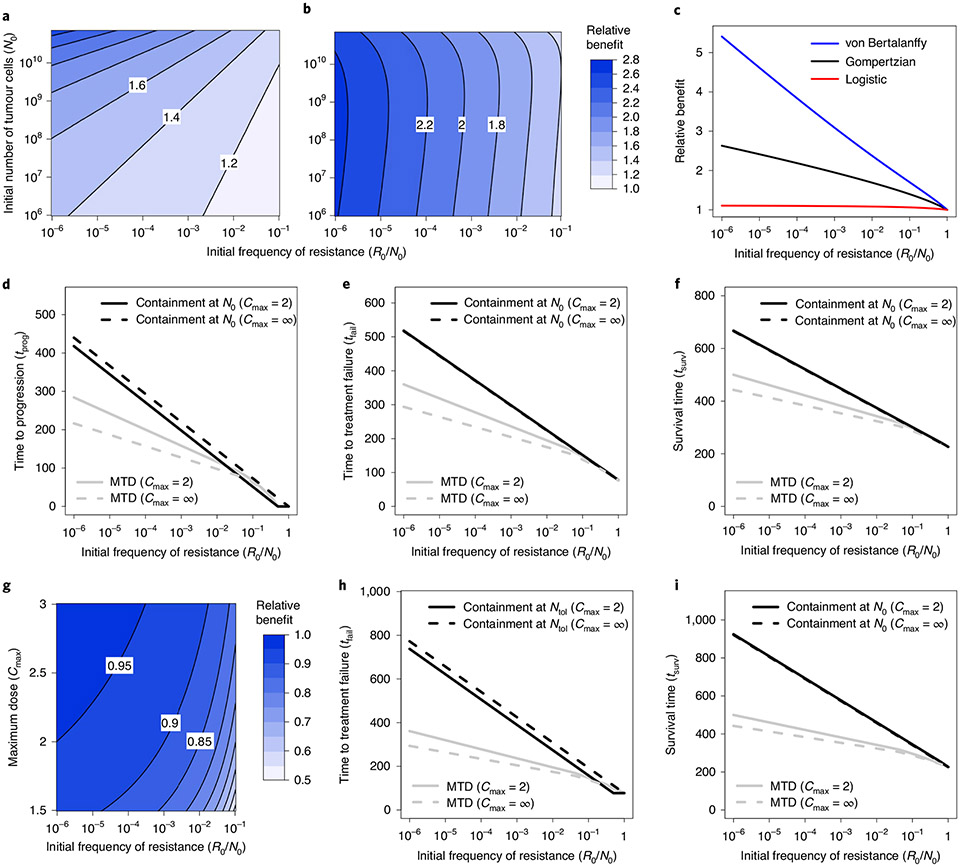
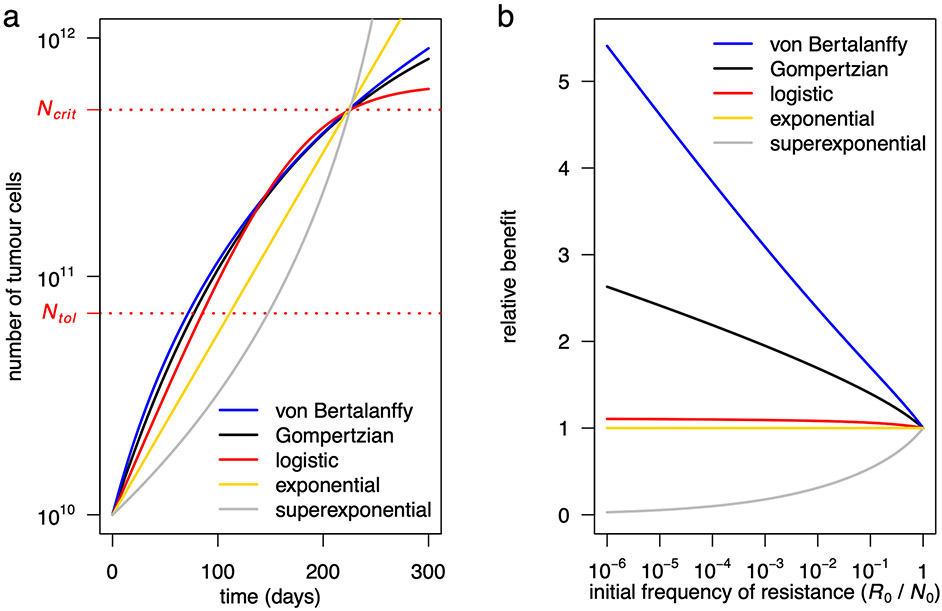
The superiority of ideal containment is qualitatively very robust and holds for both frequency- and density-dependent models. However, quantitatively, clinical benefits strongly depend on the intensity of competition. In frequency-dependent models11,12, a key parameter is the relative fitness of resistant cells when rare11. Similarly, in density-dependent models4,5,14,17,23, a key quantity is by how much the growth rate of resistant cells increases when sensitive cells are eliminated. In the widely used Gompertzian model of tumour growth, the per-cell growth rate decreases relatively rapidly with increasing tumour size, leading to a strong competition effect and substantial clinical gains for containment versus aggressive treatment. Mathematical models that describe weaker competition, such as the logistic growth model, predict smaller, possibly much smaller clinical gains5. Those that describe stronger competition, such as the von Bertalanffy growth model24, predict larger gains (Fig. 2c and Extended Data Fig. 2; Supplementary Information, section 4.1.1). Important differences between model predictions underscore the need to advance the understanding of the ecological interactions that govern intratumour dynamics25, which are only poorly characterized.
Fig. 2 ∣. Comparison of clinical benefits of containment and MTD treatments in Model 3.
a, Relative benefit, in terms of time to progression, for ideal containment at size N0 versus ideal MTD (that is, ratio tprog(idContN0)/tprog(idMTD)), as a function of initial tumour size and frequency of resistant cells. b, Relative benefit, in terms of time to treatment failure, for ideal containment at size Ntol versus ideal MTD (that is, ratio tfail(idContNtol)/tfail(idMTD)), as a function of initial tumour size and frequency of resistant cells. c, Relative benefit, in terms of time to treatment failure, for ideal containment at size Ntol versus ideal MTD for a Gompertzian growth model (black curve; Model 3), a logistic growth model (red) and a von Bertalanffy growth model (blue). Parameter values for the Gompertzian growth model are as in Table 2. Parameter values of the other models are chosen so that untreated tumour growth curves are similar for tumour sizes between N0 and Ncrit (the lethal size). See Extended Data Fig. 2 for details. d–f, Time to progression (d), treatment failure (e) and survival time (f) versus initial frequency of resistance. Outcomes are shown for MTD treatment and containment at N0, both in the ideal case (Cmax = ∞) and subject to Cmax = 2. g, Relative benefit, in terms of time to treatment failure for containment versus ideal containment (at size Ntol), as a function of maximum dose threshold (Cmax) and initial frequency of resistant cells (the formulas are shown in Supplementary Information, section 3.3). The contour lines are at intervals of 0.05. h,i, Time to treatment failure (h) and survival time (i) versus initial frequency of resistance. Outcomes are shown for MTD treatment and containment at Ntol, both in the ideal case (Cmax = ∞) and subject to Cmax = 2.
Other important biological parameters.
Simple mathematical expressions may be derived to quantify the effects of containment and MTD strategies in various density-dependent scenarios and in some frequency-dependent ones (Supplementary Information, section 3). This enables us to examine the impact of varying any parameter on time to progression, time to treatment failure and survival time. Recall that these three outcomes are defined, respectively, as the times until the tumour becomes larger than N0 (the size at treatment initiation), Ntol (a hypothetical maximum tolerable size) and Ncrit (the hypothetical lethal tumour size). For idealized treatments, these outcomes are independent of the treatment’s mode of action (for example, whether it results in a log kill rate, a Norton–Simon kill rate proportional to the net growth rate of an untreated tumour1 or some other effect).
For Model 3, the times to progression under ideal containment at the initial size and ideal MTD are:
respectively, where ln is the natural logarithm. In terms of time to progression, the absolute clinical benefit of ideal containment over ideal MTD is the difference between these numbers; the relative benefit (or fold change in progression time26) is the following ratio:
| (1) |
These formulas reveal the importance of three patient-specific factors: the baseline growth rate, ρ; the initial frequency of resistant cells, R0/N0; and the initial tumour size compared to the carrying capacity, N0/K.
For idealized treatments, decreasing the growth rate parameter (ρ) has no effect on the relative clinical benefits of containment; however, by slowing the dynamics, it leads to higher absolute benefits. Instead, decreasing the initial frequency of resistant cells (R0/N0) increases both absolute and relative clinical gains of containment versus MTD. This is in part because aggressive treatments are especially suboptimal when resistance is very rare, as they then cause a drastic reduction in tumour size, which permits rapid expansion of the resistant population. Lastly, a higher value of the ratio N0/K implies more intense competition at the initial tumour size. This increases both absolute and relative benefits of containment at the initial size. Fig. 2a illustrates some of these effects for Model 3. The impact of a large initial tumour size on the relative benefits of containment at the maximal tolerable size is more complex (Fig. 2b and Supplementary Information, section 4.1.2).
Practical treatment strategies can be close to optimal.
In the mathematical analysis outlined above, we assumed no restriction on maximum dose, which permits the ideal containment strategy of maintaining the tumour precisely at a target size until it becomes fully resistant. In reality, toxicity constraints typically impose a maximum instantaneous dose Cmax.
In Fig. 1a-e, we compared tumour dynamics and doses under ideal containment and under containment strategies. In the latter case, the stabilization phase is shorter because it finishes before all sensitive cells have been removed. This results in shorter times to progression or treatment failure (Fig. 2d,e,g,h).
For Model 2 (Methods) with specific cellular kill rate functions, the stabilization time may be quantified with explicit formulas (Supplementary Information, section 3). For Model 3, for instance, provided that the tumour is initially sufficiently sensitive to be stabilized by a dose no higher than Cmax, the time at which tumour size exceeds the stabilization size Nstab under containment is:
Omitting the last term in the bracket gives the corresponding time tNstab (idCont) under idealized containment. Provided that resistant cells are initially rare (long stabilization phase) and treatment is sufficiently effective (few sensitive cells remain when containment fails), non-idealized containment performs almost as well as ideal containment (Fig. 2g). Moreover, after the stabilization phase, both tumour size and resistant population size grow more slowly under containment than under ideal containment. This is because the tumour is still partially sensitive and hence responds to treatment while the remaining sensitive cells slow the growth of resistant cells. Due to the latter effect, the resistant population is never higher under containment than under ideal containment. The number of resistant cells is actually never higher under containment at size Nstab than under any treatment that treats at Cmax when N > Nstab (Supplementary Information, proposition 4). Thus, provided that sensitive cells become eventually rare, survival time should be at least as long under containment as under any such treatment, including MTD and ideal containment. This is confirmed by simulations (Figs. 1a,d and 2f,i). Differences between ideal and non-ideal containment outcomes are further discussed in Supplementary Information, section 4.2.
An additional consideration is that a continuous containment strategy requires continuous monitoring of tumour size, which is typically unfeasible. More practical protocols include intermittent containment, constant dose therapy and metronomic therapy.
Intermittent containment.
The question of whether it is better to implement containment via a continuous low-dose or an intermittent high-dose treatment has yet to be settled. Both strategies have worked well in mice13. Although Zhang et al.4 obtained highly promising clinical results from intermittent high-dose treatment, a continuous low-dose treatment might have performed even better, as, if anything, seems to be the case in mice13, although the evidence is too scarce to be conclusive. Mathematical models that account for cell cycle dynamics, pharmacodynamics and drug-induced resistance may be able to predict the optimality of a specific intermittent treatment, provided they can be parameterized precisely. However, in our simple setting, higher tumour burden implies slower growth of resistance. Therefore, containment between the upper and lower bounds Nmax and Nmin is intermediate between containment at the upper threshold and containment at the lower threshold. This holds both in terms of resistant population sizes and, in idealized cases, in terms of the time at which tumour size exceeds Nmax (Supplementary Information, section 2.3 and propositions 5 and 6). Thus, containment seems superior to intermittent containment but the difference between the two types of protocol is small provided that Nmin is a large fraction of Nmax (compare Fig. 1g and 1h; see the explicit formulas in the Supplementary Information (section 3.1.5), Extended Data Fig. 1, section 3.3 and Supplementary Table 4, as well as the numerical results in Table 1 and Supplementary Table 5; see also section 4.3 and Extended Data Fig. 4).
Table 1 ∣.
Time to progression, treatment failure and survival time for Model 3
| Treatment | t prog | t fail | t surv |
|---|---|---|---|
| No treatment | 0 | 77 | 226 |
| Ideal MTD | 186 | 263 | 412 |
| MTD (Cmax = 2) | 236 | 314 | 463 |
| C = 1.09 | 303 | 397 | 549 |
| Containment at N0 (Cmax = 2) | 318 | 418 | 568 |
| Ideal containment at N0 | 340 | 417 | 566 |
| C = 1.07 from N = Ntol | 0 | 543 | 731 |
| Containment at Ntol (Cmax = 2) | 0 | 580 | 767 |
| Ideal containment at Ntol | 0 | 615 | 764 |
| Intermittent containment (Cmax = 2) between 0.5 N0 and N0 | 317 | 398 | 547 |
| Intermittent containment (Cmax = 2) between 0.8N0 and N0 | 325 | 411 | 561 |
| Ideal intermittent containment between 0.5 N0 and N0 | 320 | 397 | 546 |
| Ideal intermittent containment between 0.8N0 and N0 | 333 | 410 | 559 |
The constant dose or delayed constant doses C = 1.09 and C = 1.07 maximize tprog and tfail, respectively, among all constant dose or delayed constant dose treatments. Times are measured in days. Note that intermittent containment between N0 and Nmin=0.8N0 leads to a larger time to progression than containment at N0, but to a lower time to treatment failure and survival time. This is discussed in the Supplementary Information, section 4.3.
Constant dose.
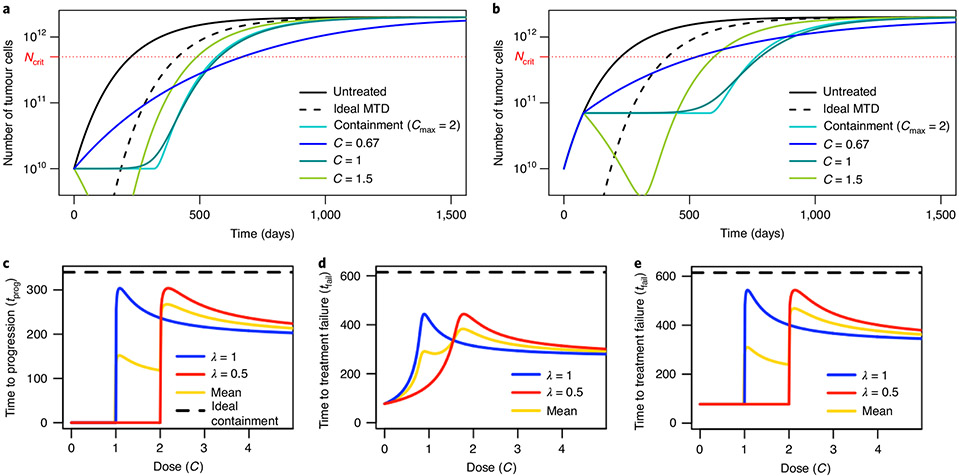
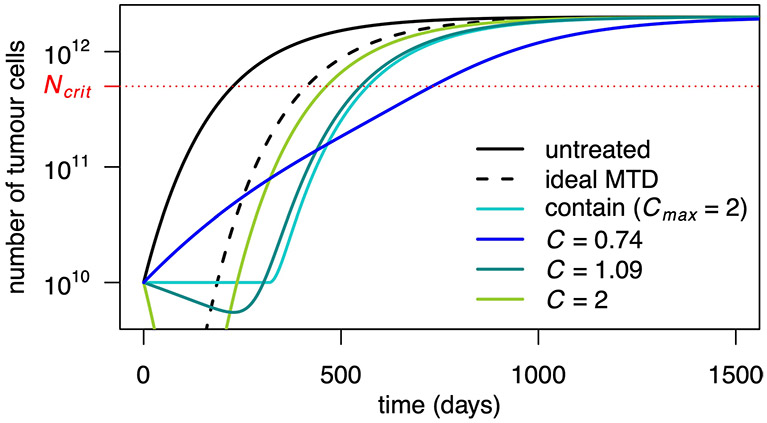
To maximize time to progression in Model 3, the optimal constant dose is slightly higher than C=1/λ, which corresponds to C=1 in Fig. 3a. The constant dose C=1/λ stabilizes the sensitive population size, whereas containment uses the evolving dose C=N/λS = 1/λ+R/λS to stabilize tumour size. According to our definition, the former approach leads to immediate progression because it allows the overall tumour size to increase from the start of treatment. However, provided that resistant cells are initially rare, the dose C=1/λ maintains tumour size close to the initial size for nearly as long as under containment (Fig. 3a,c). Differences that emerge after resistant cells become abundant are relatively unimportant. Thus, for a given patient, the dose C=1/λ is expected to lead to similar outcomes as containment at the initial size. Similarly, delaying treatment until tumour size reaches Ntol and then applying dose C=1/λ has similar outcomes as containment at the maximum tolerable size (Fig. 3b,e). Table 1 gives examples of times to progression, times to treatment failure and survival times for various constant doses and other treatments. Constant dose treatments may lead to higher survival time than containment at the initial size (Fig. 3a and Extended Data Fig. 7) but to the cost of quicker progression; they always lead to lower survival time than containment at sufficiently higher sizes.
Fig. 3 ∣. Constant dose and delayed constant dose treatments in Model 3.
a, Tumour size for various constant dose treatments compared to containment at the initial size (subject to Cmax = 2) and ideal MTD. b, Tumour size for various delayed constant dose treatments (the dose is applied continuously from the first time when N = Ntol) compared to containment at Ntol (subject to Cmax = 2) and ideal MTD. Until N = Ntol, all curves are the same, except ideal MTD. c, Times to progression for two patients whose tumours differed in treatment sensitivity (parameter λ) under constant dose treatments, as a function of the dose. The yellow line is the mean of the two patient outcomes and the dashed line is the time to treatment failure under ideal containment at N0, which is the same for both patients, and the maximal time to progression. d, Times to treatment failure for two patients whose tumours differed in treatment sensitivity under constant dose treatments, as a function of the dose. The yellow line is the mean of the two patient outcomes and the dashed line is the time to treatment failure under ideal containment at Ntol, which is the same for both patients, and the maximal time to treatment failure. e, Times to treatment failure for two patients whose tumours differed in treatment sensitivity under delayed constant dose treatment. (The dose starts to be applied when N = Ntol for the first time.) The yellow line is the mean of the two patient outcomes and the dashed line is the time to treatment failure under ideal containment at Ntol, which was the same for both patients, and the maximal time to treatment failure.
Adaptive treatments may be close to optimal for all patients.
Since delaying treatment until N=N* and then treating at an appropriate constant dose is predicted to yield similar outcomes as containment at N*, why should we not opt for this apparently simpler treatment rather than containment? A problem is that the parameters that determine the best constant dose for a particular patient are typically unknown. Giving slightly too little or too much treatment can be far from optimal (blue and red curves in Fig. 3c-e). Any constant dose that works relatively well for some patients will inevitably be suboptimal for others and the constant dose that gives the best average result for a cohort of patients will typically be further from containment than the best constant dose for a single patient (Fig. 3c-e and Supplementary Information, section 4.7). By contrast, a containment strategy will be close to optimal for every patient because it entails continuously adjusting the dose as a function of patient response without requiring any parameter to be known in advance (except that the tolerable tumour burden Ntol must be chosen by the physician or revealed during treatment). Similarly, in the absence of an initial induction phase where treatment is given at MTD, which could trigger competitive release, conventional metronomic therapy—where low doses are given at regular, predefined intervals—may look similar to intermittent containment. However, intermittent containment, a particular form of adaptive therapy4, has the important additional benefit of adapting doses to the evolution of the tumour and to patient-specific parameters without knowing these parameters in advance3.
Fitness costs of resistance are unnecessary.
A review article27 noted that “the theory behind adaptive therapy typically focuses on the phenotypic costs of the molecular mechanism(s) of resistance”. Indeed, proponents of cancer adaptive therapy have emphasized resistance mechanisms—such as upregulation of membrane extrusion pumps—that are energetically costly so that resistant cells are less fit than sensitive cells in the absence of treatment27,28. A related hypothesis is that, under intermittent containment, the frequency of resistant cells decreases during the gaps between doses due to the cost of resistance. For a sufficiently high cost, tumour composition might then remain almost unchanged after each on–off treatment cycle, enabling potentially indefinite tumour containment.
This intuition is not entirely correct. For tumour composition to remain the same after an on–off treatment cycle, the number of resistant cells should decrease during the gap between doses and not only their frequency, at least if the number of resistant cells increases during the treatment phases. Previously proposed mathematical models typically do not satisfy this condition4,5,14,17.
Most importantly, in our preceding results we have not assumed any costs of resistance. Nevertheless, we have shown that containment may substantially outperform more aggressive treatment strategies. The key assumption is not that resistance entails a fitness cost but rather that additional sensitive cells reduce the growth rate of resistant cells.
Fitness costs of resistance can amplify clinical gains from containment.
Given that resistance costs are not necessary for containment to improve on MTD, the next question is whether they are useful. That is, do costs of resistance increase clinical gains from containment? Generally the answer is yes but the size of the effect depends on the type of resistance cost. The most beneficial resistance costs are those that grow in the presence of sensitive cells. Consider the following model:
| (model 4) |
In this model, the baseline growth rates ρs, ρr and the carrying capacities Ks, Kr are specific to sensitive and resistant cells, respectively. In the denominators, total tumour size has been replaced by a weighted sum of the resistant and sensitive population sizes as is commonly assumed in ecological models. The higher the competition coefficient β, the greater the impact of sensitive cells on resistant cells. If β = 1, then resistant cells are affected equally by all cells and R+βS = N, as in Model 3.
In Model 4, a resistance cost may correspond to: a reduction in growth rate, independent of competition intensity (low ρr); a general inability to compete with other cells (low Kr); and a specific inability to compete with sensitive cells (high β).
All of these costs improve outcomes for all treatments but how do they affect comparisons between treatments? A first effect is that resistance costs slow down the emergence of resistant cells before treatment initiation, leading to a smaller initial resistant population. If a cure is impossible and assuming (as we argue in the Supplementary Information, section 6.3) that mutations after treatment initiation can be neglected, this effect tends to increase the benefit of containment more than MTD does (Fig. 2; see also refs. 14,26).
A second effect is that resistance costs also slow the growth of resistance after treatment initiation. Whether this is more beneficial to outcomes of containment or MTD depends on the type of cost. Given the same initial conditions, survival times under idealized treatments are inversely proportional to ρr. Thus, halving ρr doubles the time to progression under ideal containment but also under ideal MTD: the relative benefit is unchanged. This is because the impact of lowering ρr is independent of the number of sensitive cells. In a model that accounts for mutations from sensitive to resistant, lowering ρr may even decrease the relative benefit of containment17.
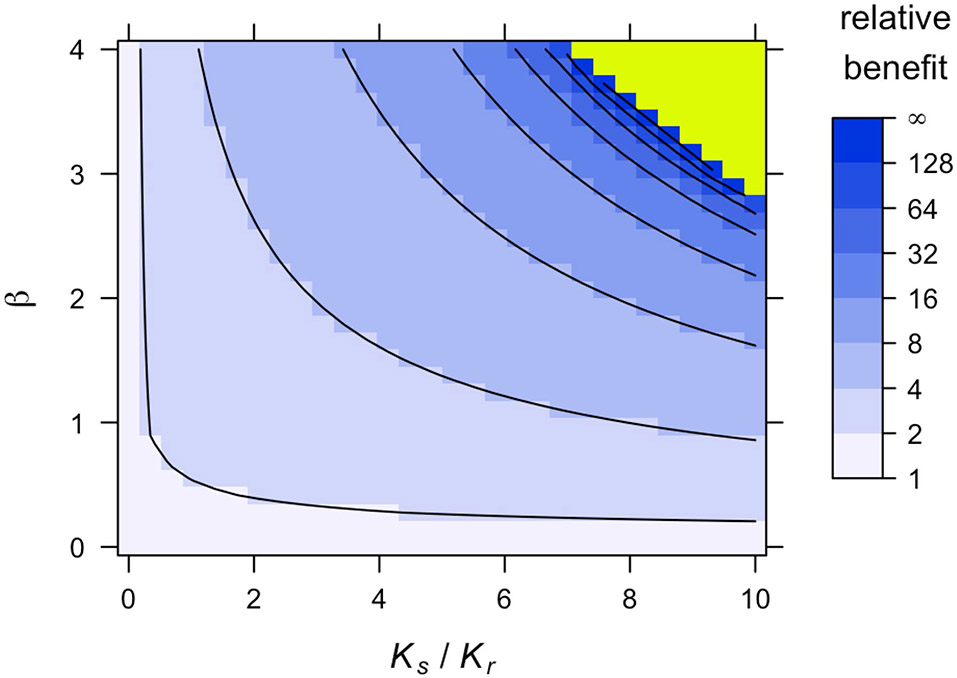
In contrast, lowering Kr or increasing β increases relative benefits because it harms resistant cells proportionally more in the presence of sensitive cells. In particular, a sufficient increase in the competition coefficient β can prolong survival indefinitely under containment (see the next section) while having no effect on the outcomes of ideal MTD. Some of these effects are illustrated in Fig. 4 (see also refs. 17,29). Since different types of resistance cost have such different impacts, it is important to study not only whether costs are typically present in tumours but also how these costs arise and how they can be modelled.
Fig. 4 ∣. Consequences of the costs of resistance in Model 4.
a, Relative benefit, in terms of time to treatment failure, for ideal containment (at size Ntol) versus ideal MTD, for varied values of Kr and β. This figure is based on approximate formulas that are highly accurate for the selected parameter values (Supplementary Information, section 5.2). Extended Data Fig. 8 shows an alternative version of this plot based on simulations. Contour lines are at the power of 2. b, Eventual outcomes of ideal containment (idCont) and ideal MTD (idMTD) treatment strategies based on exact formulas (Supplementary Information, section 5.1). The ‘infinite’ region in a corresponds to the ‘TI’ region in b. Fixed parameter values are as in Table 2.
When can a tumour be contained forever?
In Model 4, unless a fully sensitive or fully resistant tumour is intrinsically benign (Ks < Ntol or Kr < Ntol, respectively), indefinite containment under the maximum tolerable size requires two conditions: first, resistant cells are harmed more from competition with sensitive cells than from competition with other resistant cells (β > 1); second, the resistant population would decline in an almost fully sensitive tumour of threshold size Ntol.
The latter condition is equivalent to Kr < βNtol. Since the resistant population’s carrying capacity is likely to be substantially larger than the threshold tumour size, this condition typically requires a large competition coefficient β. Therefore, at least in this model, indefinite containment is possible only if sensitive cells greatly impair the fitness of resistant cells (green region of Fig. 4a and green and yellow regions of Fig. 4b). These results are derived in the Supplementary Information, section 5.1.
Discussion
Theoretical support for MTD therapy relies on the assumption that resistant cancer cells are absent1 or arise only during treatment2. Given that many if not most large solid cancers are expected to harbour pre-existing resistance30, we sought to build a firm theoretical foundation for understanding when containment strategies are likely to improve on conventional approaches. The logic of containing tumours is fundamentally simple: if some cells are fully resistant to treatment then the only way to fight them is via competition with sensitive cells, where ‘competition’ includes any process that leads to a decrease in the resistant population growth rate due to the presence of sensitive cells. Moreover, given the constraint of maintaining tumour size below a certain threshold, competition is maximized under containment treatment strategies. We have shown that this logic can be formalized and given a rigorous mathematical form in a general setting. It follows that model details are qualitatively irrelevant, provided that resistant cells are highly resistant and that increasing the number of sensitive cells always decreases the resistant population growth rate.
However, identifying conditions under which containment strategies are expected to perform well also emphasizes that the case for containment is weaker when these conditions are not met. If resistant cells do not compete with sensitive cells, or if tumour growth is superexponential31, then containment is likely to do worse than MTD (Supplementary Information, section 6.1). Also if resistant cells are only partially resistant then the logic changes: resistant cells can then be attacked not only via competition with sensitive cells but also by the treatment. Switching to MTD before the failure of low-dose treatment may then be superior to a pure containment strategy, even for idealized treatments (Supplementary Information, section 6.2). When to switch and whether the difference in outcomes is substantial is an important topic for further investigation. Finally, although we have checked that random genetic mutations from sensitive to resistant occurring after treatment initiation do not substantially affect our results (Supplementary Information, section 6.3 and Extended Data Fig. 5), we have not investigated treatment-induced mutations32,33, accumulation of driver mutations nor models involving quiescent cancer stem cells.
On the other hand, in our framework, the time until tumour size exceeds any particular threshold is maximized by maintaining tumour size precisely at this threshold for as long as there are sensitive cells, even if resistance has no cellular fitness cost. This suggests that tumour containment experiments and trials should not be restricted to cases where a resistance cost is assumed to exist. Our results also underline a trade-off between maximizing time to progression and maximizing the time at which tumour size is higher than some larger threshold. Since clinical evidence supporting containment strategies is limited, it seems safer to test containing tumours at their initial size or some relatively low size. If results are convincing, more ambitious strategies aiming at increasing intratumour competition by letting the tumour grow to its maximal tolerable size before containing it could be attempted. This maximal tolerable size would not have to be known in advance but could be discovered during treatment, based on the quality of life of the patient.
To implement containment strategies, the nature of the resistance mechanism, the frequency of resistant cells or other patient-specific parameters need not be known but a tumour burden indicator is required. In our models, when resistant cells are initially rare, applying a dose close to the initial stabilizing dose throughout typically leads to results similar to containment at the initial size. However, in practice tumour growth is much more irregular. Thus, finding a dose, or schedule, that initially results in tumour stabilization is not enough; regular monitoring and dose adjustment are required. In the Supplementary Information, section 7, we propose a new protocol that takes into account how far tumour size is from its target and how much it recently increased or decreased.
Importantly, although the ideal form of containment is impractical, our simulations and theoretical arguments predict that more feasible containment strategies will also improve substantially on MTD treatment. These more practical approaches include adaptive therapy6, which has an important advantage over constant dose or metronomic protocols, in that the optimal dose need not be known in advance. On the other hand, our theoretical results imply that an on–off implementation of adaptive therapy—as was employed in the only clinical trial of tumour containment to date4—may be suboptimal because it causes tumour size to deviate substantially below the maximum tolerable threshold. Further research is needed to establish optimal dosing protocols in the presence of biological factors not accounted for in our framework, such as spatial structure16,34.
By deriving explicit formulas for predicted clinical gains due to containment, we have shown that a crucial factor is the intensity of competition between sensitive and resistant cells. For tumours that obey the Gompertzian growth law, clinical gains are predicted to be substantial, at least when resistant cells are initially rare and the initial tumour size is not very small (at least 0.1% of carrying capacity). Less conventional tumour growth models predict either smaller or larger clinical gains. Therefore, our findings underscore the need to characterize intratumour competition25. A useful indicator that could be measured experimentally is the amount by which the resistant population growth rate increases—if at all—on elimination of sensitive cells.
Although we have investigated various extensions and variants of our basic model, we have not considered all potential clinical costs and benefits of containment. By maintaining a substantial tumour burden, containment might increase the risk of metastasis, cancer-induced illness such as cachexia or the emergence of more aggressive tumour clones via mutation35. On the other hand, containment has the important advantage of reduced treatment toxicity. Stabilizing tumour size might additionally lead to a more stable tumour microenvironment and better drug delivery, which would be consistent with the finding that, in preclinical trials in mice, tumour size could be stabilized using progressively lower doses13. Further experimental and theoretical research is needed to clarify whether the benefit of containment in terms of prolonging survival always outweighs its potential downsides. Notwithstanding these important caveats, our findings generally strengthen the case for conducting further experimental and clinical trials of tumour containment strategies.
Methods
Models.
For qualitative results, we considered a general model with two types of tumour cells, sensitive and fully resistant, with the subpopulation sizes S(t) and R(t), respectively. The total tumour population size is denoted by N(t) = S(t) + R(t), with the initial value N0 = S0 + R0. Tumour dynamics are described by:
| (model 1) |
where Ṡ and Ṙ denote derivatives and gs and gr are the per-cell growth rate functions; the quantity C(t) is the drug dose at time t, which is assumed to equate with treatment level, neglecting details of pharmacokinetics and pharmacodynamics.
In quantitative analyses, we considered more particular density-dependent models of the form:
| (model 2) |
with gr non-increasing and gs(N, 0) = gr(N), that is, in the absence of treatment, sensitive and resistant cells grow at the same rate. These models permit us to obtain explicit formulas for the time at which tumour size exceeds a given threshold under various treatments.
For numerical simulations, we use the Gompertzian growth model studied by Monro and Gaffney14 (see also Martin et al.5) and introduced as Model 3 at the beginning of the Results section.
| (model 3) |
Recall that λ is a sensitivity parameter, K is the tumour carrying capacity (the hypothetical size at which the tumour would cease to grow) and ρ is the baseline per-cell growth rate. We focused on this model in our numerical simulations to facilitate comparison with previous analysis14 and because Gompertzian growth has been shown to describe tumour growth better than alternative models, such as logistic growth36,37. Where not explicitly varied, the values of ρ, K, N0 and R0 are the same as in Monro and Gaffney14 (Table 2), except that we neglect mutations and back mutations after treatment initiation. We also consider a variant of Model 3 to study the impact of various types of resistance cost (Model 4) in the section titled ‘Fitness costs of resistance can amplify clinical gains from containment’).
Assumptions.
We made 4 key assumptions regarding Model 1. First, the growth rate of sensitive cells is positive in the absence of treatment and decreases as the treatment dose is increased (gs is non-increasing in C). Second, resistant cells are fully resistant (gr does not depend on C).
Third, all else being equal, the larger the subpopulation of sensitive cells, the lower the growth rate of resistant cells (gr is non-increasing in S). This is a standard assumption in the adaptive therapy literature (Supplementary Information, section 1), which might result from density dependence (the larger the tumour, the larger its doubling time5,14,26 as in the Gompertzian Model 3), frequency dependence (the rarer the resistant cells, the larger their doubling time11,12), a combination of those two factors4,11,15,17,18,21 or some other form of inhibition of resistant cells by sensitive cells. It is important to note that this assumption does not imply a fitness cost of resistance; we allowed the possibility that resistant cells are as fit or even fitter than sensitive cells in the absence of treatment.
Fourth, mutations between the sensitive and resistant phenotypes that occur after treatment initiation may be neglected. This assumption is justified in Supplementary Information, section 6.3, in Supplementary Table 6 and in Extended Data Fig. 5. On top of standard regularity assumptions on growth rate functions, this is enough for our key results. Some results also require that increasing the resistant population does not increase the growth rate of sensitive cells (gs is non-increasing in R), excluding cooperative interactions. This assumption is not satisfied in models with a Norton–Simon kill rate, for example, Model 3; however, for most of our results, it may be replaced by the assumption that the number of sensitive cells is maximized by not treating. This holds in Model 3 and any instance of Model 2 (Supplementary Information, section 2.4). Finally, the instantaneous dose C(t) is assumed no higher than a maximal tolerated dose Cmax, although this assumption is relaxed in our idealized treatments (below).
Treatments.
The three main treatment strategies we considered are the following: MTD, C(t) = Cmax throughout; containment at the initial tumour size N0: this treatment continuously adjusts the dose to maintain total tumour size at N(t) = N0 as long as possible with a dose C(t) ≤ Cmax, then treats at Cmax once N > N0 (unless the tumour size returns to N0, in which case it is again stabilized at N0 for as long as possible and so on). Mathematically, the stabilizing dose is found by solving the equation Ṅ(t) = 0. In the Gompertzian Model 3, this leads to C(t) = N(t)/λS(t). The dose administered is the minimum of this stabilizing dose and of Cmax. In practice, containment would only be approximative and the appropriate dose would be found by regular monitoring of the patient and dose adjustments. This would not require to differentiate between sensitive and resistant cells. Possible protocols are discussed in Supplementary Information, section 7; and containment at some other threshold size N*; this treatment does not treat until tumour size reaches N* (if N*≥N0) or treats at the maximal tolerated dose until tumour size is reduced to N* (if N* < N0), and then contains the tumour at this threshold as above.
To reveal the logic of containment as clearly as possible, we also considered idealized versions of these treatments, with no constraint on the maximum instantaneous dose so that the sensitive population can be reduced instantly to any desired size. These idealized treatments, although biologically unrealistic, help reveal the basic logic of containment and provide reference points largely independent of model details. In the idealized form of MTD treatment (ideal MTD), the sensitive population is instantly eliminated so that S(t) = 0 for all t > 0. This is called ‘aggressive treatment’ by Hansen et al.17 and Hansen and Read26, and ‘elimination’ by Hansen et al.38. We may think of this as a treatment inducing an infinite cellular kill rate. Ideal containment at the initial tumour size maintains the tumour at its initial size as long as some sensitive cells remain. The tumour is then fully resistant, hence its later growth independent of the treatment. Ideal containment at some other threshold N* lets the tumour grow to N* or instantly reduces tumour size to N* if N* < N0, then stabilizes tumour size at this threshold as long as some sensitive cells remain. Containment in the sense of Hansen et al.17, from which we borrow this vocabulary, corresponds to our ideal containment treatment except that we do not allow for an instantaneous increase in tumour size.
Containment and MTD treatments are illustrated in Fig. 1. We also considered other possibilities, such as constant dose or delayed constant dose treatments, studied by Monro and Gaffney14; intermittent containment (Fig. 1g), where tumour size is maintained between a high and a low threshold, as in Zhang et al.4; and forms of metronomic therapy, where treatment is turned on and off at predefined times.
Outcomes.
Our three main outcomes were: time to progression; time to treatment failure; and survival time.
Time to progression.
This is defined as the time until the tumour exceeds its initial size, N0. The response evaluation criteria in solid tumours criterion is that progression occurs when tumour size is 20% larger than at treatment initiation. This 20% buffer makes sense in medical practice, due to imperfect monitoring of the tumour and imperfect forecast of treatment’s effect. However, in our mathematical models this buffer is not needed and would only obscure the analysis, so we used a more basic definition.
Time to treatment failure.
This is the time until the tumour exceeds a threshold size determined by the physician and patient, Ntol, which we called the maximal tolerable size. This may be thought of as the maximal tumour size at which the tumour is not quickly life-threatening, based on physician expertise, and does not result in too-severe side effects for the patient. Due to this second requirement, the maximal tolerable size would only be revealed during treatment. To fix ideas, we assumed that it is higher than the initial tumour burden, N0. The case where it is lower is studied in the Supplementary Information.
Survival time.
This is the time until the tumour reaches a hypothetical lethal size, Ncrit, after which the patient is assumed to die quickly. This lethal tumour burden is also patient-specific.
Mathematical tools and intuition.
Formal mathematical proofs of our results on Model 1 can be found in the Supplementary Information, section 2. They are based on a differential equation tool called the comparison principle (a variant of Gronwall’s lemma) but the basic intuition is simple (see also ref. 17): between time t and t+dt, where dt is a small time increment, the resistant population increases from R(t) to R(t + dt) ≃ R(t) + R′(t)dt, hence by a quantity
So, if we fix a resistant population size R1 and a small size increment dR, the time it takes for the resistant population size to grow from R1 to R1 + dR is roughly:
| (2) |
where S1 is the sensitive population size when R = R1. Assuming R0 ≤ R1 ≤ N0, under ideal containment at the initial size, S1 + R1 = N0, so S1 = N0 – R1. Before progression, under any other treatment, S1 ≤ N0 – R1. By assumption, the larger the sensitive population, the lower the resistant population growth rate, hence the higher the duration dt in equation (2); it follows that the time it takes for the resistant population to grow from R1 to R1 + dR is maximized by ideal containment and minimized by ideal MTD, since then S1 = 0. Iterating this argument shows that the resistant population Ridcont(t) under ideal containment at the initial size will be smaller than the resistant population R(t) under any alternative treatment, at least as long as none of these treatments lead to progression. Since under ideal containment at the initial size, progression occurs when Ridcont(t) = N0, this implies that progression occurs later than under any other treatment. Other results require more sophisticated arguments but the intuition is similar.
Impact of the stabilization size.
If follows from section 2 in the Supplementary Information that containment at higher sizes than the initial size leads to larger clinical gains in terms of survival time, at least when comparing ideal containment to ideal MTD, but typically also for more realistic treatments. The general intuition is that letting the tumour grow increases competition between sensitive and resistant cells and hence slows down even more the growth of resistant cells than stabilizing the tumour at its initial size. This intuition may be made more precise in Model 2.
Indeed, the clinical gain of ideal containment at size N* ≥ N0, compared to no treatment, is then the duration of the stabilization phase. Moreover, due to the absence of cost of resistance, the proportion of resistant cells at the beginning of the stabilization phase is always R0/N0, independently of the stabilization size. The clinical gain of ideal containment is thus the time it takes for the resistant population to be multiplied by a factor N0/R0 (from R0/N0 to 1) while tumour size is maintained at N*. But the larger N*, the smaller the growth rate of resistant cells when N = N*, hence the larger the gains from ideal containment.
Extended Data
Extended Data Fig. 1 ∣. Ideal intermittent containment between Nmin and Nmax.
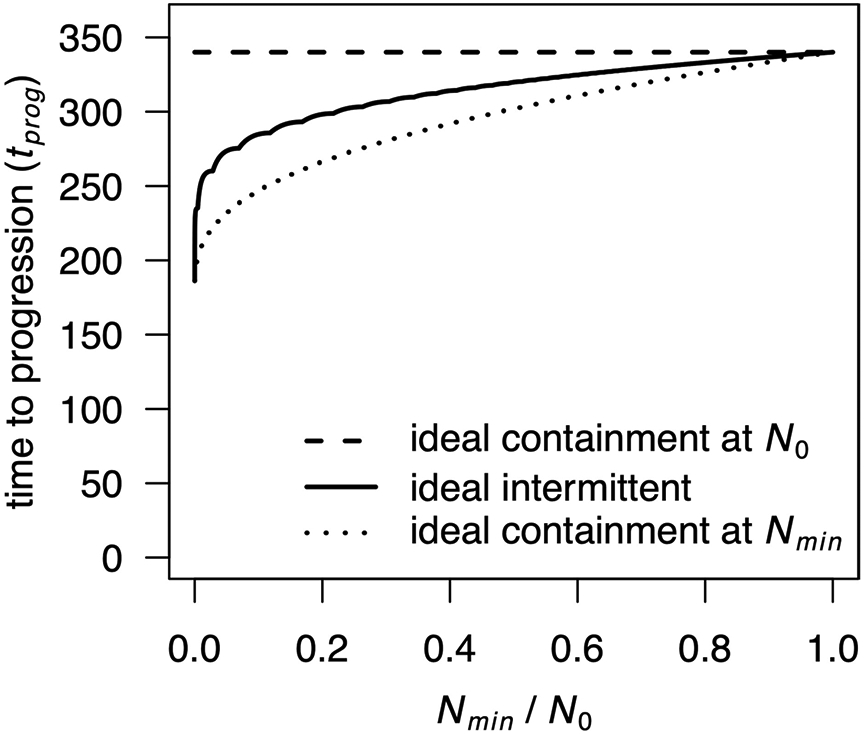
Times to progression are shown for ideal intermittent containment between Nmin and N0 for varied Nmin value (solid curve), compared to ideal containment at either N0 (dashed curve) or Nmin (dotted curve), according to a Gompertzian growth model (Model 3 in the main text). Non-varied parameter values are as in main text Table 2. The kinks in the curve for ideal intermittent containment are due to the discontinuity of the treatment when a new cycle is completed, or in mathematical terms, to the integer part that appears in the explicit formula.
Extended Data Fig. 2 ∣. Outcomes for five models with different forms of density dependence.
a, Untreated tumour growth curves for a Gompertzian growth model (black curve; Model 3 in the main text), a logistic growth model (red), a von Bertalanffy growth model (blue), an exponential model (yellow) and a superexponential model (grey). Parameter values for the Gompertzian growth model are as in Table 2 of the main text. Parameter values of the logistic and von Bertalanffy models are chosen so that their growth curves are similar to the Gompertzian model for tumour sizes between N0 and Ncrit (the lethal size), as would be the case if the models were fitted to empirical data. In the logistic growth model, K = 6.4×10¹¹ and ρ = 2.4×10⁻². In the von Bertalanffy growth model, K = 5×10¹³, ρ = 90 and γ = 1/3 (the latter value is conventional in tumour growth modelling [24, 37]). In the exponential model, ρ = 0.0175. In the superexponential model, ρ = 4.5×10⁻⁶ and γ = 1/3 (the latter value has been inferred from data [32]). b, Relative benefit, in terms of time to treatment failure, for ideal containment (at size Ntol) versus ideal MTD, for the five models with varied initial frequency of resistance (parameter values are the same as in panel a). Note that relative benefits for all models are independent of ρ.
Extended Data Fig. 3 ∣. Evolution of total tumour size under containment and MTD treatment in a Gompertzian growth model (Model 3 in the main text).
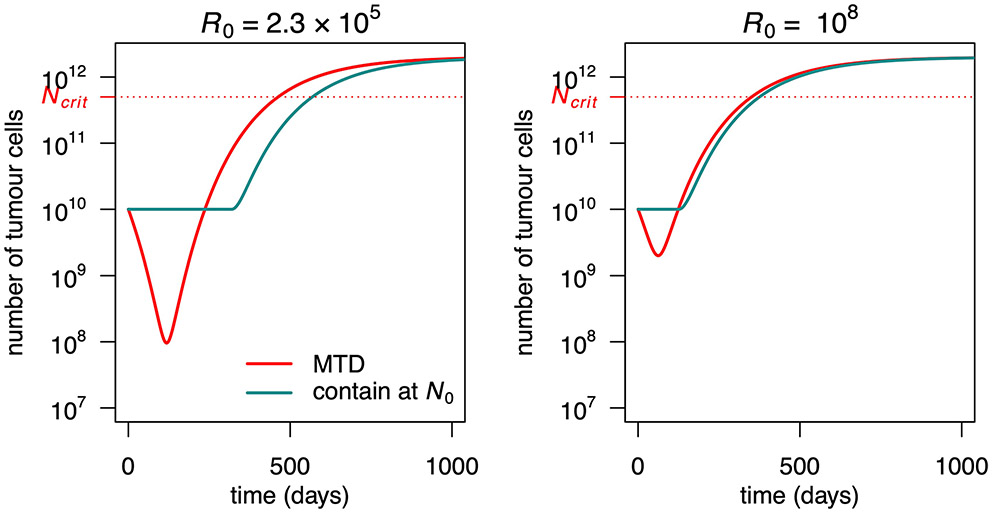
The initial resistant subpopulation size (R0) is varied. The maximum dose is Cmax = 2. Fixed parameter values are as in Table 2 of the main text.
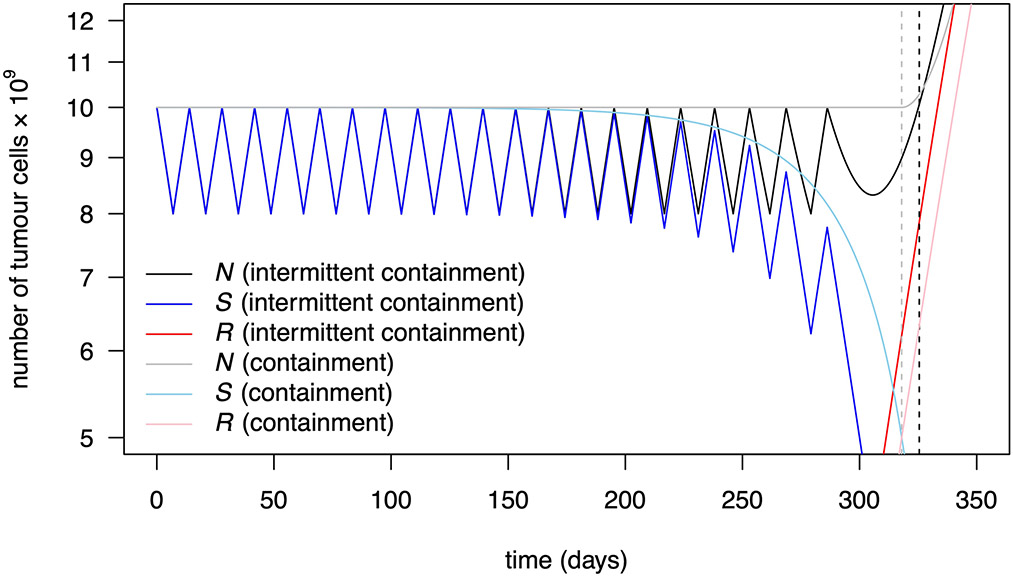
Extended Data Fig. 4 ∣. Containment at N0 and intermittent containment between N0 and 0.8 N0 in a Gompertzian growth model (Model 3 in the main text).
Dashed vertical lines indicate time to progression under containment (dashed grey) and intermittent containment (dashed black). Intermittent containment leads here to a slightly larger time to progression than containment at the upper level. However, as follows from Proposition 6 (Supplementary Material), the resistant population is larger under intermittent containment (red) than under containment (pink). After progression, tumour size quickly becomes larger under intermittent containment (solid black curve) than under containment (solid grey curve). Parameter values are as in Table 2 of the main text.
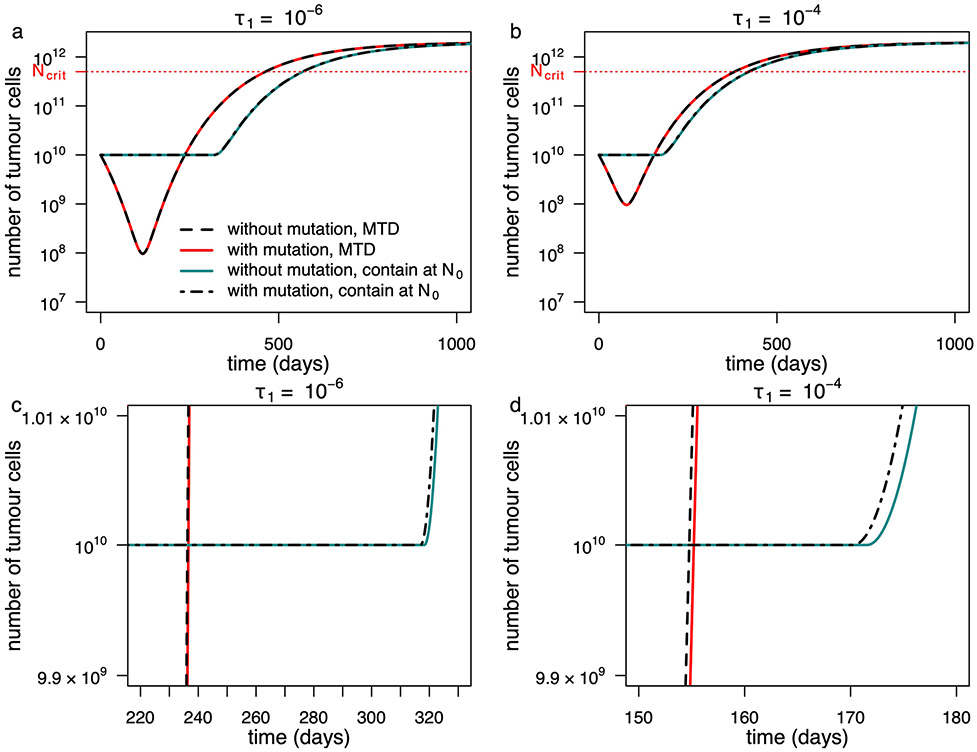
Extended Data Fig. 5 ∣. Influence of ongoing mutation in a Gompertzian growth model (Model 3 in the main text).
Outcomes are shown for a model in which mutations are neglected after the tumour reaches size N0 (solid lines) and for a model that explicitly accounts for ongoing mutation from the sensitive to the resistant phenotype at rate τ1 (broken lines). Two different mutation rates are illustrated. The second row contains the same data as the first row of panels but with different axes so as to make visible the subtle differences between curves. Fixed parameter values are as in Table 2 of the main text.
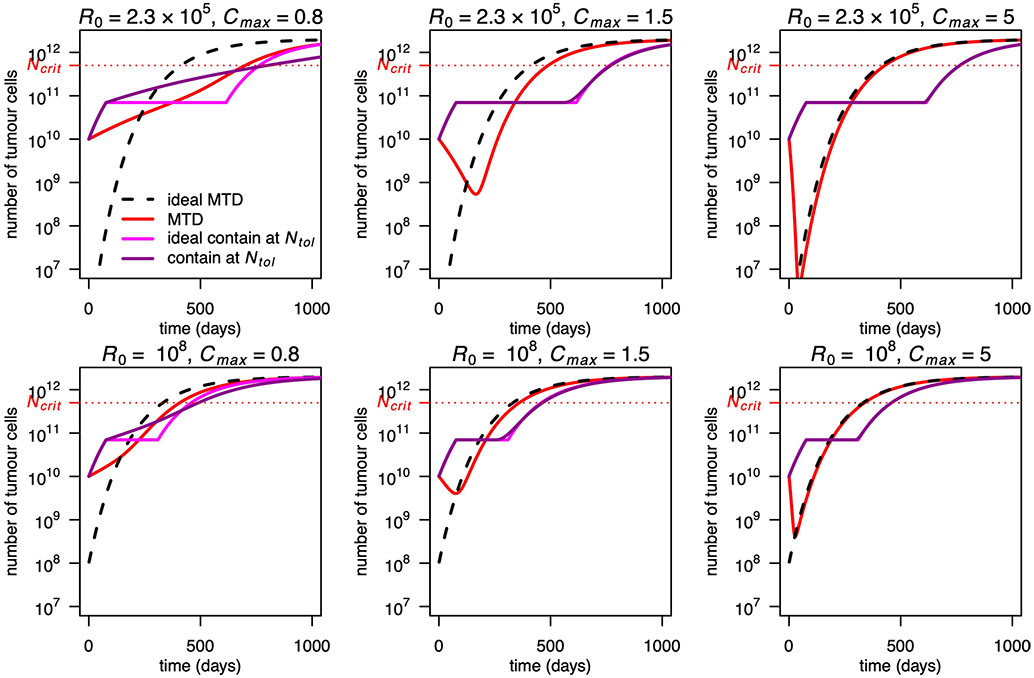
Extended Data Fig. 6 ∣. Evolution of total tumour size under ideal and non-ideal treatments in a Gompertzian growth model (Model 3 in the main text).
The initial resistant subpopulation size (R0) and the maximum dose (Cmax) are varied. Fixed parameter values are as in Table 2 of the main text.
Extended Data Fig. 7 ∣. Constant dose treatments in a Gompertzian growth model (Model 3 in the main text).
Tumour size for various constant dose treatments are compared to containment at the initial size (subject to Cmax = 2), MTD (C = Cmax) and ideal MTD. Dose 1.09 maximizes time to progression and 0.74 maximizes survival time among non-delayed constant doses (but is inferior to the optimal delayed constant dose). Parameter values are as in Table 2 of the main text.
Extended Data Fig. 8 ∣. Consequences of costs of resistance in a Gompertzian growth model (Model 4 in the main text).
Relative benefit, in terms of time to treatment failure, for ideal containment (at size Ntol) versus ideal MTD, for varied values of Kr and β. The figure is obtained from simulations, while Fig. 4a in the main text is obtained from our approximate formula. Contour lines are at powers of 2. Fixed parameter values are as in Table 2 of the main text.
Supplementary Material
Acknowledgements
We thank P. Lissy, S. Benzekry, F. E. Alvarez Borges and especially J. Brown for very helpful discussions and P. Ear for preliminary versions of some of the figures. This research project was initiated at the Lorentz Center Workshops Game Theory and Evolutionary Biology and Understanding Cancer Through Evolutionary Game Theory. Y.V. and R.N. acknowledge the support from the Fondation Mathématiques Jacques Hadamard Program Gaspard Monge for optimization and operation research and their interactions with data science, and from EDF, Thales, Orange and Criteo. R.N. acknowledges support from ERC Synergy grant no. 609883 and the National Cancer Institute of the National Institutes of Health (NIH) under award no. U54CA217376. The content is solely the responsibility of the authors and does not necessarily represent the official views of the NIH.
Footnotes
Competing interests
The authors declare no competing interests.
Extended data is available for this paper at https://doi.org/10.1038/s41559-021-01428-w.
Supplementary information The online version contains supplementary material available at https://doi.org/10.1038/s41559-021-01428-w.
Code availability
Simulations were conducted in R (version 4.0.2) using the deSolve package39 (version 1.28). The code for the simulations is available at https://github.com/robjohnnoble/LogicOfContainingTumours.
Reporting Summary.
Further information on research design is available in the Nature Research Reporting Summary linked to this article.
Data availability
No datasets were generated or analysed during the current study.
References
- 1.Norton L & Simon R Tumor size, sensitivity to therapy, and design of treatment schedules. Cancer Treat. Rep 61, 1307–1317 (1977). [PubMed] [Google Scholar]
- 2.Goldie JH & Coldman AJ A mathematic model for relating the drug sensitivity of tumors to their spontaneous mutation rate. Cancer Treat. Rep 63, 1727–1733 (1979). [PubMed] [Google Scholar]
- 3.Gatenby RA A change of strategy in the war on cancer. Nature 459, 508–509 (2009). [DOI] [PubMed] [Google Scholar]
- 4.Zhang J, Cunningham JJ, Brown JS & Gatenby RA Integrating evolutionary dynamics into treatment of metastatic castrate-resistant prostate cancer. Nat. Commun 8, 1816 (2017). [DOI] [PMC free article] [PubMed] [Google Scholar]
- 5.Martin RB, Fisher ME, Minchin RF & Teo KL Optimal control of tumor size used to maximize survival time when cells are resistant to chemotherapy. Math. Biosci 110, 201–219 (1992). [DOI] [PubMed] [Google Scholar]
- 6.Gatenby RA, Silva AS, Gillies RJ & Frieden BR Adaptive therapy. Cancer Res. 69, 4894–4903 (2009). [DOI] [PMC free article] [PubMed] [Google Scholar]
- 7.Gatenby R & Brown J The evolution and ecology of resistance in cancer therapy. Cold Spring Harb. Perspect. Med 10, a040972 (2020). [DOI] [PMC free article] [PubMed] [Google Scholar]
- 8.Bourguet D et al. Heterogeneity of selection and the evolution of resistance. Trends Ecol. Evol 28, 110–118 (2013). [DOI] [PubMed] [Google Scholar]
- 9.Tabashnik BE, Brévault T & Carrière Y Insect resistance to Bt crops: lessons from the first billion acres. Nat. Biotechnol 31, 510–521 (2013). [DOI] [PubMed] [Google Scholar]
- 10.Cunningham JJ A call for integrated metastatic management. Nat. Ecol. Evol 3, 996–998 (2019). [DOI] [PubMed] [Google Scholar]
- 11.Bacevic K Spatial competition constrains resistance to targeted cancer therapy. Nat. Commun 8, 1995 (2017). [DOI] [PMC free article] [PubMed] [Google Scholar]
- 12.Silva AS et al. Evolutionary approaches to prolong progression-free survival in breast cancer. Cancer Res. 72, 6362–6370 (2012). [DOI] [PMC free article] [PubMed] [Google Scholar]
- 13.Enriquez-Navas PM et al. Exploiting evolutionary principles to prolong tumor control in preclinical models of breast cancer. Sci. Transl. Med 8, 327ra24 (2016). [DOI] [PMC free article] [PubMed] [Google Scholar]
- 14.Monro HC & Gaffney EA Modelling chemotherapy resistance in palliation and failed cure. J. Theor. Biol 257, 292–302 (2009). [DOI] [PubMed] [Google Scholar]
- 15.Carrère C Optimization of an in vitro chemotherapy to avoid resistant tumours. J. Theor. Biol 413, 24–33 (2017). [DOI] [PubMed] [Google Scholar]
- 16.Gallaher JA, Enriquez-Navas PM, Luddy KA, Gatenby RA & Anderson ARA Spatial heterogeneity and evolutionary dynamics modulate time to recurrence in continuous and adaptive cancer therapies. Cancer Res. 78, 2127–2139 (2018). [DOI] [PMC free article] [PubMed] [Google Scholar]
- 17.Hansen E, Woods RJ & Read AF How to use a chemotherapeutic agent when resistance to it threatens the patient. PLoS Biol. 15, e2001110 (2017). [DOI] [PMC free article] [PubMed] [Google Scholar]
- 18.Cunningham JJ, Brown JS, Gatenby RA & Staňková K Optimal control to develop therapeutic strategies for metastatic castrate resistant prostate cancer. J. Theor. Biol 459, 67–78 (2018). [DOI] [PubMed] [Google Scholar]
- 19.West J, Ma Y & Newton PK Capitalizing on competition: an evolutionary model of competitive release in metastatic castration resistant prostate cancer treatment. J. Theor. Biol 455, 249–260 (2018). [DOI] [PMC free article] [PubMed] [Google Scholar]
- 20.Pouchol C, Clairambault J, Lorz A & Trélat E Asymptotic analysis and optimal control of an integro-differential system modelling healthy and cancer cells exposed to chemotherapy. J. Math. Pures Appl 116, 268–308 (2018). [Google Scholar]
- 21.Carrère C & Zidani H Stability and reachability analysis for a controlled heterogeneous population of cells. Optim. Control Appl. Methods 41, 1678–1704 (2020). [Google Scholar]
- 22.Greene JM, Sanchez-Tapia C & Sontag ED Mathematical details on a cancer resistance model. Front. Bioeng. Biotechnol 8, 501 (2020). [DOI] [PMC free article] [PubMed] [Google Scholar]
- 23.Martin RB, Fisher ME, Minchin RF & Teo KL Low-intensity combination chemotherapy maximizes host survival time for tumors containing drug-resistant cells. Math. Biosci 110, 221–252 (1992). [DOI] [PubMed] [Google Scholar]
- 24.Gerlee P The model muddle: in search of tumor growth laws. Cancer Res. 73, 2407–2411 (2013). [DOI] [PubMed] [Google Scholar]
- 25.Noble R, Burri D, Kather JN & Beerenwinkel N Spatial structure governs the mode of tumour evolution. Preprint at bioRxiv 10.1101/586735 (2019). [DOI] [PMC free article] [PubMed] [Google Scholar]
- 26.Hansen E & Read AF Cancer therapy: attempt cure or manage drug resistance? Evol. Appl 13, 1660–1672 (2020). [DOI] [PMC free article] [PubMed] [Google Scholar]
- 27.Enriquez-Navas PM, Wojtkowiak JW & Gatenby RA Application of evolutionary principles to cancer therapy. Cancer Res. 75, 4675–4680 (2015). [DOI] [PMC free article] [PubMed] [Google Scholar]
- 28.Gatenby RA & Brown JS Integrating evolutionary dynamics into cancer therapy. Nat. Rev. Clin. Oncol 17, 675–686 (2020). [DOI] [PubMed] [Google Scholar]
- 29.Strobl MAR et al. Turnover modulates the need for a cost of resistance in adaptive therapy. Cancer Res. 10.1158/0008-5472.CAN-20-0806 (2020). [DOI] [PMC free article] [PubMed] [Google Scholar]
- 30.Bozic I et al. Evolutionary dynamics of cancer in response to targeted combination therapy. eLife 2, e00747 (2013). [DOI] [PMC free article] [PubMed] [Google Scholar]
- 31.Pérez-García VM et al. Universal scaling laws rule explosive growth in human cancers. Nat. Phys 16, 1232–1237 (2020). [DOI] [PMC free article] [PubMed] [Google Scholar]
- 32.Greene JM, Gevertz JL & Sontag ES Mathematical approach to differentiate spontaneous and induced evolution to drug resistance during cancer treatment. JCO Clin. Cancer Inform 3, CCI.18.00087 (2019). [DOI] [PMC free article] [PubMed] [Google Scholar]
- 33.Kuosmanen T et al. Drug-induced resistance evolution necessitates less aggressive treatment. Preprint at bioRxiv 10.1101/2020.10.07.330134 (2020). [DOI] [PMC free article] [PubMed] [Google Scholar]
- 34.Fusco D, Gralka M, Kayser J, Anderson A & Hallatschek O Excess of mutational jackpot events in expanding populations revealed by spatial Luria–Delbrück experiments. Nat. Commun 7, 12760 (2016). [DOI] [PMC free article] [PubMed] [Google Scholar]
- 35.Mistry HB Evolutionary based adaptive dosing algorithms: beware the cost of cumulative risk. Preprint at bioRxiv 10.1101/2020.06.23.167056 (2020). [DOI] [Google Scholar]
- 36.Benzekry S et al. Classical mathematical models for description and prediction of experimental tumor growth. PLoS Comput. Biol 10, e1003800 (2014). [DOI] [PMC free article] [PubMed] [Google Scholar]
- 37.Vaghi C et al. Population modeling of tumor growth curves and the reduced Gompertz model improve prediction of the age of experimental tumors. PLoS Comput. Biol 16, e1007178 (2020). [DOI] [PMC free article] [PubMed] [Google Scholar]
- 38.Hansen E, Karslake J, Woods RJ, Read AF & Wood KB Antibiotics can be used to contain drug-resistant bacteria by maintaining sufficiently large sensitive populations. PLoS Biol. 18, e3000713 (2020). [DOI] [PMC free article] [PubMed] [Google Scholar]
- 39.Soetaert KER, Petzoldt T & Setzer RW Solving differential equations in R : package deSolve. J. Stat. Softw 33, 9 (2010). [Google Scholar]
Associated Data
This section collects any data citations, data availability statements, or supplementary materials included in this article.
Supplementary Materials
Data Availability Statement
No datasets were generated or analysed during the current study.


