

Abstract
Background:
Access to health care (HC) services is important for promoting and maintaining health, preventing and managing disease, reducing unnecessary disability and premature death, and achieving health equity for all persons.
Objectives:
We assess social indicators among people living in Arizona that are associated with access, use, and barriers to seeking HC services.
Research Design:
We analyzed data (n = 8073) from the 2018 Behavioral Risk Factor Surveillance System (BRFSS) to describe demographic and health characteristics among persons by HC access and use, and for whom costs were a barrier to seeking care.
Results:
Among Arizona adults, 13.5% reported lacking HC coverage, 28.7% reported lacking a personal doctor, and medical costs were a barrier to seeking care for 14.1%. Arizonans aged 18–34 years or with a high school education or less more often reported lacking HC coverage, a personal doctor, or not visiting a doctor because of costs. Past year medical and dental checkups were less common among less educated (≤ high school) and never married persons. Hispanic persons more often reported lacking HC coverage or not visiting a doctor because of costs, and less often reported past year dental checkups.
Conclusions:
BRFSS can be analyzed to identify and quantify unique HC disparities, and the findings can serve as the basis for improving HC in communities. Expansion of HC services and providers may be achieved, in part, through incentives for providers to work in designated health professional shortage areas and/or leveraging telehealth/telemedicine in rural and urban underserved communities.
Keywords: health equity, disparities, population health, population survey, healthcare
Access to health care (HC) services is important for promoting and maintaining health, preventing and managing disease, reducing unnecessary disability and premature death, and achieving health equity for all persons.1,2 The landscape of HC services in Arizona is unique with regards to communities, populations, and geography. Arizona expanded Medicaid eligibility (2014),3,4 increased availability of HC through discounted/sliding scale clinics and additional providers,5 and has the second largest US American Indian/Alaska Natives (AI/AN) population6 (for whom a large proportion, HC is delivered by Indian Health Service) but still has a higher percentage of uninsured persons than nationally.7 Arizona also continues to experience a shortage of medical providers for a variety of reasons.8 Accessing services requires health insurance, accessing a service provider location, and finding a provider with whom the patient can communicate.9–11 Barriers to accessing HC can lead to unmet health needs, delays in receiving care, inability to get preventive services, financial burdens, and preventable hospitalizations.12–15 HC access varies by demographic characteristics,2,16 and lower socioeconomic status (SES) are disproportionately uninsured.17–21
People who did not have health insurance increased from 2017 to 2018 in the United States (7.9%–8.5%, or ~27.5 million) and in Arizona (10.1%–10.6%, or ~750,000).7 Low-income families (< $25,000) are twice as likely to lack health insurance as high-income families (> $75,000).7 There is a clear and established relationship between poverty, SES, and health outcomes,22,23 including disease and premature death risks.20,24 Approximately 1 million (14%) Arizonans live in poverty (2018); 33% are 18 years or younger and 11% are 65 years or older.25 In Arizona, persons living in poverty are disproportionately AI/AN, Hispanic, and Black.25
Higher income is associated with greater longevity and life expectancy; however, this varies substantially across geographic areas and is correlated with health behaviors and local area characteristics.26 The uniqueness of Arizona population, coupled with higher percentages of uninsured than the nation, warranted a state-specific analysis to assess social indicators (eg, demographics, employment, income) among people living in Arizona that are associated with access, use, and barriers to seeking HC services.
METHODS
An analysis was completed of cross-sectional data from the Arizona 2018 Behavioral Risk Factor Surveillance System (BRFSS, administered January–December, 2018), a representative, state-based telephone survey (N = 8073).27 Response rate was 53.5%.27
HC Measures
HC services access was assessed via: (1) HC coverage, including health insurance, prepaid plans, or government plans, and (2) personal doctor or HC provider. Utilization of HC services was assessed via: (1) months since they last visited a doctor for a routine checkup, and (2) months since they visited a dentist/dental clinic for any reason. Persons reported whether during the past 12 months they needed to see a doctor but could not because of costs.
Health Characteristics
Persons described their general health as either excellent, very good, good, fair, or poor and were how many days during the past 30 their physical and mental health was not good. We compared HC measures previously described with those who described their general health as good, very good, or excellent (vs. fair or poor), and who reported 14 or more days (vs. fewer than 14 d) of poor physical or mental health (consistent with previous research).28
Demographic Characteristics
The following sociodemographic characteristics were examined: sex, age, race/ethnicity, education, marital status, employment, and household income.
Statistical Analysis
Institutional review board approval wasn’t required for these secondary data analyses. Analyses completed using SAS survey procedures (version 9.4, Cary, NC) to account for BRFSS complex sampling design. All prevalence estimates were weighted to provide population-based, direct age-adjusted estimates to the 2000 projected US population.29 Sensitivity analyses were executed including and excluding persons aged 65+; results were not meaningfully different thus included them in all analyses. The 95% confidence intervals (CIs) are presented to allow for comparisons among prevalence estimates without specifying a referent group. Differences were considered statistically meaningful if strata CIs for the same indicator did not overlap.30 Odds ratios were adjusted for demographic factors to determine how access, use, and barriers to care affect health status. Best-fit models were determined through backward deletion until all variables had a P-value ≤ 0.20.
RESULTS
Of 8073 respondents (total Arizona weighted sample N = 5,478,527) who participated, 13.5% reported lacking HC coverage and 28.7% reported lacking a personal doctor (Fig. 1). Persons aged 18–54 years reported lacking HC coverage or a personal doctor more than persons aged 55–64 and 65+. Hispanic groups reported lacking HC coverage more than non-Hispanic White, AI/AN, or other racial/ethnic groups. Lacking HC coverage or a personal doctor was reported more by persons with a high school education or less than by persons with more than a high school education. Unemployed persons reported lacking a personal doctor more than employed and persons not in the labor market. Persons with a household income of <$35,000 reported lacking HC coverage more than persons with a household income of $50,000 or more. Persons with a household income of < $35,000 reported lacking a personal doctor more than persons with a household income of $75,000 or more.
FIGURE 1.
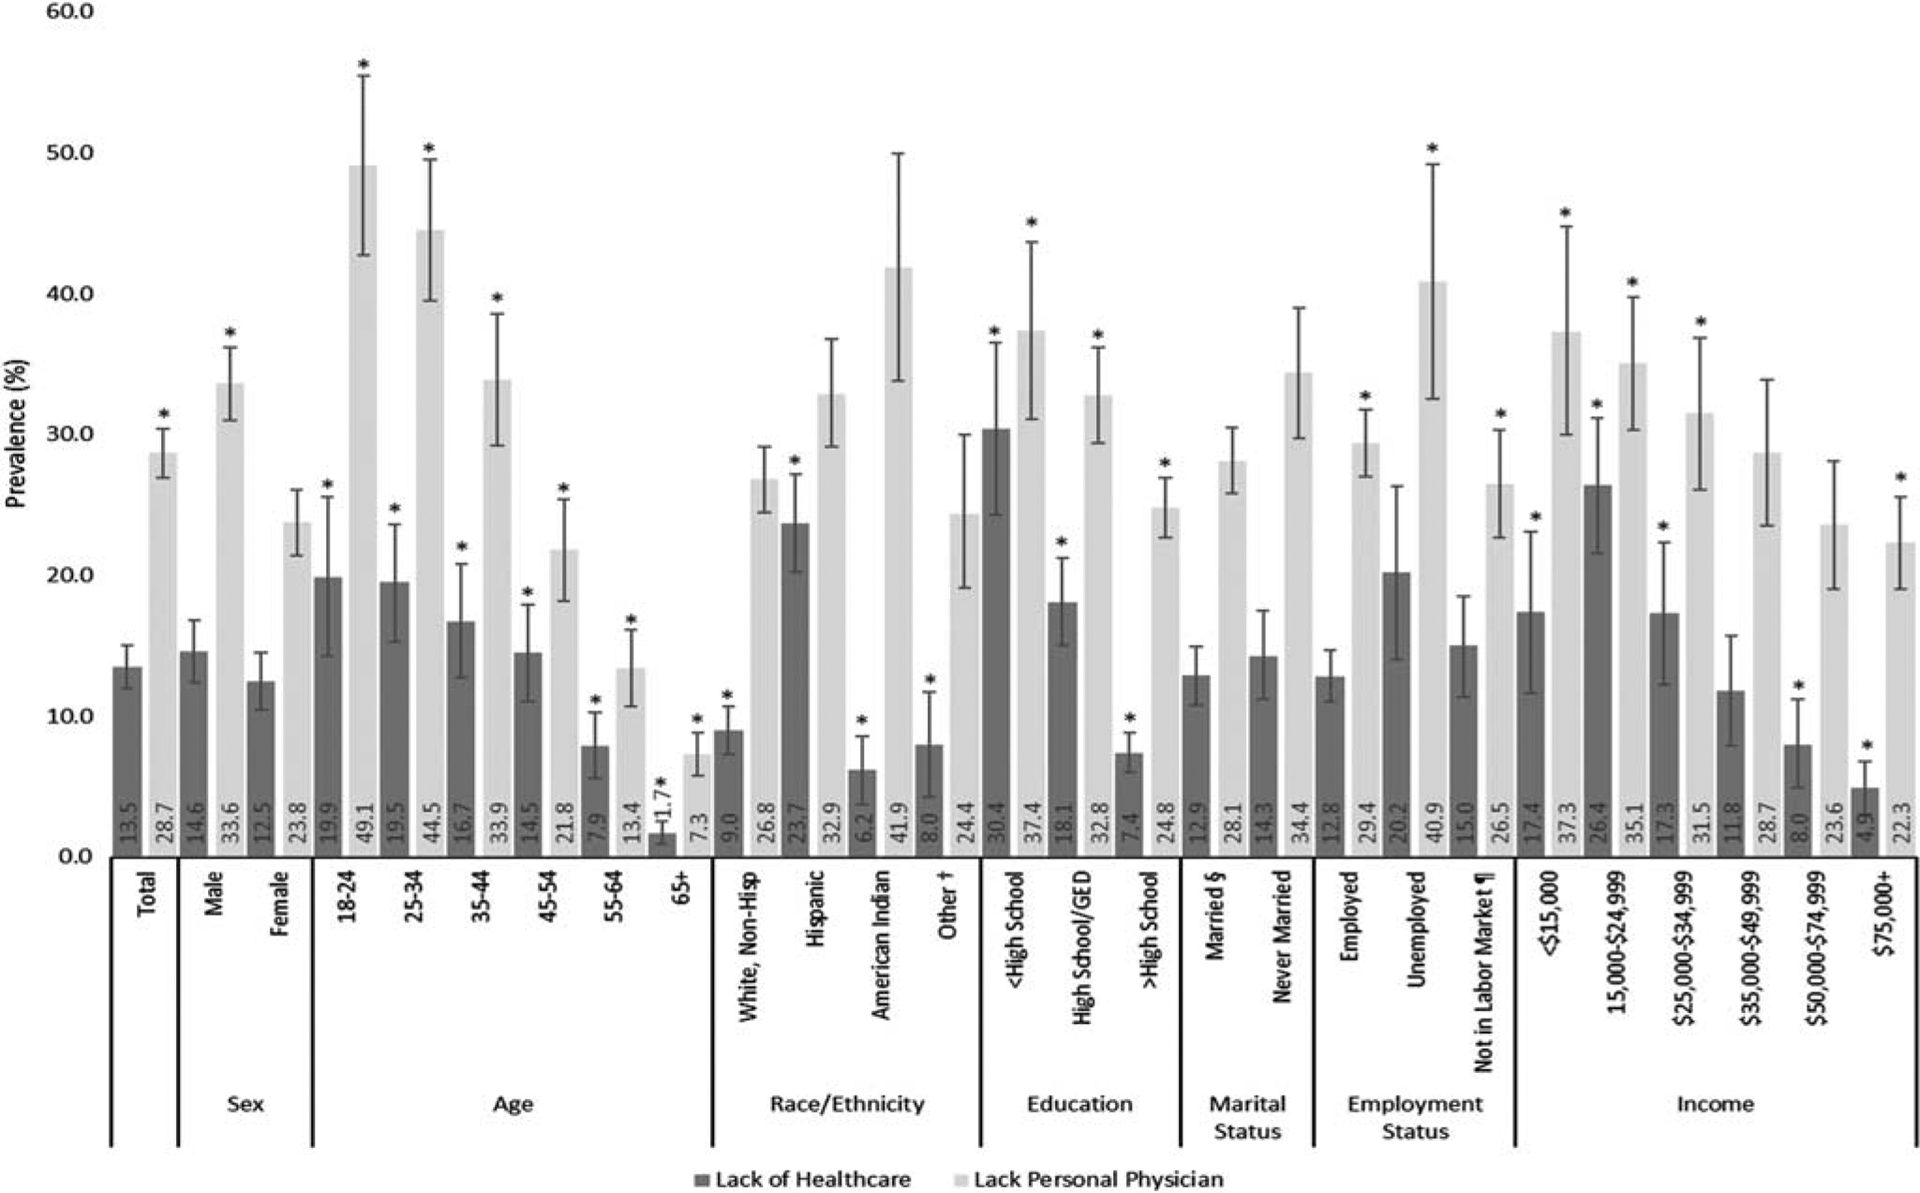
Age-adjusted prevalence estimates‡ and 95% confidence intervals of lacking any form of health care coverage (n = 610; N = 679,473) or a personal physician (n = 1658; N = 1,435,150) among adults overall, and by demographic variables in Arizona, 2018. *Significant difference between strata (P < 0.05). †Includes African American, Asian/Pacific Islander, multi-races. ‡Age adjustment to the 2000 projected US population for selected age distributions (18–24, 25–44, 45–64, 65+); age adjustment does not apply to the prevalence by age group. §Including members of unmarried couple and previously married (divorced, widowed, separated). ¶Includes homemaker, student, retired, and unable to work.
Some Arizona adults did not report a past year routine doctor checkup (27.5%, n=1704) or dental visit (37.8%, n=2816; Fig. 2). Men did not report a past year doctor checkup more than women. Persons aged 18–54 years did not report a past year doctor checkup more than persons aged 55–64 and 65+. Persons with a high school education or less did not report a past year doctor checkup more than persons with a high school education or more. Persons with a high school education did not report a past year dental checkup more than persons with more than a high school education. Never married persons did not report a past year doctor checkup or dental visit more than married persons. Employed persons did not report a past year doctor checkup more than persons not in the labor market. Unemployed persons did not report a past year dental visit more than employed persons. Persons with an income of <$25,000 did not report a past year dental visit more than persons with an income of $35,000 or more.
FIGURE 2.
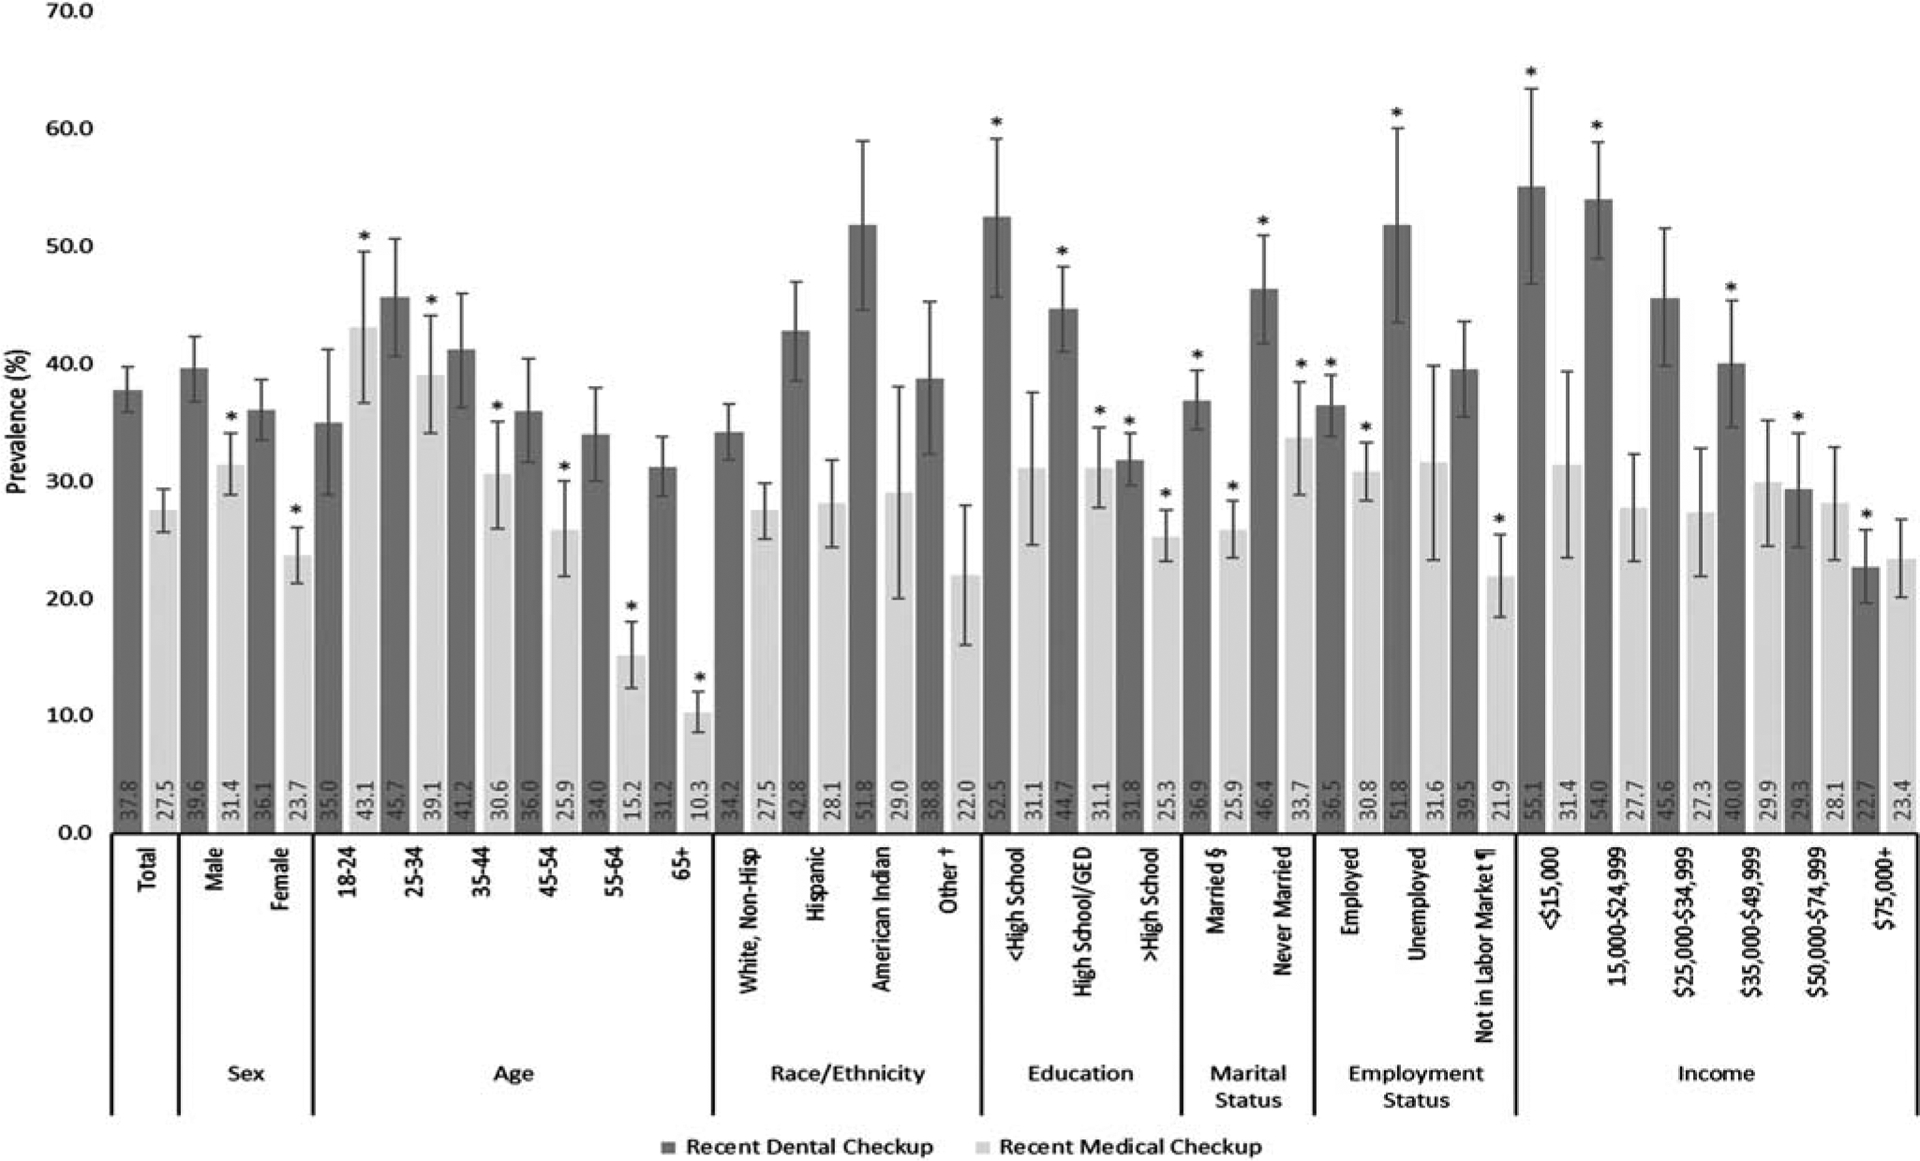
Age-adjusted prevalence estimates‡ and 95% confidence intervals of not reporting a visit to a doctor for routine checkup (n = 1704; N = 1,384,720) or a visit to a dentist or dental clinic (n = 2816; N = 1,986,736) within the past year among adults overall, and by demographic variables in Arizona, 2018. *Significant difference between strata (P < 0.05).). †Includes African American, Asian/Pacific Islander, multi-races. ‡Age adjustment to the 2000 projected US population for selected age distributions (18–24, 25–44, 45–64, 65+); age adjustment does not apply to the prevalence by age group. §Including members of unmarried couple and previously married (divorced, widowed, separated). ¶Includes homemaker, student, retired, and unable to work.
Medical costs limited a visit to the doctor for 14.1% (n = 861) of persons (Fig. 3). Persons aged 65+ years reported cost as a barrier to seeking care less than persons aged 18–64 years. Hispanic persons reported cost as a barrier to seeking care more than non-Hispanic White and AI/AN persons. Persons with a high school education or less reported cost as a barrier to seeking care more than persons with more than a high school education. Persons with an income of $15,000–$24,999 reported cost as a barrier to seeking care more than persons with an income of $35,000 or more.
FIGURE 3.
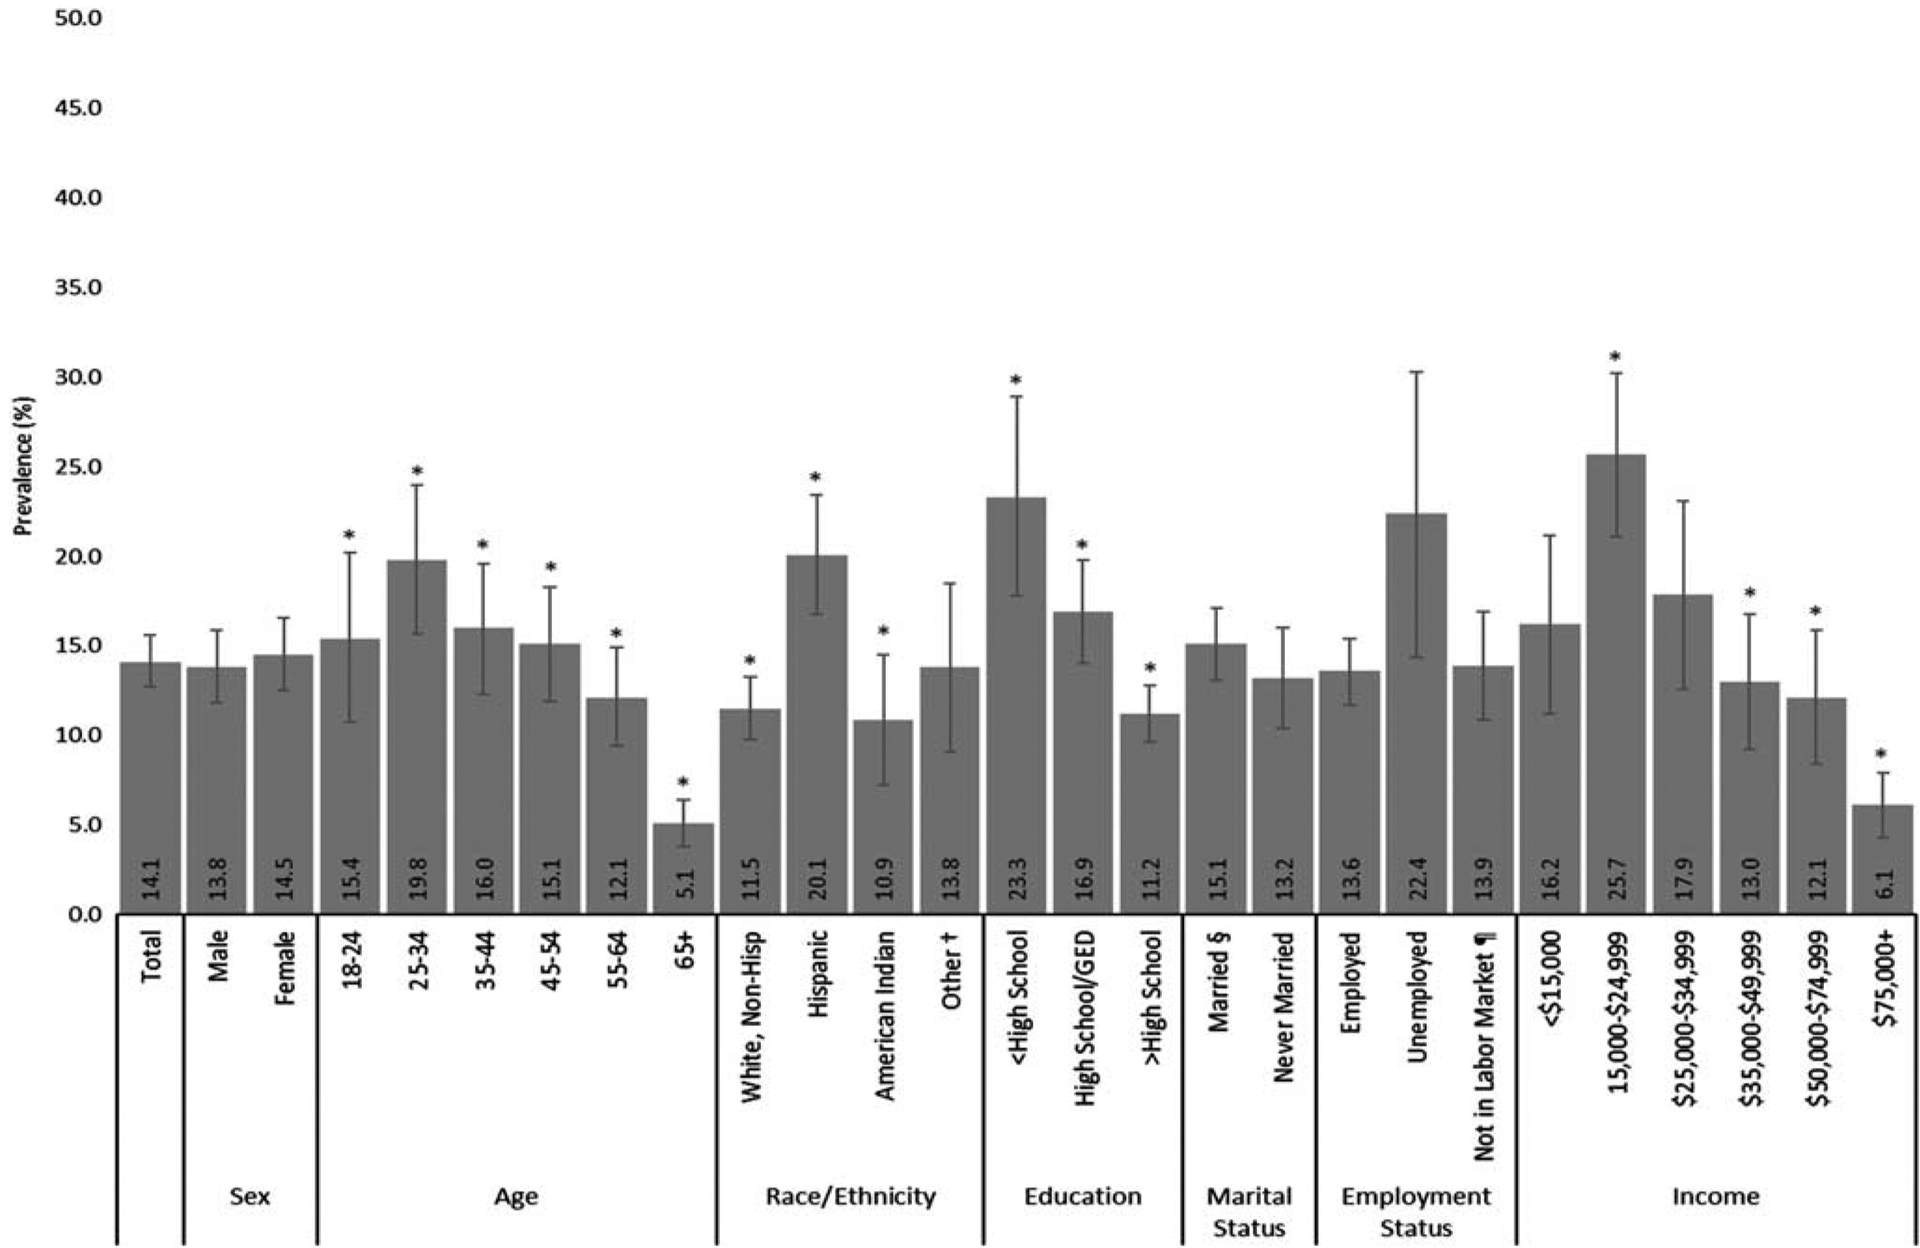
Age-adjusted prevalence estimates‡ and 95% confidence intervals of needing to see a doctor but could not because of cost among adults overall, and by demographic variables in Arizona, 2018 (n = 861; N = 728,689). *Significant difference between strata (P < 0.05). †Includes African American, Asian/Pacific Islander, multi-races. ‡Age adjustment to the 2000 projected US population for selected age distributions (18–24, 25–44, 45–64, 65+); age adjustment does not apply to the prevalence by age group. §Including members of unmarried couple and previously married (divorced, widowed, separated). ¶Includes homemaker, student, retired, and unable to work.
The odds of good or better health was significantly lower among persons who have not had a recent dental visit [odds ratio (OR): 0.65, 95% CI: 0.5–0.8) compared with those who have had a recent dental visit or who needed to see a doctor but couldn’t because of costs (OR: 0.37, 95% CI: 0.3–0.5) compared with those who did not report costs were a barrier to seeking care (Fig. 4). The odds of reporting 14+ days of poor physical health were significantly lower among persons who lack a personal physician (OR: 0.64, 95% CI: 0.4–0.9) compared with those who did not lack a personal physician or who have not had a past year doctor checkup (OR: 0.54, 95% CI: 0.4–0.8) compared with those who have had a past year doctor checkup, and significantly higher among persons who needed to see a doctor but could not because of costs (OR: 2.66, 95% CI: 1.9–3.7) compared with those who did not report costs were a barrier to seeking care. The odds of reporting 14+ days of poor mental health were significantly higher among persons who have not had a recent dental visit (OR: 1.44, 95% CI: 1.1–1.9) compared with those who have had a recent dental visit or who needed to see a doctor but could not because of costs (OR: 2.42, 95% CI: 1.7–3.4) compared with those who did not report costs were a barrier to seeking care.
FIGURE 4.
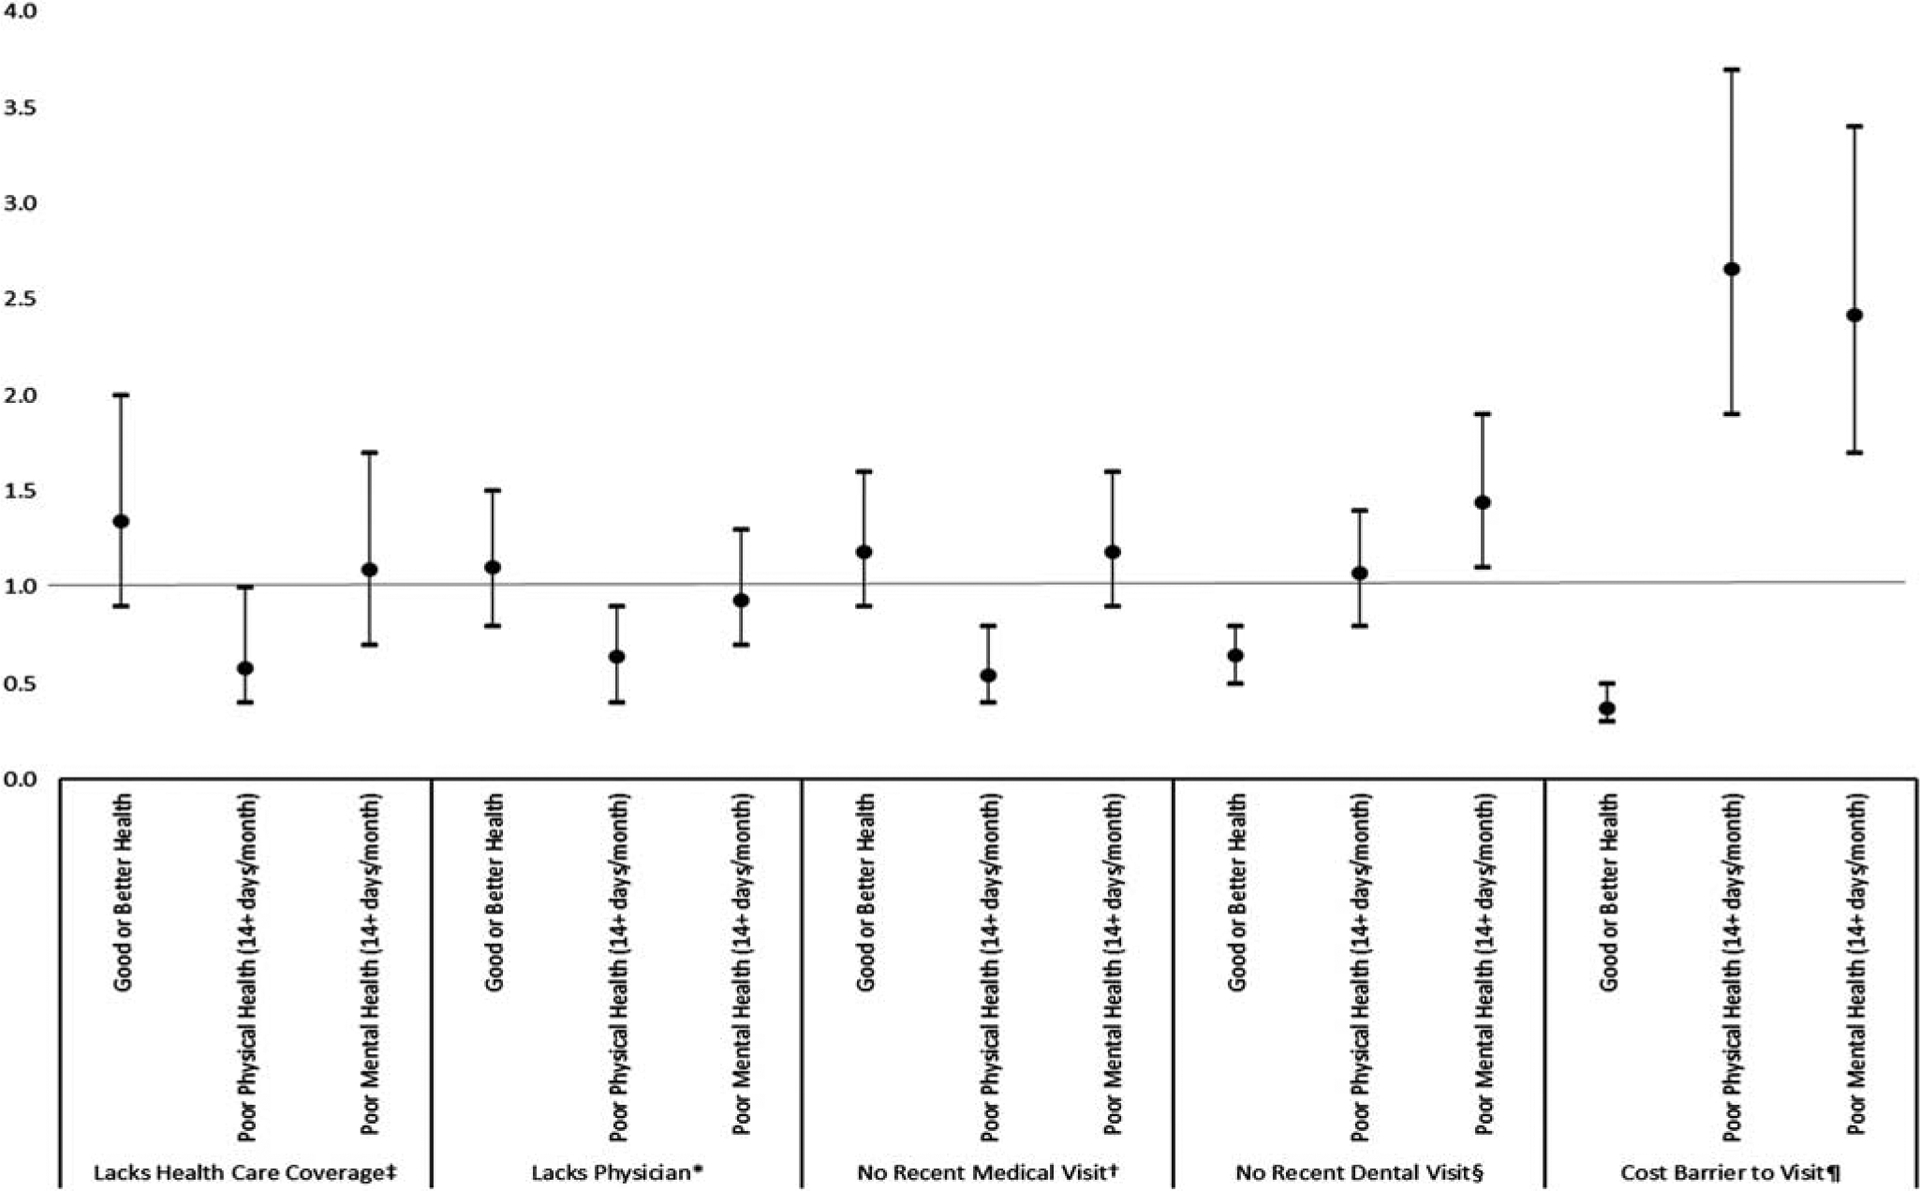
Adjusted odds ratios and 95% confidence intervals of the association between access or use of health care and general health measures among adults in Arizona, 2018. *Referent = adults with a physician. Adjusted for sex, age, education, employment, income. †Referent = adults with a medical visit in past 12 months. Adjusted for sex, age, education, marital status, employment. ‡Referent = adults with health care coverage. Adjusted for age, race/ethnicity, education, income. §Referent = adults with a dental visit in past 12 months. Adjusted for race/ethnicity, education, marital status, employment. ¶Referent = adults for whom cost was not barrier to doctor visit. Adjusted for age, race/ethnicity, education, income.
DISCUSSION
Adverse social, economic, and environmental factors are linked to worse HC access, use, and health outcomes.19,26,31 People with lower SES die earlier and have more disability than those with higher SES.26,32–37 Improving population health and reducing disease requires addressing public health and economic health efforts together. Compared with the United States, Arizonans are more likely to report lacking HC coverage, a personal doctor, past year medical and dental checkups, and not visiting a doctor because of costs.27
Several factors influence HC service utilization, including need, awareness, and access. Significant differences in recent medical HC were observed and support previous findings; men,38,39 younger adults,40 less educated,41 and unmarried persons42 have lower utilization rates. Differences were not observed by race/ethnicity or income, despite contrary previous research.43 Less utilization by employed persons could be explained by the higher proportion of 65+ aged persons “not in the labor market” (49%) compared with those employed (6%). Elderly utilize more care and experience fewer barriers.44 Reporting fewer poor physical health days among persons lacking a personal physician or who have not had a past year doctor checkup may be attributable to lower perceived need to seek HC among younger or more resilient persons.45 The relationship between general health and mental health is reciprocal. Findings of lacking dental care and poorer general health and mental health concur with evidence demonstrating patients with poor mental health are less likely to take care of physical and oral health.46
In this study, persons not visiting a doctor because of costs differed by age, ethnicity, education, and income. Low SES (eg, income, education, employment) is an obstacle to receiving timely and appropriate HC.47 Proportions of Hispanics in Arizona48 and United States47 classified as low SES is considerably higher than non-Hispanic Whites. Medicaid expansion increased insurance coverage and affordability, and while there were favorable effects for all racial/ethnic groups, non-Hispanic whites benefitted most.4 Low-income persons with or without HC insurance may forgo HC because of costs19 and are less likely to receive recommended preventive screenings.49 Health Professional Shortage Areas (HPSA) are geographic areas, population groups, or HC facilities designated (for 3 y) as having a health professional shortage. This can improve HC access for underserved communities and vulnerable populations (eg, in Arizona: AI/AN, Hispanic, Rural). Arizona assists facilities and regions to proactively identify, request, and update HPSA designations (eg, Federally Qualified Health Centers, Indian Health, Tribal Facilities) and encourages them to work with community partners/organizations to ensure provider counts and needs are up-to-date to bolster incentive programs for providers to work in HPSAs, and increase providers that offer services to uninsured individuals on a discounted sliding fee scale, accept Medicare, Medicaid and Children’s Health Insurance Program, and facilitate public insurance enrollment. Telehealth/telemedicine can improve access to care in both rural and urban underserved communities. In March 2020 (in response to the COVID-19 pandemic) use was expanded by a governmental executive order in Arizona; and the sliding fee map finder was broadened to include statewide safety net sites offering telehealth/telemedicine services. Continued telehealth expansion (eg, among AI/AN) may further increase HC access; however, infrastructure and technology improvements are needed in many areas.50
Our study is subject to limitations. First, BRFSS data are self-reported and subject to limitations associated with these data collection instrument types. Measures to capture insurance status, use of care, and barriers to seeking care were brief. However, the reliability and validity of BRFSS has been established. Second, cross-sectional data does not allow for determining temporality of relationships between SES factors, HC measures, and health outcomes examined. Third, although Arizona BRFSS collects county-level data, the large size and heterogeneity of each population limited approximating urban/rural or metropolitan/non-metropolitan differences.
Analyzing data from the Arizona BRFSS, we were able to identify and quantify HC disparities unique to our state. These data are readily accessible, and other states can utilize them as a basis for improving HC and HC policy in their communities.
Footnotes
The findings and conclusions in this report are those of the authors and do not necessarily represent the official position of the Centers for Disease Control and Prevention or the Arizona Department of Health Services. These findings have not been presented elsewhere.
The authors declare no conflict of interest.
REFERENCES
- 1.Institute of Medicine (US) Committee on Monitoring Access to Personal Health Care Services. Millman M Recommendations and future steps. Access to Health Care in America. Washington, DC: National Academies Press; 1993:137–144. [PubMed] [Google Scholar]
- 2.Agency for Healthcare Research and Quality. Access and disparities in access to health care. 2018. Available at: https://www.ahrq.gov/research/findings/nhqrdr/nhqdr15/access.html. Accessed July 3, 2020.
- 3.Yan LD, Ali MK, Strombotne KL. Impact of expanded Medicaid eligibility on the diabetes continuum of care among low-income adults: a difference-in-differences analysis. Am J Prev Med. 2021;60:189–197. [DOI] [PMC free article] [PubMed] [Google Scholar]
- 4.Yue D, Zhu Y, Rasmussen PW, et al. Coverage, affordability, and care for low-income people with diabetes: 4 years after the Affordable Care Act’s Medicaid expansions. J Gen Intern Med. 2020;35:2222–2224. [DOI] [PMC free article] [PubMed] [Google Scholar]
- 5.Arizona Department of Health Services. Health systems development. Available at: https://www.azdhs.gov/prevention/health-systems-development/index.php. Accessed August 31, 2021.
- 6.US Census Bureau. Quick Facts, United States; Arizona. Available at: https://www.census.gov/quickfacts/fact/table/US,AZ/SBO050212. Accessed December 2, 2020. [Google Scholar]
- 7.US Census Bureau. Health insurance coverage in the United States: 2018. Available at: census.gov/content/dam/Census/library/publications/2019/demo/p60-267.pdf. Accessed June 1, 2020.
- 8.Koch B, Coates S, Campos-Outcalt D, et al. Arizona Primary Care Physician Workforce Report. Arizona Center for Rural Health and the Arizona Area Health Education Center at the University of Arizona Health Sciences. Available at: https://uahs.arizona.edu/sites/default/files/2019_az_primary_care_physician_workforce_report.pdf. Accessed August 20, 2021. [Google Scholar]
- 9.Durham J, Owen P, Bender B, et al. Self-assessed health status and selected behavioral risk factors among persons with and without health-care coverage—United States, 1994–1995. MMWR Morb Mortal Wkly Rep. 1998;47:176–180. [PubMed] [Google Scholar]
- 10.Hadley J Insurance coverage, medical care use, and short-term health changes following an unintentional injury or the onset of a chronic condition. JAMA. 2007;297:1073–1084. [DOI] [PubMed] [Google Scholar]
- 11.Institute of Medicine. Insuring America’s health: principles and recommendations. Acad Emerg Med. 2004;11:418–422. [DOI] [PubMed] [Google Scholar]
- 12.De Maeseneer JM, De Prins L, Gosset C, et al. Provider continuity in family medicine: does it make a difference for total health care costs? Ann Fam Med. 2003;1:144–148. [DOI] [PMC free article] [PubMed] [Google Scholar]
- 13.Ettner SL. The timing of preventive services for women and children: the effect of having a usual source of care. Am J Public Health. 1996;86:1748–1754. [DOI] [PMC free article] [PubMed] [Google Scholar]
- 14.Phillips R, Proser M, Green L. The importance of having health insurance and a usual source of care. Am Fam Physician. 2004;70:1035. [PubMed] [Google Scholar]
- 15.Starfield B, Shi L. The medical home, access to care, and insurance: a review of evidence. Pediatrics. 2004;113(suppl):1493–1498. [PubMed] [Google Scholar]
- 16.Institute of Medicine. Hidden costs, value lost: uninsurance in America. Available at: 10.17226/10719. Accessed July 3, 2020. [DOI]
- 17.Meyer DR, Wallace GL. Poverty levels and trends in comparative perspective. Institute for Research on Poverty. Available at: https://www.irp.wisc.edu/publications/focus/pdfs/foc262b.pdf. Accessed June 24, 2020. [Google Scholar]
- 18.Mood C, Jonsson JO. The social consequences of poverty: an empirical test on longitudinal data. Soc Indic Res. 2016;127:633–652. [DOI] [PMC free article] [PubMed] [Google Scholar]
- 19.Okoro CA, Zhao G, Fox JB, et al. Surveillance for health care access and health services use, adults aged 18–64 years—behavioral risk factor surveillance system, United States, 2014. MMWR Surveill Summ. 2017;66:1–42. [DOI] [PMC free article] [PubMed] [Google Scholar]
- 20.Singh GK, Siahpush M. Widening socioeconomic inequalities in US life expectancy, 1980–2000. Int J Epidemiol. 2006;35:969–979. [DOI] [PubMed] [Google Scholar]
- 21.US Census Bureau. Income and poverty in the United States: 2015. Available at: http://www.census.gov/content/dam/Census/library/publications/2016/demo/p60-256.pdf. Accessed September 1, 2020.
- 22.Brooks-Gunn J, Duncan GJ. The effects of poverty on children. Future Child. 1997;7:55–71. [PubMed] [Google Scholar]
- 23.Wagstaff A. Poverty and health sector inequalities. Bull World Health Organ. 2002;80:97–105. [PMC free article] [PubMed] [Google Scholar]
- 24.Braveman PA, Cubbin C, Egerter S, et al. Socioeconomic disparities in health in the United States: what the patterns tell us. Am J Public Health. 2010;100(suppl 1):S186–S196. [DOI] [PMC free article] [PubMed] [Google Scholar]
- 25.US Census Bureau. Poverty status in the past 12 months (TableID: S1701). Available at: http://data.census.gov/cedsci/table?q=poverty%20arizona&tid=ACSST1Y2018.S1701&hidePreview=false. Accessed August 3, 2020.
- 26.Chetty R, Stepner M, Abraham S, et al. The association between income and life expectancy in the United States, 2001–2014. JAMA. 6;315: 1750–1766. [DOI] [PMC free article] [PubMed] [Google Scholar]
- 27.Centers for Disease Control and Prevention. Behavioral Risk Factor Surveillance System (BRFSS). Available at: https://www.cdc.gov/brfss/index.html. Accessed February 9, 2019.
- 28.Shockey TM, Zack M, Sussell A. Health-related quality of life among US workers: variability across occupation groups. Am J Public Health. 2017;107:1316–1323. [DOI] [PMC free article] [PubMed] [Google Scholar]
- 29.Centers for Disease Control and Prevention. Behavioral Risk Factor Surveillance System direct age adjustment, 2016 BRFSS. Available at: https://www.cdc.gov/brfss/annual_data/2016/pdf/2016_DirAgeAdjDUsrsGde.pdf. Accessed December 3, 2018.
- 30.Tan SH, Tan SB. The correct interpretation of confidence intervals. Statistics. 2010;19:276–278. [Google Scholar]
- 31.Schroeder SA. Shattuck Lecture. We can do better—improving the health of the American people. N Engl J Med. 2007;357:1221–1228. [DOI] [PubMed] [Google Scholar]
- 32.Adler NE, Boyce WT, Chesney MA, et al. Socioeconomic inequalities in health. No easy solution. JAMA. 1993;269:3140–3145. [PubMed] [Google Scholar]
- 33.Isaacs SL, Schroeder SA. Class—the ignored determinant of the nation’s health. N Engl J Med. 2004;351:1137–1142. [DOI] [PubMed] [Google Scholar]
- 34.Marmot M Inequalities in health. N Engl J Med. 2001;345:134–136. [DOI] [PubMed] [Google Scholar]
- 35.McDonough P, Duncan GJ, Williams D, et al. Income dynamics and adult mortality in the United States, 1972 through 1989. Am J Public Health. 1997;87:1476–1483. [DOI] [PMC free article] [PubMed] [Google Scholar]
- 36.Minkler M, Fuller-Thomson E, Guralnik JM. Gradient of disability across the socioeconomic spectrum in the United States. N Engl J Med. 2006;355:695–703. [DOI] [PubMed] [Google Scholar]
- 37.Williams DR, Collins C. US socioeconomic and racial differences in health: patterns and explanations. Ann Rev Sociol. 1995;21:349–386. [Google Scholar]
- 38.Owens GM. Gender differences in health care expenditures, resource utilization, and quality of care. J Manag Care Pharm. 2008;14(suppl):2–6. [DOI] [PMC free article] [PubMed] [Google Scholar]
- 39.Salganicoff A, Ranji U, Beamesderfer A, et al. Women and Health Care in the Early Years of the Affordable Care Act. Kaiser Family Foundation. Available at: kff.org/wp-content/uploads/2014/05/8590-women-and-health-care-in-the-early-years-of-the-affordable-care-act.pdf. Accessed May 3, 2020. [Google Scholar]
- 40.National Center for Health Statistics (US). Health, United States, 2016: with chartbook on long-term trends in health. Available at: https://www.cdc.gov/nchs/data/hus/hus16.pdf. Accessed May 14, 2021. [PubMed]
- 41.Kaplan RM, Fang Z, Kirby J. Educational attainment and health outcomes: data from the Medical Expenditures Panel Survey. Health Psychol. 2017;36:598–608. [DOI] [PubMed] [Google Scholar]
- 42.Joung IM, van der Meer JB, Mackenbach JP. Marital status and health care utilization. Int J Epidemiol. 1995;24:569–575. [DOI] [PubMed] [Google Scholar]
- 43.van Rijn RM, Robroek SJ, Brouwer S, et al. Influence of poor health on exit from paid employment: a systematic review. Occup Environ Med. 2014;71:295–301. [DOI] [PubMed] [Google Scholar]
- 44.Kullgren JT, McLaughlin CG, Mitra N, et al. Nonfinancial barriers and access to care for US adults. Health Serv Res. 2012;47(pt 2):462–485. [DOI] [PMC free article] [PubMed] [Google Scholar]
- 45.Taber JM, Leyva B, Persoskie A. Why do people avoid medical care? A qualitative study using national data. J Gen Intern Med. 2015;30:290–297. [DOI] [PMC free article] [PubMed] [Google Scholar]
- 46.Kisely S No mental health without oral health. Can J Psychiatry. 2016;61:277–282. [DOI] [PMC free article] [PubMed] [Google Scholar]
- 47.Escarce JJ, Morales LS, Rumbaut RG. Access to and quality of health care. In: Tienda M, Mitchell F, eds. Hispanics and the Future of America The National Academies Collection: Reports Funded by National Institutes of Health. Washington, DC: National Academies Press; 2006:410–446. [Google Scholar]
- 48.Valdez LA, Langellier BA. Racial/ethnic and socioeconomic disparities in mental health in Arizona. Front Public Health. 2015;3:170. doi: 10.3389/fpubh.2015.00170 [DOI] [PMC free article] [PubMed] [Google Scholar]
- 49.McMorrow S, Kenney GM, Goin D. Determinants of receipt of recommended preventive services: implications for the Affordable Care Act. Am J Public Health. 2014;104:2392–2399. [DOI] [PMC free article] [PubMed] [Google Scholar]
- 50.eHealth Initiative Foundation. Maturing virtual care in tribal communities. Available at: https://files.constantcontact.com/24d46922601/c47b15cc-0cf6-4a05-85d1-086321d3df42.pdf. Accessed September 17, 2021.