Abstract
The history of click-speaking Khoe-San, and African populations in general, remains poorly understood. We genotyped ~2.3 million single-nucleotide polymorphisms in 220 southern Africans and found that the Khoe-San diverged from other populations ≥100,000 years ago, but population structure within the Khoe-San dated back to about 35,000 years ago. Genetic variation in various sub-Saharan populations did not localize the origin of modern humans to a single geographic region within Africa; instead, it indicated a history of admixture and stratification. We found evidence of adaptation targeting muscle function and immune response; potential adaptive introgression of protection from ultraviolet light; and selection predating modern human diversification, involving skeletal and neurological development. These new findings illustrate the importance of African genomic diversity in understanding human evolutionary history.
Genetic, anthropological, and archaeological studies provide substantial support for an African origin of modern humans, but the process by which modern humans arose has been vigorously debated (1, 2). African populations show the greatest genetic diversity, with genetic variation in Eurasia, Oceania and the Americas largely being a subset of the African diversity (3–6), with limited contribution from archaic humans (7). Within Africa, click-speaking southern African San and Khoe populations [“Khoe-San” from here on, following the San Council recommendations] harbor the deepest mitochondrial DNA lineages (5), have great genomic diversity (8–10), and probably represent the deepest historical population divergences among extant human populations (11, 12). However, African populations have been underrepresented in genome-wide studies of genetic diversity, including assessment of the ethnic diversity within the Khoe-San in southern Africa, where previous studies have focused either on single-locus markers (13) or a few individuals from one or two populations (3, 4, 8–10).
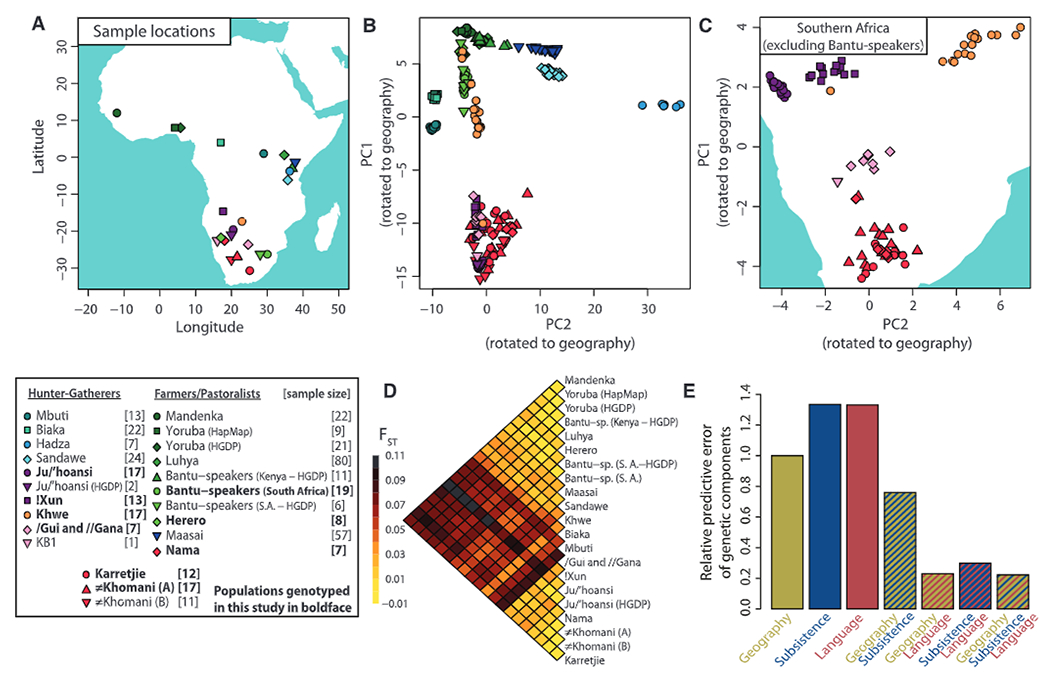
We genotyped, quality-filtered, and phased ~2.3 million single-nucleotide polymorphisms (SNPs) in 220 individuals representing 11 populations from southern Africa: Ju/’hoansi, !Xun, /Gui and //Gana, Karretjie People (hereafter “Karretjie”), #Khomani, Nama, Khwe, “Coloured” (Colesberg), “Coloured” (Wellington), Herero, and Bantu-speakers (South Africa) [Fig. 1A, (14), and table S4]. These data were analyzed together with published data (4, 9, 10, 15) after the removal of related and recently admixed individuals (14). To minimize the potential effect of ascertainment bias on results, we used several approaches that have previously been shown to be robust to these biases, including analyzing haplotypes, using minor allele frequency filtering within populations, and comparing results to available sequence data (14). In a principal components analysis (PCA), the first two PCs closely recapitulate many aspects of a geographic map of Africa [Fig. 1B, Procrustes correlation: 0.585, P < 10−5 (14)], with the first PC representing a north-south axis that separates southern African Khoe-San populations from other populations, and the second PC representing an east-west axis that separates east African populations (including Hadza and Sandawe hunter-gatherers) from central African hunter-gatherers (Mbuti and Biaka Pygmies) and Niger-Kordofanian speakers (Fig. 1B). In this two-dimensional representation of sub-Saharan genetic diversity, hunter-gatherer populations from southern, central, and eastern Africa constitute three extremes, respectively, of a scaffold, where the fourth extreme is represented by all Niger-Kordofanian–speaking groups from across the African continent. Although Niger-Kordofanian–speaking populations have been sampled from southern, eastern, and western Africa, they all cluster closely in the vicinity of West African populations (Fig. 1B), a consequence of the recent “Bantu expansion.” If Bantu-speaking populations are removed from the analysis, the correlation between the first two PCs and geography increases to 0.715 (P < 10−5). In addition to geography, genetic structure can also be correlated with language and subsistence strategies, and we assessed the capacity of these factors to predict genetic components in sub-Saharan Africa (14). Geography predicted genetic components better than either language or subsistence, but combining geographic information with subsistence and especially linguistic information improved the prediction (Fig. 1E), suggesting that all of these factors contribute to genetic structure in sub-Saharan Africa.
Fig. 1.

(A) Sampling locations. (B) PCA of African individuals showing PC1 and PC2 rotated to fit geography. (C) PCA for Khoe-San populations (~2.3 million SNPs). (D) Pairwise FST for sub-Saharan populations (excluding the Hadza; see fig. S24 for comparison). (E) Prediction of the genetic components from geographic, linguistic, and subsistence covariates. The predictive error relative to geography is given for each combination of covariates (values <1 show improved predictive capacity as compared to that of geography).
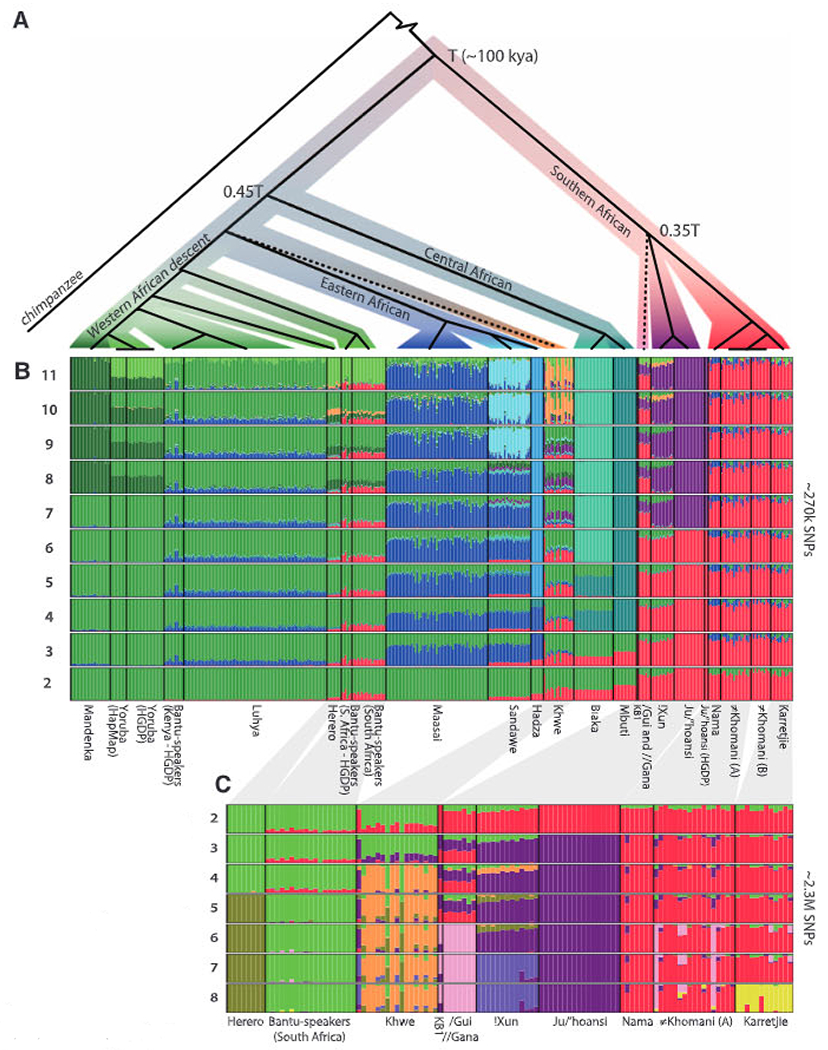
Genetic cluster analysis (16) showed substantial structure among sub-Saharan individuals and reiterated the substructure among Khoe-San populations, Niger-Kordofanian speakers, east African populations, and central African hunter-gatherers (Fig. 2B) (14). Increasing the number of allowed clusters distinguishes finer levels of population substructure (Fig. 2B), including distinct non-African ancestry components for individuals who self-identify as “Coloured” (figs. S16, S18, and S21). Within the Khoe-San group, there was a distinct separation of Northern San populations (Ju speakers: !Xun and Ju/’hoansi) and Southern Khoe-San populations [Tuu and Khoe speakers: Karretjie, #Khomani, and Nama; Figs. 1C and 2, B and C (14)]. Genetic differentiation (measured by Wright’s FST) between Northern San and Southern Khoe-San groups was ~0.015 to 0.025 (Fig. 1D and fig. S25), similar to that between Nilo-Saharan (Maasai) and Niger-Kordofanian (Yoruba) groups.
Fig. 2.

(A) Rooted population topology from a concordance-test approach (14). Nodes with boot-strap support <50% are collapsed (dashed lines); all other nodes have boot-strap support >85%. (B) Clustering of 403 sub-Saharan African individuals (~270,000 SNPs), assuming 2 to 11 clusters. (C) Clustering of 118 southern African individuals (~2.3 million SNPs), assuming 2 to 8 clusters. Compare with fig. S16, which includes recently admixed individuals.
Assuming a population divergence model, we reconstructed the demographic history of sub-Saharan populations using genealogical concordance (17), which is robust to substantial levels of recent admixture and genetic drift (14). The inferred population history resembled the population structure results (Figs. 1B and 2, B and C), and six of seven Khoe-San groups shared a common history that was separate from that of all other extant populations. This division forms the deepest divergence among extant humans (Fig. 2A and fig. S32), and assuming an effective population size (Ne) of 21,000 individuals (11, 12), the maximum likelihood divergence time is Ts = 0.083 × 2 Ne generations (95% maximum likelihood confidence interval: 0.075 to 0.091), corresponding to ~100,000 years ago (14), which is in agreement with previous estimates of 110,000 to 160,000 years ago (11, 12). The second deepest divergence involved central African pygmies and was estimated to be less than half of the deepest divergence time (0.45 Ts), and the subsequent population split involving East African hunter-gatherers and Maasai was even younger [compare with (6)]. The deep divergence between Northern and Southern Khoe-San groups corresponded to 25,000 to 43,000 years (14), which is similar to estimates between West Africans and Eurasians (11). Strict divergence models are unlikely to capture all features of human history; for instance, gene flow, which has probably been weak given the observed level of population structure but which was inferred even between isolated hunter-gatherer groups (12, 14), could affect these divergence estimates (11, 12, 14).
The origin and ancestry of the Khwe, who speak the “Central Khoisan” language Khoe-Kwadi, is uncertain (14). The genetic makeup of the Khwe was distinct from that of other Khoe-San groups [Fig. 2, (14), and fig. S5] but could be explained by high levels of (nonrecent) admixture between Bantu-speaking and Khoe-San groups. In contrast to the Khwe, the /Gui and //Gana, who also speak “Central Khoisan” languages, clustered with other Khoe-San groups but also formed a distinct group [Fig. 2 and fig. S5 (PC5)]. They had the third greatest level of private haplotypes among all sub-Saharan populations (figs. S42 and S43), despite the fact that the dense sampling of Khoe-San groups decreases private haplotypes in these groups. These observations show that the /Gui and //Gana represent a distinct San group. Furthermore, the only San individual (KB1) whose complete genome has been sequenced (9) was most closely related to the /Gui and //Gana (Figs. 1C and 2, B and C), despite the fact that this individual speaks a Southern San language (Tuu).
The Nama also speak a “Central Khoisan” language and are a Khoe group that traditionally had a pastoralist lifestyle, in contrast to the hunter-gatherer lifestyle of the San groups. The Nama showed great genetic similarity to the Southern San groups, such as the #Khomani and Karretjie (Figs. 1 and 2), and shared a small, but distinct, genetic ancestry component with East African groups, specifically the Maasai (Fig. 2B), and direct tests showed gene flow from the Maasai to the Nama (14). This “East African” component was also present at lower levels in the two #Khomani groups but was basically absent (<1%) from the !Xun, the Ju/’hoansi, and the /Gui and //Gana. The Nama also had a high frequency of a haplotype putatively associated with lactase persistence in the Maasai (14), which was rare in southern African Bantu-speakers, suggesting that lactase persistence in the Nama [50% in adults as compared to <10% in San groups (18)] has an East African origin (table S24). These observations support an East African connection for the Nama (14) and suggest that they originate from a Southern San group that adopted pastoralism with some introgression from an East African group that potentially brought pastoralist practices.
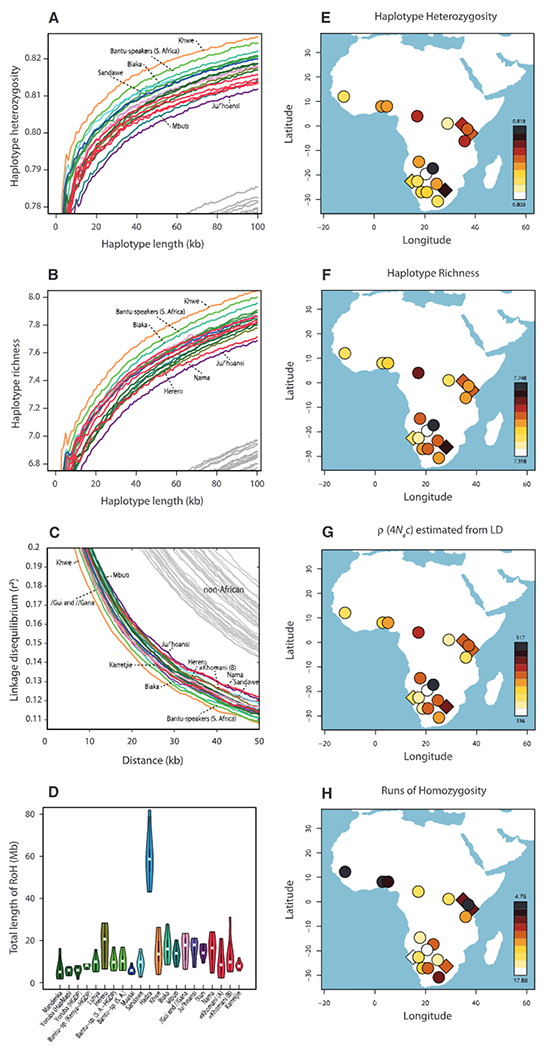
Greater levels of genetic diversity and lower levels of linkage disequilibrium (LD) have pin-pointed the origin of modern humans to sub-Saharan Africa (3, 19), and these patterns of African genetic variation have also been used to suggest a southern African origin (5, 10), although the fossil record suggests an East African origin (2). We characterized and contrasted four patterns of African genetic variation (Fig. 3) (14): haplotype heterozygosity, haplotype richness, genomic runs of homozygosity (RoHs), and LD measured by the squared correlation of allele frequencies (r2). Consistent with previous observations (3, 19), sub-Saharan populations have greater genetic diversity, lower levels of LD, and shorter RoHs than non-African populations [except for the Hadza, a population that is known to have decreased drastically in size (10) (figs. S40, S46, and S48)]. However, within sub-Saharan Africa, these summary statistics pointed to different regions or groups within regions (Fig. 3). Although the descendants of the Bantu expansion in eastern and southern Africa sometimes had greater levels of genetic diversity than populations closer to their West African origin, illustrating the effect of recent admixture, inclusion or exclusion of these groups did not affect the overall pattern. Thus, these patterns of genetic variation do not localize the origin of modern humans to a single geographic region in Africa; instead they suggest a complex (potentially both recent and ancient) population history within Africa.
Fig. 3.

(A) Expected heterozygosity of 5 SNP haplotypes as a function of haplotype length. (B) Haplotype richness for 5 SNP haplotypes as a function of haplotype length. (C) LD, represented as r2, as a function of distance. (D) Cumulative RoHs for each population (0.5- to 1-Mb runs and averaged across individuals). (E to H) Heat maps of the summary statistics indicated in (A) to (D). (E) and (F) show the results at 50-kb windows; (G) shows ρ = 4 Ne × c, where ρ is estimated from fitting r2-decay curves to simulated data from a constant-size model (14) and c is the unscaled recombination rate; and (H) shows the population cRoHs (0.5- to 1-Mb class) averaged across 50 replicates of subsampling. For (A) to (C), the colors of the African populations are as in Fig. 1, and gray lines represent various non-African groups. For (A) to (H), all populations were randomly downsampled to seven individuals (without replacement), and SNPs with minor allele frequency < 10% were excluded.
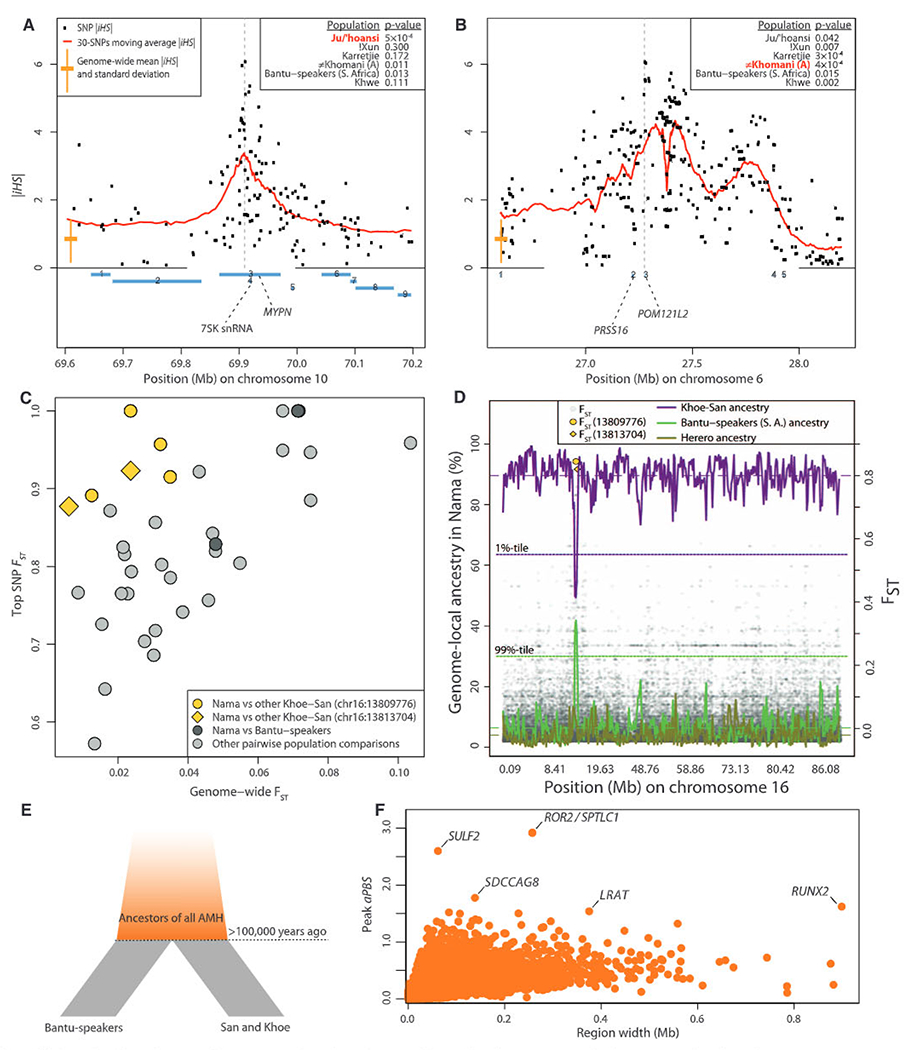
We searched for signs of selective sweeps across the genomes of San, Khoe, and Bantu-speaking populations in the set of ~2.3 million SNPs using the integrated haplotype statistic iHS (14, 20). Several of the strongest and previously unknown signals of selection coincide with regions of the genome that have been associated with distinct phenotypes. A particularly interesting region was found on chromosome 10 in the Ju/’hoansi (Fig. 4A and fig. S73) and overlapped the MYPN (myopalladin) gene, which is associated with muscle growth and function (21). Although the signal for a selective sweep was strongest in the Ju/’hoansi, it was also found in other groups, including non-African populations, suggesting that the sweep was either old or reoccurring. A particular variant found in another muscle gene (ACTN3) associated with “fast-twitching” muscles and elite athletic performance (22) has greater frequencies (>90%) in all the investigated Khoe-San groups than in other African populations (fig. S81).
Fig. 4.

(A) iHS values for each SNP on chromosome 10 in Ju/’hoansi, surrounding the muscle gene MYPN, and (B) on chromosome 6 in #Khomani, surrounding the immune system genes PRSS16 and POM121L2. The empirical P values (14) for 200-kb regions centered on the peak are given for each population. Locations of genes are shown by blue rectangles. (C) The greatest FST values for particular SNPs and pairwise population comparisons versus genome-wide FST estimates for the same population comparison. The top pairwise comparisons involving the Nama and another Khoe-San population (yellow) are found in the same region, separated by less than 4000 bp. (D) Proportion of genome-local ancestry (14, 24) for chromosome 16 in the Nama assigned to Khoe-San, Herero, or Bantu-speakers (South Africa). The population-specific chromosome-wide means are shown as dashed horizontal lines. The 99 percentile for Bantu-speakers (South Africa) ancestry, and the 1 percentile for the Khoe-San ancestry are shown as dotted horizontal lines. The two top SNP FST values are highlighted in yellow in (C) and (D). (E) Illustration of the aPBS approach for detecting selective sweeps in early modern humans. AMH, anatomically modern humans. (F) Stretches of consecutive positive aPBS values, with the top aPBS value plotted against the size of the stretch.
The most prominent peak across the genome and among all populations was found on chromosome 6 near the major histocompatibility complex in the #Khomani and the Karretjie (Fig. 4B and fig. S76) (14). Several genes that are suggested to protect against infectious diseases surround the peak, including PRSS16 and POM121L2 (Fig. 4B). The fact that the strong signal was unique to the Southern Khoe-San could be related to their early and extensive contact with European colonists and novel (to the Khoe-San) infectious diseases such as smallpox leading to drastic population reduction (18).
To search for genome regions with unusually differentiated SNR variants in pairs of populations, we contrasted genome-wide estimates of FST with the single greatest FST value observed among the ~2.3 million SNPs (14). Although genome-wide FST between the pastoralist Nama and other Khoe-San groups was moderate (0.012 to 0.034), the top FST values in such comparisons (Fig. 4C) were all >0.88 and located in the same region on chromosome 16. The region overlaps an active binding site of transcription enhancers that probably regulate the ERCC4 gene (some 200 kb further downstream), which is linked to pigmentation and sensitivity to ultraviolet light (xeroderma pigmentosum). Individuals with mutations in the ERCC4 gene display pigmented freckles, mild skin lesions, and an elevated risk of skin cancer (23). When a supervised genome-local clustering strategy was used (24), this region showed an extraordinary fraction of ancestry from Bantu-speakers (South Africa) in the Nama (Fig. 4D and figs. S68 to S71), which is probably the result of introgression and, potentially, ensuing selection.
Because of their early divergence, signals of selection shared between Khoe-San and other populations offer a window into the evolutionary processes that occurred >100,000 years ago—the critical period for the origin of anatomically modern humans (1, 2). We devised a novel approach to search for unusual stretches of high-frequency derived variants shared among extant populations: the ancestral population branch statistic (aPBS) (Fig. 4E) (14). The top candidate for selection in early modern humans was located in a region immediately upstream of the ROR2 gene (Fig. 4F and fig. S84), which is involved in regulating bone and cartilage development, and the SPTLC1 gene, which is involved in hereditary sensory neuropathy (14). Mutations in ROR2 cause recessive brachydactyly (shortening of digits) and Robinow syndrome (skeletal abnormalities). The second greatest aPBS value (fig. S81) was observed immediately upstream of SULF2, which regulates cartilage development, and phenotypes associated with mutations in SULF2 include skeletal malformations and distorted brain development (14, 25). The largest of all regions (~900 kb), containing the fourth-highest aPBS value (Fig. 4F), comprises the RUNX2 gene (fig. S87), which is implicated in craniocladial dysplasia. Thus, three of the top five regions contain genes involved in skeletal development, and syndromes associated with mutations in these genes display similar morphological features. RUNX2 variation has been associated with phenotypic differences between anatomically modern and archaic humans, such as frontal bossing, clavical morphology, a bell-shaped rib cage (26), and regulating the closure of the fontanel, which is crucial for brain expansion (27). The region spanning RUNX2 was also identified in a scan for selected regions with the draft Neandertal genome (7). Because gracile modern human morphology appeared abruptly as compared to previous rates of morphological change in the human lineage (2), it is possible that selection on a few morphology genes, perhaps including these candidates, was involved in the emergence of anatomical modernity.
The remaining two of the top five regions for putative selection in early modern humans comprise SDCCAG8 (fig. S86), involved in microcephaly (28), and LRAT (fig. S88), associated with Alzheimer’s disease (29). Including SULF2, three of the top five candidate regions are thus associated with neuronal function.
Our study demonstrates substantial stratification among sub-Saharan populations, including among Khoe-San, and both population structure and the geographic distribution of genetic variation suggest a complex human population history within Africa. It remains unclear whether modern humans originated from a single randomly mating population or emerged from a geographically structured population (2, 30), potentially exchanging genetic material with archaic humans (6). The finding of several genes involved in skeletal development as candidates for selection in the ancestral human population of Khoe-San and Bantu-speakers, and the fact that no currently studied population diverged from the ancestral human population before the ancestors of the Khoe-San, suggest that anatomical modernity appeared before this first modern human diversification event. However, the complex patterns of genetic diversity, admixture, and selection; deep population structure; historically large effective population size; and ancient divergence of Khoe-San populations described in this study highlight the complexity of human evolutionary history in Africa and suggest that genomic studies in Africa hold some of the keys to the main questions surrounding modern human origins.
Supplementary Material
Acknowledgments:
We thank participants who donated blood samples, T. Jenkins, and B. Henn. Approved by the Working Group of Indigenous Minorities in Southern Africa (WIMSA) and the South African San Council; we thank them for facilitating sampling trips. Computations were performed at the Uppsala Multidisciplinary Center for Advanced Computational Science (UPPMAX) in Uppsala, Sweden (project number p2011187). This work was supported by the Wenner-Gren Foundation (C.S.); the Intramural Research Program of the National Institute on Aging, NIH, U.S. Department of Health and Human Services, grant Z01 AG000932-04 (A.S.); the Medical Research Council of South Africa and National Health Laboratory Service (H.S.); STINT (M.B. and M.J.); the Swedish Research Council (M.J.); and the Erik Philip Sörensen Foundation (M.J.). H.S. retains governance of the DNA samples. Author contributions were as follows: conception and design of study: C.M.S., P.Sk., and M.J.; sample collection, preparation, and description: C.M.S., M.D.J., and H.S.; genotyping: D.H. and A.S.; data preparation: C.M.S., P.Sk., D.H., and M.J.; population structure analysis: CM.S., P.Sk., M.G., S.L, F.J., M.B., and M.J.; model based inference: P.Sk. and M.J.; language/geography comparisons: F.J., C.M.S., and M.B.; diversity statistics: C.M.S., P.Sk., L.M.G., P.Sj., and M.J.; Selection scans: P.Sj., P.Sk., C.M.S., and M.J.. The paper was written by C.M.S., P.Sk., and M.J. with contributions from all authors. Genotype data are available at the Arrayexpress database (www.ebi.ac.uk/arrayexpress/, accession no. E MTAB-1259) and at www.ebc.uu.se/Research/IEG/evbiol/research/Jakobsson/data/.
Footnotes
Supplementary Materials
References and Notes
- 1.Stringer C, Philos. Trans. R. Soc. London Ser. B 357, 563 (2002). [DOI] [PMC free article] [PubMed] [Google Scholar]
- 2.Barham L, Mitchell P, The First Africans (Cambridge Univ. Press, Cambridge, 2008). [Google Scholar]
- 3.Jakobsson M, Nature 451, 998 (2008). [DOI] [PubMed] [Google Scholar]
- 4.Li JZ et al. , Science 319, 1100 (2008). [DOI] [PubMed] [Google Scholar]
- 5.Behar DM et al. , Genographic Consortium, Am. J. Hum. Genet 82, 1130 (2008). [DOI] [PMC free article] [PubMed] [Google Scholar]
- 6.Lachance J et al. , Cell 150, 457 (2012). [DOI] [PMC free article] [PubMed] [Google Scholar]
- 7.Green RE et al. , Science 328, 710 (2010). [DOI] [PMC free article] [PubMed] [Google Scholar]
- 8.Tishkoff SA et al. , Science 324, 1035 (2009). [DOI] [PMC free article] [PubMed] [Google Scholar]
- 9.Schuster SC et al. , Nature 463, 943 (2010). [DOI] [PMC free article] [PubMed] [Google Scholar]
- 10.Henn BM et al. , Proc. Natl. Acad. Sci. U.S.A 108, 5154 (2011).21383195 [Google Scholar]
- 11.Gronau I, Hubisz MJ, Gulko B, Danko CG, Siepel A, Nat. Genet 43, 1031 (2011). [DOI] [PMC free article] [PubMed] [Google Scholar]
- 12.Veeramah KR et al. , Mol. Biol. Evol 29, 617 (2012). [DOI] [PMC free article] [PubMed] [Google Scholar]
- 13.Tishkoff SA et al. Mol. Biol. Evol 24, 2180 (2007). [DOI] [PubMed] [Google Scholar]
- 14.See supplementary materials on Science Online.
- 15.1000 Genomes Project Consortium, Nature 467, 1061 (2010).20981092 [Google Scholar]
- 16.Alexander DH, Novembre J, Lange K, Genome Res. 19, 1655 (2009). [DOI] [PMC free article] [PubMed] [Google Scholar]
- 17.Skoglund P et al. Science 336, 466 (2012). [DOI] [PubMed] [Google Scholar]
- 18.Nurse GT, Weiner JS, Jenkins T, The Peoples of Southern Africa and Their Affinities (Oxford Univ. Press, New York, 1985). [Google Scholar]
- 19.Ramachandran S et al. , Proc. Natl. Acad. Sci. U.S.A 102, 15942 (2005). [DOI] [PMC free article] [PubMed] [Google Scholar]
- 20.Voight BF, Kudaravalli S, Wen X, Pritchard JK, PLoS Biol. 4, e72 (2006). [DOI] [PMC free article] [PubMed] [Google Scholar]
- 21.Bang ML et al. , J. Cell Biol 153, 413 (2001). [DOI] [PMC free article] [PubMed] [Google Scholar]
- 22.Yang N et al. , Am. J. Hum. Genet 73, 627 (2003). [DOI] [PMC free article] [PubMed] [Google Scholar]
- 23.Matsumura Y, Nishigori C, Yagi T, Imamura S, Takebe H, Hum. Mol. Genet 7, 969 (1998). [DOI] [PubMed] [Google Scholar]
- 24.Lawson DJ, Hellenthal G, Myers S, Falush D, PLoS Genet 8, e1002453 (2012). [DOI] [PMC free article] [PubMed] [Google Scholar]
- 25.Kalus I et al., J. Cell. Mol. Med 13, 4505 (2009). [DOI] [PMC free article] [PubMed] [Google Scholar]
- 26.Mundlos S et al. , Cell 89, 773 (1997). [DOI] [PubMed] [Google Scholar]
- 27.Falk D, Zollikofer CPE, Morimoto N, Ponce de León MS, Proc. Natl. Acad. Sci. U.S.A 109, 8467 (2012). [DOI] [PMC free article] [PubMed] [Google Scholar]
- 28.Hill AD et al. , Am. J. Med. Genet. A 143A, 1692 (2007). [DOI] [PubMed] [Google Scholar]
- 29.Abraham R et al. , BMC Med. Genomics 1, 44 (2008). [DOI] [PMC free article] [PubMed] [Google Scholar]
- 30.Blum MGB, Jakobsson M, Mol. Biol. Evol 28. 889 (2011). [DOI] [PubMed] [Google Scholar]
Associated Data
This section collects any data citations, data availability statements, or supplementary materials included in this article.


