Abstract
Heterogeneous electro-Fenton is one of the promising technologies to degrade refractory organic phosphonates. In this work, CoNWs@CoAl-LDHs/Fe3O4 and CoNPs@CoAl-LDHs/Fe3O4 were successfully synthesized by a co-precipitation method and applied to degrade 1-hydroxyethane-1,1-diphosphonic acid (HEDP) and glyphosate (PMG) via an electro-Fenton process. The results indicated that the removal rate of HEDP (100 mg L−1) and PMG (100 mg L−1) by CoNWs@CoAl-LDHs/Fe3O4 increased from 62.09% and 95.31% to 82.45% and 100%, respectively. The CoNPs@CoAl-LDHs/Fe3O4 electro-Fenton system could remove 70.03% of HEDP and nearly 100% of PMG within 2 hours at a pH of 3. Moreover, we compared the SEM, EDS, XRD and BET results of CoNWs@CoAl-LDHs/Fe3O4 with those of CoNPs@CoAl-LDHs/Fe3O4. The effects of initial pH, CoNW dosage and reaction time on the degradation of HEDP and PMG were discussed. CoNWs@CoAl-LDHs@Fe3O4 could even remove 71.03% of HEDP at a neutral pH. After four cycles of repeated use at a pH of 3, the removal rate of HEDP by CoNWs@CoAl-LDHs/Fe3O4 was still higher than 70%. Radical quenching experiments revealed that ˙OH is the dominant active species participating in the heterogeneous electro-Fenton process. Finally, we would talk about the mechanism of the CoNWs@CoAl-LDHs/Fe3O4-based electro-Fenton system.
Cobalt nanowires and cobalt particles are introduced into CoAl-LDHs@Fe3O4, and the effect of the former is better in the application of electro-Fenton process.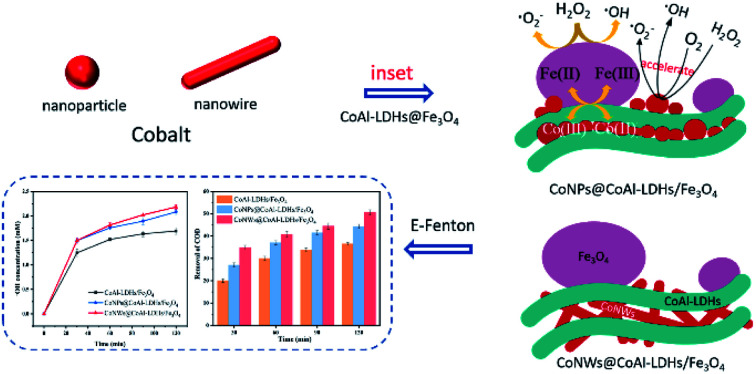
Introduction
Thousands of tons of organic phosphorus, which is one of the important sources of P in water environment, are used in industries, agriculture, and households each year.1 Phosphonate is a common type of organic phosphorus compound,2,3 which is widely used in industries, because of its stability, threshold effect and scaling inhibition functional moieties.3,4 However, most phosphonate-based materials have poor biodegradability, and therefore, traditional biological wastewater treatment plants have difficulty in completely mineralizing them.3 1-Hydroxyethane-1,1-diphosphonic acid (HEDP) is a typical example of phosphonates.5 It has wide applications, first being used as a scale inhibitor in the water treatment industry.6 Then, it is considered as an effective corrosion inhibitor in oil and gas industry,4 iron and steel industry7 and wastewater reverse osmosis (RO) systems.8 HEDP has two phosphonic groups (C–PO3H2).9 Due to the unnatural form and its structure (Fig. S2(a)†), it is difficult for microorganisms to degrade HEDP.3 If not well handled, it will cause harm to the environment to a certain extent. As Rott et al.3 said, we should not underestimate the contribution of phosphonates to eutrophication. It is urgent to reduce the amount of nutrients entering the aqueous environment, so as to prevent algal bloom and eutrophication of water.
Glyphosate (PMG) is a sort of potential degradation product of phosphonate, which is worthy of attention.10 According to Benbrook,11 PMG is the most intensive and widely used pesticide in the United States up to 2016. The data12 on water samples from 2001 to 2010 in the United States show that PMG and aminomethylphosphonic acid (AMPA, a main PMG degradation product) existed widely in the water environment. This is probably the global situation as well. As PMG is considered to be better for the environment compared with other herbicides,13 it is widely used across the world, increasing the risk of global environmental pollution. IARC classified PMG under Group 2a in 2014.14 Moreover, PMG is probably carcinogenic to humans.
Traditional biological treatment, adsorption, and sedimentation/coagulation processes can effectively remove inorganic phosphorus. However, the removal efficiency of organic phosphonates by these processes would be worse.10 Advanced oxidation processes (AOPs) have the advantages of high mineralization efficiency, fast oxidation reaction and no secondary pollution.15 They also perform well in the treatment of organic polluted wastewater.16 Therefore, it is a good choice to treat organic phosphonate wastewater by the advanced oxidation technology. AOPs include Fenton reactions that use iron salts to activate H2O2.17 Nonetheless, Fenton oxidation has some limitations such as excessive production of iron sludge, strict operational pH and high operating costs.18,19 To overcome these drawbacks, researchers have improved the traditional Fenton technique, including electro-Fenton. Oxygen is reduced to H2O2 on the cathode by an external power supply without storing and transport of H2O2 (eqn (1)).20 The Fenton reaction between the added iron salt and H2O2 produces ˙OH to oxidize and degrade organic matter (eqn (2)). Compared with the traditional Fenton process, the electro-Fenton process can treat wastewater without storing and transport of H2O2 and with less iron sludge.20,21 Meanwhile, electricity can be obtained from clean energy sources such as wind energy.21,22 The requirement pH of original electro-Fenton systems is around 3 to minimize the Fe(OH)3 sludge. In addition, loss of soluble iron catalyst and post-treatments are problems.21 Heterogeneous electro-Fenton can work over a wide range of pH. Catalysts are easy to separate, reuse and recycle.23 However, compared with the classic Fenton process, there are fewer active sites exposed on the external surface of heterogeneous catalysts.24 Consequently, it is worthwhile to develop a perfect catalyst, which possesses high catalytic activity, good stability, reusability and ease of recycling. It can not only retain the advantages of heterogeneous electro-Fenton but also improve its shortcomings.
| O2 + 2e− + 2H+ → H2O2 | 1 |
| Fe2+ H2O2 → Fe3+ + ˙OH + OH− | 2 |
Layered double hydroxides (LDHs) are a class of anionic clays with a structure based on brucite (Mg(OH)2)-like layers.25 LDHs can be expressed by the general formula [M2+1−xM3+x(OH)2]x+(An−2)x/n·mH2O,26 where M2+ and M3+ are the metallic bivalent and trivalent cations, respectively, and A is the interlayer anion of valence n. Due to their variable-chemical compositions, high surface area, controllable chemical construction, low manufacturing cost and ease of synthesis, LDHs have widespread applications in various fields such as adsorbents,27,28 catalysts,29 supercapacitors,30 and biomedical science.31,32 Particularly, LDHs have attracted much attention for a heterogeneous Fenton process,33,34 which not only have catalytic activity,35,36 but also can be modified by intercalation.37
Cobalt, the 27th abundant element assigned to group VIII B, is one of the most popular metals in materials science.38 Cobalt is an element with multiple redox states, which can decompose H2O2 into hydroxyl radicals via Fenton-like pathways.39 Various valence states of cobalt make it available and easy for electron transfer.38 Cobalt atoms have been anchored on N-doped porous carbon materials in Fenton-like systems activating peroxymonosulfate (PMS).40,41 Cobalt can enhance the performance of the catalysts and activate oxygen reduction reactions (ORRs).42 In addition, the distinctive characteristics of magnetic nanowires such as good conductivity, optical transparency, and electrical and chemical inertness have attracted researchers' attention.43
Therefore, we intended to synthesize a novel heterogeneous catalyst by introducing cobalt into CoAL-LDHs, which loaded Fe3O4 to improve the catalytic activity. Meanwhile, we compared the overall effects of cobalt introduced in different forms of zero-dimensional nanostructures (cobalt nanoparticles, CoNPs) and one-dimensional nanostructures (cobalt nanowires, CoNWs) into the catalyst. CoNWs were synthesized by a solution-reduction method under an external magnetic field. Then, we tested catalysts through a series of phase and chemical composition characterizations and electrochemical catalytic simulation. The catalytic activity was evaluated by the degradation of HEDP and PMG. The effects of different reaction conditions on the degradation of HEDP and PMG were also discussed. We used the recycling test to examine the reusability and stability of the catalyst.
Results and discussion
Synthesis and morphology investigations of catalysts
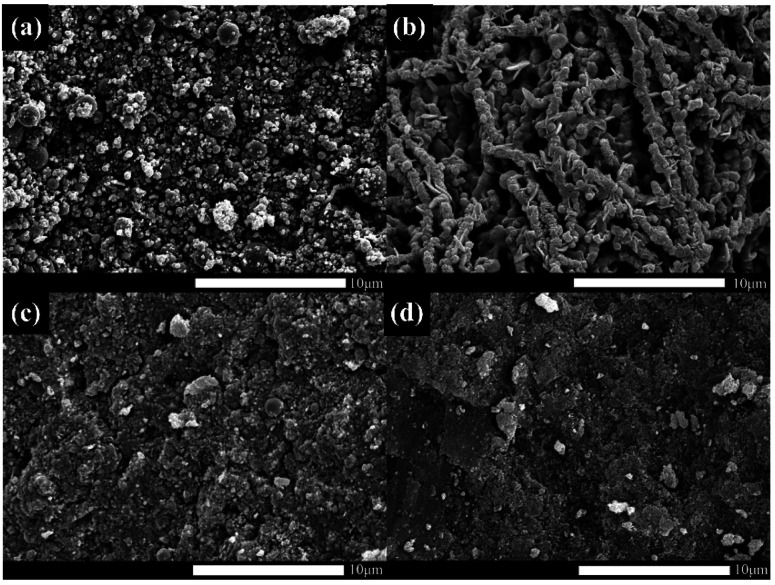
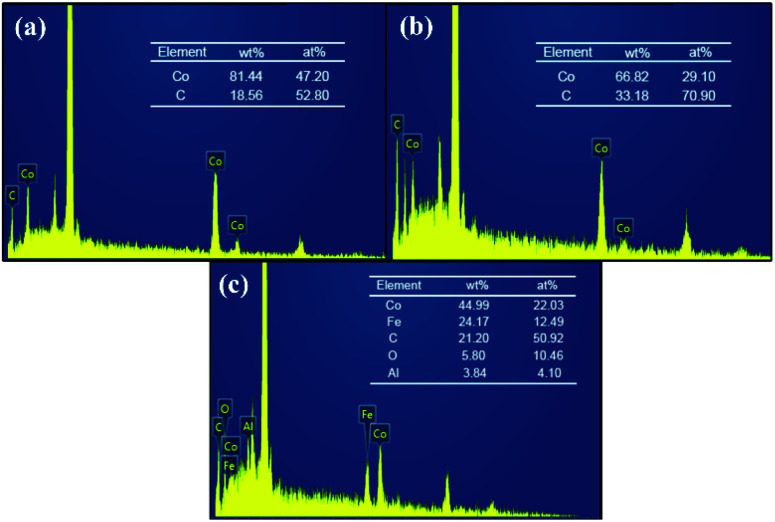
SEM images allowed us to visually observe the morphology and structural features of the as-prepared materials. Weight percentage (wt%) and atom percentage (at%) of each element were determined by EDS analysis. From the SEM image of CoNPs (Fig. 1a) and CoNWs (Fig. 1b), it can be seen that CoNPs had a morphology of granular structure with uneven grain sizes. The larger spherical particles in Fig. 1a were dispersants. The size is indicated in Fig. S1a,† and the diameter of the dispersant is four to ten times larger than that of the CoNPs. The dispersants were added to the CoNPs, probably because cobalt is one of the most representative transition-metal ferromagnet.44 The EDS result of CoNPs (Fig. 2a) also confirmed that there were other impurities in CoNWs. The SEM image of CoNWs (Fig. 1b) showed that cobalt nanowires had a clear but non-smooth linear structure, with a length of several microns. There were also obvious gaps between the nanowires, which can also be seen in the lower SEM images (Fig. S1b†). The EDS image of CoNWs (Fig. 2b) matched well with the review results.45 The mass fraction of cobalt in the CoNPs and CoNWs was 81.44% and 66.82%, respectively. PVP coated onto the nanowires and C in the environment was adsorbed onto nanowires and nanoparticles during the preparation of samples,45,46 which could cause an increase of carbon in EDS analysis. As shown in Fig. 1c and d, a distinct layered structure could be observed. There were clear visible spherical particles on the surface of CoNPs@CoAl-LDHs/Fe3O4, which might be dispersants. CoNWs@CoAl-LDHs/Fe3O4 had a smoother surface than that of CoNPs@CoAl-LDHs/Fe3O4. The EDS elemental analysis of catalysts (Fig. 2c) also indicated that CoNWs@CoAl-LDHs/Fe3O4 was successfully synthesized.
Fig. 1. SEM image of CoNPs (a), CoNWs (b), CoNPs@CoAl-LDHs/Fe3O4 (c) and CoNWs@CoAl-LDHs/Fe3O4 (d).
Fig. 2. EDS spectrum of CoNPs (a), CoNWs (b), and CoNWs@CoAl-LDHs/Fe3O4 (c).
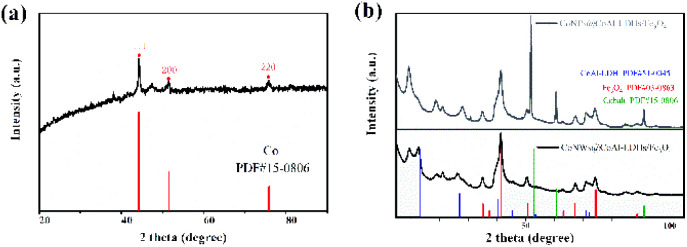
The crystal structures of CoNWs, CoNWs@CoAl-LDHs/Fe3O4 as well as CoNPs@CoAl-LDHs/Fe3O4 were measured and the XRD patterns are shown in Fig. 3. The XRD patterns of CoNWs (Fig. 3a) matched well with the standard spectrum of cobalt (JCPDS PDF: 15-0806) phases. Three prominent peaks at 2θ of 44.51°, 51.84° and 76.37° were attributed to the (111), (200) and (220) planes of Co. The result was compared with the XRD patterns in synthetic ref. 45, which demonstrated the successful preparation of CoNWs. The XRD patterns of CoNPs@CoAl-LDHs/Fe3O4 and CoNWs@CoAl-LDHs/Fe3O4 are revealed in Fig. 3b. By comparison, there were no characteristic peaks of cobalt in CoNWs@CoAl-LDHs/Fe3O4, probably because the cobalt nanowires could be well coated with CoAl-LDHs. However, cobalt nanoparticle coating on the surface of LDHs affected the diffraction peaks of CoAl-LDH (JCPDS PDF: 51-0045). Particularly some diffraction peaks would be lost when more compounds were present. But Fe3O4 in CoNPs@CoAl-LDHs/Fe3O4 and CoNWs@CoAl-LDHs/Fe3O4 were both well crystallized.
Fig. 3. XRD patterns of cobalt nanowires (a), and CoNPs@CoAl-LDHs/Fe3O4 and CoNWs@CoAl-LDHs/Fe3O4 (b).
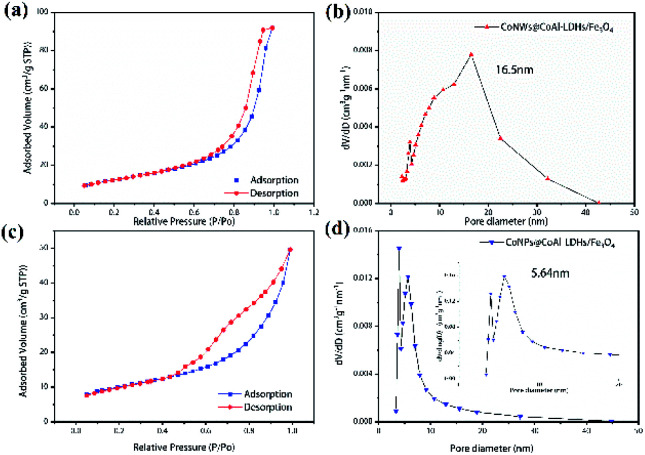
The nitrogen adsorption–desorption isotherms and pore size distribution of CoNPs@CoAl-LDHs/Fe3O4 and CoNWs@CoAl-LDHs/Fe3O4 are shown in Fig. 4, and the calculated BET surface area, BJH pore volume and pore size of the samples are presented in Table S1.† The nitrogen adsorption–desorption isotherm of CoNWs@CoAl-LDHs/Fe3O4 is shown in Fig. 4a. According to the IUPAC classification,47 it showed type IV isotherm (in) with one clear H2-type hysteresis loop from P/P0 ∼0.5 to 1.0, which was characteristic of mesoporous materials. The corresponding pore volume-pore size distribution curve of CoNWs@CoAl-LDHs/Fe3O4 is shown in Fig. 4b, which was a characteristic unimodal pore size distribution (PSD). The PSD of CoNWs@CoAl-LDHs/Fe3O4 was centered at 16.5 nm, compared with that of CoNPs@CoAl-LDHs/Fe3O4, which was only 5.64 nm (Fig. 4d). This could also verify its mesoporous structure. The isotherm of CoNPs@CoAl-LDHs/Fe3O4 (Fig. 4c) also revealed a type IV isotherm with a H2(b)-type hysteresis loop. The type H2(b) loop is also associated with pore blocking.47 Compared to CoNPs@CoAl-LDHs/Fe3O4, the CoNW composite catalyst had higher porosity and larger pore size, which indicated that more surfaces are exposed. The BET surface area of commercial LDH particles (Mg4Al2(OH)12CO3·3H2O) was only 8.3 m2 g−1.48 The specific surface area of the CoNWs@CoAl-LDHs/Fe3O4 and CoNPs@CoAl-LDHs/Fe3O4 samples was 44.66 m2 g−1 and 35.52 m2 g−1, which showed a clear improvement. The higher specific surface area of CoNWs@CoAl-LDHs/Fe3O4 might be attributed to the different structural properties of cobalt nanowires and cobalt nanoparticles. As shown by SEM, CoNPs were easier to agglomerate than CoNWs. In general, a larger specific surface area afforded more exposed active sites, contributing to better catalytic performance. Meanwhile, higher porosity with large interconnected pores would make the reactants/products access or escape the active sites more easily.24
Fig. 4. N2 adsorption–desorption isotherms and the BJH pore size distribution of CoNWs@CoAl-LDHs/Fe3O4 (a and b) and CoNPs@CoAl-LDHs/Fe3O4 (c and d).
Performance of catalysts in reactions
The adsorption saturation experiment was carried out on the catalyst before each reaction, implying that the degradation of organic phosphonates was ascribed to the electro-Fenton catalytic process.
Catalytic degradation of HEDP and PMG
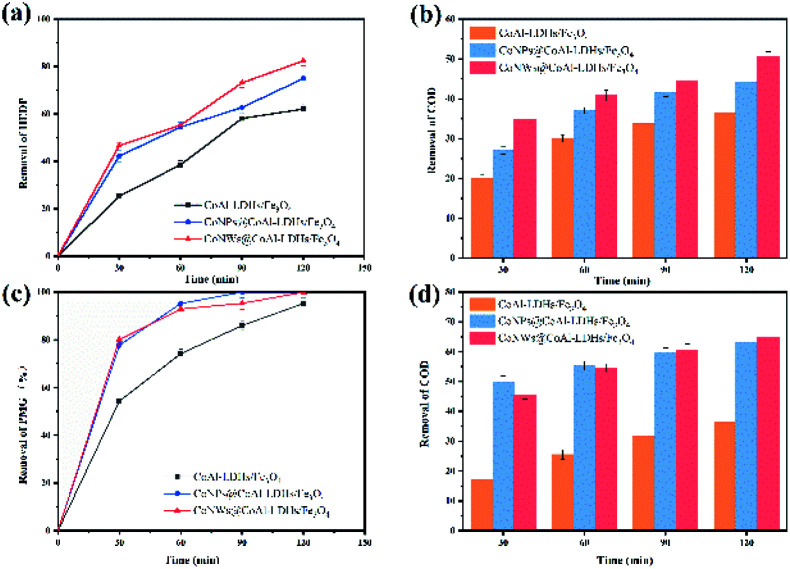
The catalytic activity of catalysts was evaluated by pollutant removal and COD removal after 2 h of the electro-Fenton reaction, and the results are shown in Fig. 5. The calculation of pollutant and COD removal rate is given in Experimental part. The removal of phosphonates means reduction of mother compounds (HEDP and PMG), while the removal of COD indicated the complete mineralization degree of the mother compounds. In the presence of CoNWs, the COD removal efficiency at 120 min (about 50.6% and 65%) was obviously higher than that without cobalt (about 36.5% and 36.3%). This result was also in accordance with the trends of HEDP and PMG removal efficiency. The removal rate of HEDP reached 82.5% in 120 min using CoNWs@CoAl-LDHs/Fe3O4 as the catalyst, while that when using CoAl-LDHs/Fe3O4 as the catalyst was only 62.1%. It was obvious that the former was better than the latter in the process of HEDP degradation. Besides, an obvious trend was that the removal ratio of PMG was higher than that of HEDP. This behavior could be explained by the different structures of PMG and HEDP, as shown in Fig. S2.† HEDP has two chemically stable C–P bonds, while PMG has one C–P bond and two C–N bonds. According to the work by Kuhn et al.,49 the initial cleavage of DTPMP (aminophosphonate with five phosphonic acid groups and nine C–N bonds) was at the C–N bond during UV irradiation. The degradation rate of the parent compound was significantly increased by the addition of Fe2+. DTPMP degradation with Fe2+ was attributed to catalysis through electron transfer to the nitrogen atom by oxidation. There might also be coordination between the iron divalent and PMG.
Fig. 5. Removal of organic phosphines by three catalysts: removal of HEDP (a) and its COD (b), and removal of PMG (c) and its COD (d).
These results indicated that the intercalation of cobalt in the interlayers of LDH/Fe3O4 greatly enhanced the catalytic performance of CoAl-LDH/Fe3O4 in the Fenton process. On the one hand, cobalt could activate the oxygen reduction reaction (ORR), which promoted the production of more hydrogen peroxide.42 On the other hand, cobalt decomposed H2O2 to ˙OH via the Fenton-like process.39 In addition, the electro-Fenton process was a combination of the ORR and Fenton-like reaction.50 The above-mentioned speculation was also confirmed by detecting the concentrations of hydrogen peroxide (Fig. S3†) and hydroxyl radicals (Fig. S4†). In addition, the catalytic performance of CoNW-intercalated catalysts was better than that of CoNPs@CoAl-LDHs/Fe3O4. Magnetic CoNWs had better conductivity than that of CoNPs.43 The linear one-dimensional structure could support the CoAl-LDHs and make it have more internal space, avoiding particle aggregation and providing a higher specific surface area. The results of BET confirmed this conclusion. Correspondingly, more H2O2 and ˙OH were produced.
Effect of different operation conditions
1. Initial pH value
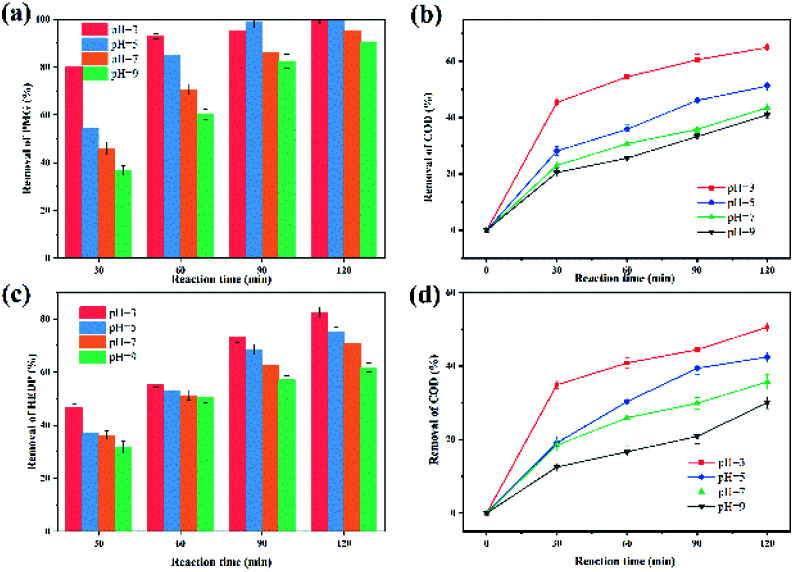
Considering the significant effect of the initial pH on the Fenton reaction,51 the effect of an initial pH in the range of 3–9 was investigated (Fig. 6). In this regard, it was a remarkable advantage that the CoNWs@CoAl-LDHs@Fe3O4-catalyzed heterogeneous electro-Fenton process exhibited high removal efficiency within a relatively wide pH range of 3–9. It could be observed that the optimum pH of the solution was 3. An initial pH of 3 was used in subsequent studies. The removal efficiency of HEDP and PMG decreased with the increase in initial pH. At the same time, the COD removal efficiency decreased, which indicated that the degree of complete mineralization is also reduced. However, the removal of HEDP and PMG could still reach 71% and 95.3% after 120 min even at a neutral pH. Yang et al.52 used a magnetite/UV system containing 0.4 g L−1 adsorbent to photo-degrade 10 mg L−1 PMG and the degradation rate was only 74% at a neutral pH. Xue et al.53 synthesized Ce–TiO2 nanotubes degrading PMG, while the degradation rate of 1.0 × 10⁻⁴ mol L−1 PMG was 76% under the irradiation for 1 h at a neutral pH. The result shown in Fig. 6 also clearly demonstrated that the validity of CoNPs@CoAl-LDHs@Fe3O4 to degrade organic phosphonates is under a wide pH range.
Fig. 6. Effects of initial pH on the degradation of organophosphines: HEDP removal rate (a), the COD removal rate of HEDP (b), PMG removal rate (c) and the COD removal rate of PMG (d).
2. The dosage of CoNWs
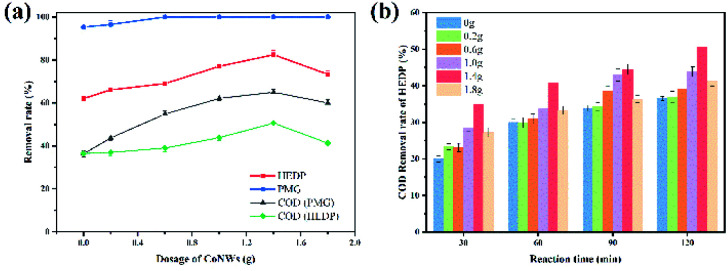
In the process of catalyst synthesis, the effect of changing the dosage of CoNWs on the overall catalytic is shown in Fig. 7. As shown in Fig. 7a, with the increase in CoNW dosage, the removal efficiency of HEDP and COD first increased and then decreased at a turning point of 1.4 g, while the removal rate of PMG reached 100% at a dosage of 0.6 g. Fig. 7b presents the effect of different dosages on the COD removal of HEDP at each time point. It was obvious that when the dosage of cobalt nanowires was 1.4 g, the catalytic effect was the best throughout the process. The amount of CoAl-LDHs synthesized was constant, so more CoNWs added meant fewer CoAl-LDHs in CoNWs@CoAl-LDHs. On the one hand, there was also accumulation between cobalt nanowires, which might cause the contact surface to shrink. On the other hand, the CoAl-LDHs was not only a skeleton but also a reactive one. Its reduction might affect the synergy between components. Thus, 1.4 g of CoNWs was the dosage chosen for the rest of the experiments.
Fig. 7. Effects of different dosages of CoNWs on the degradation of organic phosphines (a) and the influence of that at each time period on the COD removal rate (b).
3. Reaction time
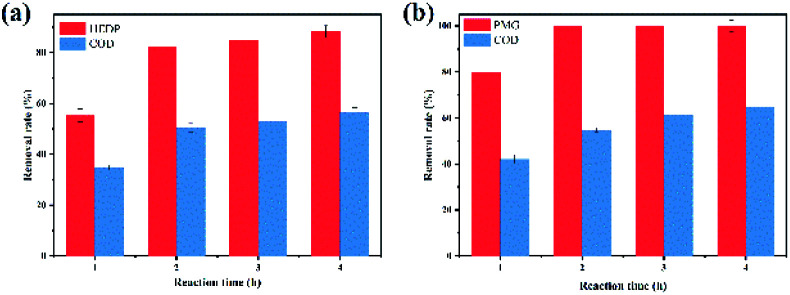
In order to explore the effect of reaction time on the CoNWs@CoAl-LDHs@Fe3O4 catalyst for degrading organic phosphonates, the amount of reaction time increased from 1 h to 4 h. The reaction time here did not include the time of adsorption saturation pretreatment. The effects of reaction time were investigated at a cobalt nanowire dosage of 1.4 g and an initial pH of 3. The results are depicted in Fig. 8. The reaction time had a significant effect on the reaction. When the reaction time was extended from 1 hour to 2 hours, the removal rate of HEDP increased from 55.3% to 82.45% and that of PMG increased from 80.08% to 100%, indicating that the prolongation of reaction time could increase oxidative degradation. However, when the temperature increased from 2 h to 4 h, the time had no obvious effect on the removal rate of HEDP and PMG. As the reaction proceeds, the concentration of pollutants became lower, and the reaction rate decreased. Therefore, considering the economic benefits, the optimal reaction time was 2 h. Huang et al.8 used UV/chlorine oxidation to degrade 17.5 mg L−1 HEDP, and the transformation efficiency (transformation of organic phosphorus to inorganic phosphorus) was 88% in 2 hours. However, the use of UV would greatly increase the disposal costs.
Fig. 8. Effects of reaction time on the degradation of HEDP (a) and PMG (b).
Recycling test
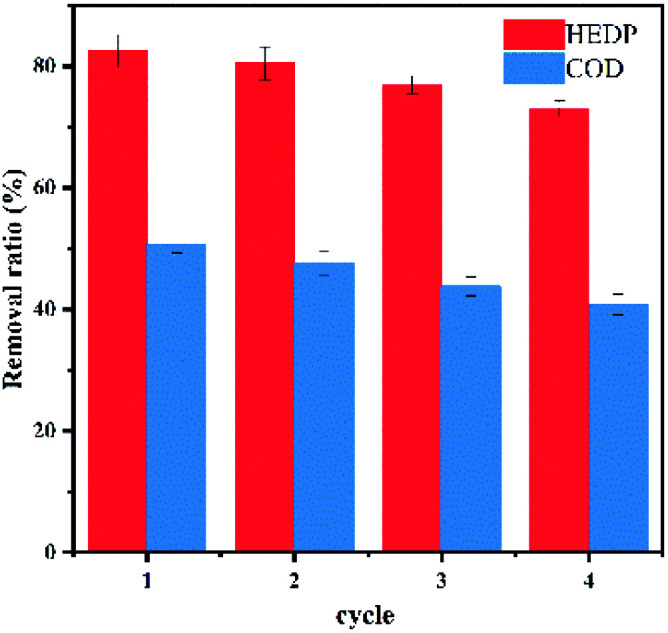
In fact, the study of catalyst stability was of great significance for catalytic reaction. We used ultrapure water washing to regenerate the catalyst without any further treatment. As shown in Fig. 9, the removal efficiency of HEDP decreased slightly, which was more than 73% after four consecutive runs. The declining trend of the COD removal rate was also slight. The slightly lower catalytic performance of CoNWs@CoAl-LDHs/Fe3O4 was attributed to the inevitable loss of Fe from the catalyst by leaching during recycle procedures.54 The results indicated that cobalt nanowire composites had favorable stability in HEDP degradation.
Fig. 9. Reusability of CoNWs@CoAl-LDHs/Fe3O4.
Inorganic phosphorus conversion
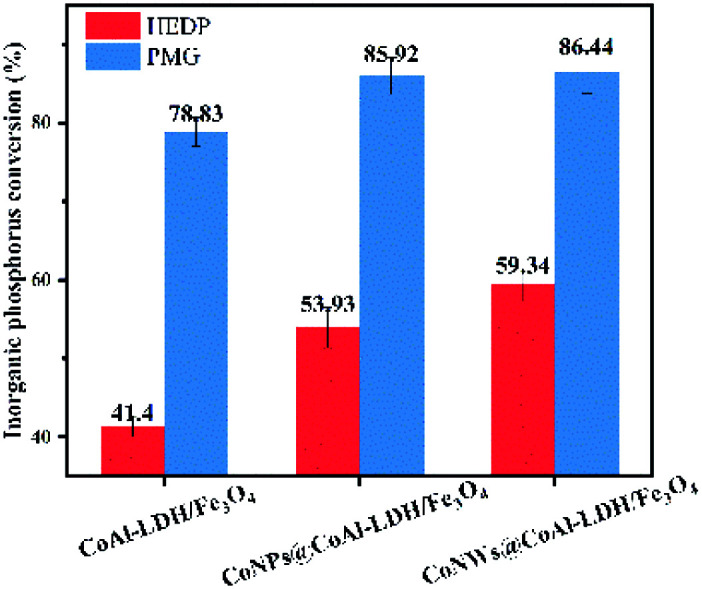
The conversion rate of inorganic phosphorus was also an important index to evaluate catalysts. When organic phosphorus was converted into inorganic phosphorus, it means that the stable C–P bond was broken. Meanwhile, existing technologies were more effective in the elimination/recovery of inorganic phosphorus.55 As can be seen in Fig. 10, the conversion rate of inorganic phosphorus of HEDP by CoNWs@CoAl-LDHs/Fe3O4 increased by almost 20%, corresponding to the removal rate of HEDP. Similarly, compared with CoNPs@CoAl-LDHs/Fe3O4, the conversion of inorganic phosphorus by CoNWs@CoAl-LDHs/Fe3O4 was improved. This also confirmed that CoNWs@CoAl-LDHs/Fe3O4 had a better catalytic effect.
Fig. 10. Conversion rate of inorganic phosphorus of the heterogeneous electro-Fenton reaction by different catalysts.
Possible degradation mechanism
Radical quenching experiments were examined at a CoNW dosage of 1.4 g, with an initial pH of 3, a reaction time of 2 h and an initial HEDP concentration of 100 mg L−1. In order to prove the role of radical ˙OH in this experiment, isopropyl alcohol was used to suppress the generation of radical ˙OH to discuss direct oxidation and indirect oxidation.56 The experimental results indicated that the removal rate of HEDP decreased from 82.45% to 20.64% at 120 min after the addition of 20 mmol isopropanol. In this experiment, P-benzoquinone was used as an inhibitor of the superoxide radical.57 After addition of 10 mmol p-benzoquinone, the COD removal rate of HEDP changed from 50.57% to 20.83%. Hydroxyl radicals (˙OH) played a dominant role in the catalytic degradation of HEDP. Meanwhile, it could not be ignored that the complete mineralization of HEDP was achieved by ˙O2−.
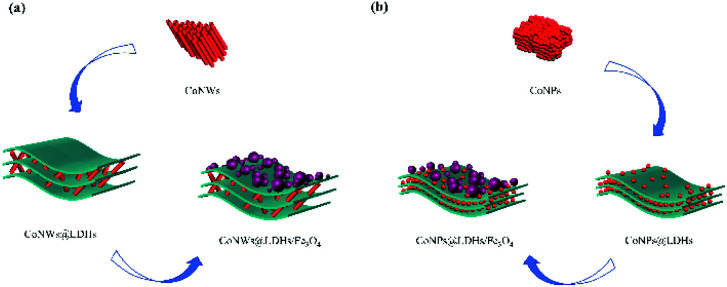
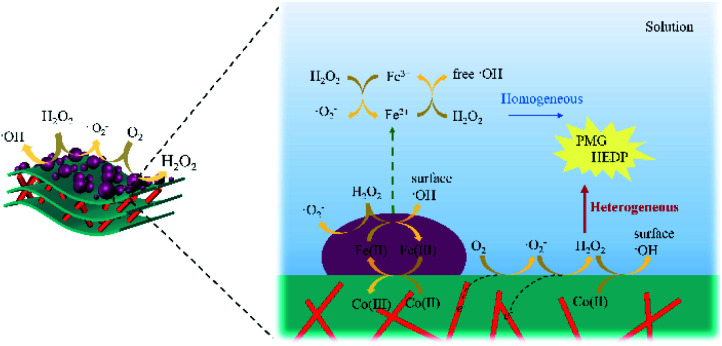
The addition of cobalt nanomaterial promoted the two-electron ORR to produce more hydrogen peroxide (eqn (1)), which was in good agreement with Fig. S3†.42,58 Cobalt also facilitated electron transfer between layers. H2O2 was apt to decompose to generate ˙OH and ˙O2− (eqn (3) and (4)).51 The transition metal (including FeII and CoII) on the surface of composite catalysts could promote the production of hydroxyl radicals via the Haber–Weiss mechanism59 (eqn (5) and (6)). Co could also promote the circulation of FeII/FeIII, because the standard reduction potentials of Co3+/Co2+ and Fe3+/Fe2+ were 1.92 V and 0.776 V, respectively.39 Besides, electrons preferred to transfer from FeII to CoIII (eqn (7)). As a result of the accelerated redox cycles of FeII/FeIII and CoIII/CoII, the decomposition of H2O2 into ˙OH (Fig. S4†) was accordingly enhanced. FeII and CoII could be regenerated, as shown in eqn (8) and (9), and ˙OOH was simultaneously produced.60 ˙OOH and ˙O2− could be converted into each other, as shown in eqn (10).61 The synthesis processes of CoNWs@CoAl-LDHs/Fe3O4 and CoNPs@CoAl-LDHs/Fe3O4 are shown in Fig. 11. As can be seen in Fig. S3 and Fig. S4,† more H2O2 and ˙OH were produced in the CoNWs@CoAl-LDHs/Fe3O4 Fenton system. According to the BET analysis, CoNWs might increase the layer spacing of CoAl-LDHs better than CoNPs. The increase in the specific surface area and pore size of the catalyst would expose more activation sites and facilitate the electron transfer within catalysts.
| H2O2 + e− → ˙OH + OH− | 3 |
| H2O2 + ˙OH → H2O2+˙O2− + H+ | 4 |
| FeII + H2O2 → FeIII + ˙OH + OH− | 5 |
| CoII + H2O2 → CoIII + ˙OH + OH− | 6 |
| CoIII + FeII → CoIII + FeIII | 7 |
| FeIII + H2O2 → FeII + ˙OOH +H+ | 8 |
| CoIII + H2O2 → CoII + ˙OOH +H+ | 9 |
| ˙OOH ↔ ˙O2− + H+ | 10 |
Fig. 11. Synthesis process of CoNWs@CoAl-LDHs/Fe3O4 (a) and CoNPs@CoAl-LDHs/Fe3O4 (b).
As shown in Fig. S5,† small amount of the released Fe2+ also took part in the reaction. By comparing the reaction performance at an initial pH >3, it was evident that the heterogeneous Fenton reaction on the surface of catalysts still played an important role in the degradation of organic phosphonates. Hence, it might be said that HEDP or PMG was rapidly degraded under the synergistic effect of the heterogeneous and homogeneous Fenton reactions. Combining the above-mentioned results and discussion, the possible reaction mechanism of CoNWs@CoAl-LDHs/Fe3O4 is illustrated in Fig. 12.
Fig. 12. Possible reaction mechanism of CoNWs@CoAl-LDHs/Fe3O4.
Experimental
Chemicals
HEDP, CoNPs and N2H4·H2O were purchased from Shanghai McLean Biochemical Technology Co., Ltd. PMG, CoCl2·6H2O, AlCl3·6H2O, NaOH, Na2CO3, FeCl3·6H2O, FeSO4·7H2O, NH3·H2O, EDTA-2Na, and polyvinylpyrrolidone (PVP) were obtained from Chengdu Chron Chemicals Co., Ltd. H2PtCl6·6H2O was purchased from Aladdin reagent (Shanghai) Co., Ltd. All the chemicals used were of analytical grade.
Synthetic procedures
CoNWs
CoNWs were synthesized by a solution-reduction method under an external magnetic field.45 Polyvinylpyrrolidone (PVP) as a surfactant was dissolved in CoCl2·6H2O and EDTA-2Na solution. The mixed solution was kept in a water bath at 80 °C, with an external magnetic field of 30 mT applied. NaOH was added to adjust the pH value of the solution to about 14. After 10 minutes, we added N2H4·H2O and H2PtCl6·6H2O. According to the literature,45 the prepared CoNWs were ferromagnetic. We used a magnet to separate CoNWs from the solution. After cleaning, the prepared CoNWs should be freeze-dried and stored in cold storage.
CoNWs@CoAl-LDHs
The prepared CoNWs dissolved in a conical flask were ultrasonicated for 3 min, and then CoAl-LDHs were synthesized by a co-precipitation method.62 The synthesis was realized by mixing appropriate amounts of metal salt solutions (Co2+ : Al3+ = 3 : 1) followed by co-precipitation by slow addition of a mixture of NaOH/Na2CO3 solution at a pH of 10. The resulting slurries were aged in an autoclave at 378 K for 24 h, separated by centrifugation, washed several times with water and then dried. CoNPs@CoAl-LDHs and CoAl-LDHs were synthesized in the same way.
CoNWs@CoAl-LDHs/Fe3O4
First, 4 g of LDHs dissolved in 100 mL deionized water was ultrasonicated for 30 min. Second, FeCl3·6H2O and FeSO4·7H2O weighed in proportion were dissolved in 250 mL of deionized water, and the solution was heated to 80 °C and stirred constantly under the protection of N2. After increasing the temperature to 85 °C, 30% aqueous ammonia moderate solution was added quickly into the constantly stirred solution. After 45 min, the precipitates were collected using a magnet followed by washing with deionized water and finally dried at 65 °C.
Catalytic degradation procedure
The simulated wastewater contained 0.05 mol L−1 Na2SO4 and 100 mg L−1 pollutant (HEDP or PMG). The pH of the solution was adjusted with 1 mol L−1 H2SO4 or 0.5 mol L−1 NaOH. Two prepared graphite electrode plates (40 mm × 60 mm × 3 mm) were placed in parallel. In addition, the distance between them was 2.0 cm. Put one gram of catalyst per liter into the solution. The mechanical stirrer set at 80 rpm stirred continuously to ensure uniform dispersion. The suspension was vigorously stirred for 30 min to reach the adsorption–desorption equilibrium. Then, the degradation of organic phosphonate pollutants was carried out under the condition of 0.3 A constant current and continuous fresh air supply at a flow rate of 150 mL min−1. At the given reaction time intervals, 7.5 mL supernatant solution was collected by filtration through a 0.45 μm membrane for the analysis of HEDP/PMG concentration and COD. The amounts of pollutants degraded via the electro-Fenton reaction were calculated from the difference between the initial concentration (C0) and the post-reactive one (Ct) as follows:
The COD removal rate was calculated from the COD value before (CODb) and after (CODa) the reaction as follows:
Materials and methods
Scanning electron microscopic (SEM) and energy-dispersive spectrometer (EDS) images were examined using a JEOL JSM-7500F operating at a beam energy of 15.0 kV. The structure and the crystal phases of the as-synthesized solids were investigated by X-ray diffraction (XRD) with filtered Cu-Kα radiation from 5° to 90°. The measurements were done in the 2θ mode at a scanning speed of 4° min−1. N2 adsorption–desorption isotherms were obtained using a Micromeritics ASAP 2460 system at 77 K employing the Barrett–Emmett–Teller (BET) calculations for a specific surface area. The total pore volume of pores was determined as P/P0 = 0.99, and the desorption average pore diameter was calculated by the Barrett–Joyner–Halenda (BJH) method.
Analysis
HEDP was determined directly by spectrophotometry at 470 nm.63 The water sample containing HEDP was first kept at a constant volume of 50 mL. Then, 2 mL of ferric salt solution (5 g L−1) was added for reaction for 5 minutes, followed by 4 mL of KCNS (100 mg L−1) for color rendering (pH <2) for 15 minutes. PMG was quantified by ultraviolet spectrophotometry (GB 20684-2006 in Chinese). We used a standard dichromate method to measure the COD.64 The concentration of H2O2 was determined by iodometry.65 Then, 3 mL of the solution was taken. Following this, 1.5 mL potassium hydrogen phthalate solution (0.1 M) and 1.5 mL iodide mixed solution (0.4 M KI + 0.06 M NaOH + 0.0006 M ammonium molybdate) were added successively. Spectrophotometry was performed at 352 nm. Salicylic acid was used to detect ˙OH,66 which was an indirect colorimetric determination. Salicylic acid was hydroxylated to 2,3-DHBA upon the attack of ˙OH. A colorimetric nitrite-molybdate method was used to determinate 2,3-DHBA. An aliquot from the mixture was oxidized with a nitrite-molybdate(vi) reagent to give an intense red product in an alkaline medium with the maximal absorbance at 510 nm. The concentration of ferrous ions was quantified by UV-vis spectrophotometry with 1,10-phenanthroline.67 Total phosphorus (TP) was measured by an ammonium molybdate spectrophotometric method (GB 11893-89 in Chinese).
Conclusions
In conclusion, two composite heterogeneous catalysts, namely, CoNWs@CoAl-LDHs/Fe3O4 and CoNPs@CoAl-LDHs/Fe3O4 have been successfully obtained and applied for the rapid degradation of organic phosphonates (HEDP and PMG) in the electro-Fenton system. In addition, CoNWs@CoAl-LDHs/Fe3O4 had a higher catalytic activity than that of CoNPs@CoAl-LDHs/Fe3O4. Under optimal conditions, a pH of 3, 1.4 g of cobalt nanowires and a reaction time of 2 h, the removal rate of HEDP (100 mg L−1) could reach 82.45% and the removal rate of PMG (100 mg L−1) was nearly 100%. For the improvement of the specific surface area, the active sites of CoNWs@CoAl-LDHs/Fe3O4 increased, which facilitated better performance. There was also a slight increase in the ferrous ion concentration in the solution of CoNWs@CoAl-LDHs/Fe3O4 electro-Fenton system. Both homogeneous and heterogeneous reactions were improved by the CoNWs. We suggest that it is effective to induce cobalt in the form of nanowires in a heterogenous E-Fenton system.
Conflicts of interest
There are no conflicts to declare.
Supplementary Material
Acknowledgments
This research was supported by the International Scientific and Technological Innovation and Cooperation Project of Sichuan (No. 2019YFH0170).
Electronic supplementary information (ESI) available. See DOI: 10.1039/d1ra08493c
Notes and references
- Drzyzga D. Lipok J. Environ. Sci. Pollut. Res. Int. 2017;24:24364–24375. doi: 10.1007/s11356-017-0068-1. [DOI] [PMC free article] [PubMed] [Google Scholar]
- Baldwin D. S. Environ. Chem. 2013;10:439–454. doi: 10.1071/EN13151. [DOI] [Google Scholar]
- Rott E. Steinmetz H. Metzger J. W. Sci. Total Environ. 2018;615:1176–1191. doi: 10.1016/j.scitotenv.2017.09.223. [DOI] [PubMed] [Google Scholar]
- Mady M. F. Rehman A. Kelland M. A. ACS Omega. 2021;6:6488–6497. doi: 10.1021/acsomega.1c00379. [DOI] [PMC free article] [PubMed] [Google Scholar]
- Hein L. Zenobi M. C. Rueda E. J. Colloid Interface Sci. 2007;314:317–323. doi: 10.1016/j.jcis.2007.05.050. [DOI] [PubMed] [Google Scholar]
- Awad H. S. Turgoose S. Br. Corros. J. 2013;37:147–154. doi: 10.1179/000705902225004347. [DOI] [Google Scholar]
- Akrout H. Bousselmi L. Maximovitch S. Triki E. Dalard F. J. Mater. Sci. 2012;47:8085–8093. doi: 10.1007/s10853-012-6702-x. [DOI] [Google Scholar]
- Huang N. Wang W. L. Xu Z. B. Wu Q. Y. Hu H. Y. J. Environ. Manage. 2019;237:180–186. doi: 10.1016/j.jenvman.2019.02.055. [DOI] [PubMed] [Google Scholar]
- Koju R. Miao S. Luo J. Wang D. Raj Joshi D. Bai Y. Liu R. Liu H. Qu J. Chem. Eng. J. 2020:402. [Google Scholar]
- Wang S. Zhang B. Shan C. Yan X. Chen H. Pan B. Water Res. 2020;184:116173. doi: 10.1016/j.watres.2020.116173. [DOI] [PubMed] [Google Scholar]
- Benbrook C. M. Environ. Sci. Eur. 2016;28:3. doi: 10.1186/s12302-016-0070-0. [DOI] [PMC free article] [PubMed] [Google Scholar]
- Battaglin W. A. Meyer M. T. Kuivila K. M. Dietze J. E. J. Am. Water Resour. Assoc. 2014;50:275–290. doi: 10.1111/jawr.12159. [DOI] [Google Scholar]
- Coupe R. H. Kalkhoff S. J. Capel P. D. Gregoire C. Pest Manage. Sci. 2012;68:16–30. doi: 10.1002/ps.2212. [DOI] [PubMed] [Google Scholar]
- McClellan R. O. Crit. Rev. Toxicol. 2016;46:1–2. doi: 10.1080/10408444.2016.1234117. [DOI] [PubMed] [Google Scholar]
- Ma D. Yi H. Lai C. Liu X. Huo X. An Z. Li L. Fu Y. Li B. Zhang M. Qin L. Liu S. Yang L. Chemosphere. 2021:275. doi: 10.1016/j.chemosphere.2021.130104. [DOI] [PubMed] [Google Scholar]
- Giannakis S. Lin K.-Y. A. Ghanbari F. Chem. Eng. J. 2021:406. [Google Scholar]
- Neyens E. Baeyens J. J. Hazard. Mater. 2003;98:33–50. doi: 10.1016/S0304-3894(02)00282-0. [DOI] [PubMed] [Google Scholar]
- Bello M. M. Abdul Raman A. A. Asghar A. Process Saf. Environ. Prot. 2019;126:119–140. doi: 10.1016/j.psep.2019.03.028. [DOI] [Google Scholar]
- Guo S. Yuan N. Zhang G. Yu J. C. Microporous Mesoporous Mater. 2017;238:62–68. doi: 10.1016/j.micromeso.2016.02.033. [DOI] [Google Scholar]
- Cheng-chun J. Jia-fa Z. J. Zhejiang Univ., Sci., A. 2007;8:1118–1125. doi: 10.1631/jzus.2007.A1118. [DOI] [Google Scholar]
- Casado J. J. Environ. Chem. Eng. 2019;7:102823. doi: 10.1016/j.jece.2018.102823. [DOI] [Google Scholar]
- Ahmad S., Nawaz T., Rahman H. U., Saher S. and Ahmed M., presented in part at the 2021 International Conference on Emerging Power Technologies, 2021 [Google Scholar]
- Ganiyu S. O. Zhou M. Martínez-Huitle C. A. Appl. Catal., B. 2018;235:103–129. doi: 10.1016/j.apcatb.2018.04.044. [DOI] [Google Scholar]
- Wang J. Tang J. Chemosphere. 2021;276:130177. doi: 10.1016/j.chemosphere.2021.130177. [DOI] [PubMed] [Google Scholar]
- Kuang Y. Zhao L. Zhang S. Zhang F. Dong M. Xu S. Materials. 2010;3:5220–5235. doi: 10.3390/ma3125220. [DOI] [PMC free article] [PubMed] [Google Scholar]
- Goh K. H. Lim T. T. Dong Z. Water Res. 2008;42:1343–1368. doi: 10.1016/j.watres.2007.10.043. [DOI] [PubMed] [Google Scholar]
- Zubair M. Daud M. McKay G. Shehzad F. Al-Harthi M. A. Appl. Clay Sci. 2017;143:279–292. doi: 10.1016/j.clay.2017.04.002. [DOI] [Google Scholar]
- Huang Q. Zhao J. Liu M. Chen J. Zhu X. Wu T. Tian J. Wen Y. Zhang X. Wei Y. J. Taiwan Inst. Chem. Eng. 2018;82:92–101. doi: 10.1016/j.jtice.2017.10.019. [DOI] [Google Scholar]
- Wang Y. Qiao M. Li Y. Wang S. Small. 2018;14:e1800136. doi: 10.1002/smll.201800136. [DOI] [PubMed] [Google Scholar]
- He X. Li R. Liu J. Liu Q. chen R. Song D. Wang J. Chem. Eng. J. 2018;334:1573–1583. doi: 10.1016/j.cej.2017.11.089. [DOI] [Google Scholar]
- Jin W. Park D. H. Nanomaterials. 2019;9:1404. doi: 10.3390/nano9101404. [DOI] [PMC free article] [PubMed] [Google Scholar]
- Cao Z. Li B. Sun L. Li L. Xu Z. P. Gu Z. Small Methods. 2019;4:1900343. doi: 10.1002/smtd.201900343. [DOI] [Google Scholar]
- Fuku K. Kanai H. Todoroki M. Mishima N. Akagi T. Kamegawa T. Ikenaga N. Chem. - Asian J. 2021;16(14):1887–1892. doi: 10.1002/asia.202100375. [DOI] [PubMed] [Google Scholar]
- Ganiyu S. O. Huong Le T. X. Bechelany M. Esposito G. van Hullebusch E. D. Oturan M. A. Cretin M. J. Mater. Chem. A. 2017;5:3655–3666. doi: 10.1039/C6TA09100H. [DOI] [Google Scholar]
- Bai J. Liu Y. Yin X. Duan H. Ma J. Appl. Surf. Sci. 2017;416:45–50. doi: 10.1016/j.apsusc.2017.04.117. [DOI] [Google Scholar]
- Zhong P. Yu Q. Zhao J. Xu S. Qiu X. Chen J. J. Colloid Interface Sci. 2019;552:122–133. doi: 10.1016/j.jcis.2019.05.040. [DOI] [PubMed] [Google Scholar]
- Zhang H. Li G. Deng L. Zeng H. Shi Z. J. Colloid Interface Sci. 2019;543:183–191. doi: 10.1016/j.jcis.2019.02.059. [DOI] [PubMed] [Google Scholar]
- Li S. Lin J. Xiong W. Guo X. Wu D. Zhang Q. Zhu Q.-L. Zhang L. Coord. Chem. Rev. 2021:438. [Google Scholar]
- Bokare A. D. Choi W. J. Hazard. Mater. 2014;275:121–135. doi: 10.1016/j.jhazmat.2014.04.054. [DOI] [PubMed] [Google Scholar]
- Yang J. Zeng D. Li J. Dong L. Ong W.-J. He Y. Chem. Eng. J. 2021:404. [Google Scholar]
- Li X. Huang X. Xi S. Miao S. Ding J. Cai W. Liu S. Yang X. Yang H. Gao J. Wang J. Huang Y. Zhang T. Liu B. J. Am. Chem. Soc. 2018;140:12469–12475. doi: 10.1021/jacs.8b05992. [DOI] [PubMed] [Google Scholar]
- Peng H. Liu F. Liu X. Liao S. You C. Tian X. Nan H. Luo F. Song H. Fu Z. Huang P. ACS Catal. 2014;4:3797–3805. doi: 10.1021/cs500744x. [DOI] [Google Scholar]
- Santhi U., Ngui W. K., Samykano M., Sudhakar K., Kadirgama K., Sangmesh B. and Kumar M. A. R., Presented in part at the AIP Conference Proceedings, 2019 [Google Scholar]
- Chiba D. Fukami S. Shimamura K. Ishiwata N. Kobayashi K. Ono T. Nat. Mater. 2011;10:853–856. doi: 10.1038/nmat3130. [DOI] [PubMed] [Google Scholar]
- Li X. Sun L. Wang H. Xie K. Long Q. Lai X. Liao L. Beilstein J. Nanotechnol. 2016;7:990–994. doi: 10.3762/bjnano.7.91. [DOI] [PMC free article] [PubMed] [Google Scholar]
- Bala H. Fu W. Yu Y. Yang H. Zhang Y. Appl. Surf. Sci. 2009;255:4050–4055. doi: 10.1016/j.apsusc.2008.10.119. [DOI] [Google Scholar]
- Thommes M. Kaneko K. Neimark A. V. Olivier J. P. Rodriguez-Reinoso F. Rouquerol J. Sing K. S. W. Pure Appl. Chem. 2015;87:1051–1069. [Google Scholar]
- Kim J. Kim T. H. Lee J. H. Park Y. A. Kang Y. J. Ji H. G. Appl. Clay Sci. 2021:205. [Google Scholar]
- Kuhn R. Jensch R. Bryant I. M. Fischer T. Liebsch S. Martienssen M. Chemosphere. 2018;210:726–733. doi: 10.1016/j.chemosphere.2018.07.033. [DOI] [PubMed] [Google Scholar]
- Zuo C. Li L. Chen W. Zhang Z. Appl. Surf. Sci. 2021:554. [Google Scholar]
- Li Z. Yang W. Xie L. Li Y. Liu Y. Sun Y. Bu Y. Mi X. Zhan S. Hu W. Appl. Surf. Sci. 2021:549. [Google Scholar]
- Yang Y. Deng Q. Yan W. Jing C. Zhang Y. Chem. Eng. J. 2018;352:581–589. doi: 10.1016/j.cej.2018.07.058. [DOI] [Google Scholar]
- Xue W. Zhang G. Xu X. Yang X. Liu C. Xu Y. Chem. Eng. J. 2011;167:397–402. doi: 10.1016/j.cej.2011.01.007. [DOI] [Google Scholar]
- Zazo J. A. Casas J. A. Mohedano A. F. Rodríguez J. J. Appl. Catal., B. 2006;65:261–268. doi: 10.1016/j.apcatb.2006.02.008. [DOI] [Google Scholar]
- Carrillo V. Fuentes B. Gómez G. Vidal G. Rev. Environ. Sci. Bio/Technol. 2020;19:389–418. doi: 10.1007/s11157-020-09533-1. [DOI] [Google Scholar]
- Frias Batista L. M. Meader V. K. Romero K. Kunzler K. Kabir F. Bullock A. Tibbetts K. M. J. Phys. Chem. B. 2019;123:7204–7213. doi: 10.1021/acs.jpcb.9b04643. [DOI] [PubMed] [Google Scholar]
- Rodríguez E. M. Márquez G. Tena M. Álvarez P. M. Beltrán F. J. Appl. Catal., B. 2015;178:44–53. doi: 10.1016/j.apcatb.2014.11.002. [DOI] [Google Scholar]
- Lenarda A. Bevilacqua M. Tavagnacco C. Nasi L. Criado A. Vizza F. Melchionna M. Prato M. Fornasiero P. ChemSusChem. 2019;12:1664–1672. doi: 10.1002/cssc.201900238. [DOI] [PubMed] [Google Scholar]
- Kehrer J. P. J. T. Toxicology. 2000;149:43–50. doi: 10.1016/S0300-483X(00)00231-6. [DOI] [PubMed] [Google Scholar]
- Zhang F. Xue X. Huang X. Yang H. J. Mater. Sci. 2020;55:15695–15708. doi: 10.1007/s10853-020-05159-4. [DOI] [Google Scholar]
- Pignatello J. J. Esther O. MacKay A. Crit. Rev. Environ. Sci. Technol. 2006;36:1–84. doi: 10.1080/10643380500326564. [DOI] [Google Scholar]
- Balsamo N. Mendieta S. Oliva M. Eimer G. Crivello M. Procedia Mater. Sci. 2012;1:506–513. doi: 10.1016/j.mspro.2012.06.068. [DOI] [Google Scholar]
- Maodong L. Bin Z. Lin Y. Junming Z. Yuhui D. Hui Z. Zhiping Z. Ind. Water Treat. 2013;33:75–77. [Google Scholar]
- Association A. P. H., Association A. W. W., Federation W. P. C. and Federation W. E., Standard methods for the examination of water and wastewater, American Public Health Association, 1912 [Google Scholar]
- Rao K. T. Mohan Y. V. Naveen N. Rao L. V. Asian J. Chem. 2013;25:4107–4108. doi: 10.14233/ajchem.2013.13739. [DOI] [Google Scholar]
- Bayarsaikhan G. Ferda D. Avan A. N. Cekic S. D. Apak R. Anal. Lett. 2018;51:236–253. doi: 10.1080/00032719.2017.1328689. [DOI] [Google Scholar]
- Smith G. L. Reutovich A. A. Srivastava A. K. Reichard R. E. Welsh C. H. Melman A. Bou-Abdallah F. J. Inorg. Biochem. 2021;220:111460. doi: 10.1016/j.jinorgbio.2021.111460. [DOI] [PubMed] [Google Scholar]
Associated Data
This section collects any data citations, data availability statements, or supplementary materials included in this article.


