Abstract
Peripheral neuropathy arising from physical trauma is estimated to afflict 20 million people in the United States alone. In one common surgical intervention, neural conduits are placed over the nerve stumps to bridge the gap and create a microenvironment conducive to regeneration. It has been proposed that a biocompatible material such as cellulose nanofiber may serve as a viable conduit material, providing a non-inflammatory and mechanically stable system. Preliminary studies have shown that cellulose nanofiber conduits successfully aid neural regeneration and further, that the dimensions of the conduit relative to the nerve gap have an impact on efficacy in murine models. It has been hypothesized that the reliance of regeneration upon the physical dimensions of the conduit may be related to modified modes of diffusion and/or distances of key cellular nutrients and waste metabolites to/from the injury site. The present work investigates the concentration profile of glucose within the conduit via finite element analysis as a function of the physical dimensions of the conduit. It was determined that the magnitude of glucose diffusion was greater through the conduit walls than through the luminal space between the nerve and the inner wall of the conduit, and that as such radial diffusion is dominant over axial diffusion.
Keywords: Cellulose Nanofiber, Neural Conduits, Glucose Diffusion, Finite Element Analysis
Introduction:
Peripheral nerve injuries are a common affliction, fortunately however, for neural gaps of approximately 1mm or less, the body has the innate ability to self-repair (Gaudin et al. 2016). When the injury is too extensive for the native repair processes to be effective, several methods of surgical intervention may be employed. If the neural gap is minor, the nerve stumps may be sutured directly to each other, however care must be taken to avoid the creation of neural tension which can compromise vascular supply, leading to diminished regeneration (Dahlin and Wiberg 2017). If the nerve gap is too large for direct suturing, the repair method of choice is typically a neural autograft, often employing the patient’s sural nerve (Gaudet, Popovich, and Ramer 2011; Moor et al. 2010). Alternatively, an allograft from another individual may be employed, however an immunosuppressant regimen is typically required in order to prevent a foreign body response and resultant tissue rejection (Kehoe, Zhang, and Boyd 2012). If a neural graft is not a viable methodology for a given individual/injury, a neural conduit may be placed over the proximal and distal nerve stumps to create a microenvironment that promotes regeneration. Once the nerve has successfully regenerated, the conduit is typically removed via a second surgery. Commercially available neural conduits are composed of a variety of materials, each with characteristic physical and biological response properties (Kehoe, Zhang, and Boyd 2012). Conduit design is guided by material selection aimed at minimizing the potential for immune/inflammatory responses while ensuring that the conduit maintains structural integrity for the period of time required for regeneration (Kokai et al. 2009). Most conduits approved for use in the United States have degradation times in vivo ranging from several months to years, or are non-biodegradable (Gaudin et al. 2016) – control of the rate of degradation is therefore an important design factor as it governs the duration of maintenance of a microenvironment suitable for regeneration, the extent of mechanical support, and potentially dictates the need, or not, for a second surgery to remove the conduit (Kehoe, Zhang, and Boyd 2012).
In addition to the material dependent design constraints outlined above, other important considerations for neural conduit design relate to ease of surgical implantation, and minimization of tissue trauma (Grinsell and Keating 2014; Barton et al. 2014). For example, conduits comprised of rigid materials require the use of a larger bore needle during implantation to suture the conduits in place, resulting in more extensive tissue damage (Kehoe, Zhang, and Boyd 2012; Haug 2009). Further, suturing rigid materials has been observed on occasion to result in fragmentation of the conduit and resultant irritation of the regenerating nerve (Haug 2009; Meek and Jansen 2009). The authors and collaborators have recently performed preliminary in vivo experiments employing a sciatic nerve murine model to test the efficacy of peripheral nerve conduits comprised of cellulose nanofiber (CNF). CNF is considered an excellent candidate material for peripheral nerve conduits as other studies have shown that it is bio-inert (Lohrasbi et al. 2020), has excellent mechanical properties(Takagi and Asano 2008), degrades over time in vivo (Xue, Mou, and Xiao 2017), and is flexible (Niu et al. 2018). The CNF conduit in vivo studies demonstrated that indeed peripheral nerve regeneration was promoted, that the conduits were mechanically stable (no deformation was observed in vivo due to compressive forces), and that tissue damage during implantation was minimal due to the conduit’s inherent flexibility. In addition, the studies provided evidence that the physical dimensions of the conduit relative to the nerve and the extent of the nerve gap had a significant effect on the rate and extent of regeneration. The findings suggest that the dimensions of the conduit may affect the microenvironment within it, likely via modification of diffusion paths and distances of pro and anti- regenerative species.
The microenvironment within a peripheral nerve conduit results from localized up regulation and release of pro-regenerative growth factors (Kokai et al. 2009; Taras, Nanavati, and Steelman 2005), as well as control of the concentration of molecules critical for homeostasis including oxygen and glucose. In a recent study the authors performed a finite element analysis of the concentration gradients of oxygen within a peripheral nerve conduit as a function of the physical dimensions of the conduit and the gap between the nerve and the inner wall of the conduit. Clear trends in oxygen concentration and distribution were observed as a function of conduit length, the ratio of the nerve to the conduit diameter, and the permeability of the wall of the conduit to oxygen. While the study was highly informative, oxygen is only one molecule required for tissue maintenance and regeneration, perhaps equally important is the concentration and distribution of glucose, the primary energy source for neural function (Sibson et al. 1998; Mergenthaler 2014). Indeed it has been estimated that at homeostasis, 60–70% of the energy derived from glucose is used for maintenance of the membrane potential required for neural signal propagation (Berg, Tymoczko, and Stryer 2002). Under conditions of nerve regeneration, however, glucose consumption is expected to be far greater (Lim, Rone, et al. 2015) and may potentially be rate limiting. It is important to ensure that glucose levels are maintained above ~4 mol/m3, below that is considered hypoglycemic and is associated with deleterious effects on tissues (Stecker and Stevenson 2014). As such, knowledge of the concentration and distribution of glucose within a peripheral nerve conduit during regeneration is critical to the design of effective and efficient neural conduits. The present work employs COMSOL Multiphysics®, a finite element analysis software package, to model the diffusive behavior of glucose within a peripheral nerve conduit system as a function of conduit length, the nerve to conduit diameter ratio, and the permeability of the conduit wall to glucose.
Materials and Methods:
COMSOL Multiphysics® was employed to model glucose concentration gradients and distributions in the peripheral nerve/conduit system in a manner comparable to that employed previously by the authors for analysis of oxygen concentration gradients and distributions. Specifically, 19mm long cylindrical nerve stumps of 3mm diameter were employed with a nerve gap of 3mm created between the proximal (right hand) stump, and the distal (left hand) stump. A 1mm long region at the terminus of the proximal stump was delineated to represent the regenerating neural tissue; glucose consumption in this region was specified to be twice that of baseline neural consumption, consistent with literature (Lim, Shi, et al. 2015; Lim, Rone, et al. 2015). A conduit with a wall thickness of 0.1mm was centered over the nerve gap. The length of the conduit was varied between 12 and 16mm in 1mm increments. Similarly, the diameter of the conduit was varied from 3.00mm to 4.28mm resulting in nerve to conduit diameter ratios ranging from 1.00:1.00 to 0.70:1.00, respectively, in increments of 0.05. Note that at a nerve to conduit diameter of 1.00:1.00 the nerve and conduit have the same diameter and no space exists between them. At progressively lower values of the nerve to conduit diameter ratio an increasingly large volume exists between the nerve and the inner conduit wall. The volume was modeled to be filled with interstitial fluid, as was the gap between the neural stumps. Figure 1 presents in schematic form the peripheral nerve/conduit system for conduits of 0.70:1.00 and 1.00:1.00 nerve to conduit diameter ratio. The parameters employed for the peripheral nerve/conduit model were derived from physical conduits made for implantation, and measured values for murine sciatic nerve anatomy, determined in previous in vivo animal studies performed by the authors and collaborators, Table 1.
Figure 1:
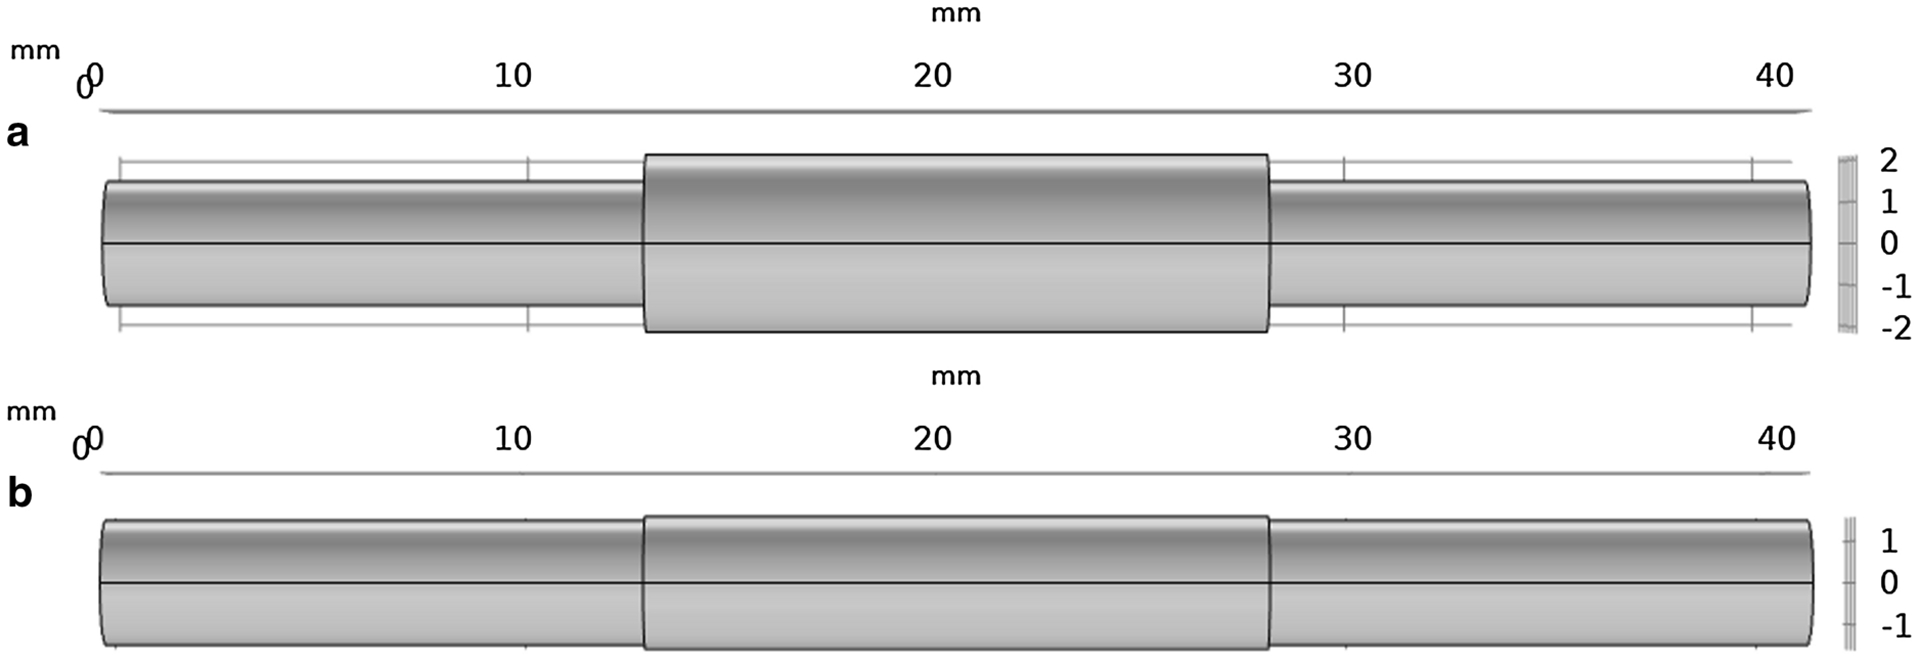
(a) An x-y view of a conduit with a 0.70:1.00 nerve to conduit diameter ratio. (b) An x-y view of a conduit with a 1.00:1.00 nerve to conduit diameter ratio.
Table 1:
Physical parameters of the COMSOL Multiphysics® nerve/conduit model
| Component | |||
|---|---|---|---|
| Conduit | Length | 12, 13,14, 15, 16 | mm |
| Diameter | 3.00, 3.16, 3.34, 3.52, 3.76, 4,00, 4.28 | mm | |
| Thickness | 0.1 | mm | |
| Neural Tissue | Diameter | 3 | mm |
| Distal Length | 19 | mm | |
| Proximal Length | 18 | mm | |
| Proximal Tip Length | 1 | mm | |
| Interstitial Fluid | Neural Gap Length | 3 | mm |
| Conduit to Nerve Radial Gap | Conduit Diameter - Nerve Diameter | mm |
Glucose concentration was monitored in terms of distribution throughout the nerve/conduit system represented by a colorimetric scale, see Figure 2a. In addition, glucose concentration was monitored as a function of time at three locations with the conduit. Glucose concentration was monitored on the central axis at location 1 in the distal stump equidistant from the end of the conduit and the end of the nerve within the conduit where baseline glucose consumption occurs, at location 2 in the middle of the nerve gap (filled with interstitial fluid) where no glucose consumption occurs, and at location 3 in the proximal nerve at the boundary of the baseline and the regenerating region where twice baseline glucose consumption occurs, see Figure 2b.
Figure 2:

(a) Glucose distribution within the nerve/conduit system represented via a colorimetric scale. (b) A wire-frame view of the nerve/conduit system with the three locations employed for temporal glucose concentration analysis delineated.
The COMSOL Multiphysics® model, equipped with the Transport of Diluted Species physics package, generated time-dependent glucose concentration profiles within the nerve/conduit system. Several parameters required definition prior to commencing the modeling; the initial glucose concentration in the interstitial fluid and neural tissue, the diffusion coefficient of glucose in the conduit wall, the interstitial fluid, and the neural tissue, and the baseline (and by extrapolation the regenerating) neural glucose consumption rate required definition.
Blood glucose levels of healthy individuals are known to be in the range of 4.2 to 8.3 mmol/L (Stecker and Stevenson 2014), with most individuals having a blood glucose level of greater than 5 mmol/L (Tirosh, Shai, and Rudich 2006). In addition, it has been shown that interstitial fluid glucose concentration is comparable to that of blood plasma, with no measurable lag time (Thennadil et al. 2001). As such a nominal value of 6 mmol/L was selected as the initial interstitial fluid glucose concentration. The neural tissue was assumed to have equilibrated with the large glucose reservoir of the body’s interstitial fluid and was therefore assigned an initial concentration of 6 mmol/L. The CNF conduit was modeled with an initial glucose concentration within the wall of 0 mmol/L.
The permeability of the neural tissue was approximated via a value for the glucose diffusion coefficient reported by Khalil et al. for epithelial tissue and dura mater as 2.64 × 10⁻¹⁰ m2/s (Khalil, Kretsos, and Kasting 2006). It is noted however that the ends of the proximal and distal nerves not within the conduit were modeled as impermeable to glucose since in vivo they would extend significant distances within the body and would not be subject to glucose flux axially from an open end. The diffusion coefficient of interstitial fluid was approximated via a value reported by Suhaimi et al. for glucose diffusivity in cell culture medium as 5.67 × 10⁻¹⁰ m2/s (Suhaimi, Wang, and Das 2015). The diffusion coefficient of glucose in the cellulose nanofiber conduit wall was determined experimentally in the present work. Specifically, a series of tanks were designed and constructed that were equipartitioned via a cellulose nanofiber film comparable to those employed to create the conduits (~ 50 μm in thickness (dry)). The cellulose nanofiber film was created by casting CNF slurry (at 2 wt% CNF, produced by the University of Maine Process Development Center) on a stainless-steel plate. The films were allowed to air dry for a 24-hour period before being removed from the plate and cut to the appropriate size. One chamber per tank was filled with a phosphate buffered saline (PBS) solution of known glucose concentration (referred to as the donor chamber), the other chamber was filled with a PBS solution of zero glucose concentration (referred to as the receiver chamber). Due to the concentration gradient, glucose diffused across the CNF film from the donor to the receiver chamber; glucose concentrations in the receiver container were monitored as a function of time to enable calculation of a diffusion coefficient. The diffusion coefficient was calculated via a method adapted from that of Suhaimi et al. (2015), represented by Equation 1
| Equation (1) |
where Cd and Cr are the initial glucose concentrations of the donor and receiver chambers, respectively, in mol/m3. l is the thickness of the CNF film in meters, A corresponds to the area of the CNF film in m2, V represents the volume of the donor/receiver chambers (which were equivalent) in m3, ∂Cr is the difference in glucose concentration measured in the receiver chamber in mol/m3 for a given time interval of ∂t in seconds. Finally, De is the effective diffusion coefficient of CNF to glucose in m2/s. It is noted that all parameters in Equation 1 are known from the experimental design, or may be measured, to yield a diffusion coefficient.
The bi-chambered tanks, see Figure 3, were constructed from 3.175 mm thick polycarbonate with internal dimensions of 50mm H × 50mm W × 80mm L, an acrylic plastic cement adhesive (SciGrip 16) was employed to glue and seal all joints. A central divider was implemented to separate the tanks into two equal sized chambers. The divider was constructed of two 50mm ×50mm pieces of polycarbonate from which approximately a 40mm × 42.5mm rectangle of polycarbonate had been removed from the center. A 50mm × 50mm film of CNF was placed between the two polycarbonate divider components and sandwiched in place employing SciGrip 16 adhesive. The divider was subsequently glued in place, again employing SciGrip 16 adhesive. After all the joints had cured (24 hours), the chambers of a given device were filled with PBS solutions containing, or not, a defined concentration of glucose and subsequently sealed from the atmosphere employing Parafilm®.
Figure 3:
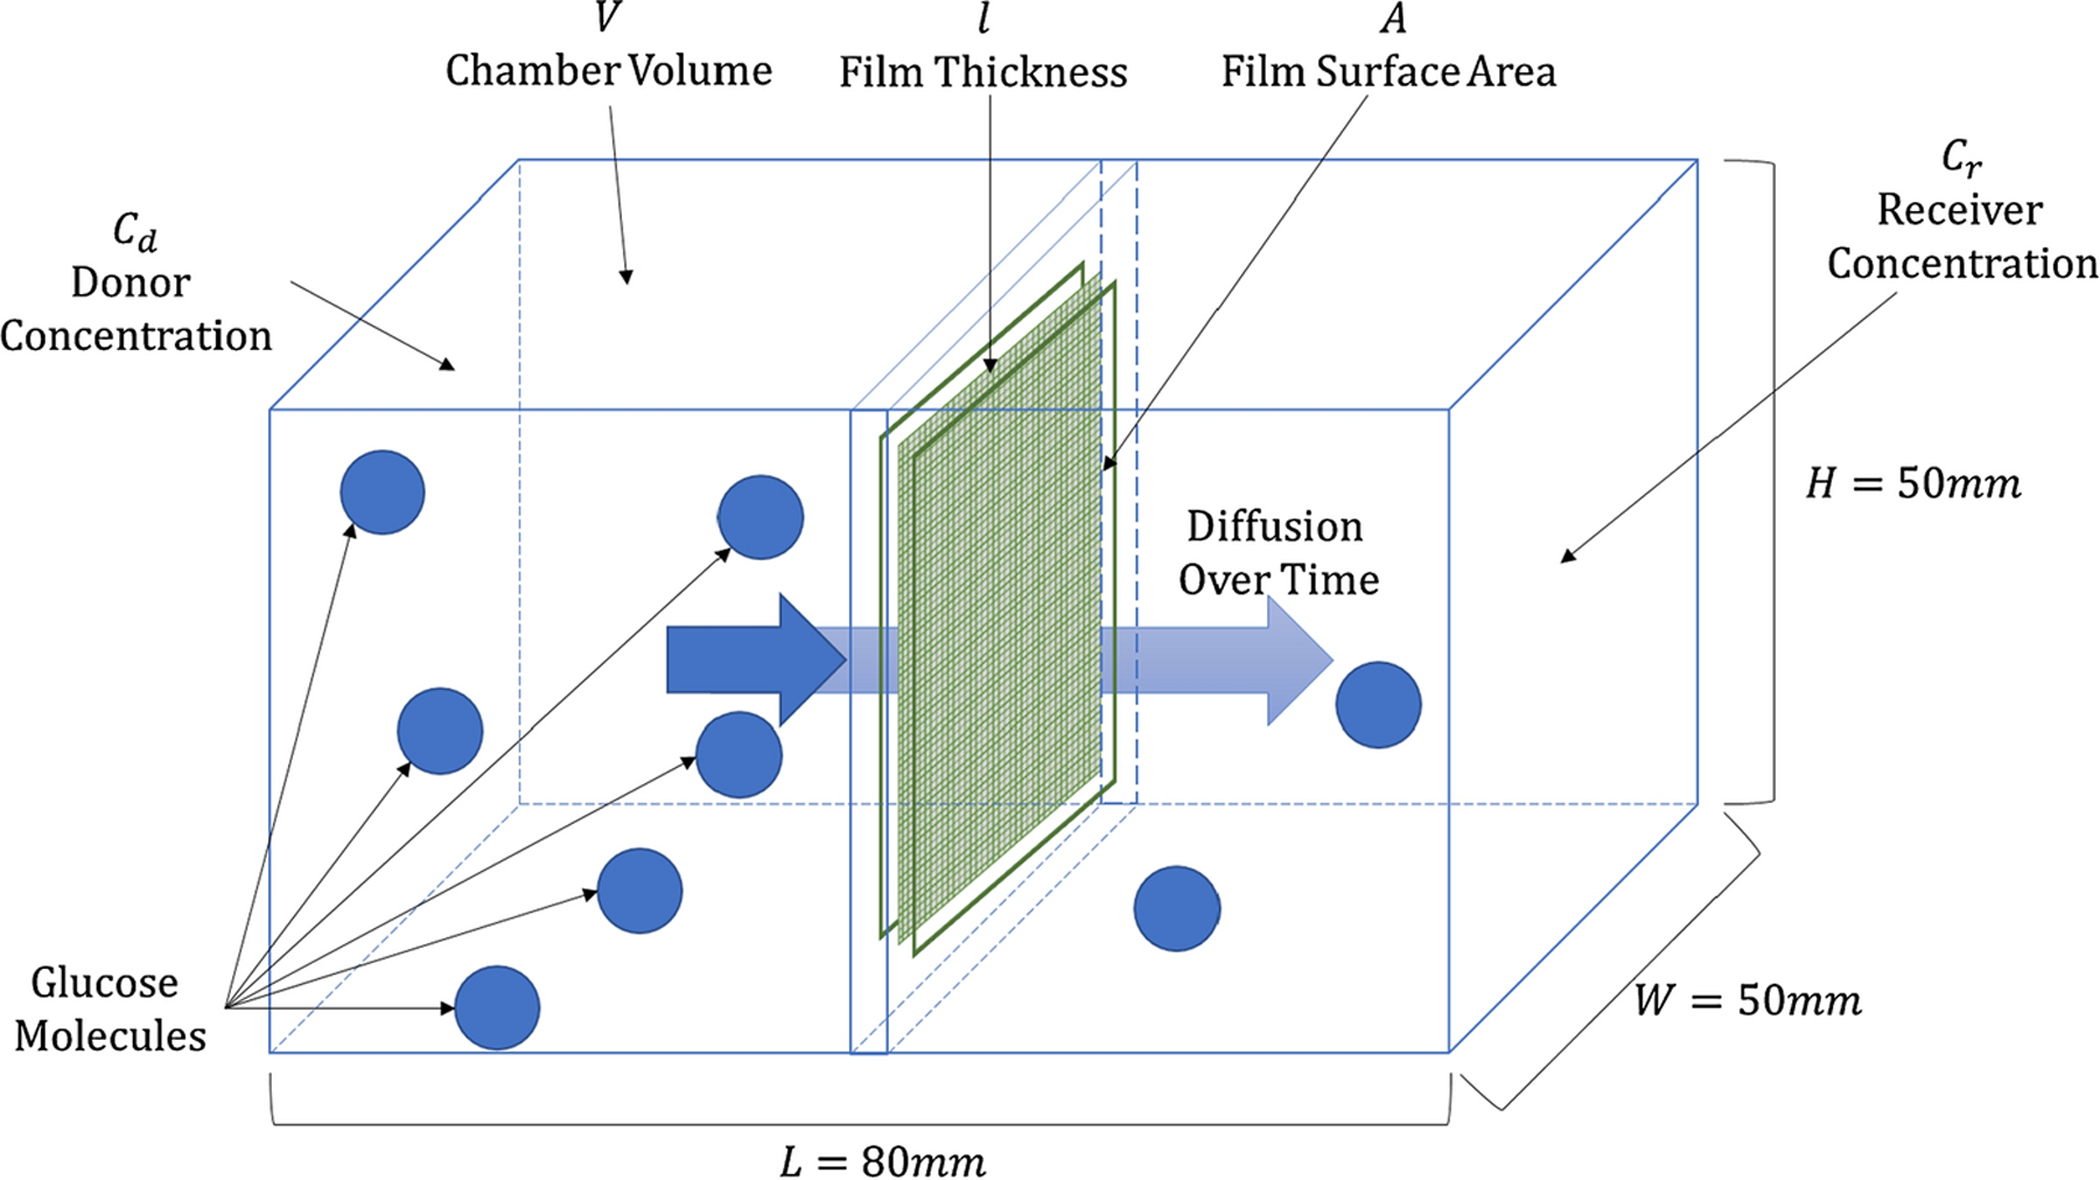
Bi-chambered diffusion tank for the determination of the CNF diffusion coefficient of glucose.
Glucose concentration was measured in the receiving chamber employing a glucose hexokinase assay kit (Sigma Aldrich GAHK20). The assay kit operates via a two-step enzymatic reaction. Initially, glucose and ATP are enzymatically phosphorylated to glucose-6-phosphate and ADP by hexokinase. Subsequently, glucose-6-phosphate dehydrogenase converts glucose-6-phosphate and NAD into 6-phosphocluconate and NADH. Each reaction is equimolar and consequently the concentration of NADH (which may be measured spectroscopically at 340nm) is directly proportional to the amount of glucose present in the original sample.
A calibration curve for NADH absorbance at 340nm vs glucose concentration was developed employing the assay kit and standard solutions prepared with known glucose concentrations in 1x PBS. Glucose concentrations spanned the biologically relevant range of 0 – 6mmol/L in increments of 1mmol/L. The measured NADH absorbance at 0mmol/L was invariant from the reference and hence was determined a single time. The remaining 6 standards were tested in triplicate. A linear calibration resulted from the measured absorbances with an r-squared value of 0.9997. Four bi-chambered diffusion tanks were created, resulting in a total of 12 absorbance values (and hence glucose concentrations) spanning a measured time range of 3 hrs to 96 hrs.
All parameters in Equation 1 were either defined by the experimental design, or readily measured, with the exception of CNF film thickness. The dry thickness of the film was readily determined using a digital caliper as 50 ± 2 μm. However, the relevant film thickness is that in the hydrated state. As such wet film thickness was measured via a digital caliper as approximately 70μm, indicating significant swelling, an observation confirmed via determination of the mass of water uptake. A film thickness of 70 μm was consequently used when employing Equation 1. Employing the data gathered from the bi-chambered diffusion experiments the glucose diffusion coefficient in CNF films was determined to be 1.7 ± 0.9 × 10⁻¹¹ m2/s, a value employed in subsequent COMSOL modeling.
A value for the rate of consumption of glucose by peripheral neural tissue was required. A literature value was unavailable, as such a range was determined via known values for consumption of glucose by brain tissue, and via application of a known relationship between neural oxygen consumption (which is well established) and the rate of glucose consumption. First, Mergenthaler reported a value of 5.6 mg of glucose consumed per 100 mg of human brain tissue per minute (Mergenthaler 2014). Employing average values for brain volume (Allen, Damasio, and Grabowski 2002) and weight (Harrison, Freemantle, and Geddes 2003), coupled with the molecular mass of glucose, resulted in a glucose consumption rate of 5.828 × 10⁻³ mol/(m3∙s). It is known that the brain consumes glucose at a greater rate than peripheral neural tissue (Jensen et al. 2014), although the precise proportionality is unknown, as such this value should be considered a high (likely maximum) value. Second, Mergenthaler (2014), and separately Lim, Rone, et al. (2015), have reported that there is a direct relationship between the rate of oxygen consumption by neural tissue and the rate of glucose consumption by the same tissue. Indeed, the rate of glucose consumption is 5.5–5.8 times lower than that of oxygen consumption. Oxygen consumption in a regenerating nerve has been found by Lim, Rone, et al. (2015), to be approximately twice that of a healthy nerve. Given the known linear relationship between neural oxygen and glucose consumption rates (Mergenthaler 2014; Lim, Rone, et al. 2015), it follows that the glucose consumption rate in a regenerating nerve should be double the baseline value. Applying this scaling factor to known oxygen consumption rates of peripheral neural tissue at baseline metabolic conditions and under active repair conditions (as reported by Lim, Rone, et al. (2015); Lim, Shi, et al. (2015); Han et al. (1996)) results in estimated values for glucose consumption rates of 1.673 and 3.345 × 10⁻⁴ mol/(m3∙s) respectively. It is noted that these values are approximately an order of magnitude lower than those obtained employing the known glucose consumption rate of brain tissue (which are certainly an over estimation for peripheral neural tissue) and are adopted here for the non-regenerating regions of the nerve stumps, and the regenerating tip of the proximal nerve, respectively.
The parameters discussed above are summarized in Table 2. The COMSOL Multiphysics® model was run employing an ‘Extra Fine’ mesh size over a time span of 5000 minutes in 10-minute increments.
Table 2:
Initial glucose concentration, diffusion coefficient and consumption rate values for the conduit, neural tissue and interstitial fluid
| Component | ||||
|---|---|---|---|---|
| Conduit | Initial Concentration | 0 | mol/m3 | |
| Diffusion Coefficient | 1.7 × 10⁻¹¹ | m2/s | ||
| Consumption | 0 | mol/ (m3∙s) | ||
| Neural Tissue | Initial Concentration | 6 | mol/m3 | |
| Diffusion Coefficient | 2.64 × 10⁻¹⁰ | m2/s | ||
| Consumption | Baseline | 1.673 × 10⁻⁴ | mol/ (m3∙s) | |
| Regeneration | 3.345 × 10⁻⁴ | mol/ (m3∙s) | ||
| Interstitial Fluid | Initial Concentration | 6 | mol/m3 | |
| Diffusion Coefficient | 5.7 × 10⁻¹⁰ | m2/s | ||
| Consumption | 0 | mol/ (m3∙s) | ||
Results and Discussion:
An investigation into the effect of variation of the nerve to conduit diameter ratio on the glucose concentration profile and distribution was performed for a 16mm conduit over a range of 0.70:1.00 to 1.00:1.00 in increments of 0.05, see Figure 4. It is evident that at all three locations within the conduit the glucose concentration progressively decreases as the nerve to conduit diameter ratio increases, that is, as the nerve and conduit diameters tend toward the same value. It is also noted that glucose concentrations plateaued in the range of ~5–5.75 mol/m3, i.e. above the approximate upper limit of hypoglycemia of 4 mol/m3 (Stecker and Stevenson 2014). The sensitivity of glucose concentration to nerve to conduit diameter ratio at the three locations may be understood in terms of length of the diffusion path axially within the conduit, the length of the radial diffusion pathway from the inner conduit wall to the nerve, and on the relative glucose consumption rates at the given locations. Notably, at location 1 the axial diffusion path for glucose is the shortest of the three locations and hence axial diffusion is a significant contributor to the instantaneous glucose concentration. The effect of nerve to conduit ratio is greatest at location 1 (greatest range of plateau concentration values), a fact that may be attributed to the decrease in volume of interstitial fluid between the inner conduit wall and the nerve as the conduit diameter approaches that of the nerve. The diffusion coefficient of glucose in interstitial fluid is approximately twice that of neural tissue, and more than an order of magnitude greater than in the CNF conduit wall, as such the effect of reduction of ISF volume is significant in regimes that have a dependence on axial diffusion. It is expected that radial diffusion of glucose does contribute to the instantaneous concentration at location 1, although changes in nerve to conduit diameter are not expected to result in large changes in glucose concentrations resulting from radial diffusion since the change in diffusion distance from the inner conduit wall to the nerve is minor when compared to typical axial diffusion paths. It is noted that the plateau glucose concentrations at location 1 are intermediate between those of locations 2 and 3, a fact attributed to baseline neural glucose consumption, versus no consumption at location 2 and twice baseline consumption at location 3. At location 2 the axial diffusion distance for glucose is the greatest of the three locations, as such it is expected that axial diffusion will play a minor role in the instantaneous glucose concentration, and that radial diffusion will dominate. The glucose concentration at location 2 plateaued to the same value irrespective of the nerve to conduit diameter, an observation attesting to the dominance of radial diffusion over axial diffusion. As observed above, the instantaneous glucose concentrations at location 2 are the highest of the three locations, a fact attributed to the lack of neural consumption in the gap between the nerve stumps. Location 3 resides at an axial distance from the end of the conduit that is intermediate between that of locations 1 and 2 and as such likely has instantaneous glucose concentrations that are influenced by both axial and radial diffusion. Indeed, a similar but less strong dependence on nerve to conduit diameter ratio is observed at location 3 versus that at location 1, suggesting not quite as strong an axial diffusion dependence, and a greater radial diffusion dependence. It is noted that the glucose consumption rate is twice that which occurs at location 1, a fact reflected in the glucose concentrations at location 3 being the lowest of the three locations.
Figure 4:
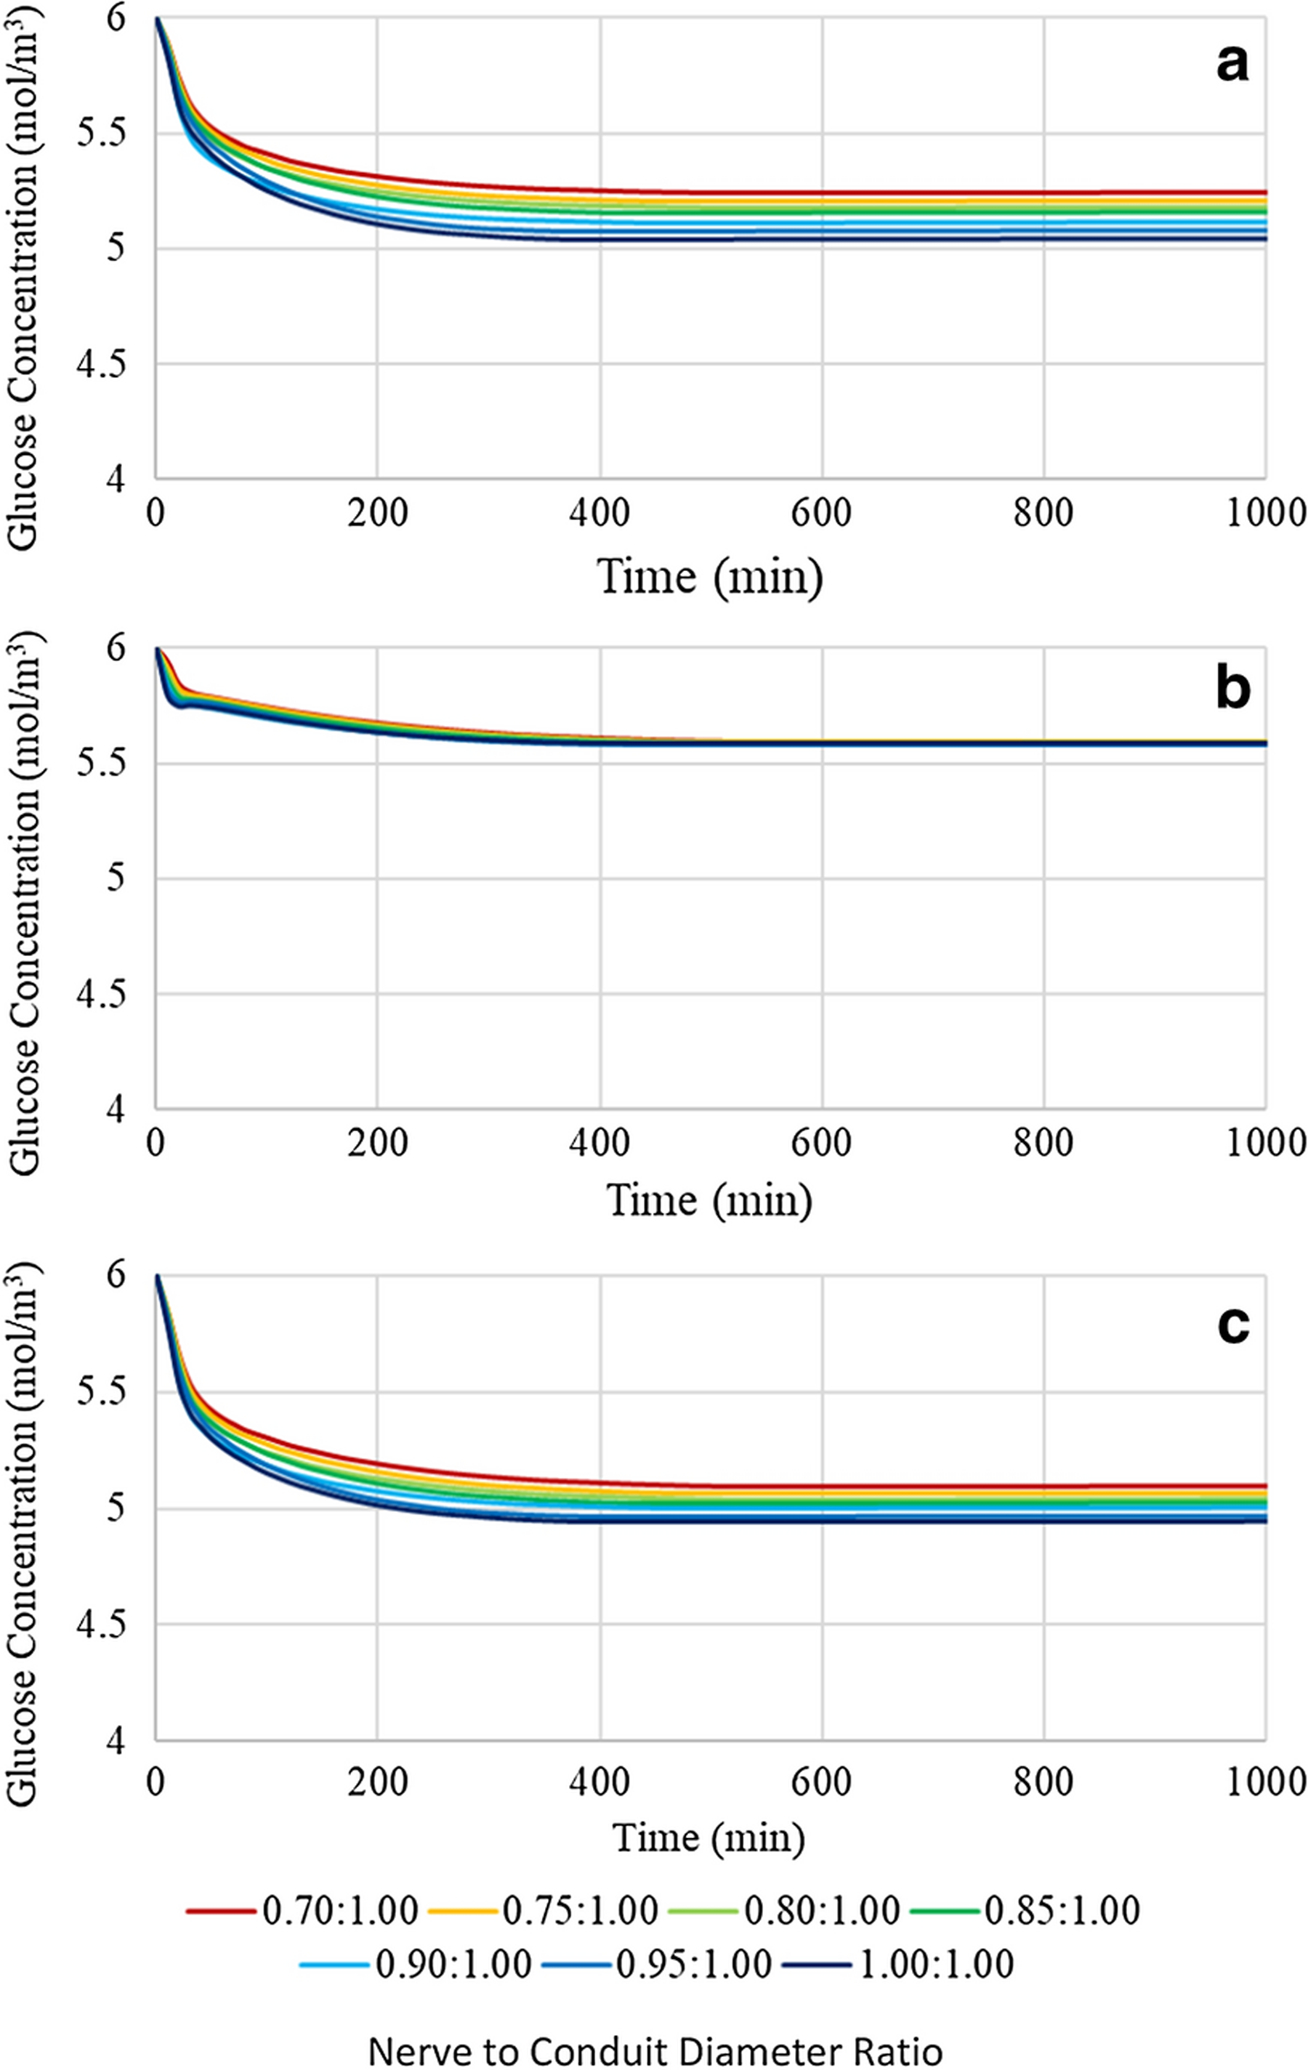
Glucose concentration profiles of a 16mm length conduit with variable nerve to conduit diameter ratio at (a) location 1, (b) location 2, and (c) location 3
To assess the impact of the potentially confounding effect of changing conduit length on the trends observed on glucose concentrations as a function of nerve to conduit diameter ratio, a similar analysis to that performed in Figure 4 on the longest (16mm) conduit was performed on the shortest (12mm) conduit, see Figure 5. It is evident from comparison of Figures 4 and 5 that the shorter conduit resulted in higher glucose concentrations at location 1, but invariant concentrations at locations 2 and 3. The findings suggest that axial diffusion is a significant contributor to the instantaneous glucose concentration at location 1. However, at locations 2 and 3 radial diffusion dominates over axial diffusion as evidenced by the negligible effect a significant reduction of the axial diffusion distance had on the instantaneous glucose concentrations.
Figure 5:
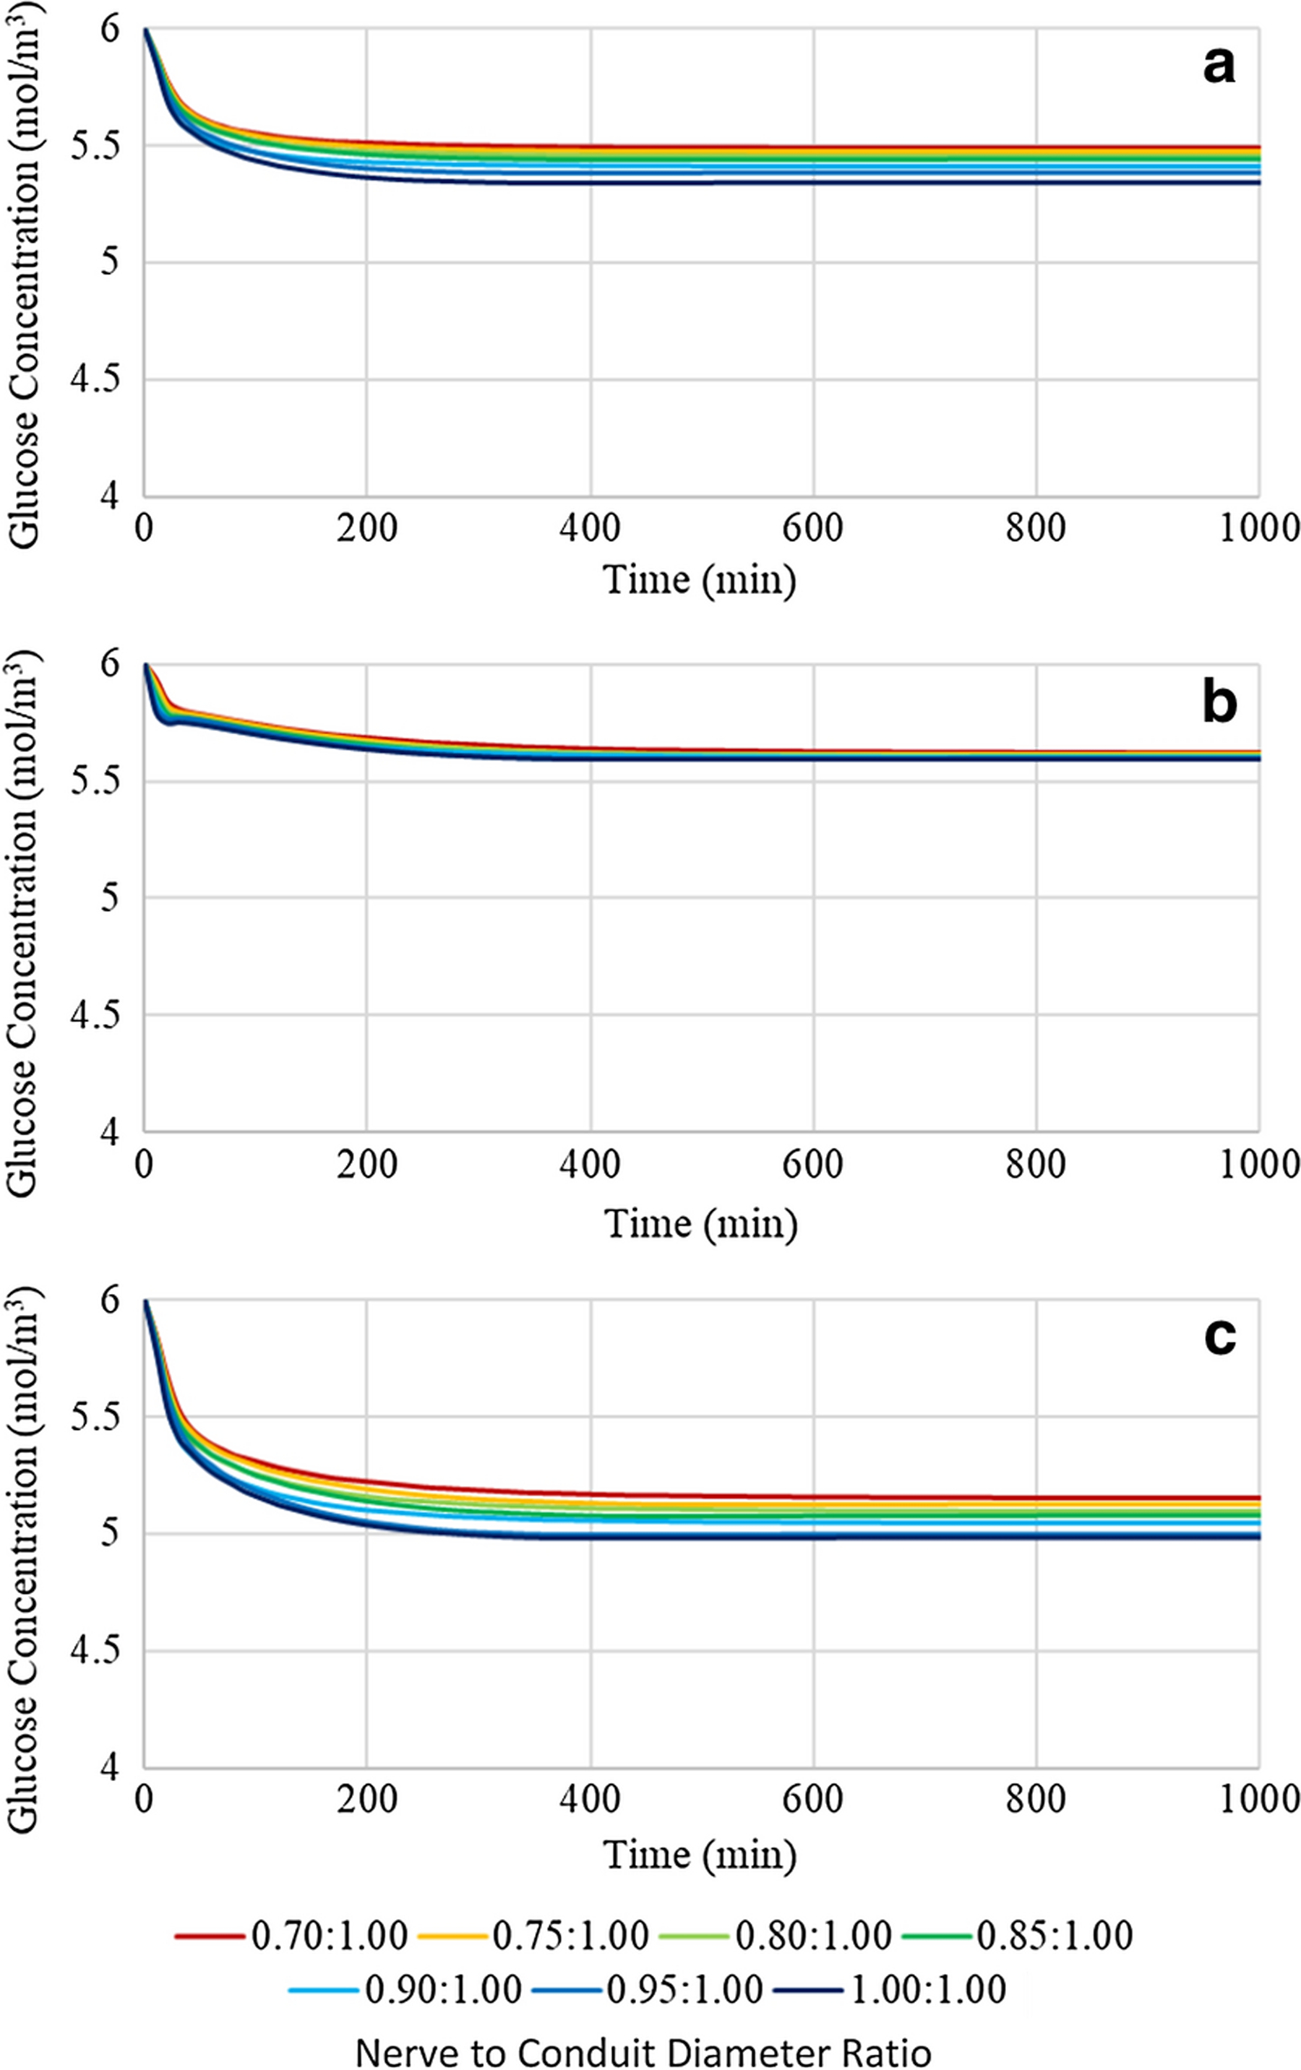
Glucose concentration profiles of a 12mm length conduit with variable nerve to conduit diameter ratio at (a) location 1, (b) location 2, and (c) location 3
A comprehensive analysis of the effect of conduit length on glucose concentration profiles and distributions was performed at a nerve to conduit diameter ratio of 0.70:1.00 over the full conduit length range of 12 to 16mm in 1mm increments, see Figure 6. Investigation of Figure 6 reveals that at all locations within the conduit the glucose concentration plateaus to a positive value, above 4 mol/m3, for all conduit lengths. It is noted that the plateau concentrations follow the same trend as observed in sensitivity to nerve to conduit diameter ratio as a result of axial diffusion path length, radial diffusion path length, and rate of glucose consumption, namely highest at location 2, intermediate at location 1 and lowest at location 3. Further, at each location the glucose concentration progressively decreases with incremental increases in conduit length, a fact attributed to the increasing axial diffusion path length for glucose to reach each of the three locations within the conduit.
Figure 6:
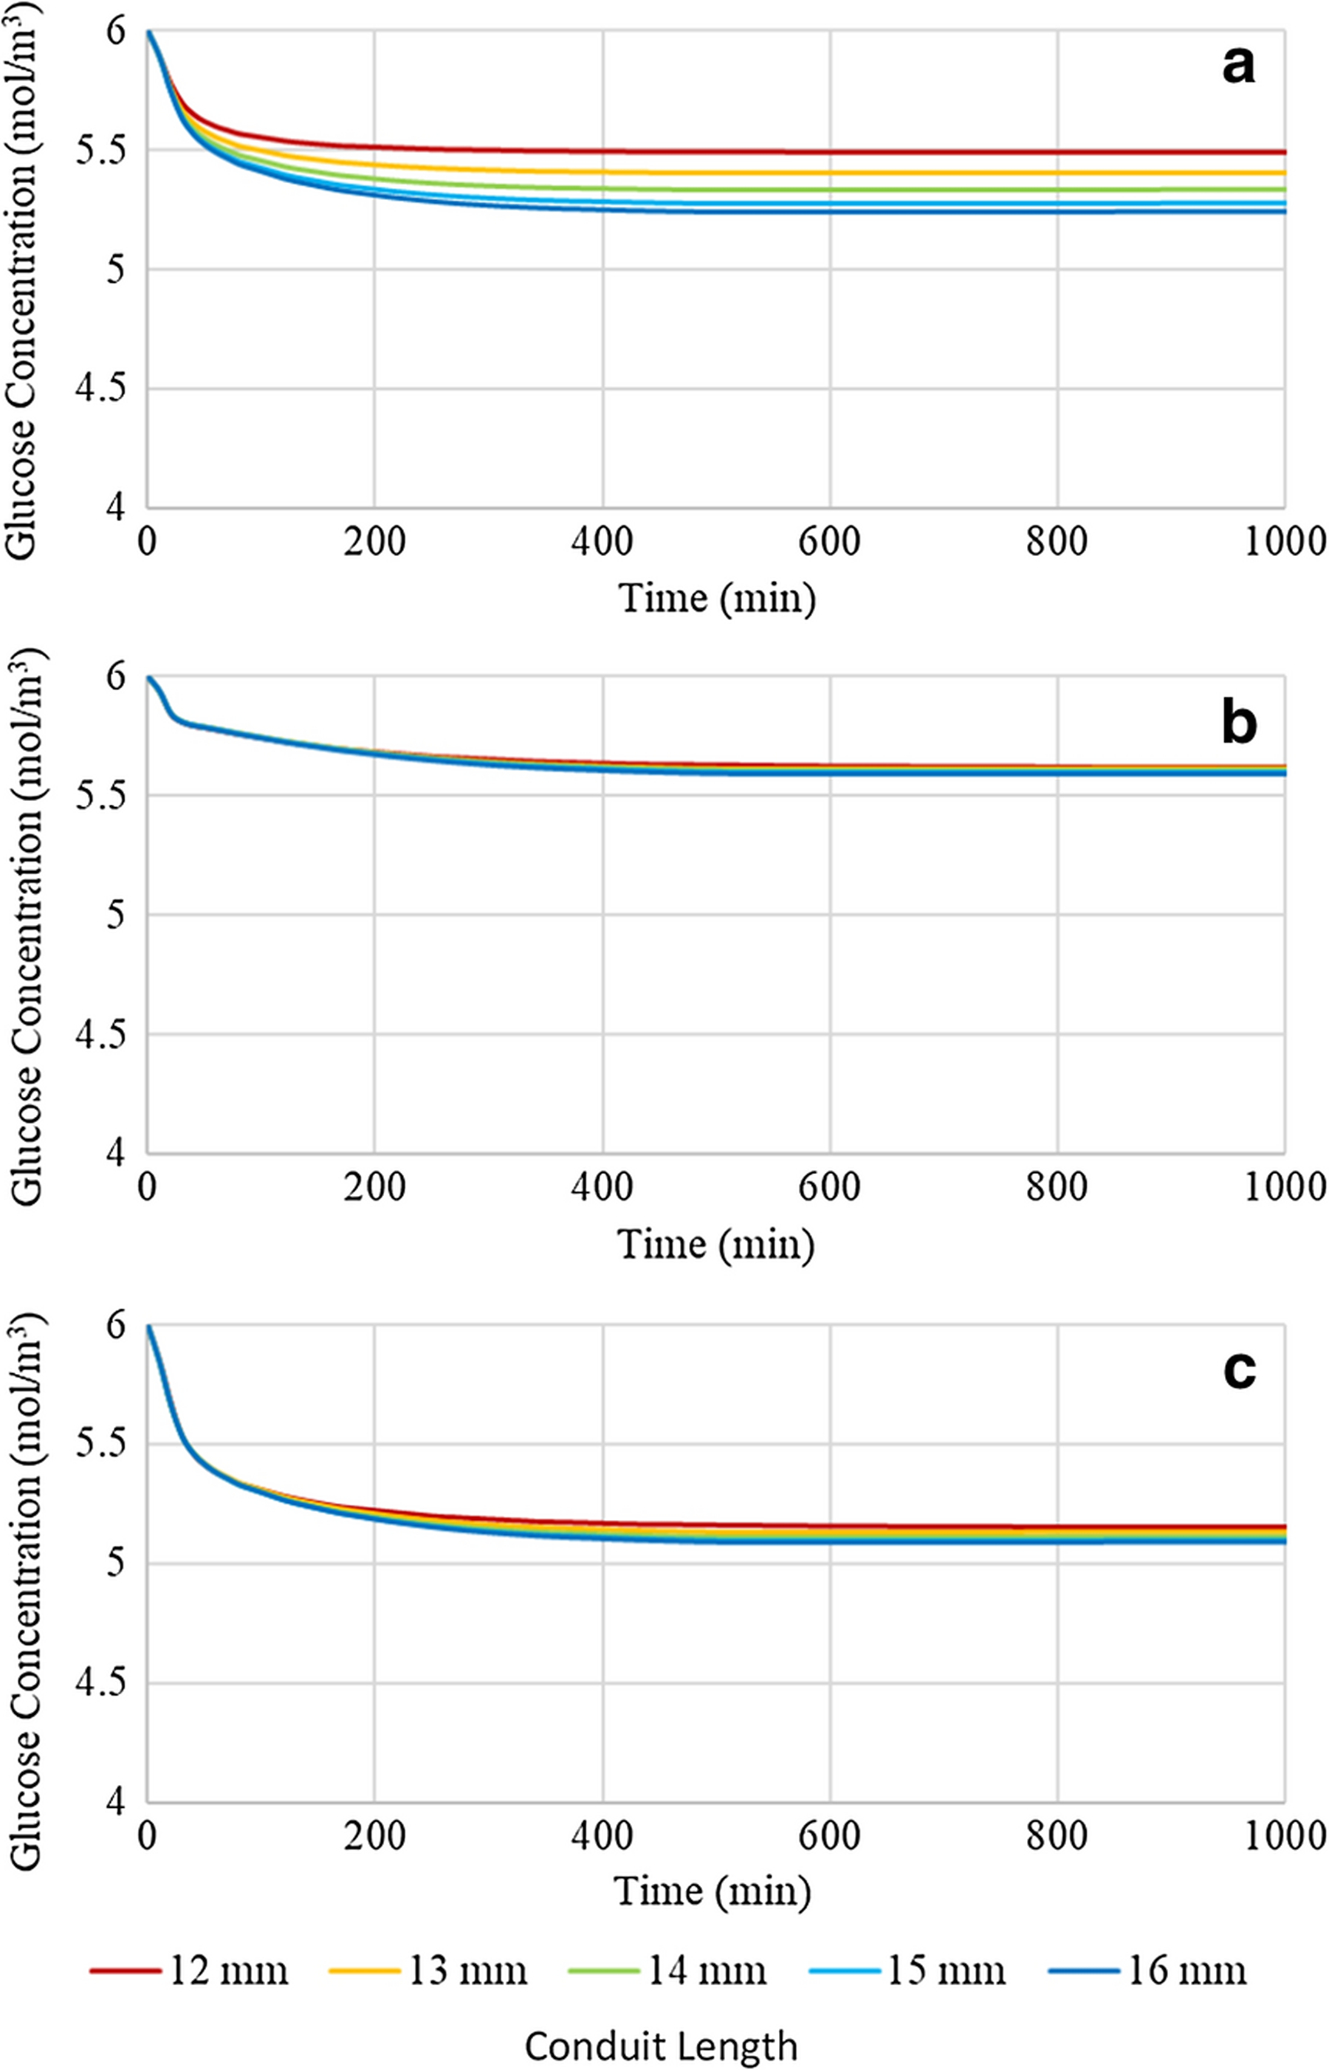
Glucose concentration profiles of a conduit with a 0.70:1.00 nerve to conduit diameter ratio and variable conduit length at (a) location 1, (b) location 2, and (c) location 3
In order to test the dependence of the glucose concentration profiles on conduit length when the luminal volume of interstitial fluid was minimized, simulations were run for conduit lengths varying from 12 to 16mm in 1mm increments at a nerve to conduit diameter ratio of 1.00:1.00, see Figure 7. Comparison of Figures 6 and 7 reveals that increasing the nerve to conduit diameter ratio from 0.70:1.00 to 1.00:1.00 decreases the glucose concentrations at all three locations and for all conduit lengths, although the decreases are comparatively minor, particularly at locations 2 and 3. The glucose concentration at Location 1 decreased by approximately 0.3 mol/m3 upon increasing the nerve to conduit diameter ratio. At locations 2 and 3 minor decreases in glucose concentrations were observed upon increasing the nerve to conduit diameter ratio, and the effect on glucose concentration of modification of the length of the conduit was suppressed. The observed differences revealed that the glucose concentration profiles at location 1 were most sensitive to changes in conduit length and diameter due to its comparatively short axial diffusion path and baseline consumption rate, however the sensitivities at locations 2 and 3 were far less pronounced, showing very minor, if any, shifts in concentration. These data demonstrate the importance of axial diffusion of glucose through the interstitial fluid resident in the gap between the nerve and the inner conduit wall, particularly at location 1. Specifically, if the gap and hence the interstitial fluid, are removed by employing a conduit with the same diameter as the nerve, glucose concentrations are decreased as the only modes of potentially active diffusion are axially through the nerve itself, and radially across the conduit wall. The findings suggest that the minor decreases in glucose concentrations seen by both increasing the length of the conduit and increasing the nerve to conduit diameter ratio are due to reduction of axial diffusion. It is noted that glucose concentrations remain well above hypoglycemic conditions with axial diffusion pathway reductions suggesting that diffusivity of glucose radially through the CNF conduit wall and/or axially along the neural tissue itself is sufficient for maintaining healthy glucose levels.
Figure 7:
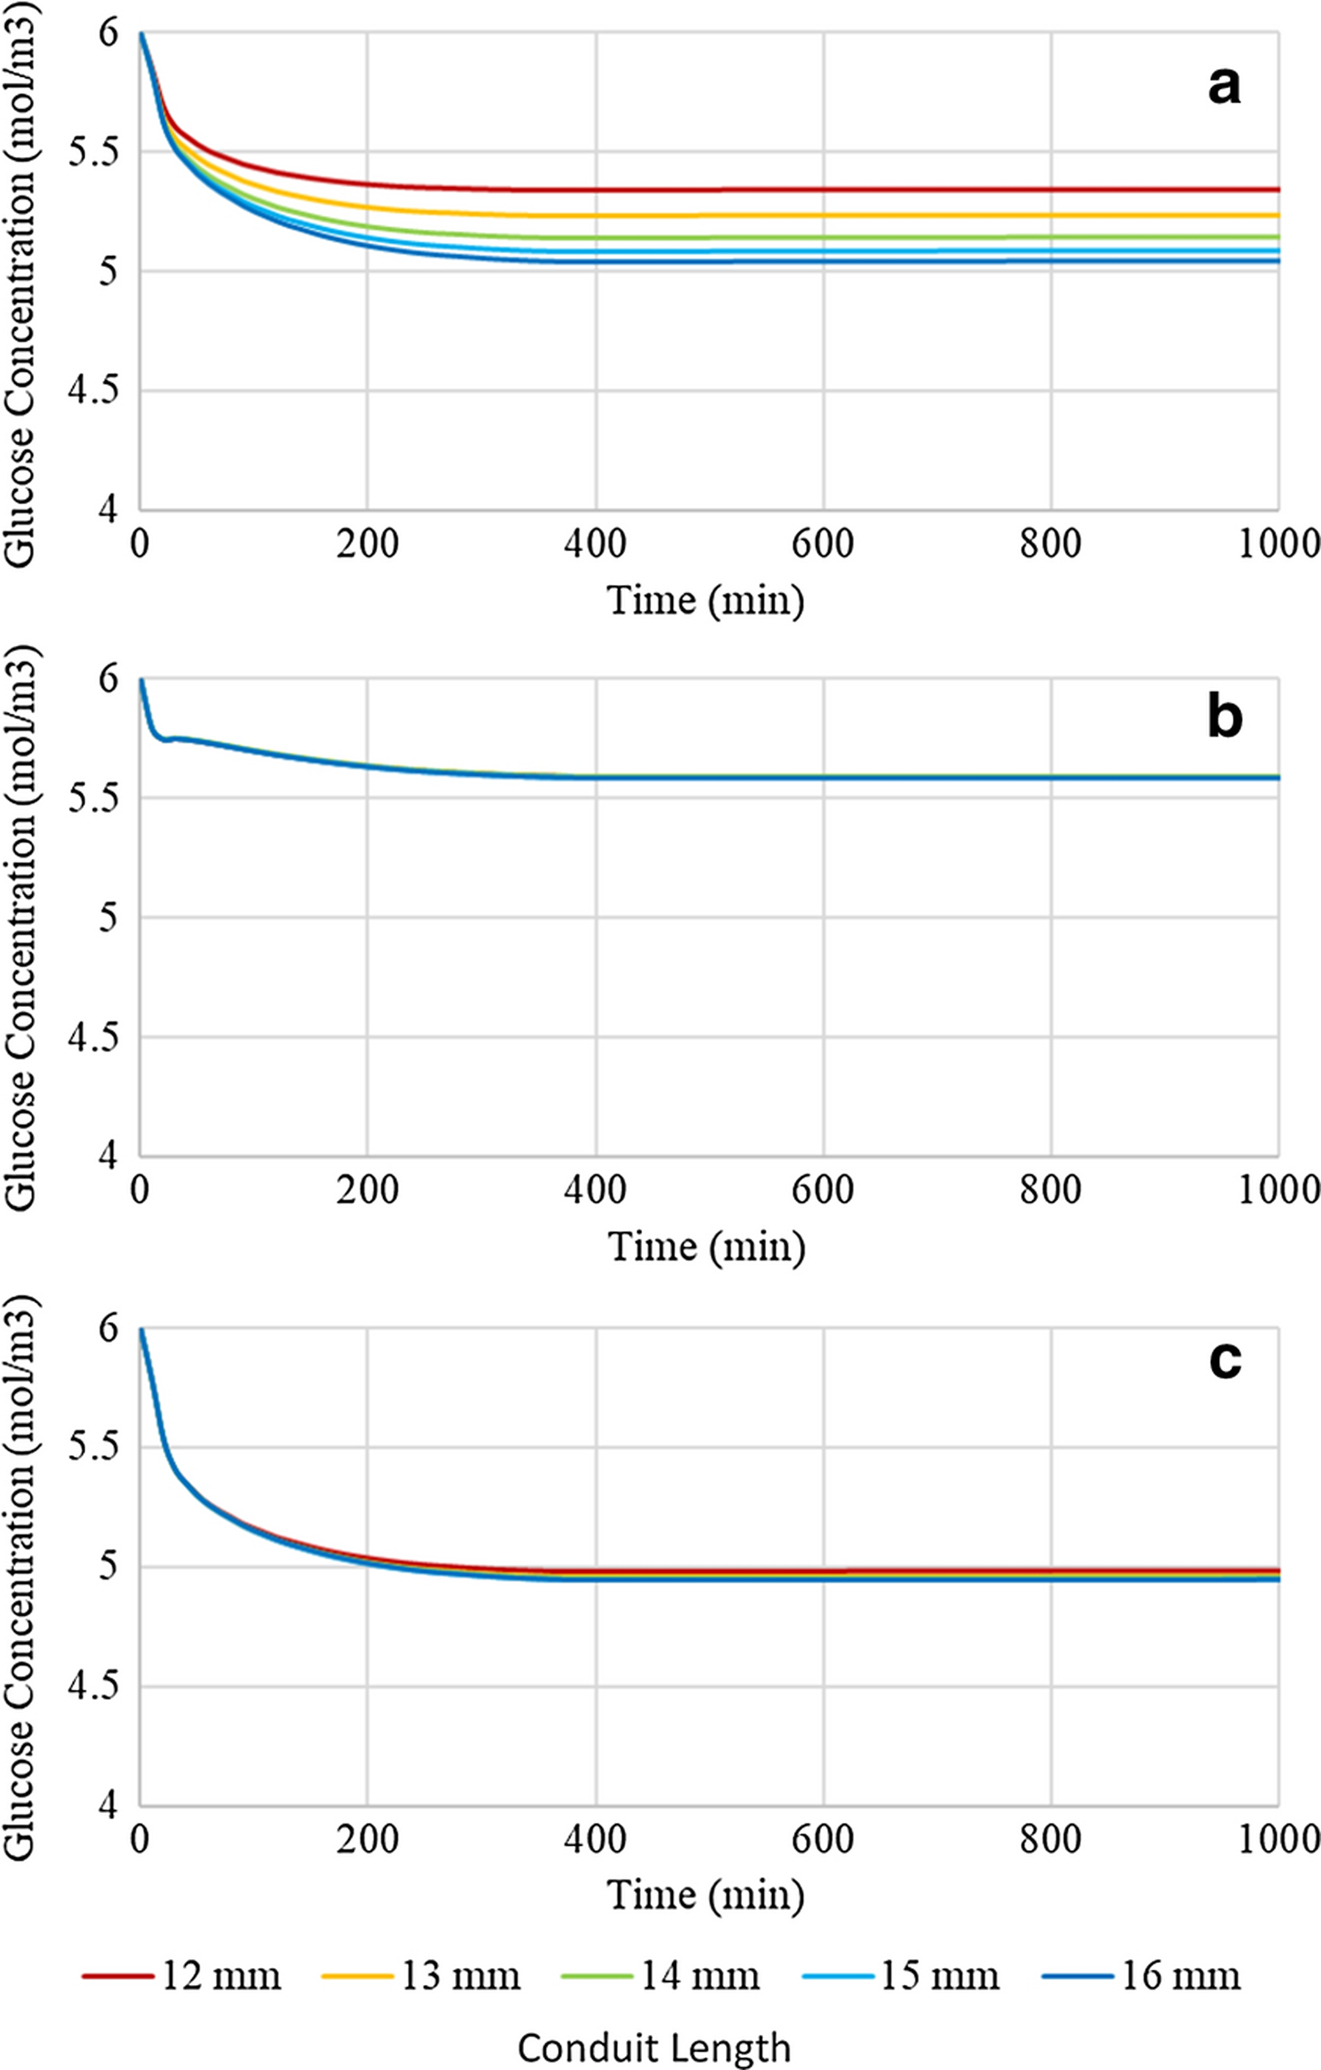
Glucose concentration profiles of a conduit with a 1.00:1.00 nerve to conduit diameter ratio and variable conduit length at (a) location 1, (b) location 2, and (c) location 3
Clearly, limiting the axial diffusion of glucose through the interstitial fluid resident in the luminal space between the nerve and the inner conduit wall via reduction of the conduit diameter has only a minor effect on the glucose concentration and distribution within the conduit. Radial diffusion across the CNF conduit wall, and/or axially through the neural tissue appear to be the dominant diffusion modalities. As such an investigation of the effect of varying the permeability of the conduit wall to glucose was performed to determine if a reduction in radial diffusion into the luminal space may lead to hypoglycemic levels. Conduit parameters for the investigation were set at a nerve to conduit diameter ratio of 0.70:1.00 and a conduit length of 16mm. The baseline conduit diffusion coefficient employed in the work to date has been 1.7 × 10⁻¹¹ m2/s, a value based on the experimental measurement of glucose diffusion through a cellulose nanofiber film. It is of interest to explore the effect of varying the conduit wall permeability over a practical range. The highest obtainable conduit wall permeability would arise from a wall material with a glucose diffusion coefficient equivalent to that of interstitial fluid, i.e. 5.7 ×10⁻¹⁰ m2/s, this value was therefore selected as the upper boundary of the glucose diffusion coefficient. Two additional diffusion coefficient values were selected based on the application of one standard deviation above and below the measured experimental value yielding values of 2.6 × 10⁻¹¹ and 8.0 × 10⁻¹² m2/s, respectively. Finally, a lower boundary value of 1 × 10⁻¹² m2/s was selected given that it represents the lowest value in the order of magnitude in which the experimental value minus one standard deviation fell. Figure 8 presents the instantaneous glucose concentrations plotted as a function of time at the three locations within the conduit employing the five selected conduit wall diffusion coefficients. It may be seen from investigation of Figure 8 that employing a conduit wall diffusion coefficient equivalent to that of interstitial fluid (5.7 ×10⁻¹⁰ m2/s) results in glucose concentrations at all locations that are only slightly lower than the baseline interstitial fluid concentration, a fact arising from the absence of a barrier for radial diffusion across the conduit wall and therefore dominance of the radial diffusion mode over the axial diffusion mode. It is noted however that at the locations where glucose consumption occurs (1 and 3), the plateau concentrations are lower than at location 2. Decreasing the diffusion coefficient of the conduit wall progressively to the experimental value plus one standard deviation, the experimental value, and the experimental value minus one standard deviation is observed to result in monotonic reductions in the plateau values of the glucose concentrations at all three locations within the conduit, with the relative concentrations following the previously observed trend of highest at location 2, intermediate at location 1, and lowest at location 3. Reducing the diffusion coefficient to the lower boundary value of 1 × 10⁻¹² m2/s resulted in a dramatic decrease in the instantaneous glucose concentrations and the lack of attainment of a plateau concentration in the timescale investigated at all 3 locations. Running the simulation for a longer period of time indicated that at location 1, a plateau value of 3.8 mol/m3 was eventually reached (at ~ 3000 minutes). It is noted that a concentration of 3.8 mol/m3 is below the threshold of hypoglycemia. At locations 2 and 3, the application of the lower boundary value of the diffusion coefficient resulted in a glucose concentration profile that entered the hypoglycemic regime in 800 and 700 minutes, respectively. The data of Figure 8, coupled with the experimentally measured glucose diffusion coefficient for cellulose nanofiber films, implies that under the conditions of the present study radial diffusion through the conduit wall is the dominant pathway for glucose to enter the luminal space, and that axial diffusion, while present, appears to have only marginal significance, primarily at location 1.
Figure 8:
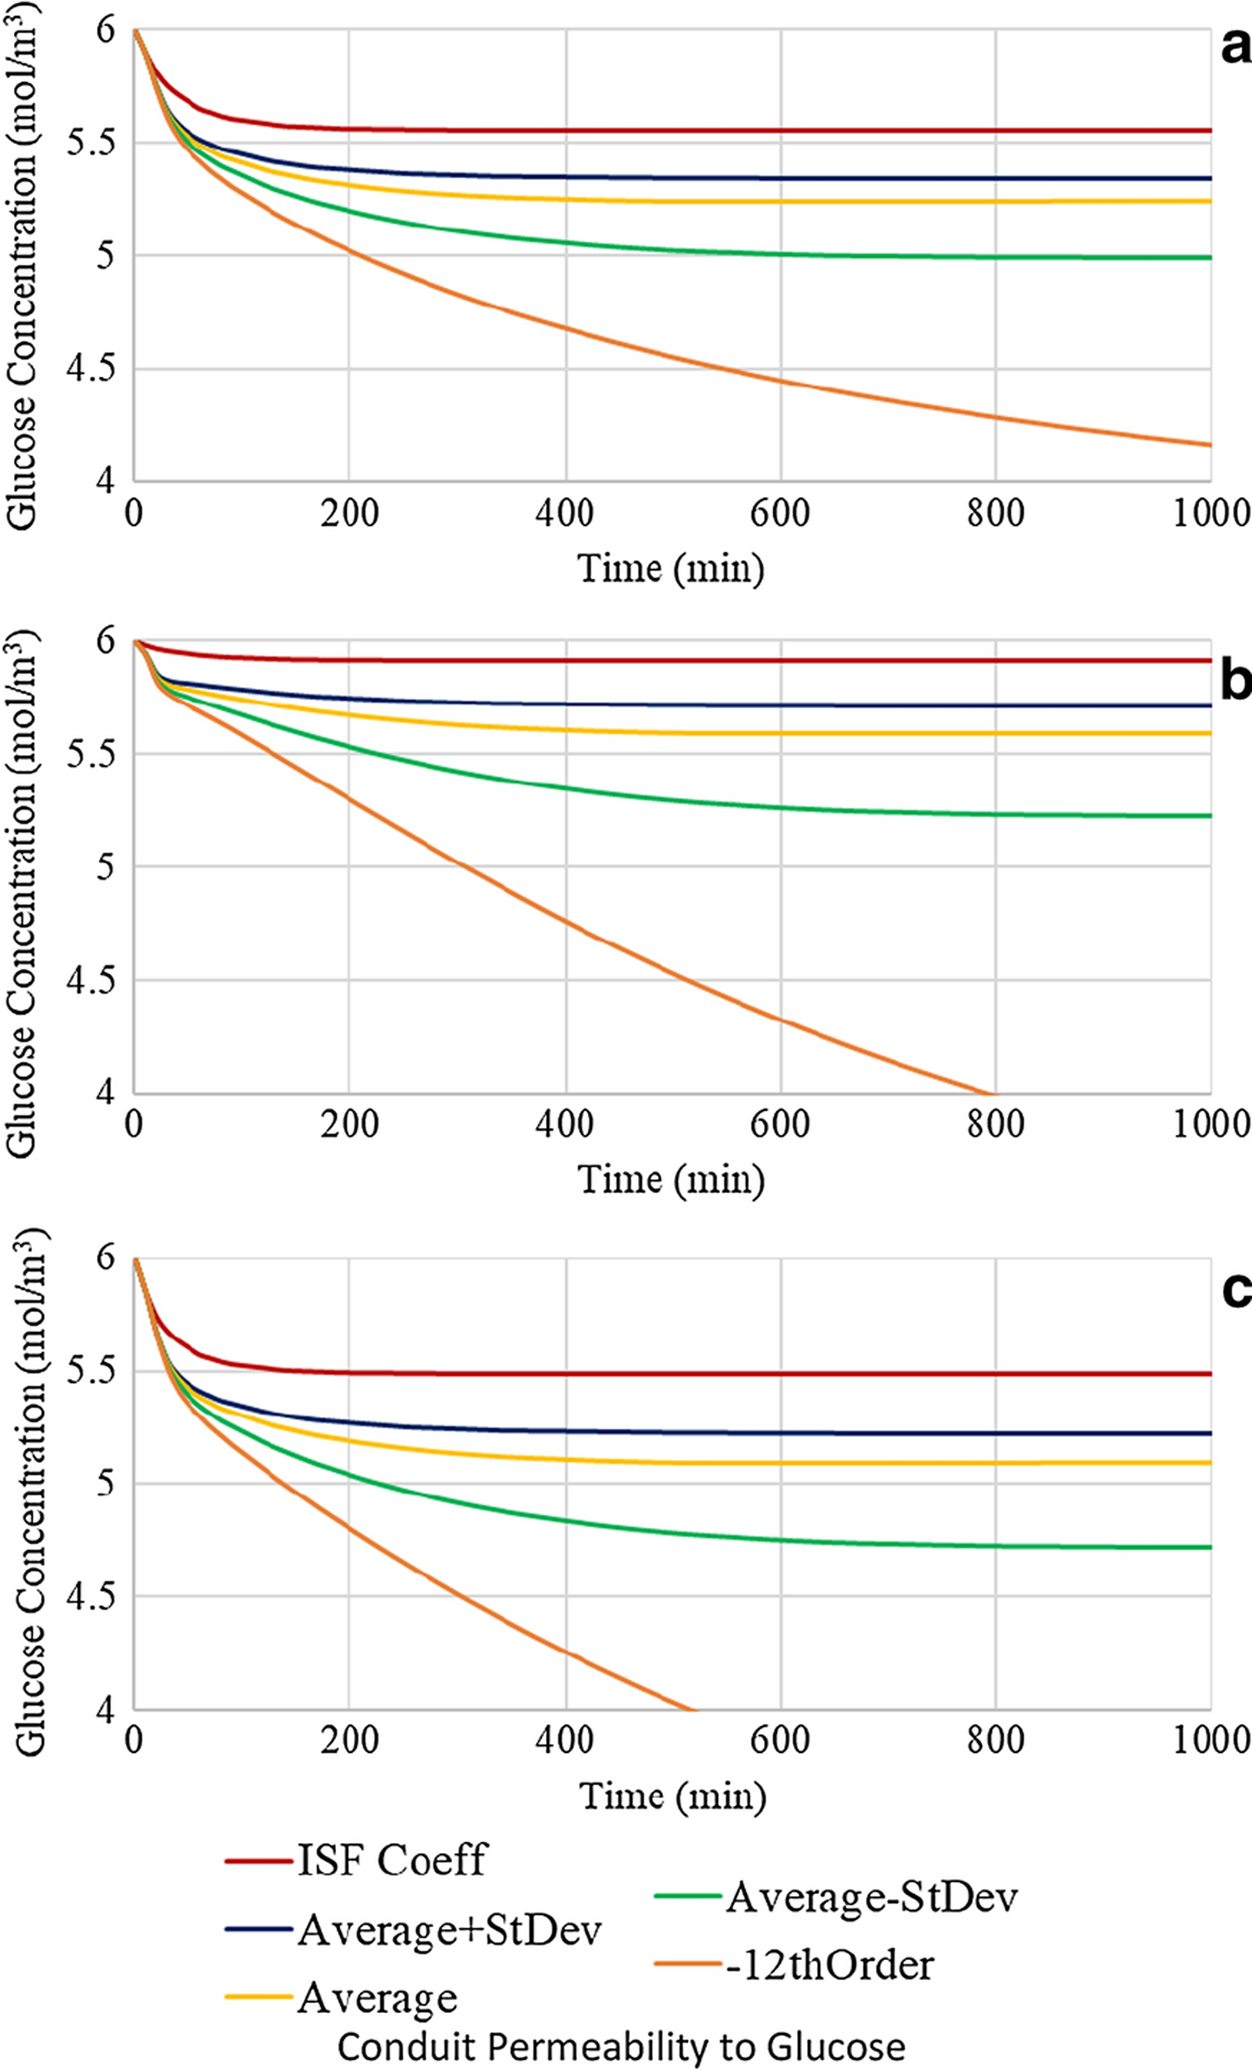
Glucose concentration profiles of a conduit with a 0.70:1.00 nerve to conduit diameter ratio and conduit length of 16 mm with variable conduit permeability at (a) location 1, (b) location 2, and (c) location 3
Conclusion
Peripheral nerves have an innate capacity to self-repair, although the efficacy decreases with increasing loss of neural tissue. Implantation of a neural conduit over the nerve stumps is a common means of promoting peripheral nerve repair. The conduit is intended to provide a mechanical means of stabilizing and protecting the regenerating nerve, while creating a microenvironment conducive to repair via localization of growth factors and molecules critical for homeostasis including oxygen and glucose. Despite the widespread use of peripheral nerve conduits, comparatively little is known regarding how their physical properties such as length relative to the neural gap, diameter relative to the nerve, and permeability of the conduit wall to the species of interest, affect neural regeneration.
The current work employed COMSOL Multiphysics® to perform finite element analysis of the distribution and concentration profiles of glucose, the primary energy source for neural activity, within a cellulose nanofiber neural conduit. Parameters investigated included the nerve to conduit diameter ratio, the length of the conduit relative to the nerve gap, and the permeability of the conduit wall to glucose. Analysis was performed at three specific locations within the conduit: in the center of the distal nerve, in the middle of the nerve gap, and at the interface of the regenerating neural tissue and the baseline tissue of the proximal peripheral nerve. It was found that as the nerve to conduit diameter ratio increased, the glucose concentration at all locations decreased, a finding consistent with decreased axial diffusion. It was noted however that the small changes in glucose concentration suggest that axial diffusion was not the dominant diffusion mode. Investigation of the effect of variation in conduit length revealed similar trends. As conduit length increased, glucose concentrations progressively decreased, although again the effects were comparatively minor in the nerve gap and proximal nerve, suggesting that radial diffusion is the dominant regime at these locations. Lastly, the effect of variation of the glucose diffusion coefficient of the cellulose nanofiber conduit wall was investigated. Progressively decreasing the glucose diffusion coefficient of the CNF conduit wall consistently reduced the instantaneous glucose concentrations at all locations. At a diffusion coefficient of 1 × 10⁻¹² m2/s, more than an order of magnitude below the experimentally determined value, the glucose concentrations at all locations were reduced below the hypoglycemic threshold of 4 mol/m3, a finding attributed to inhibited radial diffusion of glucose. It is concluded therefore, that under the experimental conditions employed, radial diffusion of glucose into the luminal space of the conduit is the dominant diffusion modality at all locations, with axial diffusion only contributing to a minor extent in the distal nerve stump due to the shorter axial distance from the end of the conduit to the monitoring location.
Funding:
This research was funded by a National Science Foundation award “Explore It! Building the Next Generation of Sustainable Forest Bioproduct Researchers”, NSF REU Award 1757529 in conjunction with the University of Maine Graduate School of Biomedical Science and Engineering, National Institute of Health T32 award “Transdisciplinary predoctoral training in biomedical science and engineering” Award #5T32GM132006-02
Footnotes
Conflicts of interest/Competing interests
Not Applicable
References
- Allen JS, Damasio H, Grabowski TJ. 2002. “Normal Neuroanatomical Variation in the Human Brain : An MRI-Volumetric Study” 358 (June 2001): 341–58. 10.1002/ajpa.10092. [DOI] [PubMed] [Google Scholar]
- Barton MJ, Morley JW, Stoodley MA, Lauto A, Mahns DA. 2014. “Nerve Repair: Toward a Sutureless Approach.” Neurosurgical Review 37 (4): 585–95. 10.1007/s10143-014-0559-1. [DOI] [PubMed] [Google Scholar]
- Berg JM, Tymoczko JL, and Stryer L. 2002. “Biochemistry.” In , 5th ed. New York: W H Freeman. [Google Scholar]
- Dahlin LB, Wiberg M. 2017. “Nerve Injuries of the Upper Extremity and Hand.” EFORT Open Reviews 2 (5): 158–70. 10.1302/2058-5241.2.160071. [DOI] [PMC free article] [PubMed] [Google Scholar]
- Gaudet AD, Popovich PG, Ramer MS. 2011. “Wallerian Degeneration: Gaining Perspective on Inflammatory Events after Peripheral Nerve Injury.” Journal of Neuroinflammation 8 (1): 110. 10.1186/1742-2094-8-110. [DOI] [PMC free article] [PubMed] [Google Scholar]
- Gaudin R, Knipfer C, Henningsen A, Smeets R, Heiland M, Hadlock T. 2016. “Approaches to Peripheral Nerve Repair: Generations of Biomaterial Conduits Yielding to Replacing Autologous Nerve Grafts in Craniomaxillofacial Surgery.” BioMed Research International 2016. 10.1155/2016/3856262. [DOI] [PMC free article] [PubMed] [Google Scholar]
- Grinsell D, Keating CP. 2014. “Peripheral Nerve Reconstruction after Injury: A Review of Clinical and Experimental Therapies.” BioMed Research International 2014. 10.1155/2014/698256. [DOI] [PMC free article] [PubMed] [Google Scholar]
- Han P, Bartels DM. 1996. “Temperature Dependence of Oxygen Diffusion in H2O and D2O.” Journal of Physical Chemistry 100: 5597–5602. 10.1021/jp952903y. [DOI] [Google Scholar]
- Harrison PJ, Freemantle N, Geddes JR. 2003. “Meta-Analysis of Brain Weight in Schizophrenia” 64: 25–34. 10.1016/S0920-9964(02)00502-9. [DOI] [PubMed] [Google Scholar]
- Haug A. 2009. “US Food and Drug Administration/Conformit Europe-Approved Absorbable Nerve Conduits for Clinical Repair of Peripheral and Cranial Nerves.” Annals of Plastic Surgery 62 (6): 710. https://journals.lww.com/annalsplasticsurgery/Citation/2009/06000/US_Food_and_Drug_Administration_Conformit.32.aspx. [DOI] [PubMed] [Google Scholar]
- Jensen VFH, Mølck AM, Bøgh IB, Lykkesfeldt J. 2014. “Effect of Insulin-Induced Hypoglycaemia on the Peripheral Nervous System: Focus on Adaptive Mechanisms, Pathogenesis and Histopathological Changes.” Journal of Neuroendocrinology 26 (8): 482–96. 10.1111/jne.12170. [DOI] [PubMed] [Google Scholar]
- Kehoe S, Zhang XF, Boyd D. 2012. “FDA Approved Guidance Conduits and Wraps for Peripheral Nerve Injury: A Review of Materials and Efficacy.” Injury 43 (5): 553–72. 10.1016/j.injury.2010.12.030. [DOI] [PubMed] [Google Scholar]
- Khalil E, Kretsos K, Kasting GB. 2006. “Glucose Partition Coefficient and Diffusivity in the Lower Skin Layers.” Pharmaceutical Research 23 (6): 1227–34. 10.1007/s11095-006-0141-9. [DOI] [PubMed] [Google Scholar]
- Kokai LE, Lin YC, Oyster NM, Marra KG. 2009. “Diffusion of Soluble Factors through Degradable Polymer Nerve Guides: Controlling Manufacturing Parameters.” Acta Biomaterialia 5 (7): 2540–50. 10.1016/j.actbio.2009.03.009. [DOI] [PubMed] [Google Scholar]
- Lim TKY, Rone MB, Lee S, Antel JP, Zhang J. 2015. “Mitochondrial and Bioenergetic Dysfunction in Trauma-Induced Painful Peripheral Neuropathy.” Molecular Pain 11 (58). 10.1186/s12990-015-0057-7. [DOI] [PMC free article] [PubMed] [Google Scholar]
- Lim TKY, Shi XQ, Johnson JM, Rone MB, Antel JP, David S, Zhang J. 2015. “Peripheral Nerve Injury Induces Persistent Vascular Dysfunction and Endoneurial Hypoxia, Contributing to the Genesis of Neuropathic Pain.” Journal of Neuroscience 35 (8): 3346–59. 10.1523/JNEUROSCI.4040-14.2015. [DOI] [PMC free article] [PubMed] [Google Scholar]
- Lohrasbi S, Mirzaei E, Karimizade A, Takallu S, Rezaei A. 2020. “Collagen/Cellulose Nanofiber Hydrogel Scaffold: Physical, Mechanical and Cell Biocompatibility Properties.” Cellulose 27 (2): 927–40. 10.1007/s10570-019-02841-y. [DOI] [Google Scholar]
- Meek MF, Jansen K. 2009. “Two Years after in Vivo Implantation of Poly(DL-Lactide-ε-Caprolactone) Nerve Guides: Has the Material Finally Resorbed?” Journal of Biomedical Materials Research - Part A 89 (3): 734–38. 10.1002/jbm.a.32024. [DOI] [PubMed] [Google Scholar]
- Mergenthaler P. 2014. “Sugar for the Brain: The Role of Glucose in Physiological and Pathological Brain Function.” Trends Neurosci 36 (10): 587–97. 10.1016/j.tins.2013.07.001.Sugar. [DOI] [PMC free article] [PubMed] [Google Scholar]
- Moor BK, Haefeli M, Bouaicha S, Nagy L. 2010. “Results after Delayed Axillary Nerve Reconstruction with Interposition of Sural Nerve Grafts.” Journal of Shoulder and Elbow Surgery 19 (3): 461–66. 10.1016/j.jse.2009.07.011. [DOI] [PubMed] [Google Scholar]
- Niu X, Liu Y, Fang G, Huang C, Rojas OJ, Pan H. 2018. “Highly Transparent, Strong, and Flexible Films with Modified Cellulose Nanofiber Bearing UV Shielding Property.” Biomacromolecules 19 (12): 4565–75. 10.1021/acs.biomac.8b01252. [DOI] [PubMed] [Google Scholar]
- Sibson NR, Mason GF, Behar KL, Rothman DL, Shulman RG. 1998. “Mapping Glutamatergic Activity: Stoichiometric Coupling of Brain Glucose Metabolism and Neurotransmitter Glutamate Cycling.” NeuroImage 7 (4 PART II): 316–21. 10.1016/s1053-8119(18)31120-0. [DOI] [PMC free article] [PubMed] [Google Scholar]
- Stecker MM, Stevenson M. 2014. “Effect of Glucose Concentration on Peripheral Nerve and Its Response to Anoxia.” Muscle and Nerve 49 (3): 370–77. 10.1002/mus.23917. [DOI] [PubMed] [Google Scholar]
- Suhaimi H, Wang S, Das DB. 2015. “Glucose Diffusivity in Cell Culture Medium.” Chemical Engineering Journal 269: 323–27. 10.1016/j.cej.2015.01.130. [DOI] [Google Scholar]
- Suhaimi H, Wang S, Thornton T, Das DB. 2015. “On Glucose Diffusivity of Tissue Engineering Membranes and Scaffolds.” Chemical Engineering Science 126: 244–56. 10.1016/j.ces.2014.12.029. [DOI] [Google Scholar]
- Takagi H, Asano A. 2008. “Effects of Processing Conditions on Flexural Properties of Cellulose Nanofiber Reinforced ‘Green’ Composites.” Composites Part A: Applied Science and Manufacturing 39 (4): 685–89. 10.1016/j.compositesa.2007.08.019. [DOI] [Google Scholar]
- Taras JS, Nanavati V, Steelman P. 2005. “Nerve Conduits.” Journal of Hand Therapy 18 (2): 191–97. 10.1197/j.jht.2005.02.012. [DOI] [PubMed] [Google Scholar]
- Thennadil SN, Rennert JL, Wenzel BJ, Hazen KH, Ruchti TL, Block MB. 2001. “Comparison of Glucose Concentration in Interstitial Fluid, and Capillary and Venous Blood during Rapid Changes in Blood Glucose Levels.” Diabetes Technology and Therapeutics 3 (3): 357–65. 10.1089/15209150152607132. [DOI] [PubMed] [Google Scholar]
- Tirosh A, Shai I, Rudich A. 2006. “Normal Fasting Plasma Glucose Levels and Type 2 Diabetes in Young Men.” New England Journal of Medicine 354 (1): 87–88. 10.1056/NEJMc052984. [DOI] [PubMed] [Google Scholar]
- Xue Y, Mou Z, Xiao H. 2017. “Nanocellulose as a Sustainable Biomass Material: Structure, Properties, Present Status and Future Prospects in Biomedical Applications.” Nanoscale 9 (39): 14758–81. 10.1039/c7nr04994c. [DOI] [PubMed] [Google Scholar]


