Abstract
Removing organic contaminants such as dyes from water is essential to purify wastewater. Herein, zeolitic imidazolate framework-8 (ZIF-8) and ZnO@N-doped C are reported as effective adsorbents and photocatalysts for the adsorption and degradation of organic dyes. The materials showed effective and selective adsorption toward anionic dyes such as methyl blue (MeB) dye in the presence of fluorescein (FLU) dye. The adsorption capacities of ZnO@N-doped C for MeB and FLU dyes are 900 mg g−1 and 100 mg g−1, respectively. According to UV-Vis diffuse reflectance spectroscopy (DRS) data, ZnO@N-doped C has a lower bandgap (2.07 eV) than ZIF-8 (4.34 eV) and ZnO (3.12 eV). Thus, ZnO@N-doped C serves as an effective photocatalyst for the degradation of both dyes under UV exposure. The degradation efficiency capacity of the dye (50 mg L−1) is >90% using 200 mg L−1 of the photocatalyst. The mechanism of adsorption and photocatalysis is investigated. The photodegradation pathway of the dye involved the generation of oxidative hydroxy radicals (OH˙), which can degrade the dyes. The degradation products of FLU were recorded using mass spectrometry.
Removing organic contaminants such as dyes from water is essential to purify wastewater.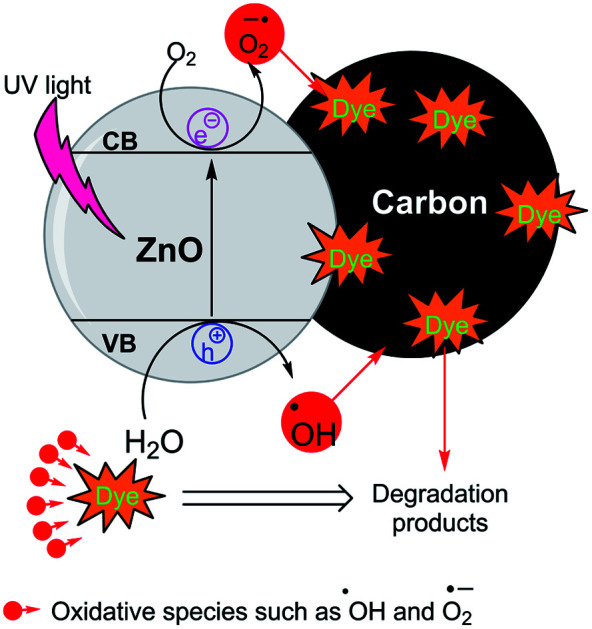
1. Introduction
Organic dyes are widely used in several industrial and biomedical applications, including paper, leather, and textiles.1,2 The dying process releases around 20% of the used dyes into wastewater. Such released dyes are hazardous materials to the environment; they damage ecosystems, decrease soil productivity and harm living creatures.3,4 Therefore, the removal of dyes from wastewater has received great interest. Several methods such as adsorption and degradation (via catalysis, photocatalysis, chemical degradation, microbes and enzymes) and encapsulation can remove the dye from the wastewater.1–3,5–7 Among these methods, adsorption and photocatalytic degradation are intensively used, as these methods are considered facile and efficient towards a broad spectrum of contaminants, and due to the availability of several materials that can be utilized as adsorbents and photocatalysts.8–15 However, it is hard to find effective materials that can be used as adsorbents and photocatalysts simultaneously.
Metal–organic frameworks (MOFs) such as zeolitic imidazolate frameworks (ZIFs) are porous materials with the potential for various applications, including energy production and drug delivery.10,16–29 ZIFs-based materials such as ZIF-8 (zinc-based ZIFs) were reported as an effective adsorbent for organic dyes and carbon dioxide (CO2).22,30,31 They can be classified to (1) pure ZIF-8; (2) nanoparticles modified ZIF-8 such as ZnO@ZIF-8;32,33 and (3) ZIF8-derived ZnO loaded carbon (ZnO@N-doped C).34 Despite ZIF-8 exhibiting high performance as an adsorbent, it shows low photocatalytic performance due to its large bandgap (∼5.0 eV).35 ZnO exhibited high photocatalysis compared to ZIF-8.36–38 Also, MOF-derived ZnO-doped C exhibited high adsorption and photocatalytic performance on methylene blue (MB) degradation under sunlight irradiation, as the presence of carbon would enhance the light absorption, reduce the recombination of photo-generated electron–hole, and increase the MB around the photocatalytic active sites in ZnO.39,40 Doping of ZnO with nitrogen could enhance its catalytic activity by lowering the recombination rate of electron–hole pairs and enhancing the absorption of visible light.41–43 Hence, the ZnO@N-doped C might show good catalytic activities. Hence, the combination of N-doped C and ZnO would enhance the catalytic activity towards water contaminants.40,44 So, the synthesis of the hierarchical porous structure of ZnO@N-doped C may enhance the adsorption and photocatalytic degradation of organic dyes.
In this report, hierarchical porous ZIF-8 and ZIF8-derived ZnO@N-doped C were synthesized and characterized using X-ray diffraction (XRD), X-ray photoelectron spectroscopy (XPS), transmission electron microscopy (TEM), high-resolution TEM (HR-TEM), nitrogen adsorption–desorption isotherms, and thermal analysis (thermogravimetric analysis (TGA)). They were applied to remove organic dyes from the water via adsorption and photodegradation under ultraviolet (UV) light. The adsorption and photocatalytic degradation of methyl blue (MeB) and fluorescein (FLU) dye were investigated for both processes using ZIF-8 and ZnO@N-doped C. The mechanisms for adsorption and degradation are proposed and supported via experimental data of XPS, UV-Vis diffuse reflectance spectroscopy (DRS), gas chromatography-mass spectrometry (GC-MS), and fluorescence spectroscopy.
2. Experimental
2.1. Materials
Zinc nitrate hexahydrate, 2-methylimidazole (Hmim), triethylamine (TEA), MeB, FLU, and NaOH were purchased from Sigma Aldrich (Germany) with high purity.
2.2. Synthesis of ZIF-8 and ZIF-8 derived ZnO@N-doped C
ZIF-8 was synthesized via TEA-assisted procedure.45 Typically, TEA (14 mmol) was added to a zinc nitrate solution (0.8 mL, 0.67 mmol), followed by the addition of 2.3 mL of Hmim solution (6.9 mmol). The product was separated via centrifugation, washed with water (2 × 20 mL) and ethanol (2 × 20 mL), and dried overnight at 85 °C.
ZnO@N-doped C was synthesized via the carbonization of ZIF-8 at 600 °C for three h with a heating rate of 10 °C min−1. The carbonized material was washed with water and ethanol. It was dried overnight at 85 °C.
2.3. Instrumentations
X-ray diffraction (XRD) patterns for ZIF-8 and ZnO@N-doped C were recorded using Phillips 1700 X'Pert (Cu Kα radiation). The transmission electron microscopy (TEM) and high-resolution TEM (HR-TEM) images for ZnO@N-doped C were obtained using TEM-2100 (JEOL, Japan, operated at accelerating voltage 200 kV). X-ray photoelectron spectroscopy (XPS) was used to investigate the samples' components and monitor the changes in these components. These XPS spectra were collected using a K-alpha instrument (Thermo Fischer, Al Kα radiation), and the peaks were referenced to Zn 2p at 1021.7 eV. The UV-Vis absorbance spectra for liquid samples were collected using a Thermo Scientific spectrophotometer (Evolution 300). The UV-Vis diffuse reflectance spectroscopy (DRS) of solid samples were recorded using the Evolution 220 spectrophotometer (Thermo Fisher Scientific, UK). The bandgap energy was calculated according to the equation:(αhν)n = A(hν − Eg)where h, ν, α, A, n, and Eg were Planck's constant, light frequency, absorption coefficient, constant, n = 2, and bandgap, respectively. The wavelength obtained from UV-Vis spectra in nm was converted to photon energy (hν) using the equation hν = 1240/λ. Thermogravimetric analysis (TGA) was recorded using the TA 60 thermal analyzer apparatus (Shimadzu, Japan) with a heating rate of 10 °C min−1. The specific surface area was determined using N2 adsorption–desorption isotherm (Quantachrome Instrument Corporation, Nova 3200, USA) using the Brunauer–Emmett–Teller (BET) method. The pore size distributions for mesopore and micropore regimes were determined via Density Functional Theory (DFT) and the Horvath Kawazoe (HK) method. The photoluminescence (PL) spectra were recorded using a fluorescence spectrophotometer (Cary Eclipse, Agilent USA). The emission for hydroxy-terephthalic acid (TPA-OH) was measured at excitation wavelength 315 nm. Gas chromatography-mass spectrometry (GC-MS) was evaluated using Shimadzu 2014 (Japan) equipped with ShinCarbon ST micro packed column (Restek, length 2 m × ID 2 mm, USA) and mass spectrometery.
2.4. Adsorption of dyes
Solutions of dyes (50 mg L−1) were prepared via dissolving 5 mg of dyes in 100 mL distilled water. 100 mL of the dye solution was mixed with an appropriate amount ZnO@N-doped C for adsorption alongside four h and under stirring at ambient temperature as illustrated in Fig. S1a (ESI†). The influence of catalyst load was investigated using 5, 10, or 20 mg. At a particular reaction time, 5 mL of the reaction was withdrawn, and the catalyst was removed through filtration using a 0.2 μm cellulose acetate membrane filter (CHMLAB group, Spain). The changes in the concentrations of dyes were recorded using a UV-Vis spectrophotometer. The adsorption efficiency was calculated using eqn (1).
 |
1 |
where A0 and At are the absorption at initial and t time, respectively. The adsorption capacity (qe) in (mg g−1) was calculated using eqn (2),
 |
2 |
where qe is the adsorption capacity in mg g−1, C0 and Ce are the initial and equilibrium concentrations. V is the volume in L, and W is the weight in g.46,47
2.5. UV photodegradation of dyes
After completing the adsorption experiment alongside four h, the residue was transferred into a quartz tube, where the UV photodegradation was performed under stirring. The exposure of UV light was performed using a 450 W medium pressure mercury vapor lamp. 5 mL of the reaction mixture were withdrawn and filtered at a particular exposure time. The degradation process was monitored using a UV-Vis spectrophotometer. The degradation efficiency was calculated using eqn (3), where the A(UV,0) and A(UV, t) are the UV-Vis absorbance before UV exposure and after UV exposure at a particular reaction time (t, min), respectively.
 |
3 |
2.6. Adsorption and catalytic degradation of MeB and FLU mixture
The adsorption of the MeB and Flu mixture on ZnO@N-doped C was investigated. 50 mL of MeB (50 mg L−1) and 50 mL of FLU (50 mg L−1) were mixed, and 5 mg of ZnO@N-doped C was added to the mixture under stirring. The adsorption was investigated alongside four hours, where 5 mL of the reaction mixture was withdrawn at a given (t) reaction time. The catalyst was filtrated, and the UV-Vis spectra were collected using the UV-Vis spectrophotometer. The adsorption capacities were also investigated using 10 or 20 mg of ZnO@N-doped C. The photocatalytic degradation of residue was also investigated as previously described.
3. Results and discussion
3.1. Materials characterization
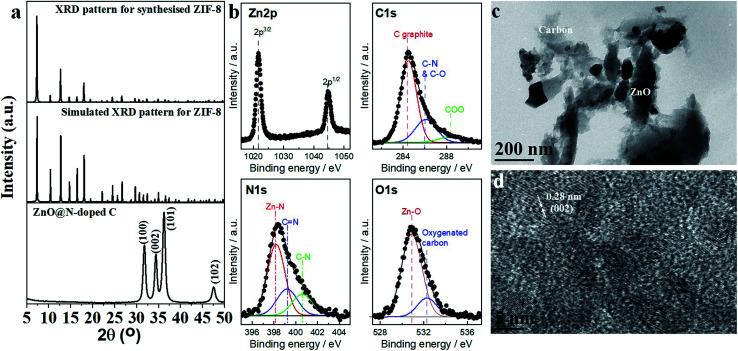
The synthesis procedure of ZIF-8 involves the addition of chemical reagents at room temperature. ZIF-8 was characterized using XRD (Fig. 1a), nitrogen adsorption–desorption isotherm (Fig. S2†), TGA (Fig. S3†). XRD patterns of ZIF-8 and simulated patterns are matched to each other, indicating the synthesis of the pure phase of ZIF-8 (Fig. 1a). Nitrogen adsorption–desorption isotherm shows IV type with hysteric's type indicating the presence of micropore–mesopore structure (Fig. S2†). The pore size distribution was evaluated using HK (Fig. S4†) and DFT (Fig. S5†) methods for micropore and mesopore regimes, respectively. Data reveals the presence of mesopore inside the crystal without any effect on the microporosity. The presence of mesopore can be confirmed by the TEM image (Fig. S6†). These observations confirm the formation of hierarchical porous ZIF-8 materials containing micropore and mesopore regimes. TGA data revealed that the material is thermally stable up to 350 °C (Fig. S3†). Above this temperature, the material decomposes to ZnO (calculated, 35.6%, found, 32.6%, Fig. S3†).
Fig. 1. (a) XRD spectra of ZIF-8 and ZnO@N-doped C. (b) XPS, (c) TEM, and (d) HR-TEM characterizations of ZIF-8 derived ZnO@N-doped C.
ZIF-8 was used as the precursor for synthesizing ZnO@N-doped C via carbonization. The carbonized material was characterized using XRD (Fig. 1a), XPS (Fig. 1b), TEM (Fig. 1c), HR-TEM (Fig. 1d), and nitrogen adsorption–desorption isotherm (Fig. S7†). The XRD pattern reveals the synthesis of ZnO that is assigned to the hexagonal wurtzite structure of ZnO (JCPDS 36-1451, Fig. 1a). XPS spectrum of Zn 2p is illustrated in Fig. 1b, where two peaks are observed at 1021.7 eV and 1044.8 eV. These two peaks are attributed to Zn 2p3/2 and Zn 2p1/2, respectively. The difference between the two bands is 23.1 eV, which indicates the presence of Zn+2. The XPS C 1s spectrum was deconvoluted into three peaks at 284.5 eV, 286.2 eV, and 288.8 eV, and these peaks are attributed to graphitic carbon (C–O, or C–N) and COO components, respectively. Oxygenated carbon components such as COO were produced during the calcination of ZIF-8. The XPS N 1s spectrum was deconvoluted into three peaks at 398.2 eV, 399.2 eV, and 400.6 eV. These peaks' full width at half maximum (FWHM) was fixed at 1.9, 2.2, and 2.2 eV, respectively. These peaks were attributed to pyridine-like nitrogen, pyrrole-like nitrogen, and graphitic nitrogen, respectively. Zn–O and oxygenated carbon components were also observed from XPS O 1s at 531 and 532.3 eV, respectively. The FWHM of these peaks was fixed at 2.2 and 2.1 eV, respectively. These XPS results indicate the development of N-doped ZnO embedded carbon graphite. TEM image of ZnO@N-doped C shows dark particles of ZnO dense phase into a gray layer of carbon (Fig. 1c). HR-TEM image shows lattice fringes of 0.28 nm corresponding to Miller index (002) for ZnO (Fig. 1d). Data analysis confirms the synthesis of ZnO@N-doped C via the carbonization of ZIF-8. Nitrogen adsorption–desorption isotherm reveals the presence of mesopore carbon with ZnO (Fig. S7†).
3.2. ZIF-8 and ZnO@N-doped C for adsorption and photocatalysis of dyes
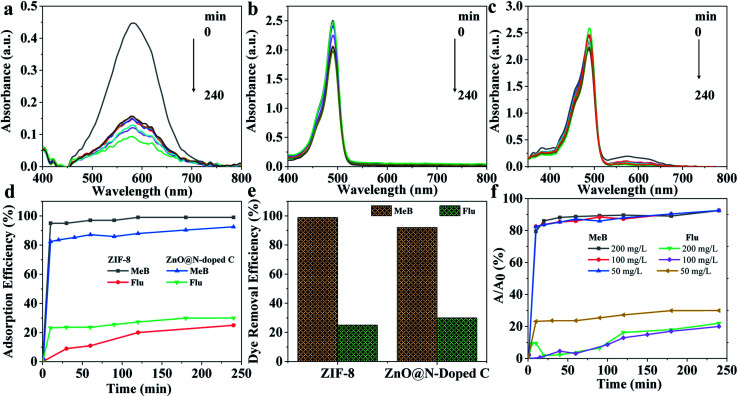
ZIF-8 and ZnO@N-doped C were used for the adsorption and photocatalysis of methyl blue (MeB) and fluorescein (FLU) dyes. The UV-Vis absorbance spectra for the mixture show absorbance bands at 580 nm and 494 nm for MeB (Fig. 2a) and FLU (Fig. 2b), respectively. The absorbance band of MeB is significantly decreased over time after incubation with ZIF-8 (Fig. S8†) and ZnO@N-doped C (Fig. 2a), indicating the removal of MeB from the solution. The MeB dye was significantly removed after 10 min only. However, the removal of FLU dye was not high, as illustrated in Fig. 2b. A slight decrease in the absorbance alongside four h was observed. These results indicate the selective adsorption of MeB in the presence of FLU dye on ZnO@N-doped C, as shown in Fig. 2c. The removal of MeB on ZIF-8, which approached >95% after a short time (<10 min), can be ascribed to the positively charged nature of ZIF-8 in water, as previously reported.22Fig. 2d and e shows the adsorption percentages of MeB and FLU dyes on ZIF-8 and ZnO@N-doped C at different times. The removal percentages of MeB on ZIF-8 and ZnO@N-doped C achieved 98% and 92%, respectively. At the same time, the removal efficiencies of FLU dye on both ZIF-8 and ZnO@N-doped C were 24% and 30%, respectively (Fig. 2d and e). ZnO@N-doped C requires a short contact time to reach the steady-state of the adsorption for both dyes compared to ZIF-8. Adsorption of MeB and FLU using different amounts of ZnO@N-doped C was also performed (Fig. 2f). Adsorption capacities for MeB and FLU using ZnO@N-doped C as adsorbent are 900 mg g−1 and 100 mg g−1, respectively. Even though the adsorption of dyes is an effective dye removal method, it requires a large amount of the adsorbent, material storage after adsorption, and several steps of optimization and separation. Therefore, ZIF-8 and ZnO@N-doped C were also investigated as photocatalysts for dye degradation.
Fig. 2. UV-Vis absorbance spectra of (a) MB, (b) FLU, and (c) mixture of MeB and FLU dyes for the adsorption on ZnO@N-doped C at different times, where 5 mg of dye was dissolved in 100 mL and immersed with 10 mg of catalyst, (d and e) removal efficiencies of MeB and FLU using ZIF-8 and ZnO@N-doped C, and (f) adsorption of dyes using different amount of ZnO@N-doped C.
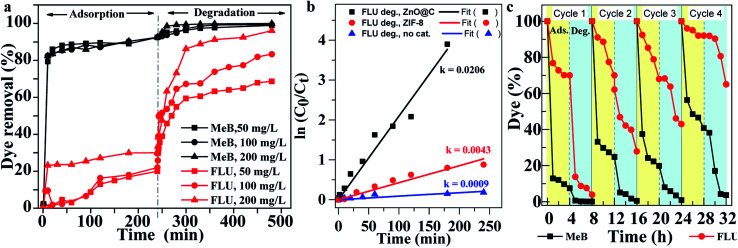
UV-Vis spectroscopy monitored the photocatalysis of FLU using ZIF-8 (Fig. S9†) and ZnO@N-doped C (Fig. S10 and S11†). ZnO@N-doped C shows high photocatalysis for FLU compared to ZIF-8 (Fig. S9†). The performance can be increased with the increase of the catalyst loading (Fig. S12†). ZnO@N-doped C successfully removes the dye using adsorption and photocatalysis (Fig. 3a). The catalytic performance is still high with the increase of the dye loading (Fig. 3a). The photocatalysis without and with ZIF-8 and ZnO@N-doped C using pseudo-first-order reaction and fitting plot of FLU degradation was compared as shown in Fig. 3b. Data fitting shows the rate of 9 × 10⁻⁴, 43 × 10−4, and 20.6 × 10⁻³ for no catalyst, ZIF-8, and ZnO@N-doped C, respectively (Fig. 3b). ZnO@N-doped C exhibits a five times higher rate compared to ZIF-8 (Fig. 3b). The increase of the rate constant reveals the increase of degradation, indicating that the degradation efficiency of FLU can be ordered as ZnO@N-doped C > ZIF-8 > no catalyst. The concentrations of MeB decreased from 7.5% after adsorption and 4 h UV exposure to 1.1%, 0.7% and <0.1% in the presence of 50 mg L−1, 100 mg L−1 and 200 mg L−1, respectively. Fig. 3a shows the percentages of dye removal after adsorption and UV photodegradation. The removal of MeB dye after adsorption and catalysis was approximately 98.9%, 99.3% and <99.9% on 50 mg L−1, 100 mg L−1 and 200 mg L−1, respectively (Fig. S13†). The concentrations of FLU after adsorption and degradation were 31.3%, 16.7%, and 3.9% in the presence of 50 mg L−1, 100 mg L−1, and 200 mg L−1 of ZnO@N-doped C, respectively. The FLU removal efficiencies after adsorption and degradation on 50 mg L−1, 100 mg L−1 and 200 mg L−1 of ZnO@N-doped C were 68.3%, 83.3%, and 96.1%, respectively (Fig. 3a).
Fig. 3. (a) Dye removal using ZnO@N-doped C for adsorption and photocatalysis, (b) pseudo-first-order reaction and fitting plot of FLU degradation, and (c) recyclability.
3.3. Reusability
The reusability of the ZnO@N-doped C for the adsorption and photodegradation of MeB and FLU is illustrated in Fig. 3c. The catalyst was used four times, where the adsorption and photodegradation of dyes were monitored for four h each. The concentration (%) of MeB after adsorption decreased by 7.5%, 24.8%, 19.8% and 40.8% in cycle 1, 2, 3, and 4, respectively. While the concentration of FLU decreased after adsorption to 70%, 70%, 68%, and 92% alongside cycles 1–4, respectively. The ZnO@N-doped C was efficient for the adsorption of MeB dye, and the reuse of the catalyst would reduce the adsorption efficiency. Also, the adsorption efficiency of the reused catalyst towards FLU decreased to some extent. The decrease in the adsorption efficiency is due to reducing the active sites in the reused catalyst. Of course, this removal of MeB was sufficient after adsorption and degradation alongside the four cycles. The removal approach was >96% alongside four cycles. The reused catalyst was not sufficient in photodegradation of FLU, and the removal efficiencies along sides four cycles were 96.1%, 72.1%, 57.0%, and 34.9%, respectively.
3.4. Mechanisms of adsorption and photocatalysis
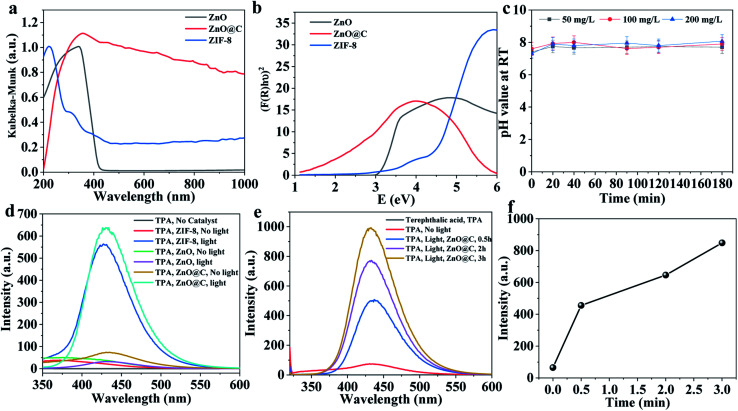
The mechanisms of adsorption and photocatalysis have been proposed based on several experimental observations such as XPS (Fig. 4), DRS (Fig. 5a and b), pH measurements (Fig. 5c), and fluorescence spectroscopy (Fig. 4d–f). The degradation product was monitored using GC-MS (Fig. 6).
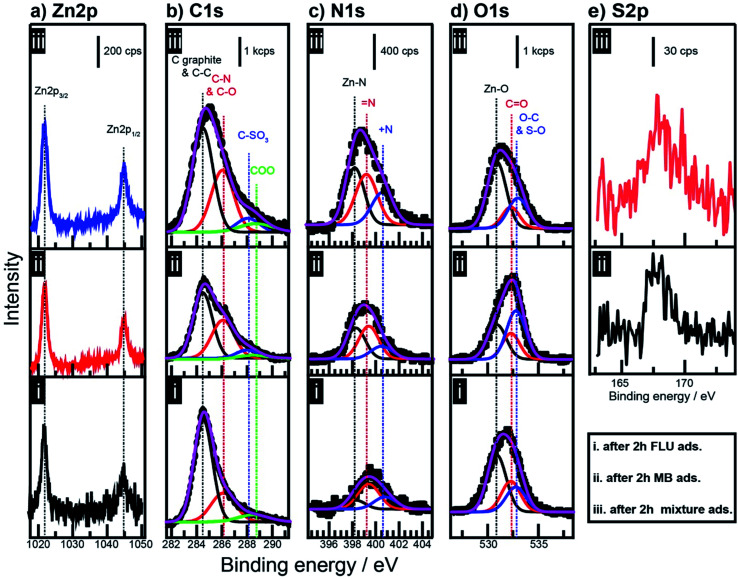
Fig. 4. XPS spectra of (a) Zn 2p, (b) C 1s, (c) N 1s, (d) O 1s, and (e) S 2p of ZnO@N-doped C after immersion for two h in (i) FLU dye, (ii) MeB, and (iii) mixture of FLU and MeB dyes.
Fig. 5. (a) DRS spectra, (b) Tauc plot, (c) pH measurements over time, (d and e) fluorescence emission spectra at excitation wavelength 315 nm, and (f) emission signal over time.
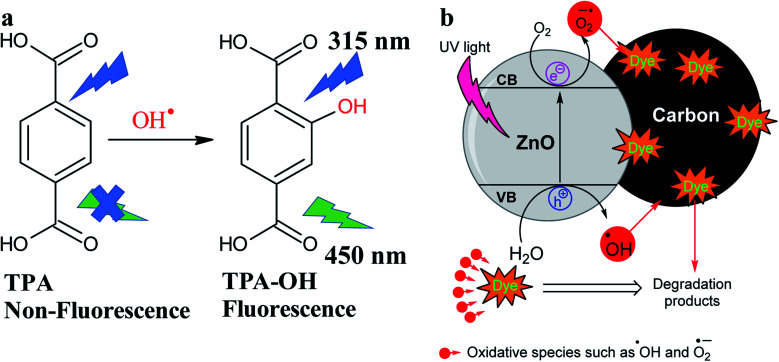
Fig. 6. (a) Probe ˙OH radical via the reaction with TPA to form hydroxyl-TPA, and (b) photocatalytic degradation of dyes using ZnO@N-doped C.
The XPS Zn 2p spectra of the catalyst after the adsorption of FLU and MeB are illustrated in Fig. 4a. The two peaks related to the Zn 2p3/2 and Zn 2p1/2 were observed at 1044.9 eV and 1021.9, respectively.10,23,40,48 No significant change in the position of these two peaks after immersing in MeB and FLU dyes. After adsorption, the XPS C 1s spectrum envelope was deconvoluted, as illustrated in Fig. 4b. Peaks attributed to graphitic carbon, C–O or C–N and C O or C N were fixed at 284.5 eV, 286.2 eV, and 288.8 eV, respectively.49 The FWHM of these peaks were 1.8 eV, 2.1 eV, and 2.9 eV, respectively. These deconvolution parameters were also applied during the deconvolution of the C 1s spectrum of ZnO@N-doped C before adsorption (Fig. 1b). A new deconvoluted peak was observed at 288.0 eV after MeB adsorption, which is attributed to carbon that is directly attached to SO3−.50 The abundance of C–N components increased after the adsorption of MeB, and this increase was attributed to the C–N components of MeB. Fig. 4c illustrates the XPS N 1s spectra, where the abundance of pyrrole-like nitrogen at 399.2 eV increased after adsorption of MeB dye due to the addition of N–H components of MeB. The quantity of Zn–N components decreased after the adsorption of FLU dye. Such decrease might be attributed to the leaching of Zn, as will be discussed later. In O 1s spectra (Fig. 4d), a new peak was observed at 532.8 eV, which could be ascribed to the O–C and O–S components of FLU and MeB, respectively. The abundance of O–C and S–O was significantly increased after the adsorption of MeB on the catalyst, which refers to the sufficient adsorption of MeB dye. The presence of sulfur originated from MeB is illustrated in Fig. 4e. These XPS results demonstrate the excellent adsorption of MeB dye compared to the FLU dye. These data reveal that the adsorption process occurs via non-covalent interactions without direct interaction with Zn centers.
DRS spectra of ZIF-8 and ZnO@N-doped C were recorded (Fig. 5a). ZnO and ZIF-8 exhibit absorbance below 400 nm. On the other hand, ZnO@N-doped C shows continuous absorbance in the 200–1000 nm (Fig. 5a). The bandgaps for ZIF-8 and ZnO have been estimated via the Tauc plot (Fig. 5b), and these bandgaps are 4.34 eV and 3.12 eV, respectively. The UV-Vis diffuse DRS analysis using the Tauc plot showed that the N-doped ZnO has a bandgap of 2.07 eV (Fig. 5b). The low bandgap of ZnO@N-doped C compared to both ZnO and ZIF-8 explains its high catalytic performance compared to the other materials.
The pH values of the MeB and FLU mixture in the presence of different amounts of ZnO@N-doped C were in the range of 7.40 (±0.39) and 8.25 (±0.41) as illustrated in Fig. 5c. The pH values during the adsorption of these two dyes were less than the pH indicator range of MeB, which is ∼9.4. Hence, the selective adsorption of MeB might be ascribed to the interactions between ZnO@N-doped C and the MeB.22,51 As indicated from the XPS results illustrated in Fig. 1b, different oxygenated components were introduced to the developed ZnO@N-doped C. Hence, the adsorption of MeB on ZnO@N-doped C might be ascribed to the electrostatic interactions between the amino components of MeB and the oxygen components presented in ZnO@N-doped C.51,52
Under UV light irradiation, the photocatalyst is expected to absorb the light energy creating reactive species such as hydroxyl radical (˙OH) or 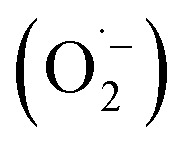 . The formation of ˙OH was evaluated via the fluorescence emission spectra using terephthalic acid (TPA, non-fluorescence agent) that was converted to 2-hydroxy terephthalic acid (TPA-OH, C6H4(COOH)2 + 2OH˙ → C6H3(COOH)2OH + H2O, fluorescent agent, Fig. 6a).36 The fluorescence emission of TPA with and without catalyst was recorded (Fig. 5d). The spectra show the hydroxyl terephthalic acid emission signal for ZnO, ZIF-8, ZnO@N-doped C indicating the formation of ˙OH (through the pathway O2 → O2−˙ → H2O2 → ˙OH) under light radiation. The observed signal can be ordered in the ZnO@N-doped C > ZIF-8 > ZnO (Fig. 5d). Interestingly, there is an observation of hydroxylation in the presence of ZnO@N-doped C with visible daylight. This observation is due to the small bandgap of ZnO@N-doped C. Furthermore, the emission signal of TPA-OH is increased over time (Fig. 5e and f).
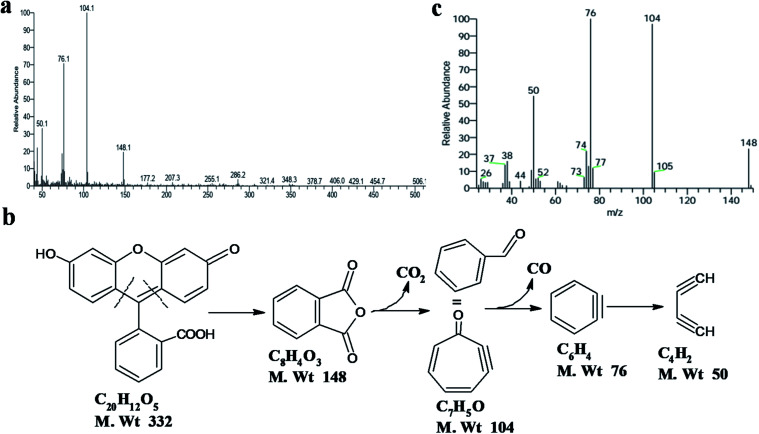
Based on the above observations, the mechanism of photocatalysis can be proposed, as shown in Fig. 6b. The low bandgap of ZnO@N-doped C exhibits high light absorbance. The presence of N-doped carbon assists the dye's adsorption process and light absorption. Thus, ZnO@N-doped C creates reactive species such as photo-generated electron/hole, superoxide 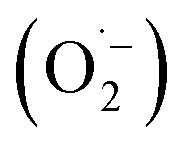 , and hydroxyl (˙OH) radicals. The degradation process can be evaluated using MS spectra (Fig. 7a). After photocatalysis, the entire mass spectrum shows no peaks related to the FLU dye indicating the complete degradation. The fragmentation pathway reveals the fragmentation of FLU to phthalic anhydride followed by the release of CO2 and CO (Fig. 7b). All proposed fragments can be observed in the mass spectrum, as shown in Fig. 7c.
Fig. 7. (a) Full spectrum of mass spectrometry of FLU after photocatalysis, (b) fragmentation pathway, and (c) mass spectrum corresponding to the fragmentation product at a specific retention time.
A summary of the adsorption and photocatalysis of some dyes using ZnO-based materials is tabulated in Table 1. The synthesis of ZnO@N-doped C is simple and requires only carbonization of ZIF-8, which can be synthesized at room temperature quickly. The carbonized material is effective adsorbent and photocatalyst without combining two-hybrid materials such as ZnO–ZIF-8.32 In addition, it required no expensive chemicals.53 A ternary ZnO/Zn6Al2O9/Al2O3 nanocomposite was synthesized via in situ incorporation of Al3+ during the synthesis of ZIF-8.54 Al2O3 improved the adsorption and photocatalytic performance of ZIF-8-derived ZnO under simulated sunlight irradiation. ZnO/Zn6Al2O9/Al2O3 exhibited high photocatalytic activity toward methyl orange (MO) degradation under simulated sunlight irradiation compared to ZnO. N-doped carbon reduces the bandgap and could prevent the recombination of the electron–hole pairs leading to high photocatalytic performance.54 Photocatalyst can be immobilized to improve recyclability and offer simple separation with minimal metal leaching via immobilization into a substrate.55,56
A summary for adsorption and photocatalysis using ZnO-based materials.
| Catalyst | Catalyst preparation | Dye | Adsorption | Photocatalysis | Ref. | ||
|---|---|---|---|---|---|---|---|
| Conditions | Efficiency | Light source | Efficiency | ||||
| N-doped ZnO@C-dots | Solvothermal of N-doped ZnO and C-dots | Malachite green | — | — | Vis light (400–520 nm) | 85% | 57 |
| ZnO@N-doped C | Calcination of MOF-5 | Rhodamine-B | Stirred in the dark | < 10% | UV irradiation | 98% | 44 |
| ZnO prepared through simple adsorption and calcination technique method with citric acid | MB | Stirred in the dark | 90% | UV irradiation (250 W, λ = 365 nm) with stirring | 98% | 58 | |
| ZnO-activated carbon | Modified in co-precipitation method | Malachite green dye | Stirred in the dark | 60% | Solar light | 99 | 59 |
| Congo red dye | 50% | 80% | |||||
| ZnO@N-doped C | 500 °C for 5 h of ZIF-8 | MB | 18 W UV lamp, 365 nm | 76 | 15 | ||
| Calcination of ZIF-8 | MeB | Stirred in the dark | >90% | UV light | >99% | This work | |
| FLU | <30% | >97 | |||||
| ZIF-8 | MeB | >99% | — | ||||
| FLU | <30% | 75% | |||||
4. Conclusions
The carbonization of ZIF-8 offered a simple synthesis of ZnO@N-doped C. The developed N-doped ZnO@N-doped C showed selective MeB dye adsorption with minor FLU dye adsorption. The adsorption efficiency towards MeB and FLU dyes approached 92% and 30%, respectively. Besides, the developed ZnO@N-doped C is considered a promising photocatalyst to degrade the dye residual after adsorption. Both FLU and MeB dyes were UV photodegraded in the presence of ZnO@N-doped C. Using ZnO@N-doped C (200 mg L−1), the concentration of MeB (50 mg L−1) decreased to <0.1% after adsorption and degradation. The concentration of FLU decreased to <7% after adsorption and degradation. Reducing the catalyst load resulted in a relative decrease in the degradation capacity. The reactivity of ZnO@N-doped C towards MeB adsorption insignificantly decreased alongside four cycles but strongly decreased towards FLU adsorption. Also, the reduction of catalytic performance towards FLU degradation was higher than MeB degradation during the four cycles.
Conflicts of interest
The authors declare no competing interests.
Supplementary Material
Acknowledgments
The authors thank Science and Technology Development Fund for financial support (Project No. 35969).
Electronic supplementary information (ESI) available. See DOI: 10.1039/d2ra00503d
References
- Katheresan V. Kansedo J. Lau S. Y. J. Environ. Chem. Eng. 2018;6:4676–4697. doi: 10.1016/j.jece.2018.06.060. [DOI] [Google Scholar]
- Yagub M. T. Sen T. K. Afroze S. Ang H. M. Adv. Colloid Interface Sci. 2014;209:172–184. doi: 10.1016/j.cis.2014.04.002. [DOI] [PubMed] [Google Scholar]
- Forgacs E. Cserháti T. Oros G. Environ. Int. 2004;30:953–971. doi: 10.1016/j.envint.2004.02.001. [DOI] [PubMed] [Google Scholar]
- Georgouvelas D. Abdelhamid H. N. Li J. Edlund U. Mathew A. P. Carbohydr. Polym. 2021;264:118044. doi: 10.1016/j.carbpol.2021.118044. [DOI] [PubMed] [Google Scholar]
- Aruna N. B. Sharma A. K. Kumar S. Chemosphere. 2021;268:129309. doi: 10.1016/j.chemosphere.2020.129309. [DOI] [PubMed] [Google Scholar]
- Demirbas A. J. Hazard. Mater. 2009;167:1–9. doi: 10.1016/j.jhazmat.2008.12.114. [DOI] [PubMed] [Google Scholar]
- Abdelhamid H. N. Mathew A. P. Front. Chem. Eng. 2021;3:790314. doi: 10.3389/fceng.2021.790314. [DOI] [Google Scholar]
- Tshikovhi A. Mishra S. B. Mishra A. K. Int. J. Biol. Macromol. 2020;152:616–632. doi: 10.1016/j.ijbiomac.2020.02.221. [DOI] [PubMed] [Google Scholar]
- Mahfoudhi N. Boufi S. Cellulose. 2017;24:1171–1197. doi: 10.1007/s10570-017-1194-0. [DOI] [Google Scholar]
- Qian H. Yu G. Hou Q. Nie Y. Bai C. Bai X. Wang H. Ju M. Appl. Catal., B. 2021;291:120064. doi: 10.1016/j.apcatb.2021.120064. [DOI] [Google Scholar]
- Song Z. Xu Y. Bao L. Zhang L. Yu P. Qu Y. Zhu H. Zhao W. Han Y. Qin C. Viruses. 2019;11:59. doi: 10.3390/v11010059. [DOI] [PMC free article] [PubMed] [Google Scholar]
- Serpone N. Emeline A. V. J. Phys. Chem. Lett. 2012;3:673–677. doi: 10.1021/jz300071j. [DOI] [PubMed] [Google Scholar]
- Zhu D. Zhou Q. Environ. Nanotechnol. Monit. Manag. 2019;12:100255. [Google Scholar]
- Kisch H. Angew. Chem., Int. Ed. 2013;52:812–847. doi: 10.1002/anie.201201200. [DOI] [PubMed] [Google Scholar]
- Du Y. Chen R. Z. Yao J. F. Wang H. T. J. Alloys Compd. 2013;551:125–130. doi: 10.1016/j.jallcom.2012.10.045. [DOI] [Google Scholar]
- Bavykina A. Kolobov N. Khan I. S. Bau J. A. Ramirez A. Gascon J. Chem. Rev. 2020;120:8468–8535. doi: 10.1021/acs.chemrev.9b00685. [DOI] [PubMed] [Google Scholar]
- Abdelhamid H. N. Mathew A. P. Carbohydr. Polym. 2021;274:118657. doi: 10.1016/j.carbpol.2021.118657. [DOI] [PubMed] [Google Scholar]
- Abdelhamid H. N. Curr. Med. Chem. 2021;28:7023–7075. doi: 10.2174/0929867328666210608143703. [DOI] [PubMed] [Google Scholar]
- Abdelhamid H. N. Appl. Organomet. Chem. 2021;35:e6319. doi: 10.1002/aoc.6319. [DOI] [Google Scholar]
- Abdelhamid H. N. Biointerface Res. Appl. Chem. 2021;11:8283–8297. [Google Scholar]
- Abdelhamid H. N. Al Kiey S. A. Sharmoukh W. Appl. Organomet. Chem. 2022;36(1):e6486. doi: 10.1002/aoc.6486. [DOI] [Google Scholar]
- Abdelhamid H. N. Zou X. Green Chem. 2018;20:1074–1084. doi: 10.1039/C7GC03805D. [DOI] [Google Scholar]
- Abdelhamid H. N. J. Solid State Chem. 2021;297:122034. doi: 10.1016/j.jssc.2021.122034. [DOI] [Google Scholar]
- Jiang D. Xu P. Wang H. Zeng G. Huang D. Chen M. Lai C. Zhang C. Wan J. Xue W. Coord. Chem. Rev. 2018;376:449–466. doi: 10.1016/j.ccr.2018.08.005. [DOI] [Google Scholar]
- Li H. Chen W. Liu B. Yang M. Huang Z. Sun C. Deng C. Cao D. Chen G. Green Energy Environ. 2021 doi: 10.1016/j.gee.2021.09.003. [DOI] [Google Scholar]
- Du X. Ding Y. Zhang X. Green Energy Environ. 2021 doi: 10.1016/j.gee.2021.09.007. [DOI] [Google Scholar]
- Abdelhamid H. N. J. Environ. Chem. Eng. 2020;8:104008. doi: 10.1016/j.jece.2020.104008. [DOI] [Google Scholar]
- Abdelhamid H. N. Mathew A. Coord. Chem. Rev. 2022;451:214263. doi: 10.1016/j.ccr.2021.214263. [DOI] [Google Scholar]
- Abdelhamid H. N., Advanced Functional Porous Materials, Springer International Publishing, Cham, 2022 [Google Scholar]
- Ba Mohammed B. Lgaz H. Alrashdi A. A. Yamni K. Tijani N. Dehmani Y. El Hamdani H. Chung I.-M. Arabian J. Chem. 2021;14:102897. doi: 10.1016/j.arabjc.2020.11.003. [DOI] [Google Scholar]
- Nasser Abdelhamid H. Mathew A. P. Chem. Eng. J. 2021;426:131733. doi: 10.1016/j.cej.2021.131733. [DOI] [Google Scholar]
- Tuncel D. Ökte A. N. Catal. Today. 2021;361:191–197. doi: 10.1016/j.cattod.2020.04.014. [DOI] [Google Scholar]
- Wang X. Liu J. Leong S. Lin X. Wei J. Kong B. Xu Y. Low Z.-X. Yao J. Wang H. ACS Appl. Mater. Interfaces. 2016;8:9080–9087. doi: 10.1021/acsami.6b00028. [DOI] [PubMed] [Google Scholar]
- Goda M. N. Said A. E.-A. A. Abdelhamid H. N. J. Environ. Chem. Eng. 2021;9:106336. doi: 10.1016/j.jece.2021.106336. [DOI] [Google Scholar]
- Grau-Crespo R. Aziz A. Collins A. W. Crespo-Otero R. Hernández N. C. Rodriguez-Albelo L. M. Ruiz-Salvador A. R. Calero S. Hamad S. Angew. Chem., Int. Ed. 2016;55:16012–16016. doi: 10.1002/anie.201609439. [DOI] [PMC free article] [PubMed] [Google Scholar]
- Tran V. A. Kadam A. N. Lee S.-W. J. Alloys Compd. 2020;835:155414. doi: 10.1016/j.jallcom.2020.155414. [DOI] [Google Scholar]
- Nascimento K. N. da S. de Oliveira M. C. A. Oliveira P. S. Macedo E. R. de Oliveira H. P. Fibers Polym. 2015;16:2177–2183. doi: 10.1007/s12221-015-5456-x. [DOI] [Google Scholar]
- Kaur J. Bansal S. Singhal S. Phys. B. 2013;416:33–38. doi: 10.1016/j.physb.2013.02.005. [DOI] [Google Scholar]
- Hu C. Hu X. Li R. Xing Y. J. Hazard. Mater. 2020;385:121599. doi: 10.1016/j.jhazmat.2019.121599. [DOI] [PubMed] [Google Scholar]
- Hussain M. Z. Pawar G. S. Huang Z. Tahir A. A. Fischer R. A. Zhu Y. Xia Y. Carbon. 2019;146:348–363. doi: 10.1016/j.carbon.2019.02.013. [DOI] [Google Scholar]
- Dindar B. Güler A. C. Environ. Nanotechnol. Monit. Manag. 2018;10:457–466. [Google Scholar]
- Wu C. Appl. Surf. Sci. 2014;319:237–243. doi: 10.1016/j.apsusc.2014.04.217. [DOI] [Google Scholar]
- Wu C. Zhang Y. C. Huang Q. Mater. Lett. 2014;119:104–106. doi: 10.1016/j.matlet.2013.12.111. [DOI] [Google Scholar]
- Sharma S. Mehta S. K. Kansal S. K. J. Alloys Compd. 2017;699:323–333. doi: 10.1016/j.jallcom.2016.12.408. [DOI] [Google Scholar]
- Abdelhamid H. N. Huang Z. El-Zohry A. M. Zheng H. Zou X. Inorg. Chem. 2017;56:9139–9146. doi: 10.1021/acs.inorgchem.7b01191. [DOI] [PubMed] [Google Scholar]
- Abdel-Magied A. F. Abdelhamid H. N. Ashour R. M. Zou X. Forsberg K. Microporous Mesoporous Mater. 2019;278:175–184. doi: 10.1016/j.micromeso.2018.11.022. [DOI] [Google Scholar]
- Ghosh I. Kar S. Chatterjee T. Bar N. Das S. K. Sustainable Chem. Pharm. 2021;19:100374. doi: 10.1016/j.scp.2021.100374. [DOI] [Google Scholar]
- Soliman A. I. A. Wu C.-T. Utsunomiya T. Ichii T. Sugimura H. Thin Solid Films. 2020;709:138166. doi: 10.1016/j.tsf.2020.138166. [DOI] [Google Scholar]
- Soliman A. I. A. Utsunomiya T. Ichii T. Sugimura H. Langmuir. 2018;34:3228–3236. doi: 10.1021/acs.langmuir.7b04327. [DOI] [PubMed] [Google Scholar]
- (Ray) Zeng Q. Li Y. Wu K.-H. Huang N. Dalapati S. Su B.-J. Jang L.-Y. Gentle I. R. Jiang D. Wang D.-W. Energy Storage Mater. 2018;12:30–36. doi: 10.1016/j.ensm.2017.11.007. [DOI] [Google Scholar]
- Zong Z. Bin Fan C. Zhang X. Min Meng X. Jin F. Hua Fan Y. Microporous Mesoporous Mater. 2019;282:82–90. doi: 10.1016/j.micromeso.2019.03.014. [DOI] [Google Scholar]
- Zhen Z. Jiang Z. Tian X. Zhou L. Deng B. Chen B. Jiang Z. J. RSC Adv. 2018;8:14462–14472. doi: 10.1039/C8RA01680A. [DOI] [PMC free article] [PubMed] [Google Scholar]
- He L. Li L. Wang T. Gao H. Li G. Wu X. Su Z. Wang C. Dalton Trans. 2014;43:16981–16985. doi: 10.1039/C4DT02557A. [DOI] [PubMed] [Google Scholar]
- Zhang L. Liang Q. Yang P. Huang Y. Liu Y. Yang H. Yan J. New J. Chem. 2019;43:2990–2999. doi: 10.1039/C8NJ04798G. [DOI] [Google Scholar]
- Boruah B. Gupta R. Modak J. M. Madras G. J. Photochem. Photobiol., A. 2019;373:105–115. doi: 10.1016/j.jphotochem.2018.11.001. [DOI] [Google Scholar]
- Boruah B. Samantaray P. K. Madras G. Modak J. M. Bose S. Chem. Eng. J. 2020;394:124777. doi: 10.1016/j.cej.2020.124777. [DOI] [Google Scholar]
- Ye T. a McArthur E. Borguet E. J. Phys. Chem. B. 2005;109:9927–9938. doi: 10.1021/jp0474273. [DOI] [PubMed] [Google Scholar]
- Ma S. Xue J. Zhou Y. Zhang Z. Wu X. CrystEngComm. 2014;16:4478–4484. doi: 10.1039/C4CE00110A. [DOI] [Google Scholar]
- Raizada P. Singh P. Kumar A. Sharma G. Pare B. Jonnalagadda S. B. Thakur P. Appl. Catal., A. 2014;486:159–169. doi: 10.1016/j.apcata.2014.08.043. [DOI] [Google Scholar]
Associated Data
This section collects any data citations, data availability statements, or supplementary materials included in this article.


