Abstract
Tissue morphogenesis emerges from coordinated cell shape changes driven by actomyosin contractions. Patterns of gene expression regionalize cell behaviours by controlling actomyosin contractility. We report two modes of control over Rho1 and MyosinII activation in the Drosophila endoderm. First, Rho1/MyoII are induced in a spatially restricted primordium via localized transcription of the GPCR ligand Fog. Second, a tissue-scale wave of Rho1/MyoII activation and cell invagination progresses anteriorly away from the primordium. The wave does not require sustained gene transcription, and is not governed by regulated Fog delivery. Instead, MyoII inhibition blocked Rho1 activation and propagation, revealing a mechanical feedback driven by MyoII. We find that MyoII activation and invagination in each row of cells drives adhesion to the vitelline membrane mediated by Integrins, apical spreading, MyoII activation and invagination in the next row. Thus endoderm morphogenesis emerges from local transcriptional initiation and a mechanically driven cycle of cell deformation.
Understanding how forms arise during development requires accounting for how information and cell mechanics govern spatial and temporal patterns of cell behaviours. Developmental information regionalizes and polarizes cellular behaviours. Current frameworks explain how genetic and biochemical information controls cellular mechanics1,2. For instance, in the early Drosophila embryo the expression of the mesoderm transcription factors Twist and Snail induces apical cell constriction and tissue invagination in a ventral region of the embryo3. These behaviours arise from spatial and temporal control over actomyosin contractility1,4. Activation of non-muscle Myosin II (MyoII) in the medio-apical region of cells drives their apical constriction and tissue invagination5–8. The small GTPase Rho1 activates MyoII through the downstream kinase Rok9–12 and is itself controlled by different signalling pathways, including G protein coupled receptors (GPCRs)13,14. During gastrulation in Drosophila the localized transcription and secretion of the GPCR ligand Fog controls Rho1 activation and MyoII-dependent apical constriction15,16. Thus, developmental patterning controls actomyosin contractility and tissue dynamics through control of Rho signalling.
Yet, during morphogenesis, actomyosin networks and Rho GTPases display remarkable dynamics that are not strictly governed by upstream genetic programs. Actomyosin networks are pulsatile5,6,17 7,12,18–20 or flow17,18,21,22 in a wide variety of species, while cortical waves of RhoA activity emerge at the cortex of large cells12,23,24. Furthermore, actomyosin networks can sense and respond to the mechanical environment25–28. How genetic information and mechanics integrate to coordinate actomyosin contractility and tissue level morphogenesis remains poorly understood. We address this in the early Drosophila embryo and report a mechanically-driven wave of MyoII activation and cell deformation during morphogenesis of the posterior endoderm.
A wave of MyoII activation and cell invagination travels anteriorly
The Drosophila posterior endoderm is at the posterior embryo pole and undergoes invagination and movement towards the anterior, driving germ-band extension (Fig.1a)29,30. MyoII-dependent apical constriction drives local endoderm invagination15,31,32, but how the endoderm moves towards the anterior is unknown. To investigate this we imaged MyoII (MyoII Regulatory Light Chain, MRLC∷mCherry) together with a marker of cell contours (E-cadherin∷GFP) on the dorsal posterior side of embryos (Fig.1b and Video 1). During the first 6 minutes MyoII is activated in the medial-apical region of cells and induces invagination within a region, the endoderm primordium, comprising 7±1 rows of cells from the pole (Fig.1b top and 1c). Surprisingly, in the next 25 minutes, apical MyoII activation and cell invagination propagate anteriorly across a domain of 8±1 rows of cells hereafter called the propagation region (Fig.1b middle-bottom and 1c). Thus, the region where MyoII is activated and cells invaginate expands anteriorly. This contrasts with the Drosophila mesoderm, where apical constriction occurs in a fixed domain defined by the expression of twist and snail2.
Figure 1. Propagation of MyoII activation in the posterior endoderm:
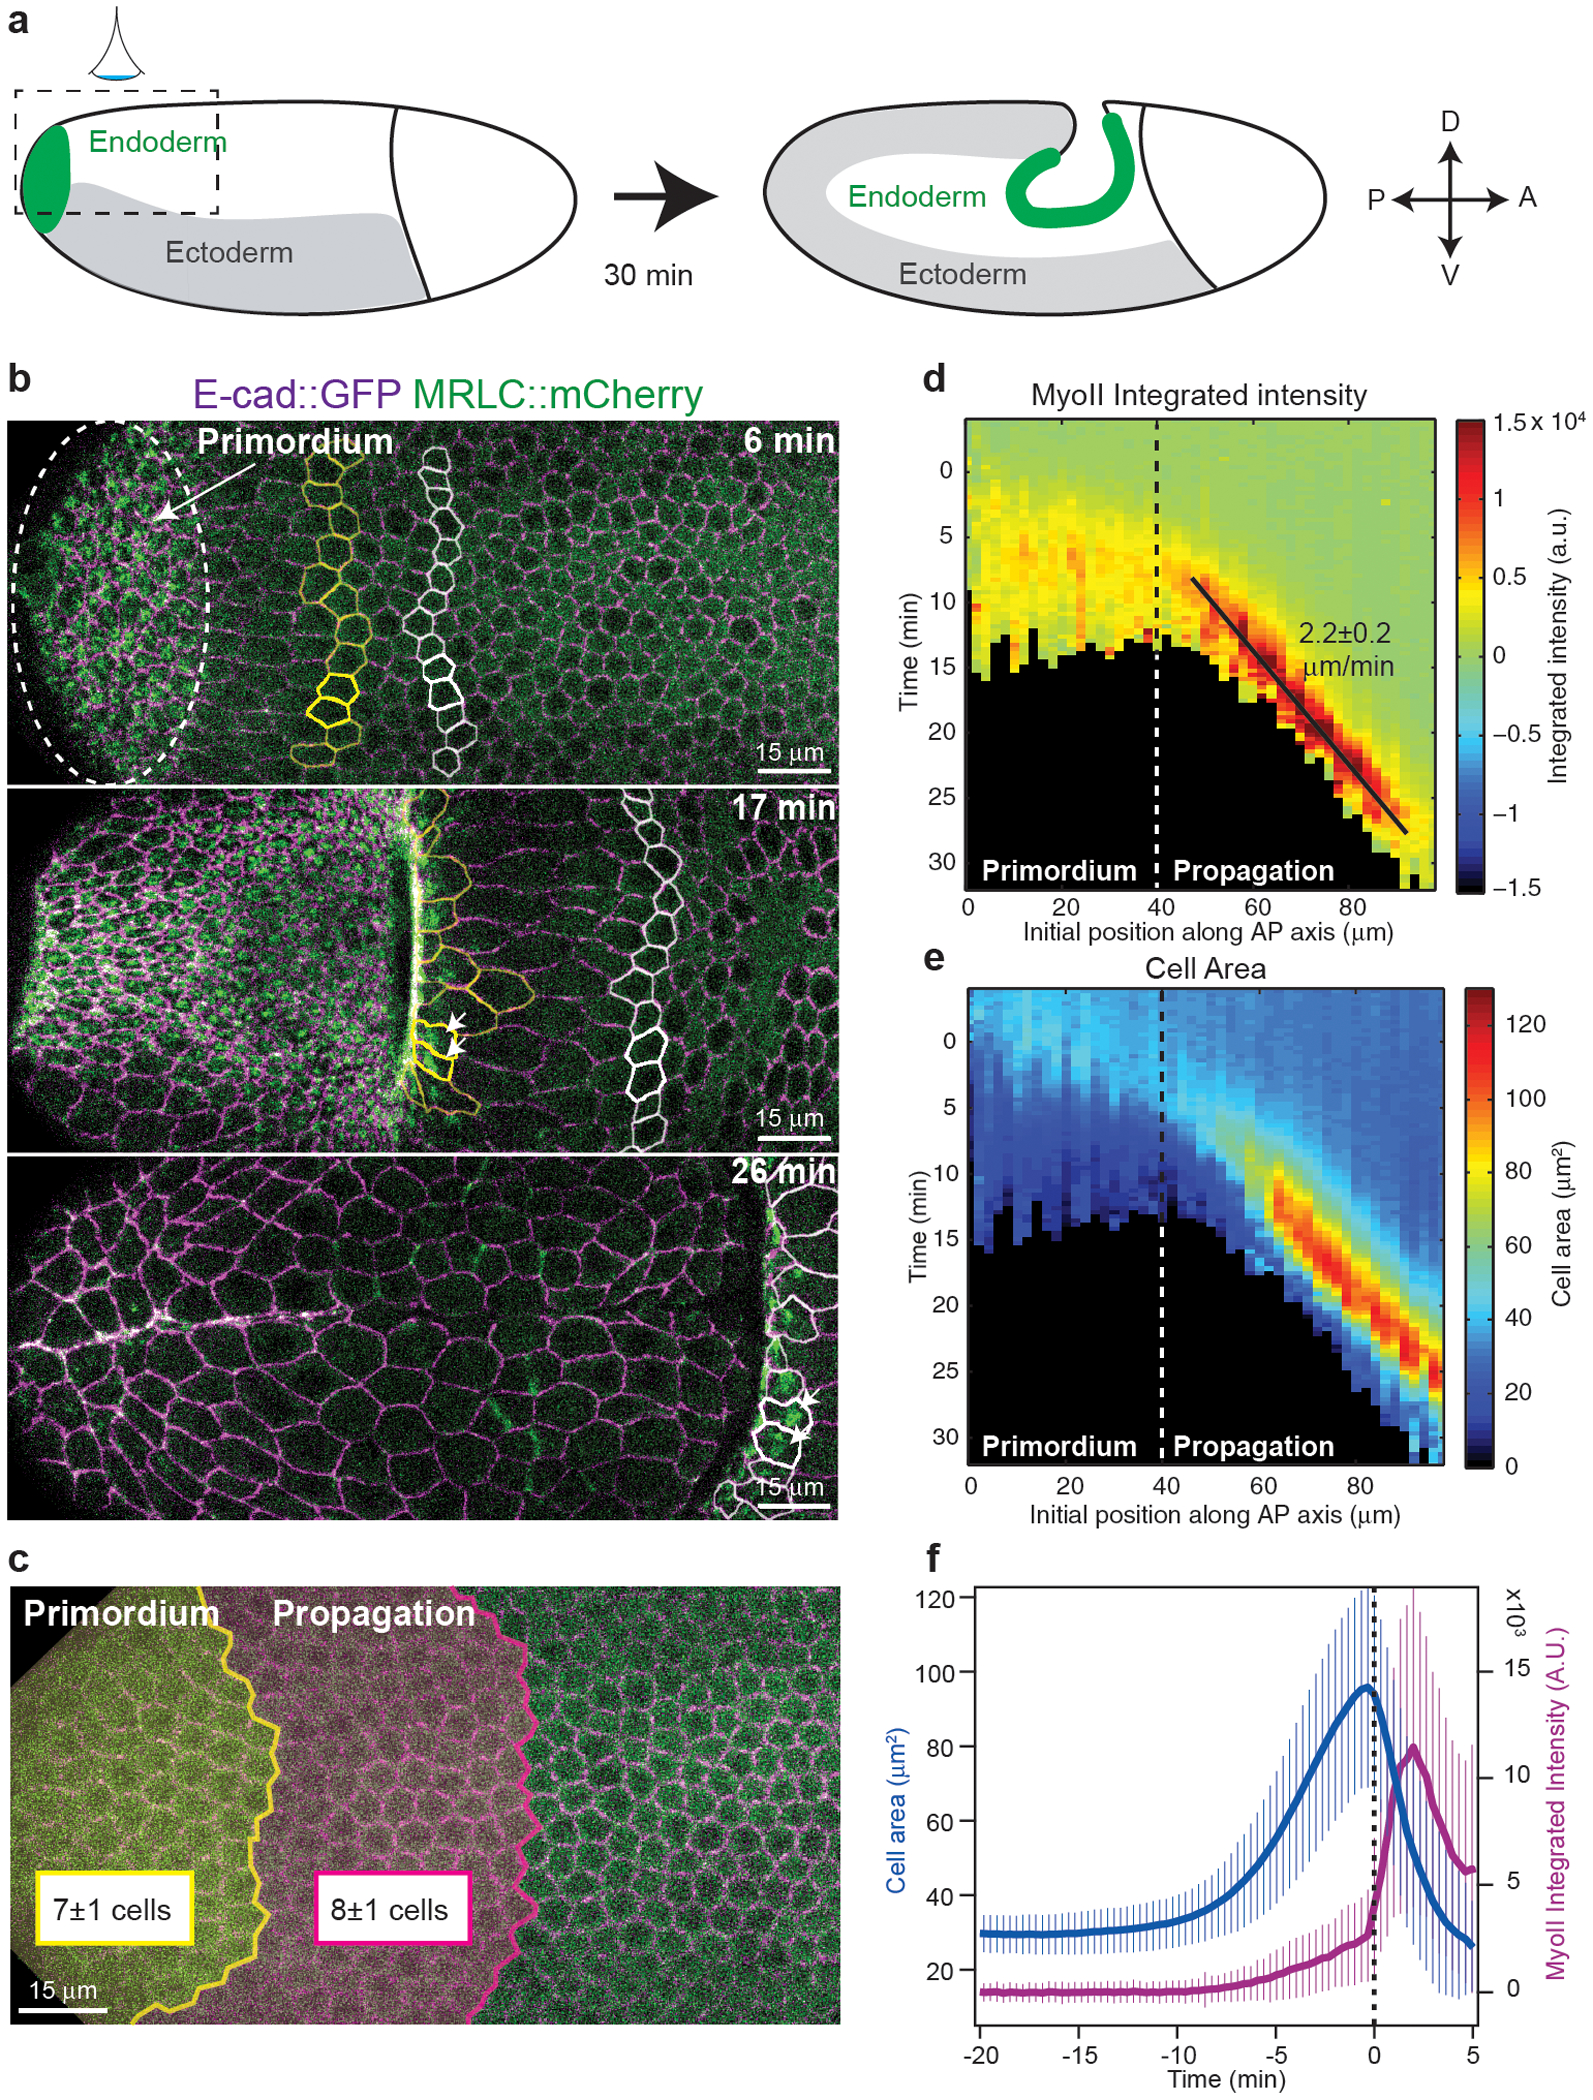
(a) Endoderm morphogenesis during embryonic axis extension. Dotted box: region of imaging. (b) Time-lapse of MyoII during endoderm morphogenesis. Dashed oval: the primordium region, in yellow and white cells of different medio-lateral rows, white arrows: MyoII activation. N=13 embryos. (c) Primordium and the propagation regions mapped on the dorsal epithelium at the onset of gastrulation. The size of each domain is indicated (N=13 embryos). (d-e) Kymograph heat-maps of median MyoII integrated intensity (d) and projected apical cell area (e). Dashed line: border between the primordium and propagation regions, black line: constant speed of the MyoII wave. N=947 cells, 5 embryos. (f) Time course of projected apical area and MyoII integrated intensity in cells in the propagation zone (N=456 cells, 6 embryos). Cells are registered on t0 the time of MyoII activation. Mean±SD in c,d,f.
We tracked cells over time and plotted MyoII intensity and apical cell shape as a function of time and initial cell position along the AP-axis (see Methods and Ext.Fig.1a–d). Heat-map kymographs show that the MyoII activation wave travels with a constant speed of 2.2±0.2 μm/min (corresponding to one cell every ~3 min, Fig.1d) and is preceded by a wave of anisotropic cell deformation where cell apical areas (measured as their projection on the imaging plane, Ext.Fig.1g–i) increase along the AP-axis before invagination (Fig.1e,f and Ext.Fig.1e–f). Strikingly, while cells in the primordium recruit MyoII in a stepwise manner (Ext.Fig.2a,b and Video 2), cells in the propagation region recruit MyoII with kinetics significantly faster than the primordium (Ext.Fig.2c), suggesting a different mechanism of MyoII activation.
Next, we imaged Rho1 and Rok activation with a Rho1-GTP biosensor10, and a Rok∷GFP9 and found that both molecules are activated together with MyoII in the propagation domain (Ext.Fig.3a–d and Videos 3–4). Thus, a wave of Rho1, Rok and MyoII activation propagates across the dorsal epithelium. This led us to investigate the underlying mechanisms.
The MyoII wave does not depend on propagation of gene expression
The medio-apical activation of MyoII in the endoderm primordium depends on localized transcription and secretion of Fog15,16, which is controlled by the receptor tyrosine kinase Torso (Tor) and its target transcription factors Huckebein (Hkb) and Tailless (Tll)15,33,34 (Ext.Fig.4a). In mutants for tor, fog or concertina (the G-protein Gα12/13 downstream of GPCRs16), MyoII activation was abolished in the primordium, as expected, but also in the propagation region (Ext.Fig.4b and Video 5). We thus tested whether the expression of tll and fog propagates anteriorly like MyoII (Fig.2a). Immunolabellings revealed that Fog and Tll were present in the primordium where MyoII is activated but also that their expression domains did not expand over time as new cells incorporated in the invagination (Fig.2b and Ext.Fig.4c). In contrast MyoII was enriched at cell apices at the invaginating front at all stages (Fig.2b), reflecting propagation of its activation.
Figure 2. MyoII propagation does not depend on gene transcription:
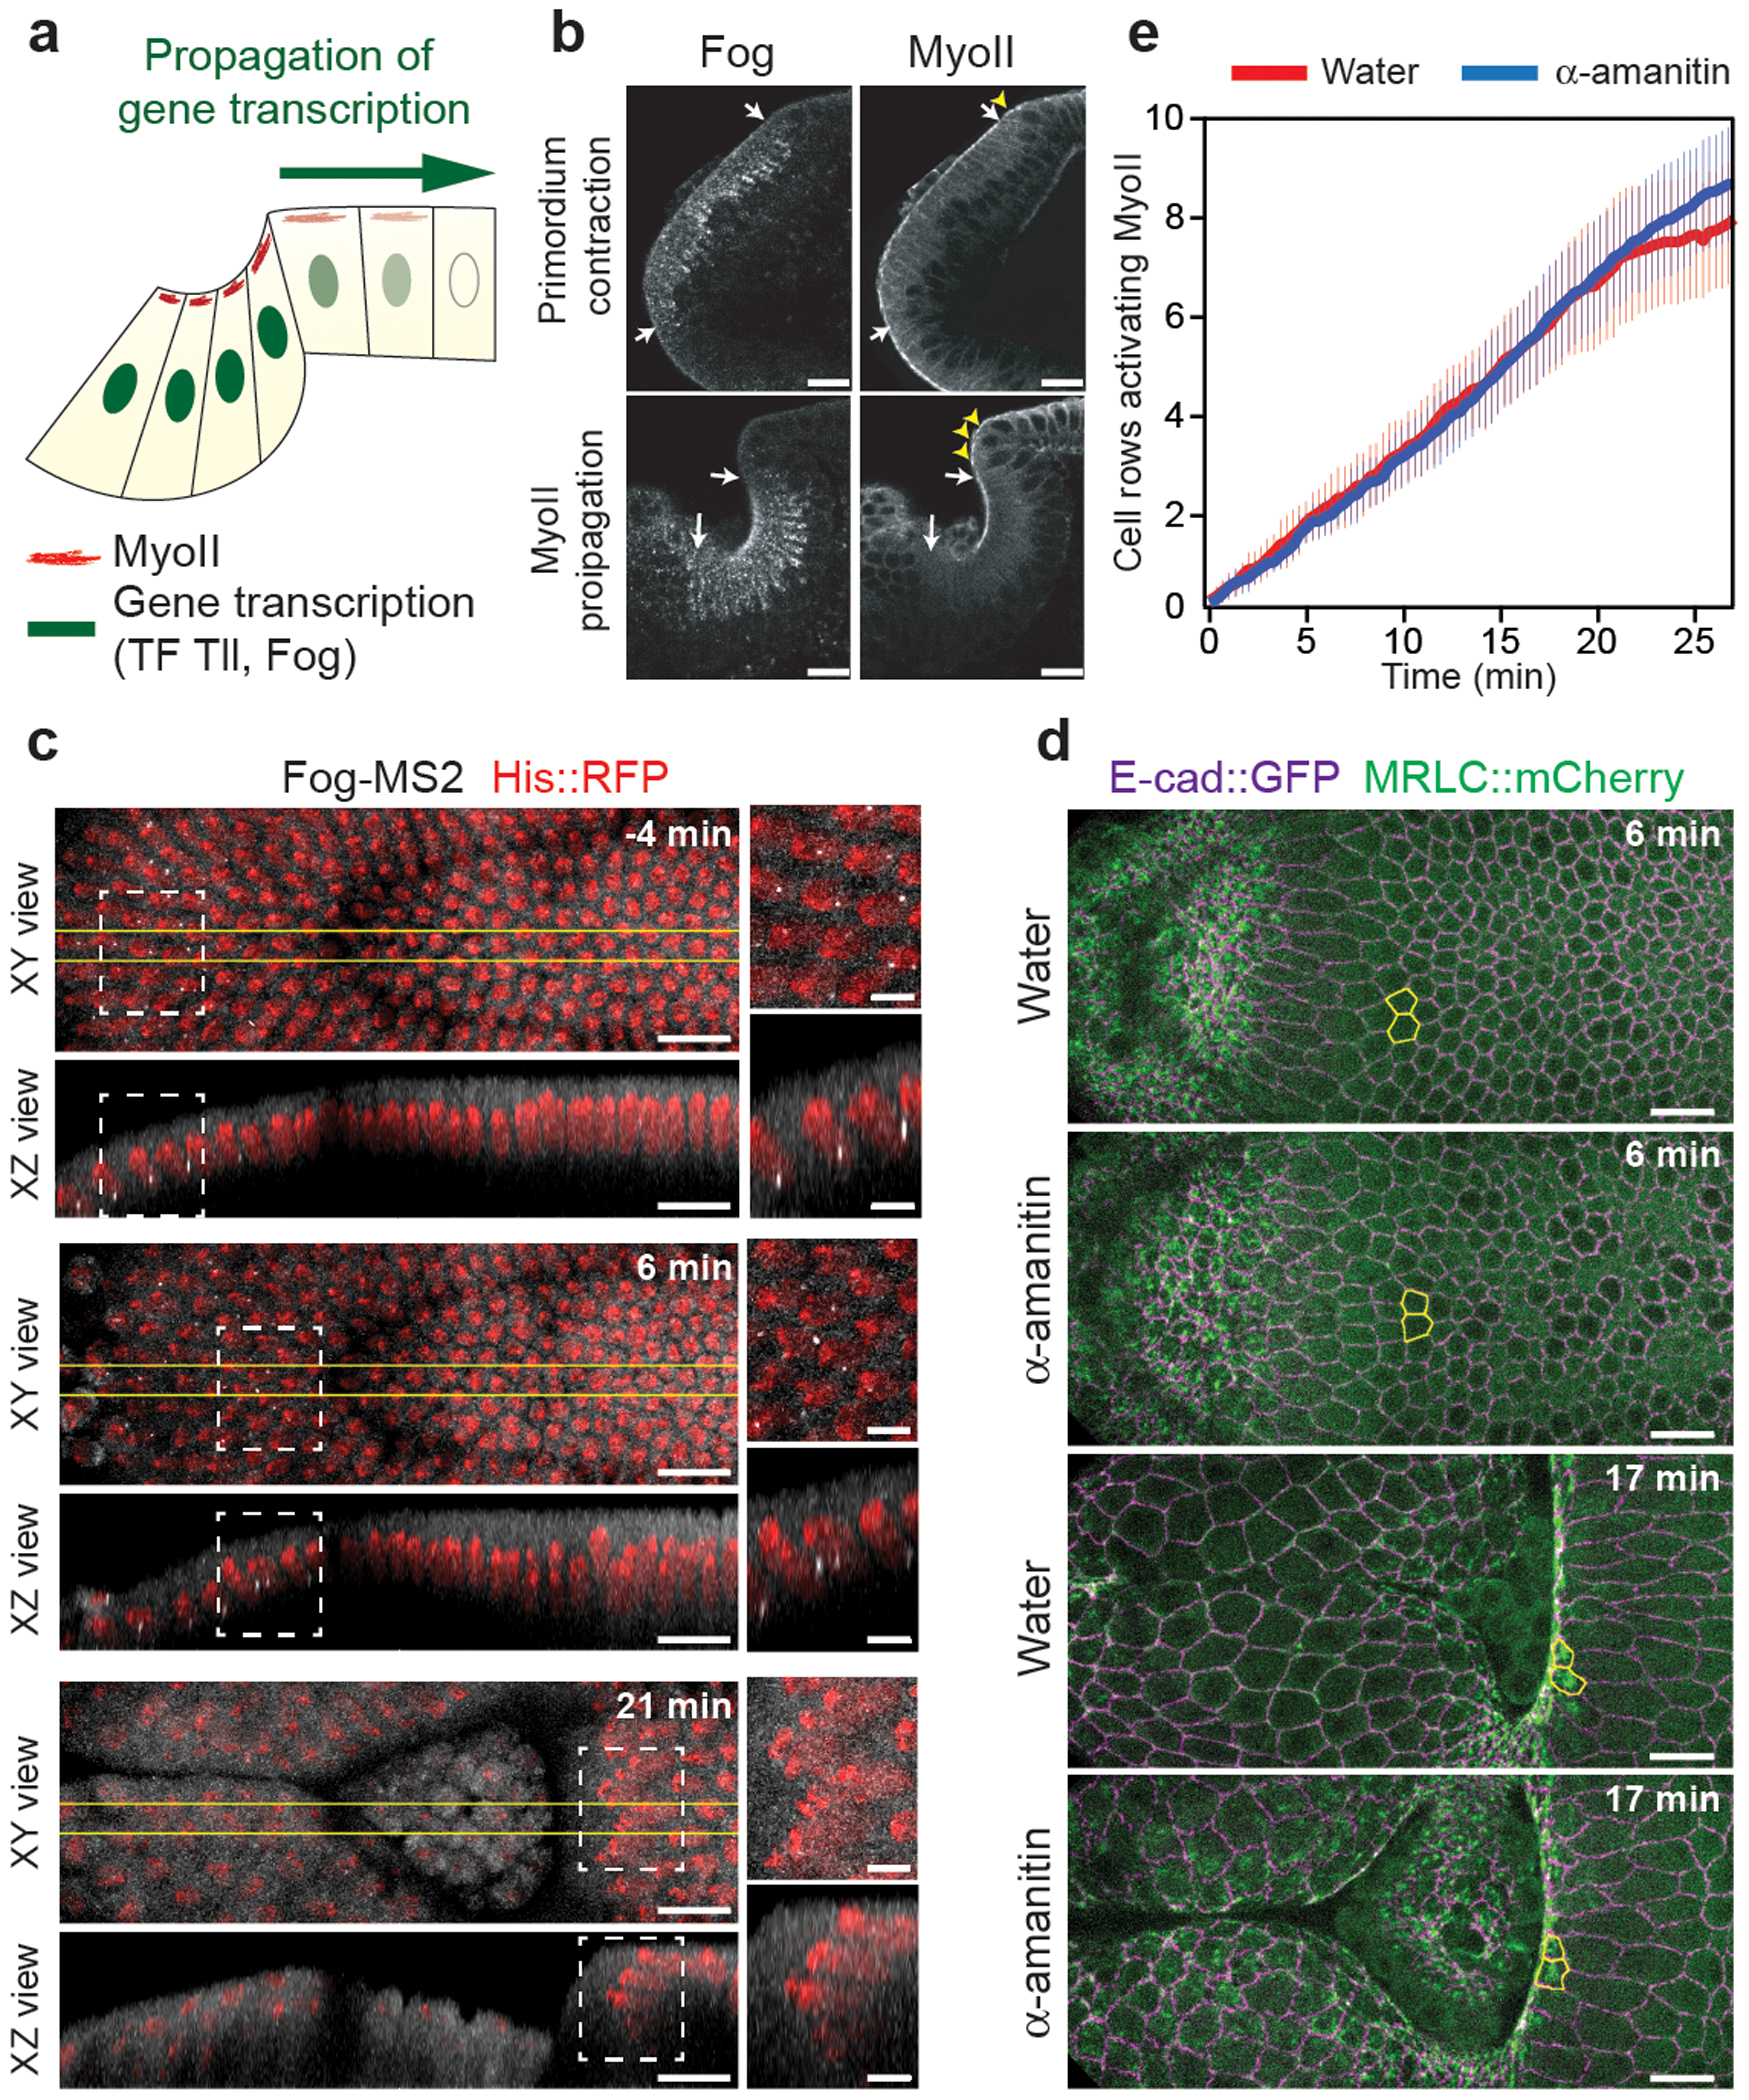
(a) Illustration of the dorsal epithelium in a sagittal section describing the hypothesis of propagation in gene expression controlling MyoII propagation. (b) Sagittal sections of immunostainings for Fog and MyoII at the indicated stages. White arrows: boundaries of the fog expression domain, yellow arrowheads: cells recruiting MyoII at the anterior boundary of the furrow. N=7 embryos for primordium contraction and N=5 embryos for propagation stages from 2 independent experiments. (c) Time-lapse of fog expression in the posterior endoderm visualized with the MS2-MCP system35. White dashed boxes: positions of the close-ups, yellow lines: the region where side-views were generated. N=11 embryos. (d) MyoII wave propagation in control (water) and α-amanitin injected embryos. In yellow cells in the propagation region. (e) Quantifications MyoII propagation in water and α-amanitin injected embryos. The number of cell rows activating MyoII in the propagation region over time was measured. Mean±SD. In d and e N=11 for water and N=10 for α-amanitin injected embryos. In e t0 is the beginning of MyoII propagation. Scalebar 15μm in b,c,d and 5μm in the insets in c.
We monitored fog transcription with MyoII in living embryos using the MS2/MCP system35. Fog transcripts (bright GFP dots in the nuclei marked with His2B∷RFP) were present in the primordium at onset of gastrulation but strikingly absent from the propagation zone where MyoII was induced (Fig.2c, Ext.Fig.5a and Video 6). We concluded that while fog transcription in the primordium is required for MyoII activation, the subsequent activation wave is not associated with a wave of fog transcription. Propagation of MyoII activation might depend on propagation of transcription of other genes. To test this, we injected α-amanitin, an inhibitor of RNA Polymerase-II. Injection before gastrulation led to a rapid disappearance (within 2–3 mins) of nuclear foci of Fog transcripts (Video 7) while the MyoII wave proceeded at normal velocity (Fig.2d,e and Video 8). Two processes requiring acute transcription were affected in these conditions: 1) cell divisions in mitotic domains (dependent on cdc25string transcription36) were blocked and 2) cell intercalation requiring even-skipped and toll2,6,8 transcription37 in the ventro-lateral ectoderm was inhibited (Ext.Fig.5b and Video 8). We concluded that while MyoII wave is initiated by fog transcription in the primordium, its progression depends on a relay mechanism independent of transcription.
Delivery of Fog produced in the primordium does not govern the MyoII wave dynamics
Fog may act through paracrine signalling15. Thus, the spread of Fog away from the primordium, where it is produced and secreted, could underlie propagation of Rho1/MyoII activity (Ext.Fig.6a). Consistent with this, Fog protein was detected, albeit at low levels, apically in the propagation zone close to the furrow (Ext.Fig.6b,c). In contrast to observed wave kinematics, general models of diffusion of secreted ligands predict a wave front that flattens away from the source. Building upon earlier work38,39, a model that couples Fog diffusion and saturable receptor binding to MyoII activation can produce a travelling wave of sharp MyoII activity (Ext.Fig.6d,e and Supplementary Information). This model predicts that increasing the rate of ligand production increases the speed of wave propagation (Ext.Fig.6e). To increase Fog expression in the primordium we used 2 extra copies of fog under the control of the hkb promoter40 (Ext.Fig.6f and Video 9). Earlier recruitment and higher levels of MyoII in the primordium (Ext.Fig.6g,i) were consistent with increased Fog levels. MyoII levels increased to a lesser extent also in the propagation zone (Ext.Fig.6h,i). Contrary to model predictions, activation of MyoII occurred at the same time at similar distances from the primordium as in controls (Ext.Fig.6h), such that the wave speed was unchanged (Ext.Fig.6j). This suggested that diffusion of Fog does not control MyoII propagation.
A wave of Fog signalling patterned by other mechanisms (e.g. ligand transport or GPCR regulation) might activate MyoII in the propagation region via GPCRs/Rho1 signalling. To test this, we overexpressed Fog uniformly in the embryo (Ext.Fig.7a,b,e and Video 10). Although MyoII levels in the dorsal epithelium were increased, the tissue-level pattern, with high MyoII at the embryo posterior and low MyoII more anteriorly, was preserved (Ext.Fig.7c). This was not due to endogenous fog since uniform Fog expression in fog−/− embryos yielded similar results (Ext.Fig.7f,g). Importantly, high MyoII levels propagated similarly to WT embryos (Ext.Fig.7a,d). Bypassing GPCR regulation also failed to prevent wave propagation. Uniform expression of the constitutively active Gα12/13 and Rho1 led to MyoII tissue-level polarity and propagation of high MyoII levels still occurred (Ext.Fig.7a–d and Video 10). Expression of Gα12/13[CA] led to propagation across more cell rows possibly because of the extensive tissue folding associated with this perturbation. Thus, patterned Fog signalling does not determine the dynamics of the MyoII wave. Fog may be required but MyoII activation is not governed solely by Fog-dependent Rho1 activation in the propagation zone.
Mechanical regulation of the Rho1/MyoII activation wave
Since MyoII can respond to mechanical stimuli25,27, mechanical stress (either acting directly on MyoII concentration/stabilization41 or indirectly through mechanosensitive signalling42,43) could be involved in propagating MyoII activation (Fig.3a). Indeed, before recruiting MyoII, cells in the propagation region are deformed anisotropically (Ext.Fig.1e,f and Ext.Fig.2a), and subjected to anisotropic stress (Ext.Fig.8a,b). To test whether MyoII-dependent tissue deformation is required to propagate Rho1 activation, we injected embryos before gastrulation with a Rok inhibitor (H-1152) and monitored Rho1-GTP. Following injection, Rho1 activation within the primordium was unaffected, but the propagation of Rho1 activation was strongly reduced and limited to ~4 cell rows (Fig.3b,c and Videos 11–12). Thus, MyoII activity in the primordium is required for normal wave propagation.
Figure 3. The MyoII wave is mechanically regulated and a feedback from MyoII promotes Rho1 activation in cells:
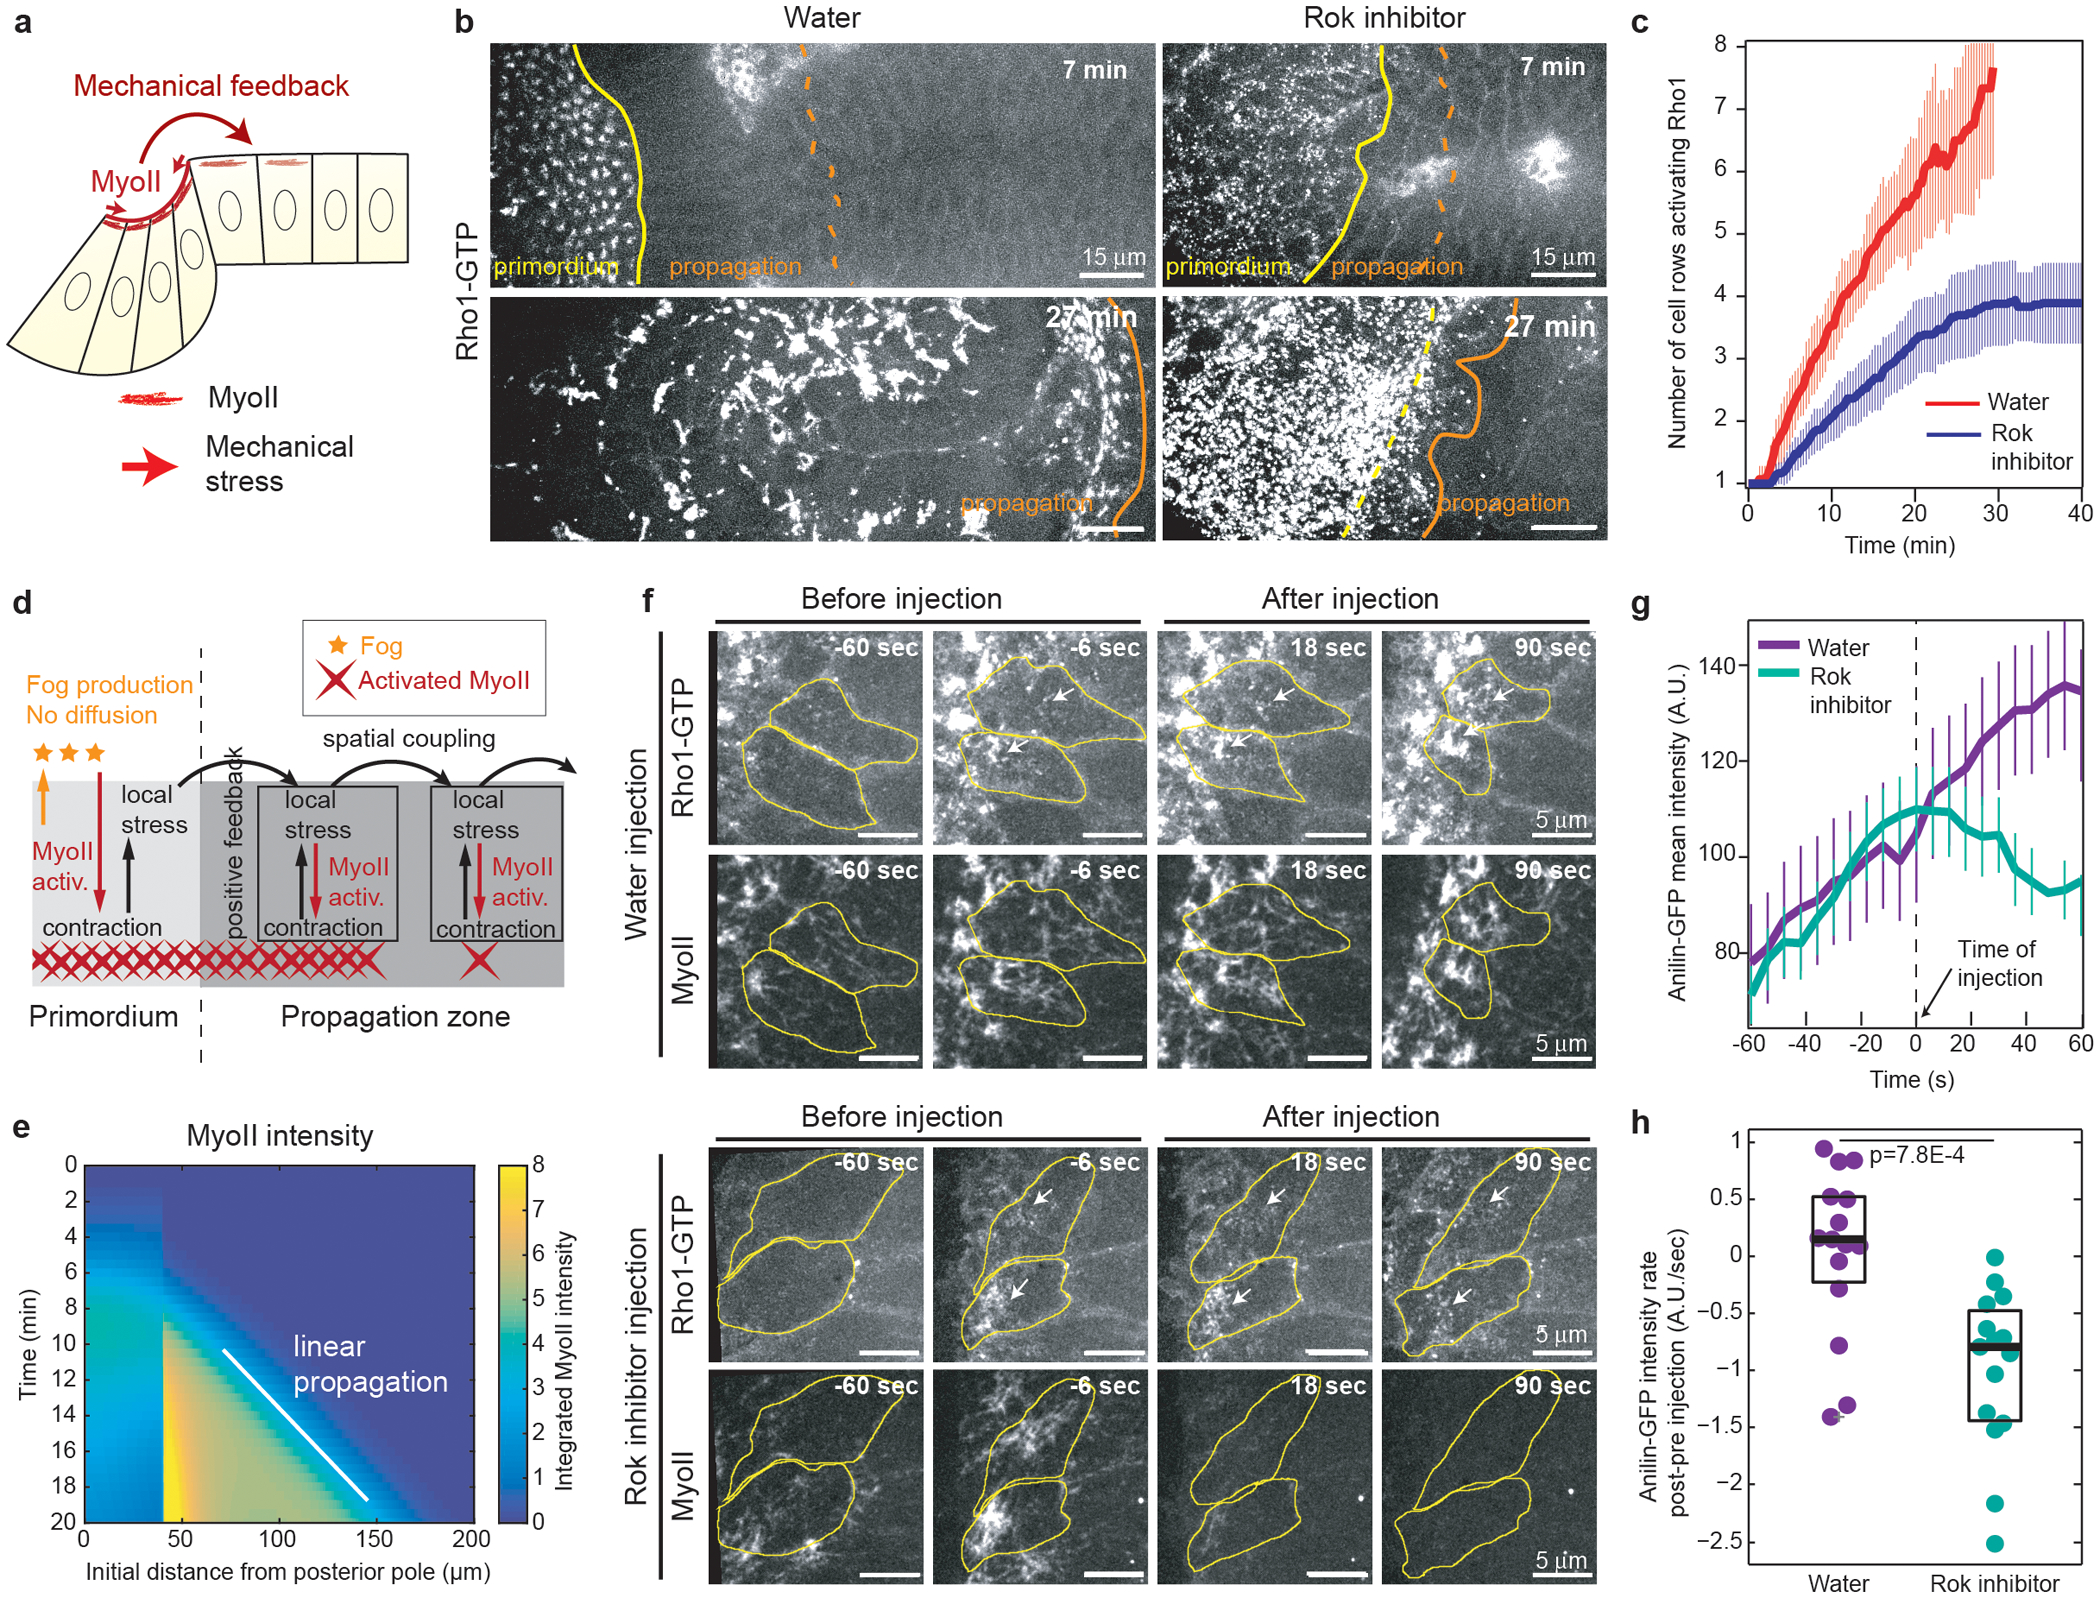
(a) Hypothesis of mechanical feedback controlling MyoII propagation. (b) Time-lapse of Rho1-GTP (Anillin(RBD)∷GFP) in water (N=10 embryos) and H-1152 (Rok inhibitor, N=12 embryos) injected embryos at end of cellularization. Yellow and orange lines highlight the primordium and propagation regions respectively. (c) Quantifications of the Rho1-GTP wave as in Fig.2e. Mean±SD. N=10 for water and N=12 for H-1152. (d) Model used to study the effects a stress-based feedback on MyoII (see Supplementary Information). Fog produced in the primordium activates MyoII but cannot diffuse. Instead, stress locally activates MyoII and propagates within the tissue. (e) Kymograph heat-map of activated MyoII (MyoII concentration integrated over the unit volume taking into account its local deformation, see Supplementary Information) from one simulation of the model in d. (f) Time lapse of Rho1-GTP (Anillin(RBD)∷GFP) and MyoII in water and H-1152 (Rok inhibitor) injected embryos during propagation. Yellow: cell contours, white arrows: accumulations of Rho1-GTP. N=15 cells, 3 embryos each. (g-h) Quantifications of the mean intensity of Rho1-GTP before and after injections. N=15 cells, 3 embryos each. (g) Mean intensity over time (Mean±SD). (h) Recruitment rate difference (post–pre injection) following Rok inhibitor injection. P=7.8E-4 from a two-sided Mann-Whitney test. Boxplots show the median, the 25th and the 75th percentiles. Grey crosses label outliers.
In c t0 is the beginning of MyoII propagation, in f and g time 0 is the time of injection.
Next, we mechanically perturbed the dorsal epithelium and looked at the effects on MyoII propagation (Ext.Fig.9a and Video 13). First, using laser-mediated tissue cauterizations29,44 we generated fixed mechanical fences ~20–30 cells anterior to the primordium. This introduced mechanical resistance to the anterior movement of the posterior endoderm. Second, we used dorsalized embryos, where DV polarity is abolished and MyoII-dependent apical constriction in the endoderm primordium is rotationally symmetric (Video 14), blocking anterior movement of the posterior endoderm. In both cases the MyoII activation wave slowed down (Ext.Fig.9b) and cells recruited higher levels of MyoII compared to WT (Ext.Fig.9c). The rate of cell apical constriction in the propagation region was significantly reduced despite higher MyoII levels (Ext.Fig.9d), suggesting a higher resistance to invagination. Similar perturbations by mechanical fences in the lateral ectoderm did not affect MyoII activation29 revealing a unique mechanical sensitivity of posterior endodermal cells. Altogether, these experiments revealed specific mechanical control over MyoII levels and wave speed in the propagation region.
MyoII-based positive feedback and spatial coupling are required for the activation wave
We hypothesized that wave propagation depends on a mechanical relay whereby cells ahead of the furrow activate MyoII in response to tensile or shear stress and in turn invaginate, thereby propagating global tissue deformation, stress and MyoII activation. We used a 1D model to abstract minimal ingredients required to generate a wave of MyoII activity at constant speed through coupling of mechanical force and chemical activation. We considered that local contractile stresses produced by MyoII are transmitted by stretching the apical cortex against a frictional resistance and that the transmitted stress activates more MyoII45 (Fig.3d and Supplementary Information). We modelled a direct dependence of MyoII activation on stress, while remaining agnostic about the underlying details or the exact nature (tensile or shear) of the stress. Simulations (Fig.3e) confirmed that two key elements are sufficient for propagation of MyoII activation at constant speed: 1) a strong non-linear positive feedback, in which MyoII locally generates stress and stress locally activates MyoII, giving rise to bistable dynamics; 2) a spatial coupling mechanism tuned by the mechanical properties of the system, in which deformation in one cell generates stress within finite distance, thereby triggering MyoII activation further away.
To test whether these two elements are involved in the activation wave, we injected the Rok inhibitor during propagation. This immediately blocked the propagation of Rho1 activation across the tissue (Ext.Fig.10a–c and Video 15) and the rapid increase of Rho1GTP in cells in the process of activation (Fig.3f–h, and Video 16), confirming the existence of a local positive feedback of contractility acting directly or indirectly on Rho1 activation. These results reveal the existence of both a cell-intrinsic (local amplification) and a cell-extrinsic (due to spatial coupling) feedback of contractility onto Rho1GTP.
A mechanically relayed cycle of 3D cell deformations underlies the MyoII wave
To investigate the mechanical basis for spatial coupling, we imaged embryos in sagittal cross-sections and identified a characteristic sequence of 3D cell deformations that accompanies the MyoII wave (Fig.4a and Video 17) As the advancing furrow approached more anterior cells, their basal ends narrowed and moved anterior and upward, while their apices spread onto the vitelline membrane (Fig.4a yellow cell in insets). Cells then constricted apically when they joined the furrow. MyoII activation was initiated in cells that had spread their apical surface onto the vitelline membrane and increased as cells detached (Ext.Fig.11a–c and Video 18). During apical cell spreading adherens junctions moved apically, first at the posterior, then at the anterior of each cell (Fig.4b and Video 19). As they reached the vitelline membrane, their anterior velocity slowed down significantly (Fig.4c and Ext.Fig.11d), suggesting that frictional coupling of cell apices to the vitelline membrane resists the anterior translation of the cell apex associated with pushing forces from the posterior. To assess the free space between the cells and the vitelline membrane we injected fluorescent Dextran in the perivitelline space. Strikingly, Dextran was excluded ahead of the furrow (Fig.4d, Ext.Fig.12a,b and Video 20), indicating pushing against the vitelline membrane.
Figure 4. 3D cycle of cell deformations accompanying and sustaining MyoII activation:
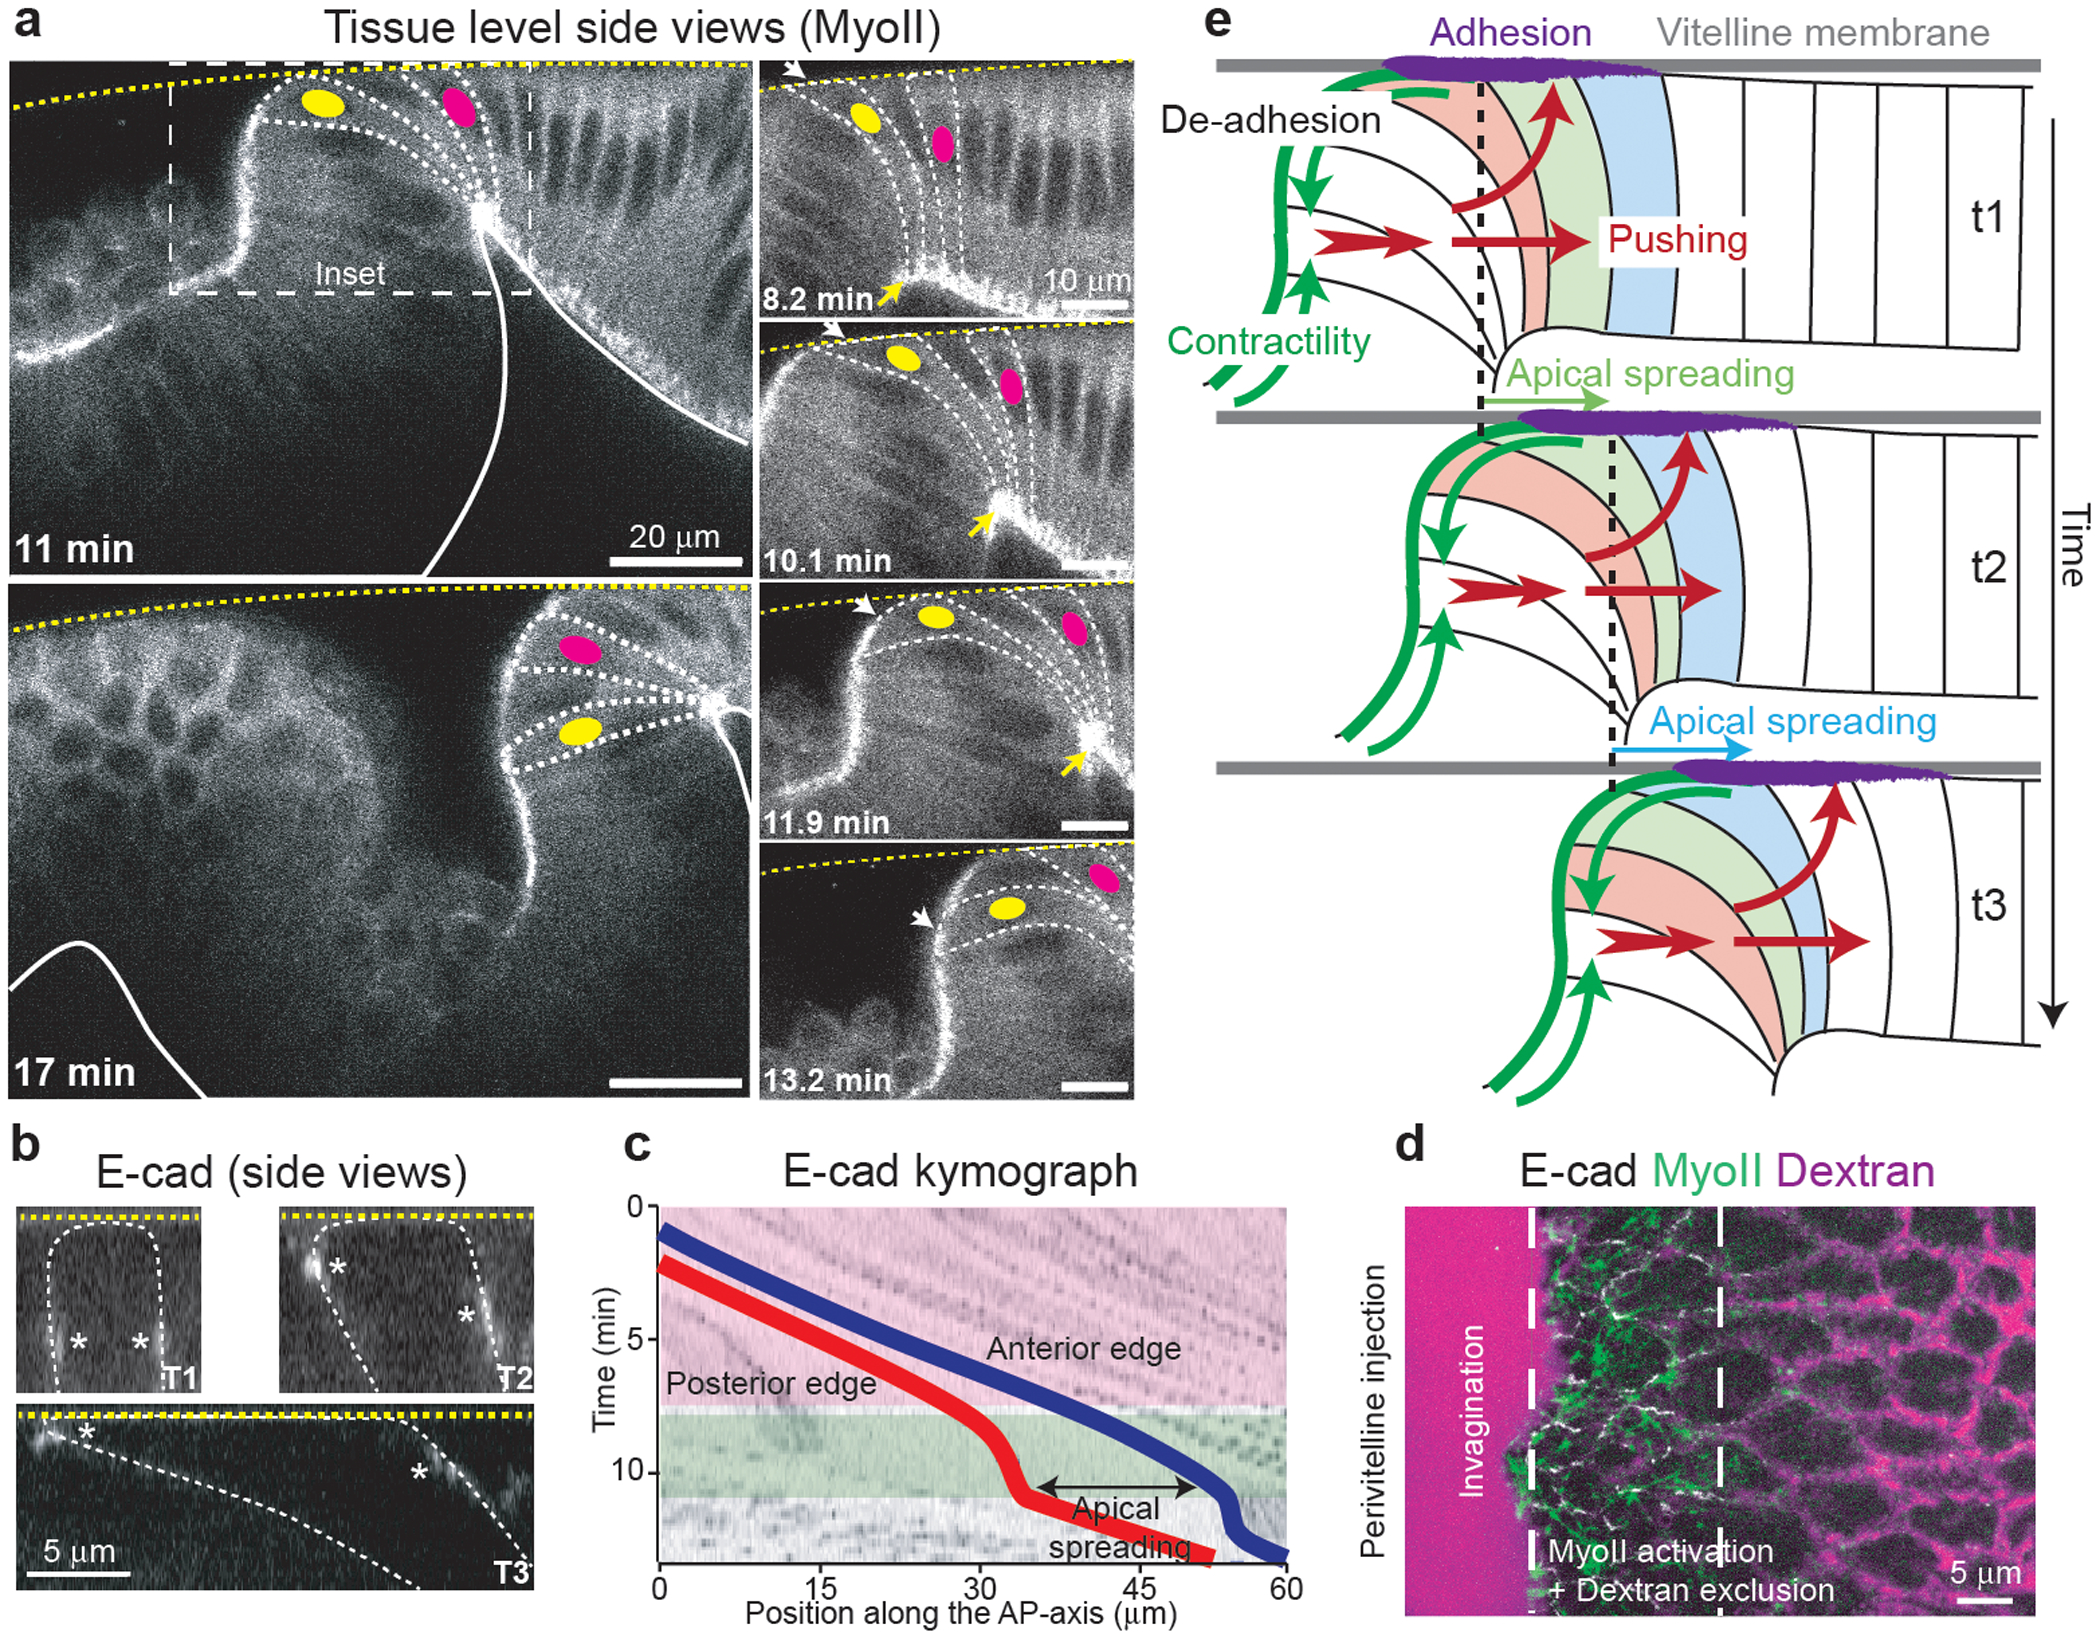
(a) Side views of MyoII recruitment and cell deformations during wave propagation. Left: larger views. Right: closeup of the boxed region. Dashed white lines: cell contours, dashed yellow line: vitelline membrane, solid white line: basal side of the epithelium. The yellow and magenta dots label 2 cells. White and yellow arrows: the apical and basal side of cells respectively. N=2 embryos. (b) Side views of E-cad during apical spreading of a cell in the propagation zone. Dashed yellow line: vitelline membrane. Dashed white line: cell outline. White asterisks: E-cad junctions. N=50 cells, 3 embryos. (c) Kymograph illustrating the movement and deformation along the AP-axis of a cell in the propagation zone. Red and blue traces: posterior and anterior edges of the cell respectively. Pink and green boxes: phases of rapid cell displacement and immobilization of the posterior edge respectively. N=456 cells, 6 embryos. (d) Dextran injection in the perivitelline space during MyoII propagation. Dashed white lines: region of MyoII activation and dextran exclusion. N=3 embryos. (e) 3D mechanical cycle associated to the MyoII wave. Green arrows: MyoII contractility, purple zone: zone of apical adhesion, red arrows: pushing forces. Three cells undergoing the cycle at consecutive time points are labelled in different colors.
In d t0 is arbitrary.
We propose a morphogenetic cycle as follows (Fig.4e). MyoII is activated in cells just anterior to the furrow, these cells in turn invaginate and MyoII contractility in the furrow generates tissue-scale contractile forces (green arrows). This results in pushing forces towards the anterior (red arrows) due to cytoplasm incompressibility46. Thus, the basal regions of neighboring anterior cells are displaced towards the anterior and compressed laterally, displacing their cytoplasm upwards. This, in turn, induces cells to spread their apical surfaces onto the vitelline membrane, eventually activating MyoII to complete the cycle.
Remarkably, we observed a tight correlation between the speeds of 3D cell deformation and MyoII activation waves observed in WT, dorsal mutants and cauterized embryos (Ext.Fig.12c–e), supporting a model in which MyoII both drives and is in turn induced by the cycle of cell deformation and attachment to the vitelline membrane. Thus, blocking MyoII activation should arrest all steps of this travelling cycle, as indeed observed when we inhibited Rok during MyoII propagation (Ext.Fig.12f and Video 21). Therefore, the deformation cycle requires sustained MyoII activity.
Wave propagation requires integrin dependent adhesion to the vitelline membrane
A key feature of this model is the local resistance against the vitelline membrane, leading to apical spreading in cells anterior to the furrow. Occasionally, cells resisted detachment from the vitelline membrane (Fig.5a and Video 22), suggesting that their apical surface specifically adhere to the vitelline membrane. Strikingly, αPS3 integrin (scab in Drosophila) is specifically expressed in the propagation region and is required for germband extension47,48 (Fig.5b). RNAi against scab resulted in a strong change in cell velocities in the propagation zone (Fig.5c–f and Video 23), consistent with a role of αPS3/Scab in cell adhesion to the vitelline membrane. In WT embryos cells anterior to the furrow moved anteriorly with constant slow velocities. In scab RNAi embryos cells first moved faster towards the anterior compared to WT and tissue invagination was delayed and shallow. Subsequently, once a deep invagination had formed, cells moved instead towards the posterior into the invagination. This suggests that in WT embryos cell adhesion to the vitelline membrane first facilitates tissue invagination by resisting pushing forces towards the anterior. Second, adhesion provides anchorage to the MyoII-dependent contractile forces promoting the sustained anterior displacement of the furrow.
Figure 5. Integrin-dependent adhesion underlies posterior endoderm movement and MyoII activation during wave propagation:
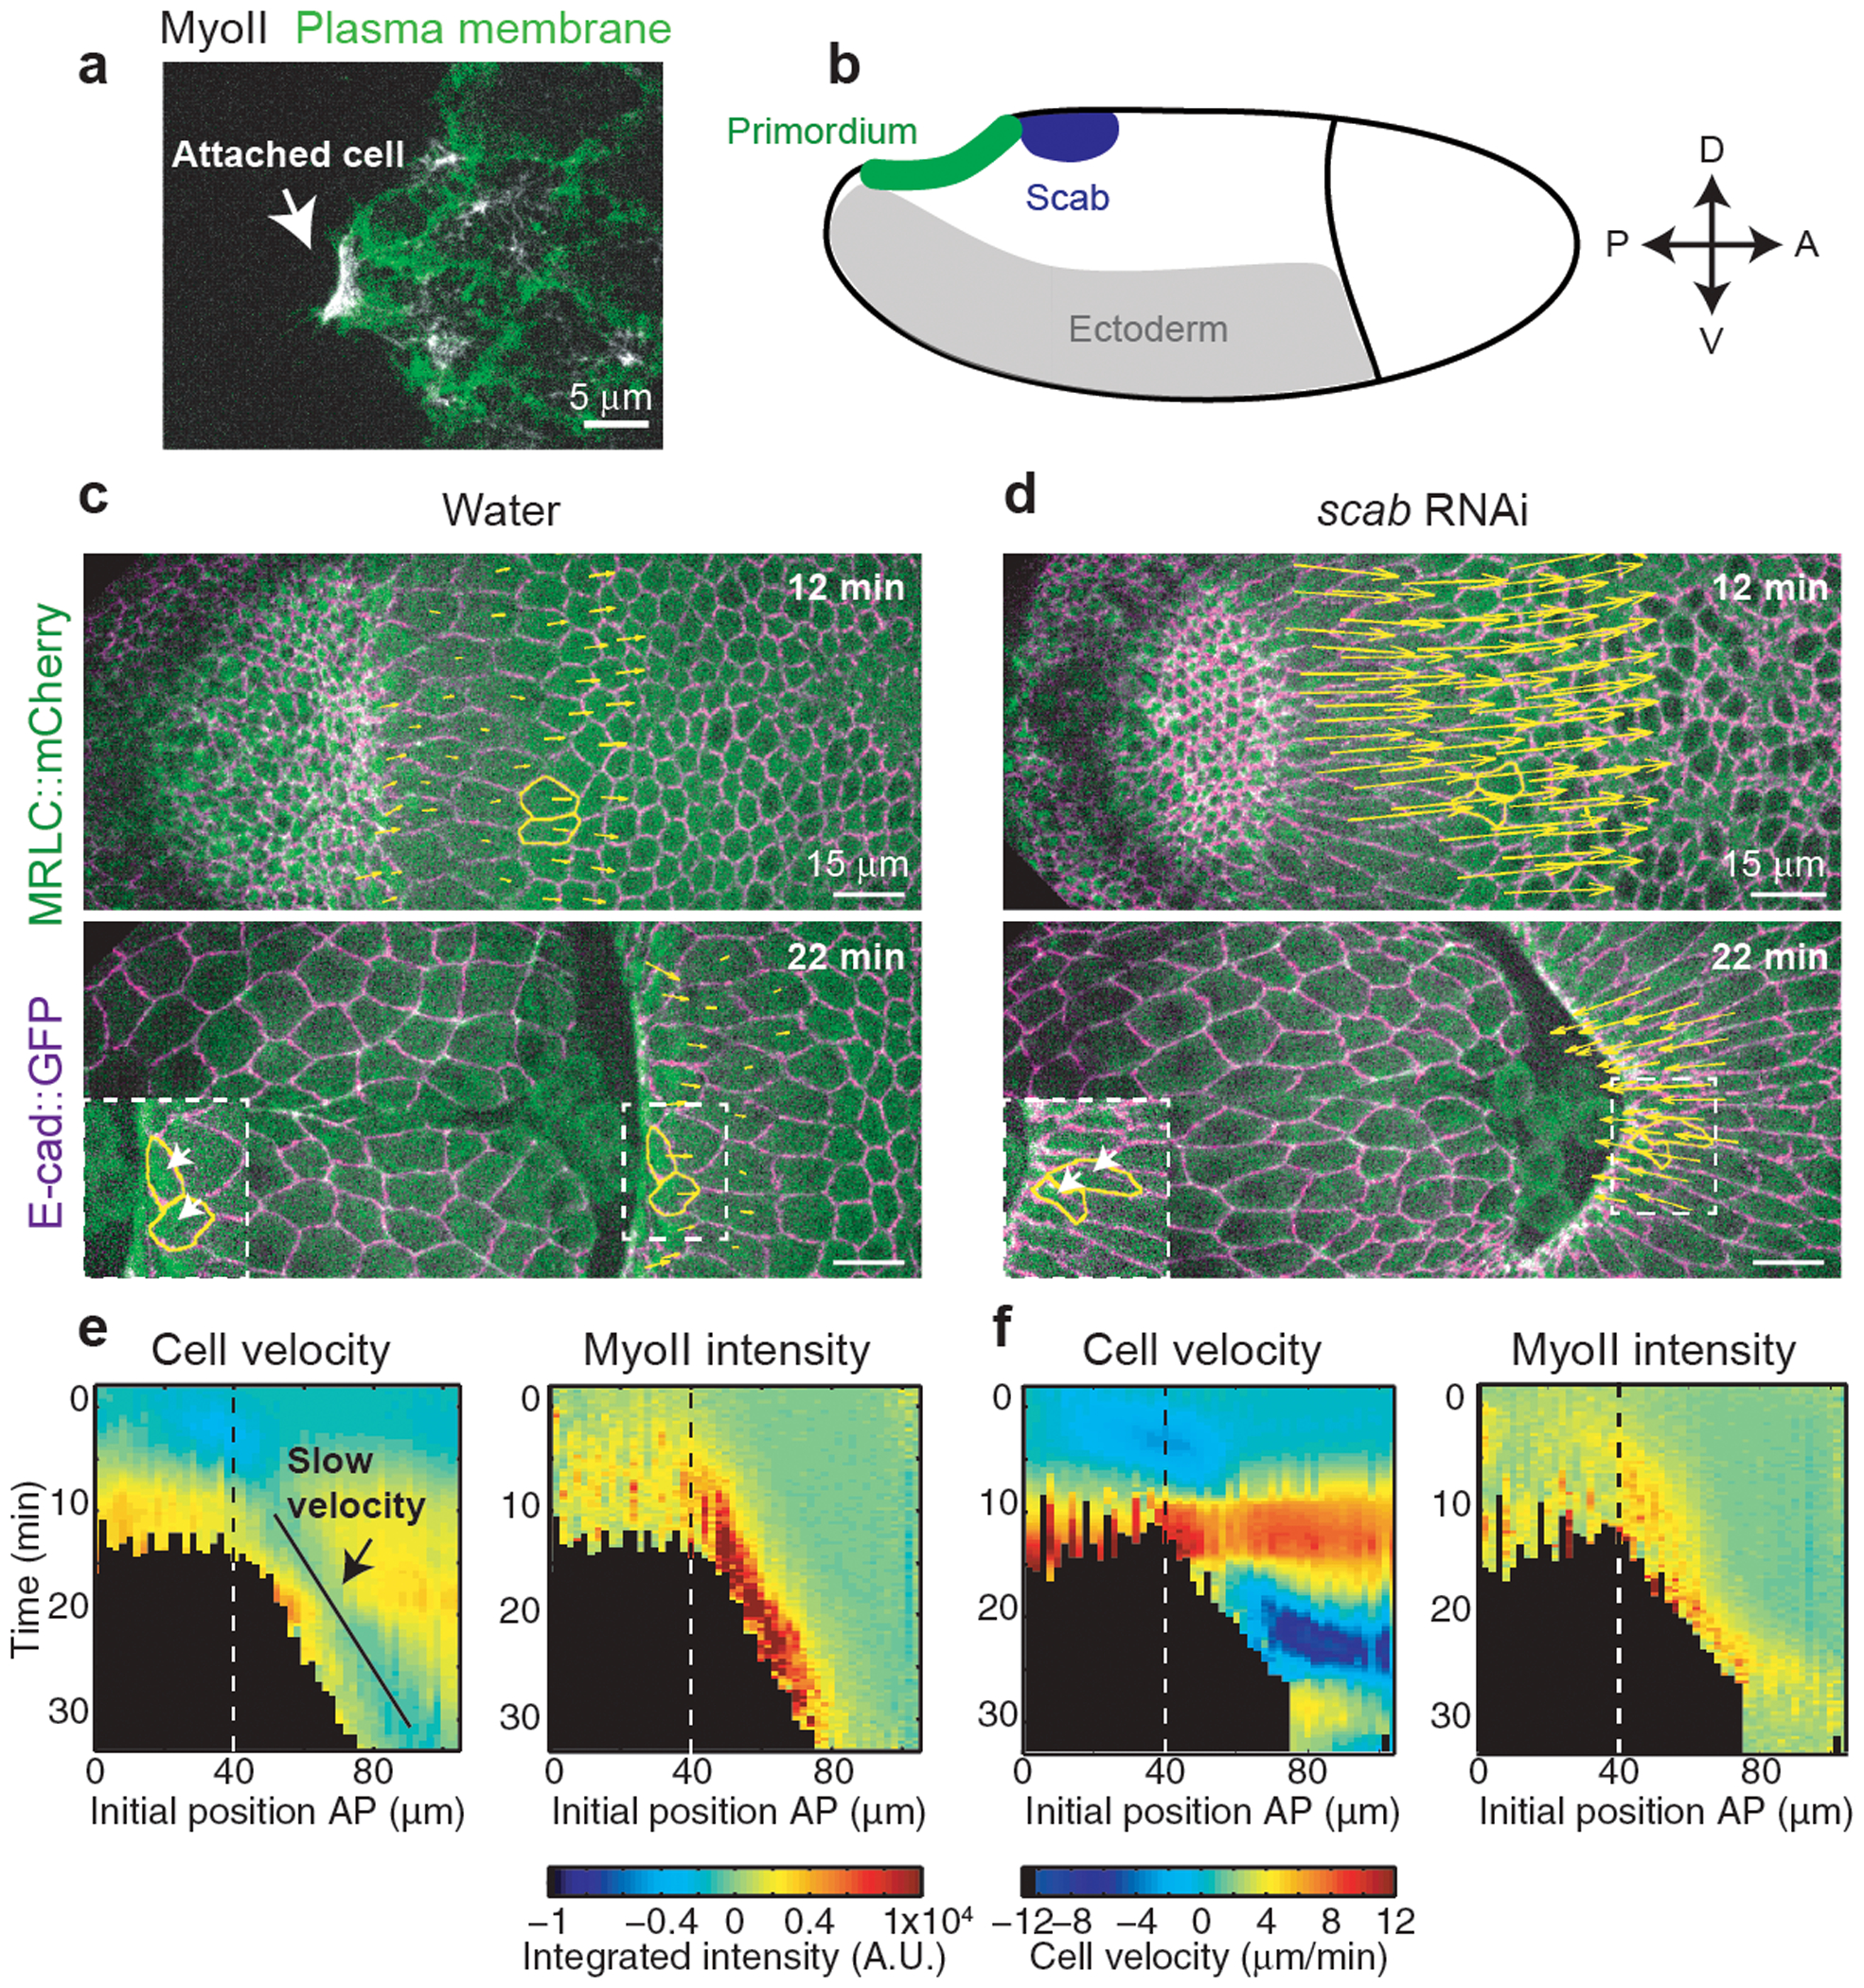
(a) Still of the apical side of cells during MyoII propagation. White arrow: cell attachment to the vitelline membrane. The plasma membrane is labelled with Gap43. N=4 embryos. (b) Schematic of scab expression in the embryo. (c-d) Time-lapse of a control (water injected) (c) and a scab RNAi embryo (d). The yellow arrows are proportional to the velocities of cells in the propagation region. Two representative cells are marked in yellow. N=4 embryos each. (e-f) Kymograph heat-maps of MyoII integrated intensity and cell velocities in control (e) and scab RNAi (f) injected embryos. Dashed line: boundary between primordium and propagation regions. N=622 cells from 4 water and 693 cells from 4 scab RNAi injected embryos.
Remarkably, scab RNAi also reduced MyoII levels in the propagation zone during wave progression (Fig.5c–f), showing a role for Integrin-based adhesion in MyoII activation in these cells.
In summary, local forces produced by MyoII drive an invagination that pushes cells towards the anterior, and their subsequent adhesion to the vitelline membrane generates forces that lead to more anterior activation of MyoII and cell invagination. This repeated cycle links MyoII contractility in the invaginating furrow to the anterior-wards movement of the endoderm (Fig.4e).
Discussion
We describe a tissue-level wave of MyoII activation and cell invagination underlying morphogenesis of the posterior endoderm during Drosophila germband extension. This morphogenetic wave is initiated by a spatially defined genetic input, a Fog signal transcribed within the endoderm primordium that activates Rho1/MyoII-dependent tissue invagination. The wave subsequently propagates via a mechanochemical relay where local invagination drives cell displacement, apical adhesion, stress-induced contraction and further invagination. Such activation of Rho1/MyoII provides feedback to amplify local contractility and spatial coupling to transmit it, leading to a traveling wave of contractility akin to trigger waves in excitable media49,50. Mechanical stress could activate MyoII in multiple ways: directly via stress-dependent MyoII motor stabilization within the actomyosin cortex41, indirectly via sensing of membrane tension51, and/or mechanosignalling42,43.
Integrin-mediated attachment to the vitelline membrane has recently been shown to impact on how tissue flows emerge from patterns of MyoII contractility48. We now uncover a role of Integrin adhesion in shaping MyoII dynamical patterns themselves. Integrins act both as adhesive molecules and as potential molecular effectors of the mechanical feedback mechanism during wave propagation. While in Tribolium adhesion forms a fixed anchorage point required for tissue flow48, in Drosophila adhesion is transient and propagates in a wave as the tissue furrow advances.
The paradigm that prevailed over many years indicates that genetic and biochemical patterns control cellular behaviours during morphogenesis2. Recently, it appeared that mechanochemical cues can also impact tissue dynamics4. Our observations highlight that spatial patterns and collective cell dynamics emerge through tight dynamic coupling of mechanical feedback and biochemical activity. Another example of this can be found in the zippering process in Ciona intestinalis52 whereby sequential MyoII contractions ahead of the zipper drive tissue deformations (new cell-cell contacts) that propagate signalling and contractility within a tissue. This opens the door to a deeper investigation of how mechano-chemical signalling not only induces cell shape changes but also gives rise to spatiotemporal patterns of deformation at both cell and tissue scales.
Materials and Methods
Fly strains and genetics
The following mutant alleles and insertions were used: tor4, dl1, fog4a6, ctaRC10, sqhAX3, pUAST-fog6 16, pUAST-ctaQ303L53, UAS-rho1V14 (Bloomington stock #8144), hkb-fog (chromosome 3 from40). MyoII RLC (MRLC) is encoded by the gene spaghetti-squash (sqh, Genebank ID: AY122159). Live cell imaging of Sqh was carried out using sqh-Sqh∷mCherry (on chromosome 2 from5 and a new insertions at the VK18 site, located 53B2 on chromosome 2 or the VK27 site located 89E11 on chromosome 3), and sqh-Sqh∷GFP transgenics (gift from R. Karess). E-Cad∷EGFP is a EGFP knock-in allele of E-Cadherin at the locus generated by homologous recombination (E-cad∷EGFPKin,54). F-Actin was visualized using a sqh-Utrophin∷EGFP insertion on chromosome 317. Live imaging of the Rho1 sensor and Rok were carried out using a ubi-Anilin(RBD)∷EGFP10 and a sqh-RokKD∷GFP9(gift from Jennifer Zallen) transgenes. Plasma membrane was visualized using a UASp-Gap43∷mCherry insertion (chr 3). fog gene expression was visualized with an fog-MS2 pACMAN BAC inserted at the ATTp2 site, located 68A4 on chromosome 3 and the MCP-NoNLS∷EGFP from35. MCP-NoNLS∷EGFP was provided maternally from females ;sqh-Sqh∷mCherry;MCP-NoNLS∷EGFP, (insertion at VK18 site on chr 2) or yw;Histone-RFP;MCP-NoNLS∷EGFP (Bloomington stock #60340) crossed with males carrying the fog-MS2 BAC and F1 eggs were analyzed. nos-Gal4 and 67-Gal4 (mat α4-GAL-VP16) are ubiquitous, maternally supplied.
For homogeneous expression of Fog, Cta[CA] and Rho1[CA] heterozygotes mothers ;67-Gal4,E-cad∷EGFPKin,sqh-Sqh∷Cherry;/+ were crossed with males carrying the pUAST-fog6, or pUAST-ctaQ303L or UAS-rho1V14 transgene and F1 eggs were analyzed. The presence of the UAS-transgene was estimated on the basis of the phenotype. F1 progeny of males Y/FM7 twi-Gal4, UAS-GFP;;UAS-fog6/+ crossed with female fog4a/FM7 twi-Gal4 UAS-GFP;67-Gal4, E-cad∷GFPKIn, sqh–Sqh∷mCherry/+ was analyzed in Ext.Fig.7f–g. Mutant embryos were identified based on the absence of ubiquitous EGFP expression after imaging.
All fly constructs and genetics are listed in Supplementary Table 1.
Constructs and transgenesis
Fog-MS2 construction: the fog gene was modified in its 3’-UTR region (283 bp downstream the stop codon) by inserting 16 MS2 repeats (gift from Thomas Gregor35). A pACMAN BAC clone (CH321-09M06) which encompasses the 30kb of the fog gene along with 47kb upstream and 28kb downstream regions was modified by recombineering55. The recombined BAC was inserted in the genome at the attp40 landing sites (Chr2, 25C6), using PhiC31 mediated site-specific insertion transgenesis (BestGene, Inc.).
RNA interference and drug injections
The dsRNA probe directed against fog was the one used in56. The dsRNA probe against fog (CG9559), is 861bp long and it is located in the coding region, targeting nucleotides 1546–2406 of fog (Genebank ID: NM_078714).
The dsRNA probe against scab (CG8095), is 450bp long, and it is located in the coding region, targeting nucleotides 2652–3101 of scab (Genebank ID: BT021944). dsRNA probes were prepared and injected at a final concentration of 5 μM in embryos less than 1 h old as previously described29,56. The sequences of the primers used generate the dsRNA probes against fog and scab are listed in Supplementary Table 2.
α-Amanitin (from Sigma-Aldrich) was injected at a concentration of 500 mg/ml in embryos at the end of cellularization around 5 min prior imaging. The Rok inhibitor H-1152 (Enzo Lifesciences) was injected at a concentration of 40 mM in embryos either at the end of cellularization around 5 min before imaging or at stage 7 during imaging using an InjectMan4 micromanipulator and a FemtoJet 4i microinjector from Eppendorf directly installed on the imaging microscope.
Dextran injections were performed in the perivitelline space using Dextran 647 Alexa Fluor, 10000 MW, Anionic, Fixable from Thermo Fisher Scientific at a concentration of 1 mg/ml. Embryos were injected at stage 6 or 7 directly on the imaging microscope and imaged after few minutes (~2min) to allow diffusion of Dextran in the perivitelline space.
All injections were performed at 50–80% embryo length from the posterior and on the lateral side in all experiments in this paper.
Live Imaging
For live imaging embryos were prepared as described earlier57 and imaged at stage 6 or 7 in the dorsal and posterior region for 10 to 60 min at room temperature (22°C) depending on the experiment. Most time-lapse imaging was performed with a dual camera spinning disc (CSU-X1, Yokogawa) Nikon Eclipse Ti inverted microscope (distributed by Roper) using a 20X/N.A. 0.75 water immersion, 40X/N.A. 1.25 water immersion or a 100X/N.A 1.4 oil-immersion objective depending on the experiment (20X or 40X magnification for tissue-level resolution and 100X magnification to obtain cellular level resolution). Dual color imaging of EGFP and mCherry FPs was performed by simultaneously exciting the fluorophores with a 491 nm and a 561 nm laser, and using a dichroic mirror to collect emission signals on two cameras.
Live imaging of laser ablation and laser cauterization experiments was performed with an Eclipse TE 2000-E microscope equipped with a spinning disc Ultraview ERS (Perkin-Elmer) using a 40×/N.A. 1.25 water-immersion, or a 100×/N.A. 1.4 oil-immersion objective. Dual color imaging of EGFP and mCherry was performed sequentially using a single camera by rapidly switching the excitation lasers (491 nm and a 561 nm) and emission filters.
For live imaging with 40X magnification z-series of 33–40 planes (spacing 0.8 μm) spanning ~30μm from the cell apex were acquired with a frame rate of 20s or 30s per frame. For live imaging with 100X magnification, z-series of 2–12 planes spanning 1 to 6 μm were acquired with a frame rate of 1–15s/frame. For laser ablations a single plane was imaged at a frame rate 0.5s/frame. Laser powers were measured at every imaging session and kept constant during the experiment.
Two-photon imaging of mid-sagittal sections (Fig.4a) was performed with a Nikon confocal equipped with a Nikon 25X/N.A. 1.1 objective. A single section was acquired at a frame rate of 3s/frame.
Generation of tissue fences by laser cauterization, and laser ablations
Tissue fences were generated within the dorsal epithelium along the Medio-Lateral (ML) embryonic axis at ~30% Embryo Length (EL) from the posterior as previously described29. Briefly, tissue cauterization and stitching to the vitelline membrane was obtained by focusing a near-infrared (NIR, 1030nm) laser with a 60X/N.A. 1.2 water-immersion Plan Apo VC, Nikon objective on the apical side of the embryonic blastoderm (~1–2 μm above adherens junctions) with an average power of 150 mW at the back aperture of the objective. To generate fences the stage was moved at a constant speed of 15–17 μm/s.
Line ablations were performed on the dorsal epithelium of embryos at stage 7 as previously described29. 20 μm line ablations were generated by moving the laser beam along the AP or ML axis within a region proximal (5–30 μm from the furrow) or more distal (60–100 μm from the furrow) to the invaginating furrow.
Antibody staining
Embryos were fixed with 4% formaldehyde for 20 min, devitellinezed by shaking in Heptane/Methanol, and then stained according standard procedures58. Fog was detected with a Rabbit antibody anti-Fog (1:1000; gifted by Naoyuki Fuse59), Neurotactin with a mouse monoclonal antibody (1:100; BP-106 supernatant from DSHB), Tll with an anti-Tll polyclonal guinea pig antibody (1:250;60, gifted by Cedric Maurange) and a chicken anti-GFP antibody was used to detect Sqh∷EGFP (1:1000, AVES-GFP 120). The anti-Tll antibody was pre-adsorbed by incubation ON at 4°C with fixed embryos less than 1h old. Secondary antibodies were a Donkey anti-Guinea Pig AlexaFluor 488 IgG (CatN 706 545 148), a Donkey anti-Chicken AlexaFluor 488 IgY (CatN 703 545 155) and a Donkey anti-Mouse AlexaFluor 647 IgG (CatN 715 605 151) from Jackson ImmunoResearch and a Goat anti-Rabbit AlexaFluor 555 IgG (Superclonal, CatN A27039) from Life Technologies. All secondary antibodies were used 1:500. Stained embryos were mounted in Aqua-Polymount (Polysciences) and imaged with a Zeiss 510 confocal microscope using a C-Apochromat 40X/NA 1.2 or a 60X/NA 1.4 objectives. Image stacks with spacing of 0.3–0.5 μm were collected and sum projections of 3–7 planes analyzed.
Image processing, segmentation and cell tracking
E-cad∷GFP was used to label outlines and the apical side of the cells. A custom ImageJ macro integrating the Stack Focuser plugin from M. Umorin was used to project (by maximum intensity projection) a limited number of z-planes around the apical plane of cells (focused maximum projections). This resulted in sharper cell outlines and better S/N ratio compared with maximal projections. Briefly the macro uses the Stack Focuser plugin with a kernel size of 30 pixels (~ 6 μm) to identify the apical plane locally in all regions of the image on the basis of the E-cad∷GFP signal. Then, only 4 planes for E-cad and 7 planes for MyoII around the identified apical plane are projected. The 2D projected stacks were then segmented and cells tracked as previously described29 using Ilastik (v1.2) and Tissue Analyzer61.
Data analysis
All measurements of fluorescence intensity and cell shape parameters were extracted using the Fiji software and further analyzed with Matlab (including Curve Fitting Toolbox, Image Processing Toolbox, Statistics and Machine Learning Toolbox). To plot data the Igor software or Matlab (extended with custom designed functions and the UnivarScatter from Manuel Lera Ramírez) were used.
Measurements of fluorescence intensity in individual cells
Fluorescence intensities were measured on focused maximum intensity projections (for 40X image stacks) or standard maximum intensity projections (for 100X image stacks).
For individual cells measurements mean and integrated intensities were measured within an ROI obtained by automated segmentation and tracking and then shrunken by 4 or 10 pixels for 40X or 100X images respectively to remove junctional signals. For all images background intensities were subtracted by masking out relevant structures and then subtracting residual intensities. To generate the masks images were first background subtracted using a “rolling ball” algorithm (with a radius of ~6 μm for 40X images and ~1.2 μm for 100X images) and then an intensity threshold was used. Residual background images were smoothened with a Gaussian blur filter with a radius of 0.6–1 μm before subtraction.
Time registration of individual cells relative to MyoII activation was performed using a threshold on MyoII mean intensity.
The rates of MyoII recruitment in Ext.Fig.2c were calculated with a linear fit of the MyoII integrated intensity time traces within a window of 3 minutes after MyoII activation.
To extract maximum or minimum values of the integrated intensity (Ext.Fig.6i, Ext.Fig.9c) and contraction rate (Ext.Fig.9d), the measurements of MyoII integrated intensity and projected area were smoothened over time with a rolling average using a window of 60s.
For quantifications of Rho-GTP in Fig.3g–h Ani(RBD)∷GFP mean intensity was measured manually in circular ROIs of diameter 3.6μm. The rate of Rho1 sensor recruitment was estimated by a linear fit of mean intensity measurements in an interval of 60s before and 60s after injection.
Measurements of fluorescence intensity in the tissue
For the scatter plots in Extended Fig.3b and 3d, we measured mean MyoII and mean ROK or Rho1-GTP sensor intensity in small regions of the tissue and plot one measurement against the other. To do so, 100X Videos of MyoII and ROK or Rho sensor where cropped respectively to 36×36μm2 (comprising approximatively 7 cells) or 25×25μm2 (10 cells) and registered using the Fiji plugin StackReg. Intensity was then averaged in bins of 3.6×3.6μm2 or 2.5×2.5μm2. Measurements of MyoII intensity vs ROK or Rho1-GTP sensor intensity where plotted for all bins and all time frames (spanning ~5min) and correlation coefficient was calculated. Binning did not affect the correlation.
For tissue level MyoII polarity measurements (Ext.Fig.7c), we used focused maximum intensity projections of embryos 10min after primordium activation. We subtracted background using a ‘rolling ball’ algorithm with radius 10μm and a threshold. We then measured mean MyoII intensity in rectangular ROIs in the active zone I(az) (which correspond to the propagation zone for WT and to the primordium for the other conditions) and the inactive zone intensity I(iz) (corresponding to the amniosierosa). The size of the ROIs spanned from ~10×30 μm2 to ~50×80 μm2 according to the visible area of the tissue (in WT the primordium has already invaginated at 10min). We defined polarity as (I(az)-I(iz))/I(az).
For the space-intensity plot (Ext.Fig.12b), we measured MyoII and Dextran mean intensity along ML axis and plot it as a function of the distance from the invaginating furrow along the AP axis. Mean intensity of MyoII is measured after background subtraction with a “rolling ball” algorithm (with radius 4μm). For both MyoII and Dextran, measurements are smoothed along the AP axis with a rolling average using a window of 2μm. The position of the furrow was determined using the position where the derivative of the MyoII measurement first exceed its half-maximum. For each embryo data are averaged across several time points spanning 7–10min.
Measurement of cell bending angle
In order to estimate measurement artifacts due to the fact that the surface of cells is not parallel to the viewing plane, we measured the average angle between the cell surface and the imaging plane (or bending angle θ) for all time points. For this, we devised two methods (both using Matlab):
Method 1: we reconstructed lateral views of the MyoII signal of tracked cells (see Ext.Fig.1g) and thresholded them with a mean filter followed by erode/dilate binary operations. On the binary images of the cell profile, we obtained the coordinates of the cell surface by finding the maximum height of the cell (h) for each pixel position x along the AP axis. We then perform a linear fit h=ax+b and use it to calculate θ = tan−1(a) (defined positive for cells bending towards posterior).
Method 2: we use the height information of the local apical plane in all regions of the image based of the E-cad∷GFP signal (see methods for stack projections). This “height map” directly provides the coordinates of the cell surface that we average along the medio-lateral axis for each cell and on which we perform a fit similarly to the previous method.
The first method provides a reliable measurement of θ for the few cells from which we reconstructed lateral views (24 cells), while the second can be extensively applied to our dataset but underestimate the large bending angles due to space averaging performed to reconstruct the “height maps”. However, the two methods give values correlated with a Pearson coefficient of 0.55 and measure the same average error within 3 min after activation. Method 1 was used to measure θ in Extended Figure 1h–i.
From θ, we correct the measurement of the cell surface using: true area=measured area/cos θ (see Ext.Fig.1h). We also estimate the relative error (i.e. the underestimation of the projected area compared to the real area) using error=100*(true area-measured area)/true area (see Ext.Fig.1i). Since the error is relatively small 2 minutes after activation (~20%), we decided to keep our projected area measurement as such. Note that we also measured the angle along the ML axis, but bending is very small along this axis (average max angle ~15° and error <3%).
Reconstruction of initial cell position for kymograph heat maps
In order to look at the propagation of cell shape and MyoII intensity parameters across the tissue, we elaborated kymograph heat maps to represent in a single graph space (position along the AP axis), time and value of any given parameter (area, integrated intensity, etc.). Measurements from cell tracking are used. Since at first approximation the phenomenon is symmetric along ML axis, we average data along this axis (Ext.Fig.1a and 1c). To remove the impact of cell movements (and estimate actual propagation from one cell to the next) we use initial coordinates for coordinates in the space axis (Registered kymograph Ext.Fig.1d). To do so, we bin individual cells in 2μm-wide bins according to their initial position along AP axis (their center position at time t0 as found from tracking). If a cell x is not present in the first frame and appears only on frame number tx, we infer its initial position by extrapolating from the initial positions of all other neighboring cells present at tx. For any bin the median of the given parameter across all cells of the bin is used for color-coding. This representation can be used on any parameter measured from cell: integrated intensity, area, velocity, etc and enables to monitor propagation within the tissue independently of tissue deformation.
Measurements of the wave speed
We measured the wave speed either automatically from tracked cells data, or, when segmentation and tracking were not performed, by manual counting.
Automatic measurement:
The speed of the wave can be measured either in the reference frame of the tissue (or initial frame of reference, i.e. at time t0) as defined for kymograph heat maps, or in the reference frame of the microscope. In Ext.Fig.9b, we compare the speed of the wave across the tissue (from one cell to the next) in conditions where tissue deformations are very different, hence we use the first method. In Ext.Fig.6j, we compare the speed of the wave set by extracellular diffusion in conditions where deformations are very similar, hence we use the second method.
To measure the speed of the MyoII activation wave in the reference frame of the tissue (initial frame of reference), we first binarize the kymograph heat maps of the mean intensity of MyoII, select manually the region corresponding to the propagation (spanning around 20 min corresponding to 10–30 min from the onset of endoderm morphogenesis) and then perform a linear fit of the positions of MyoII activation as a function of their time of activation. Activation is defined by mean MyoII intensity crossing a threshold. We proceed similarly for measuring the speed of the mechanical cycle using cell apical area and cell position along the apico-basal axis of the tissue (position in z), we use the reconstructed kymograph heat maps displaying cell apical area, or the position in z of the cadherin belt as a proxy for the cell surface (Ext.Fig.12c–e).
To measure the speed of the MyoII activation wave in the reference frame of the microscope, we perform a linear fit of the cell position at the time of MyoII activation as a function of time of activation. Here the positions are read directly from the microscopy images. Activation is defined by mean MyoII intensity crossing a threshold. Such a reference frame is used in Ext.Fig.6j where we are interested in diffusion of Fog in the perivitelline fluid.
Manual measurement:
To obtain the wave speed in the reference frame of the tissue (initial frame of reference), we manually recorded the time of MyoII activation in cells of the propagation zone belonging to 3–4 rows of cells aligned along AP-axis in each embryo. For each embryo we averaged over the different rows, and different embryos were averaged to obtain plots of the number of cells rows along the ML axis having activated MyoII as a function of time. Time 0 is defined as the time of activation of the first cell in the propagation zone. This measurement is used in Fig.2e, and using the Rho1-GTP sensor instead of MyoII, in Fig.3c. We also extract the number of cells having activated MyoII within 20 min from these measurements (Ext.Fig.7d).
Manual definition of the propagation zone:
In Fig.3b and Ext.Fig.7a, the approximate limit of the propagation zone is manually obtained by spotting the anteriormost cells with MyoII or Rho strong activation at late time points (~35 min after the onset of propagation) and playing the videos backwards to find where these cells where at initial time points. These lines are only a guide for display purpose.
Measurements of tension
The average tissue tension in Ext.Fig.8, proportional to the initial outward velocity after line cuts, was measured as previously described29 by particle image velocimetry (PIV).
Simulations of wave propagation by diffusion or mechanical feedback
Full details on the simulations can be found in the Supplementary Methods.
Embryo synchronization
Embryos synchronization was performed to compare different mutant conditions with WT embryos and to register embryos in developmental time before pooling and averaging. Synchronization is based on two developmentally-regulated events: 1) the disappearance of MyoII from the cellularization front at the basal side of cells and 2) the onset of cell divisions in the dorsal posterior ectoderm (see Ext.Fig.5b). Both events are independent of morphogenesis of the posterior endoderm. Time t0 is then defined as the onset of MyoII recruitment and apical constriction in WT embryos. This t0 is used in all figures unless otherwise stated.
For immunofluorescence experiments in fixed samples embryos staging was determined manually on the basis of similarity with events observed in time-lapse experiments.
Statistics
For all experiments data points from different cells/embryos from at least 2 independent experiments were pooled to estimate the mean, s.d. and s.e.m. values plotted. All of the P values are calculated using a two sided non-parametric Mann–Whitney test (Matlab statistic toolbox) except in Ext.Fig.7c where P values are calculated using a one-sample t-test (null hypothesis of a normal distribution with mean equal to zero, i.e no tissue-level polarity of MyoII, Matlab statistic toolbox). No statistical method was used to predetermine sample size. The experiments were not randomized, and the investigators were not blinded to allocation during experiments and outcome assessment.
Repeatability
All measurements were performed in 1–26 embryos. In experiments involving living embryos we consider each embryo as an independent experiment. In immunostainings, independent experiments correspond to distinct staining procedures. In this work an independent experiment indicates a biological replicate.
Extended Data
Extended Figure 1. Quantification of the morphogenetic wave within the dorsal posterior epithelium:
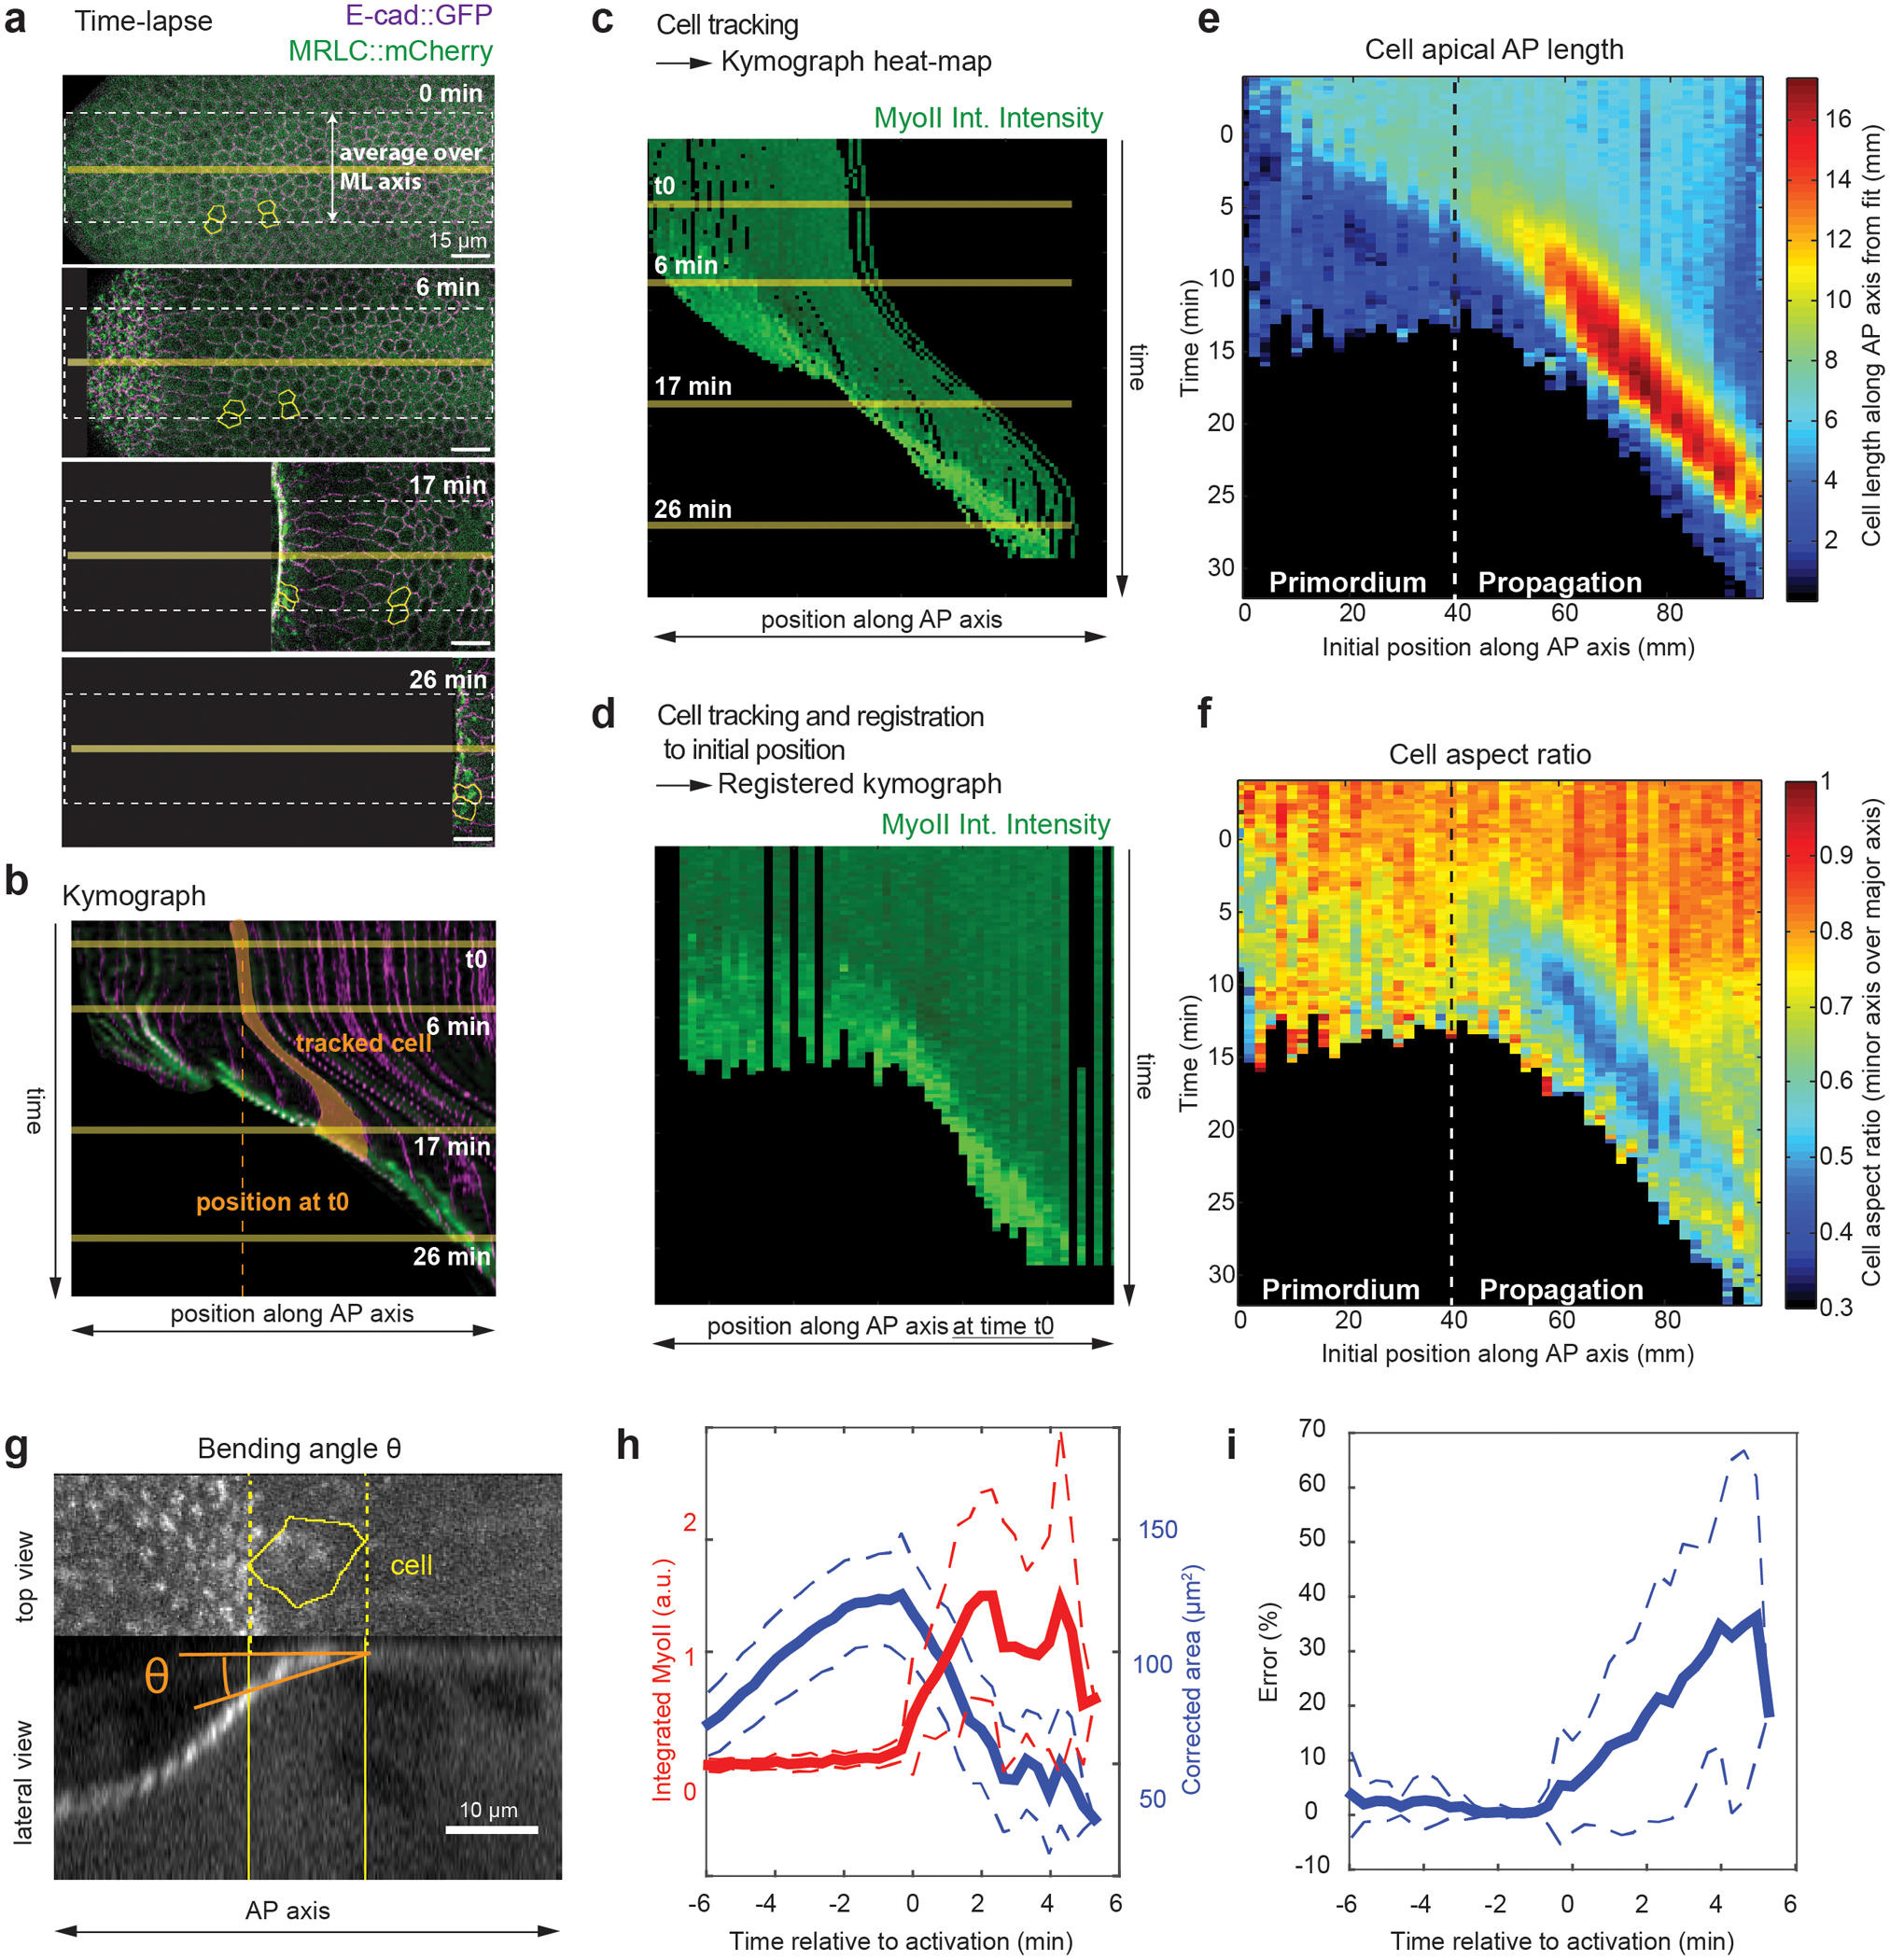
(a-d) Procedure to generate kymograph heat-maps from time-lapses of endoderm morphogenesis. In a stills of a dual color time-lapse, E-cad∷GFP is in magenta and MyoII is in green. (b) A kymograph generated along the yellow horizontal line in a. A single cell, highlighted in yellow, first moves towards the anterior and then increases its projected apical area before recruiting MyoII. Solid yellow lines: time of the stills in a, dashed vertical line: the position of the cell at time t0. (c) Kymograph heat-map of MyoII integrated intensity measured using cell tracking in a. Data are averaged along the ML axis within the white dashed line box in a and cell positions are the positions at time t. Note that cell tracks display movements similar to the kymograph in b. (d) Kymograph heat-map of MyoII integrated intensity registered on the cell positions at time t0 extracted from cell tracking in a. Data are averaged along the ML axis, as in c, but now each cell track is plotted according to its position along the AP axis at time t0. Cell tracks do not display any movement and appear as straight vertical lines. As a result tissue deformation is not considered and the movement of the wave across the tissue can be visualized. Time t0 is the onset of endoderm morphogenesis. (a-d) N=1 embryo for demonstration purposes. (e-f) Kymograph heat-maps of AP apical cell projected length (e) and cell aspect ratio (f). The primordium and propagation regions are indicated. N=947 cells from 5 embryos. (g) Representation of the bending angle θ in a lateral view from a tracked cell (yellow contour) (see Methods). (h) Average time traces of the corrected area (see Methods) and MyoII integrated intensity. Cells are registered on t0 the time of MyoII activation. The corrected area decreases when MyoII intensity increases indicating that cells are truly constricting. (i) Time trace of the relative error in the measurement of cell area (i.e. underestimation of the real cell area) due to the bending angle. (g-i) N=24 cells, 1 embryo, with θ measured automatically (Method 1, see Methods) on MyoII side views. Mean±SD are shown.
Extended Figure 2. MyoII activation in cells of the primordium and propagation regions occurs differently:
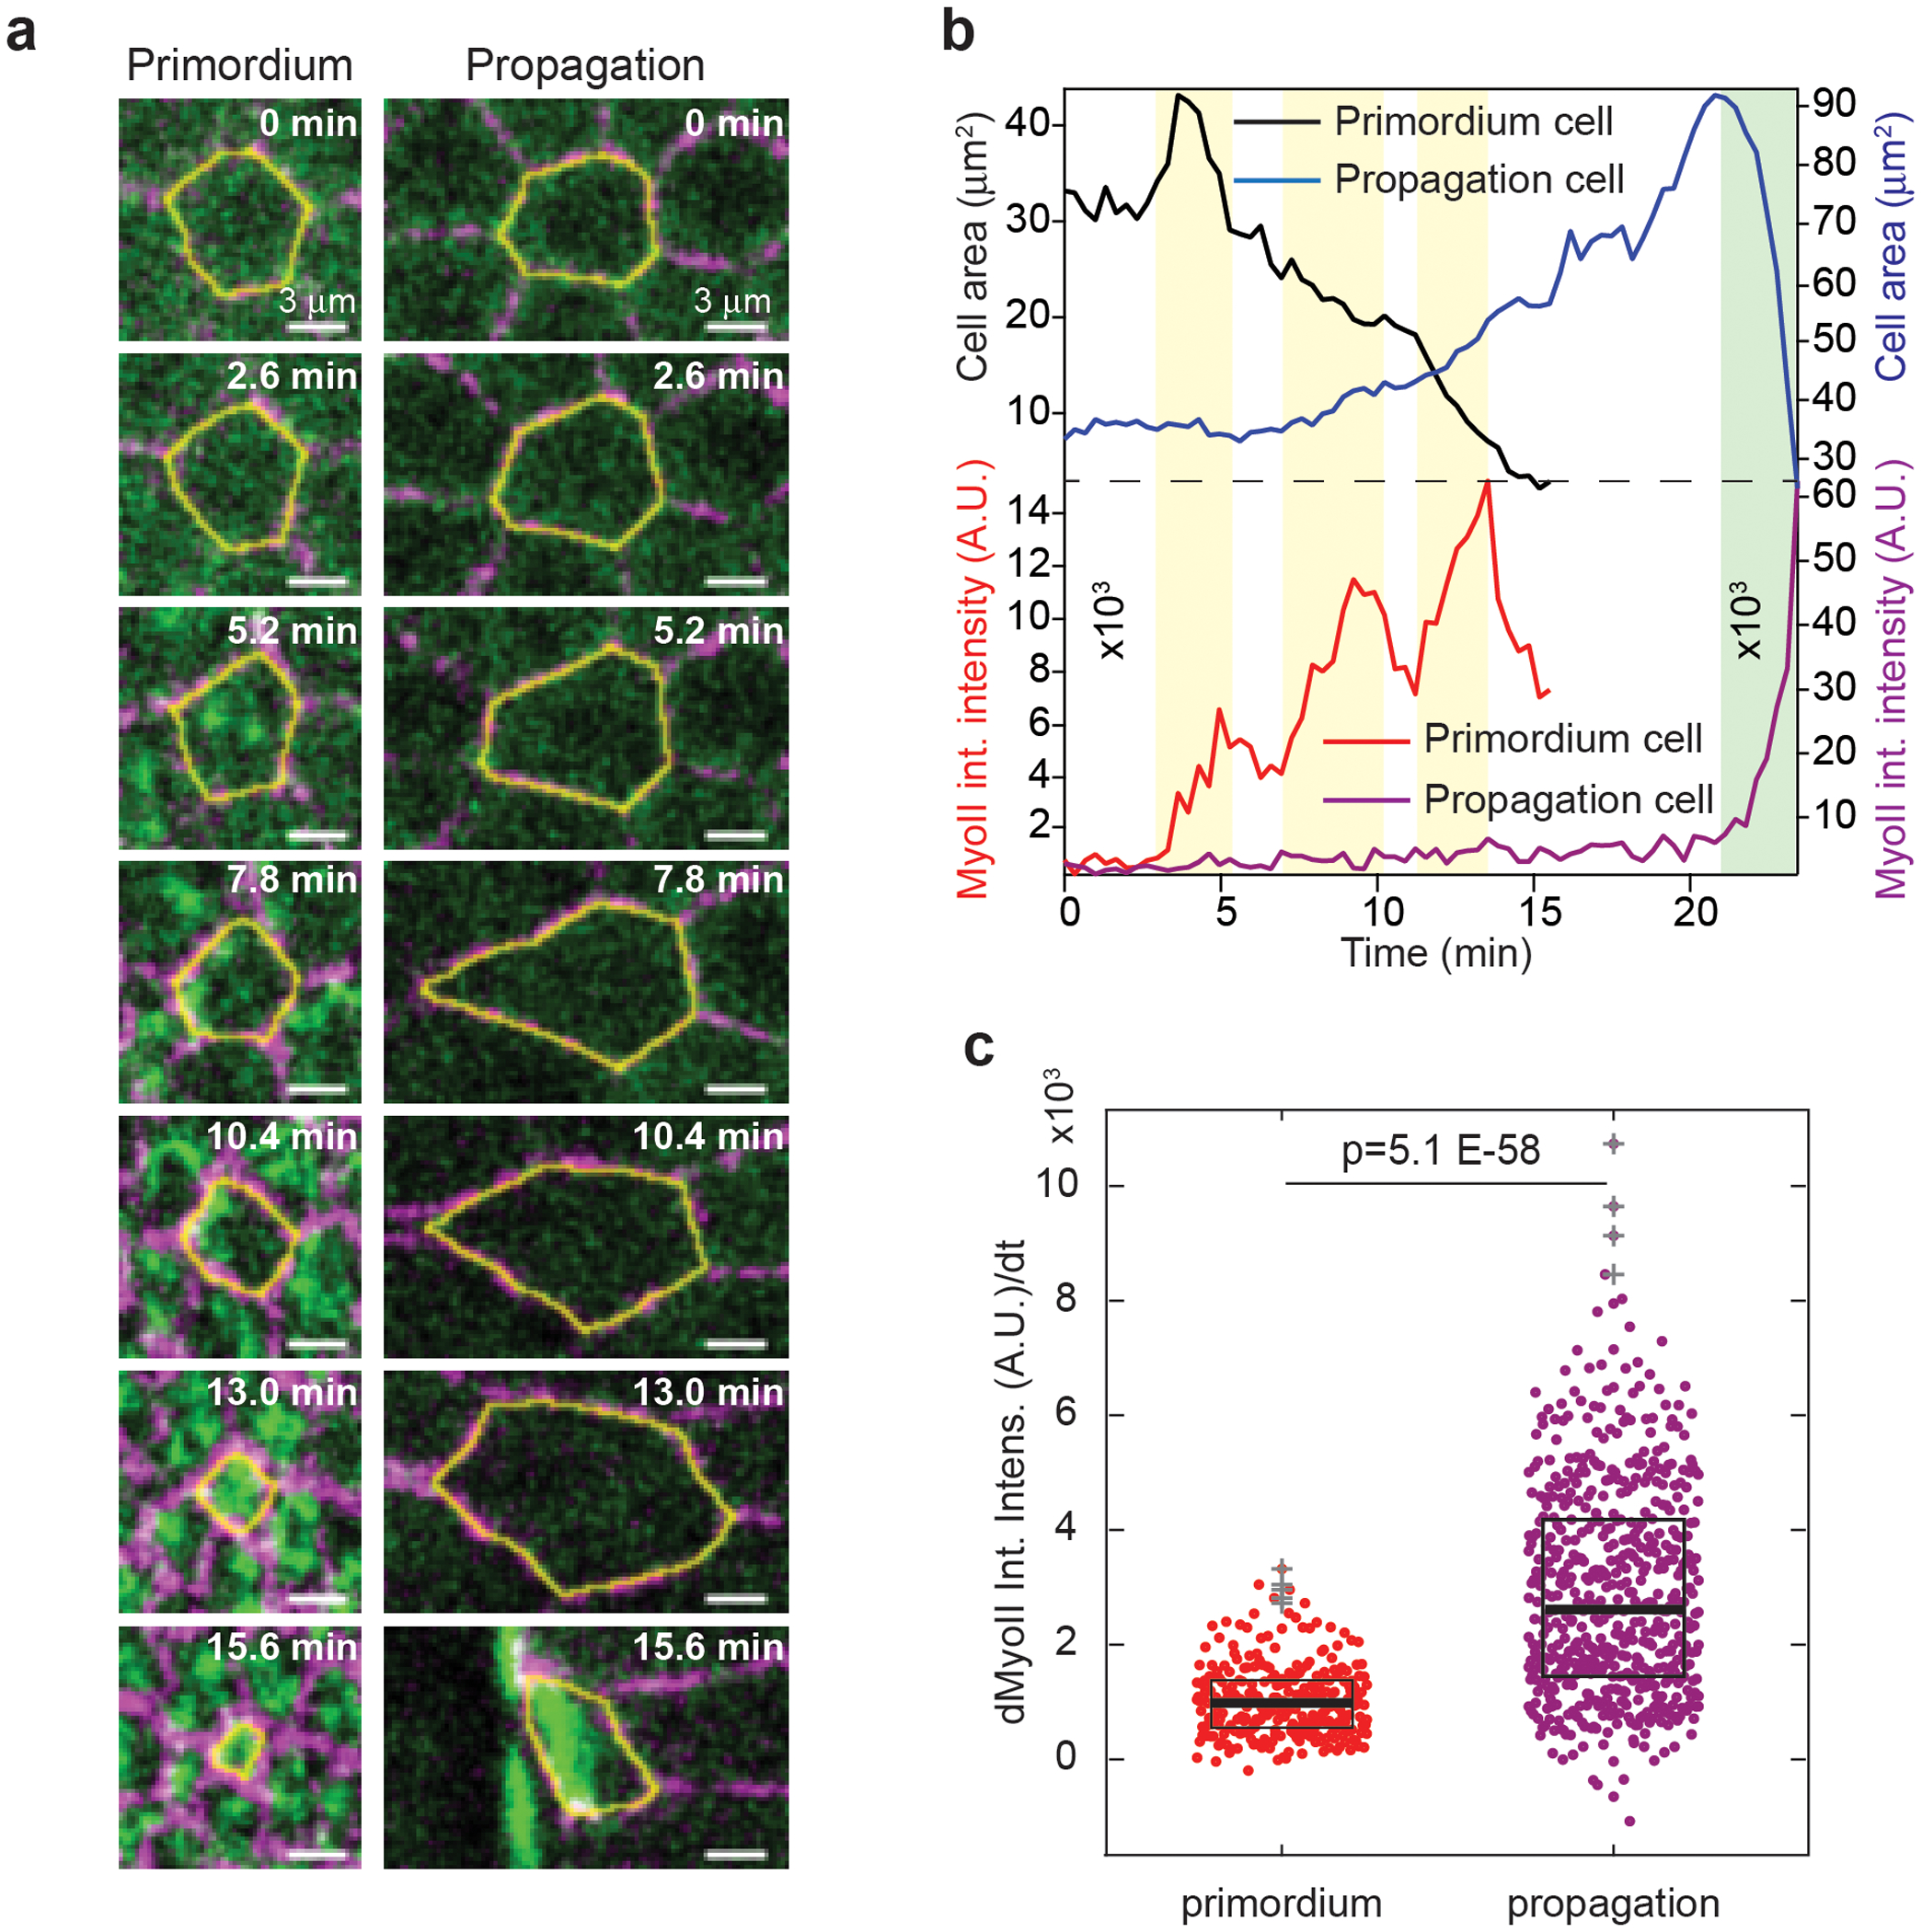
(a) Close ups of cells in the primordium and propagation regions. (b) Projected apical cell area and MyoII integrated intensity of the cells in a. Yellow and green boxes: steps of MyoII recruitment in the primordium cell and the cell in the propagation region respectively. (c) MyoII recruitment rate in cells of the indicated regions (N=288 cells for primordium and 456 cells for propagation region, 6 embryos). Boxplots show the median, the 25th and the 75th percentiles. The grey crosses label outliers. P=5.1E-58 from a two-sided Mann-Whitney test.
Extended Figure 3. Rho-GTP and Rok propagate together with MyoII during the wave:
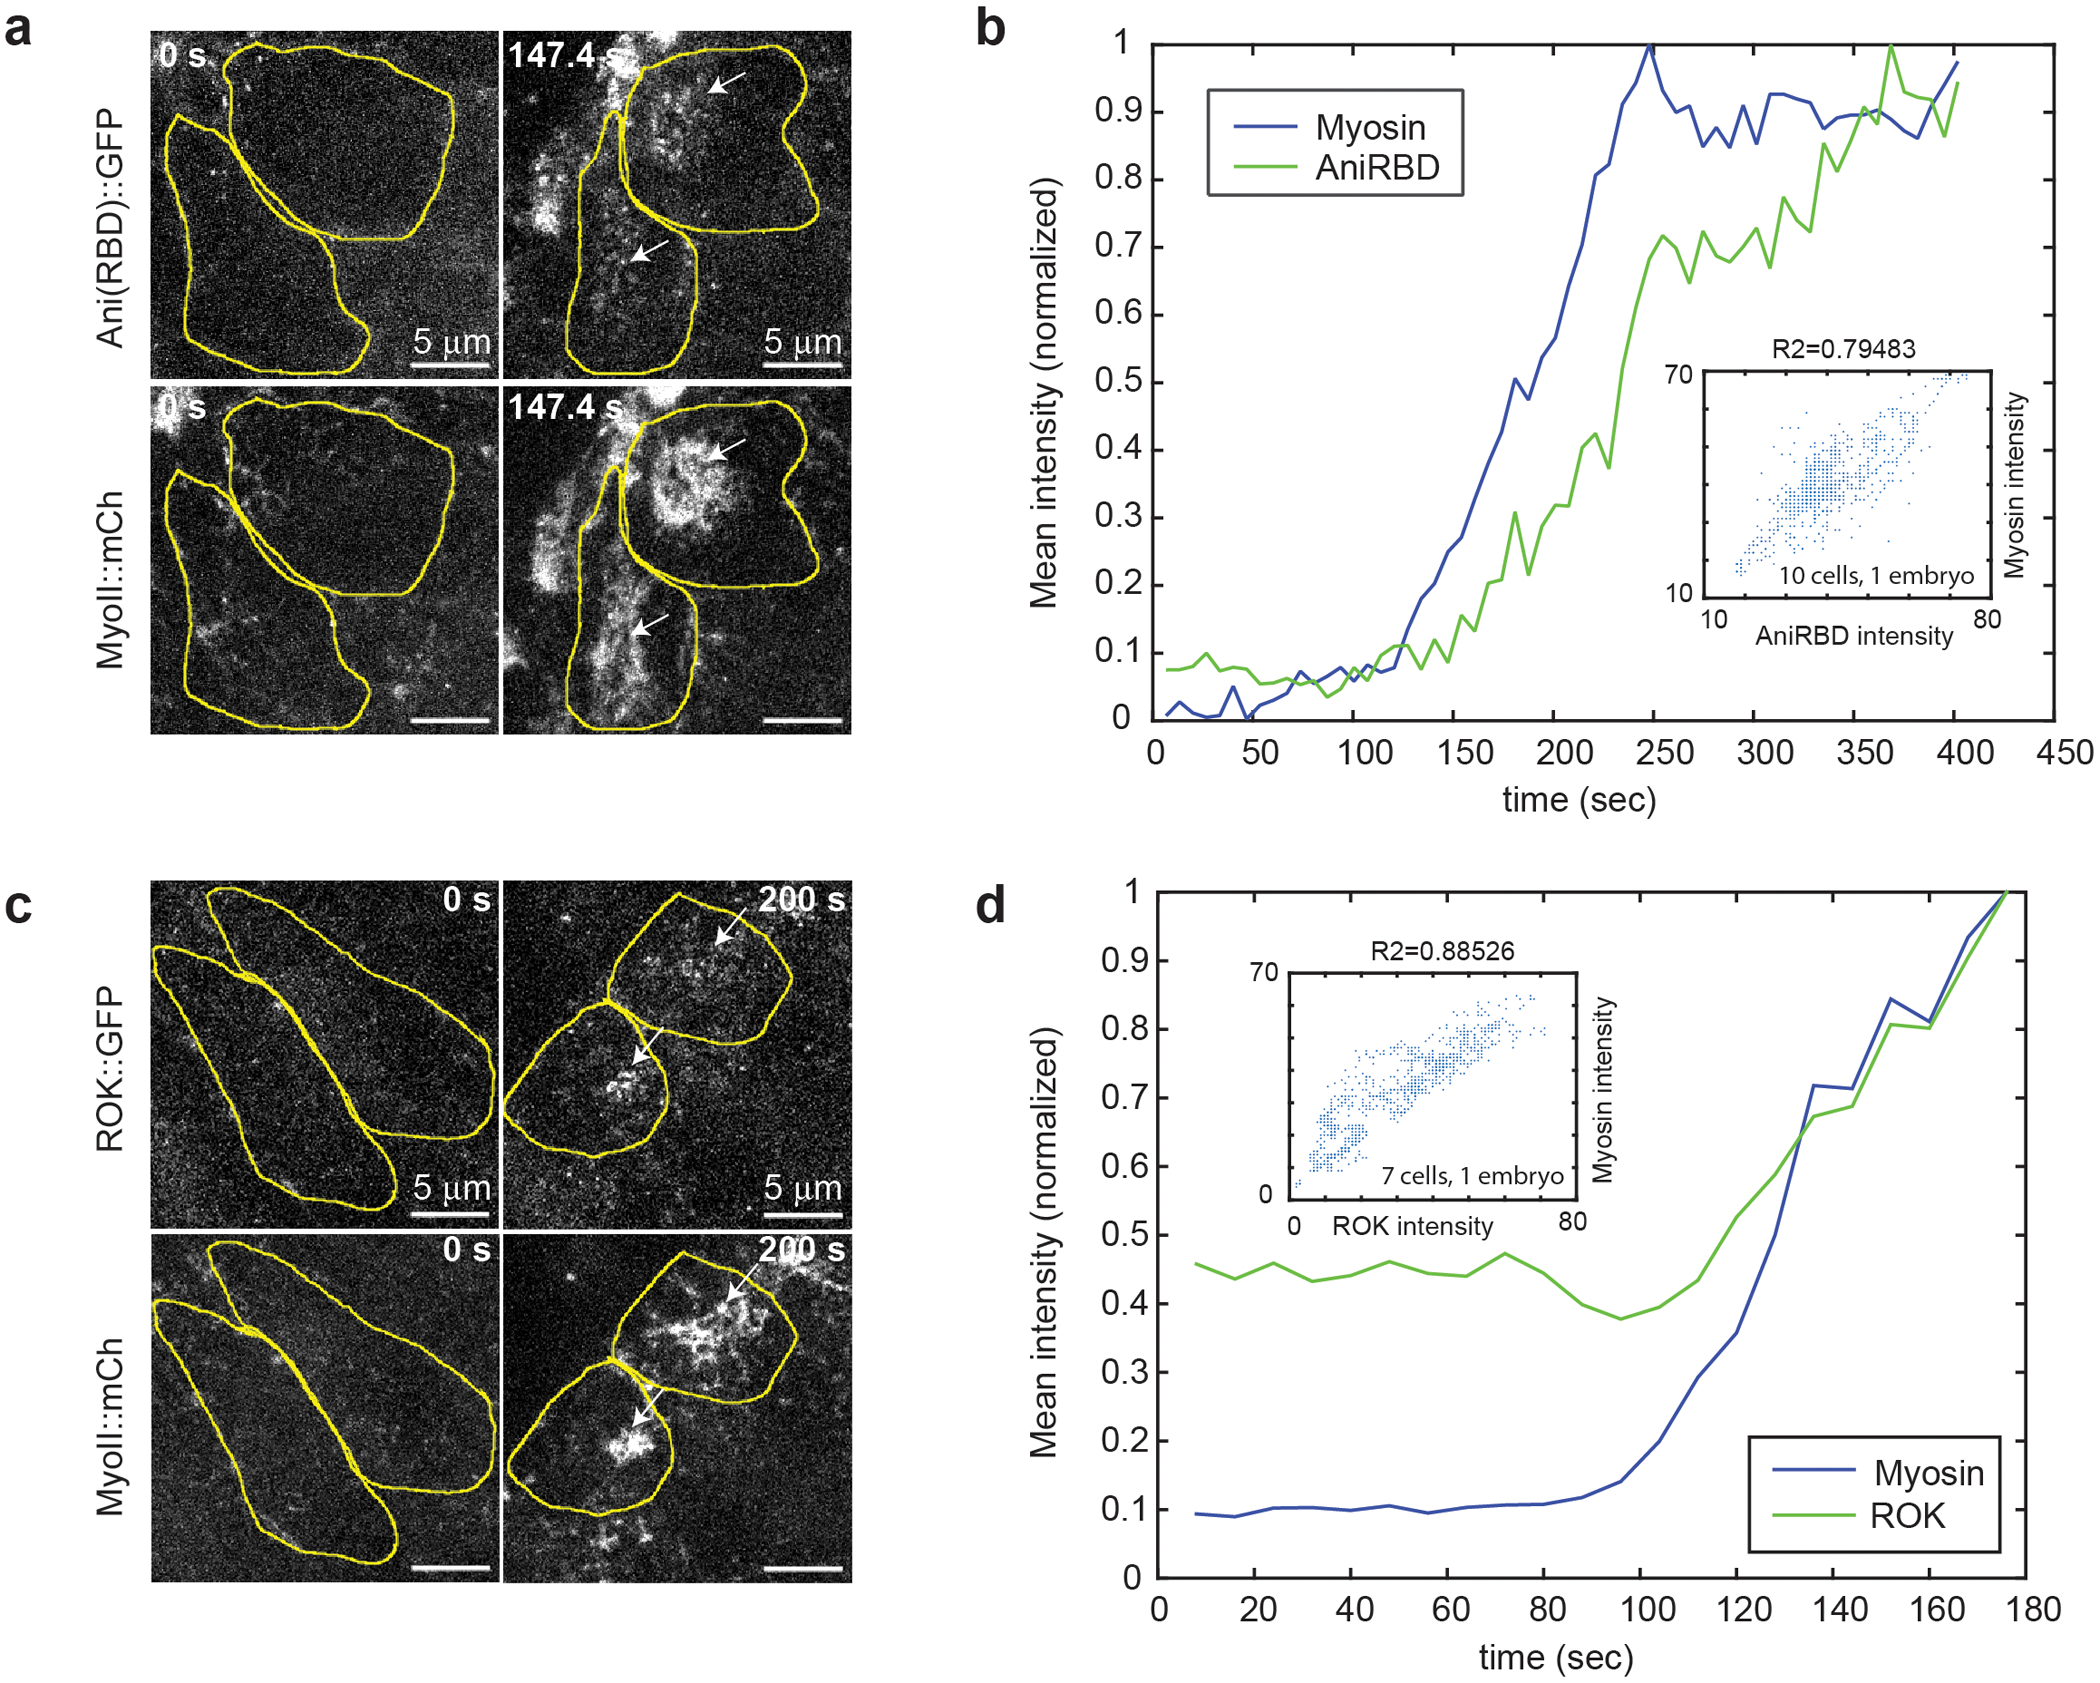
(a and c) High resolution stills of cells in the propagation region labeled with MyoII and with the Rho1-GTP sensor, Anillin(RBD)∷GFP (N=4 embryos) (a), and RokKD∷GFP (N=4 embryos) (c). Cell contours are in yellow. (b and d) Curves of Rho1 sensor (b) and Rok (d) mean intensity over time along with MyoII in one representative cell of the propagation region. Intensity values are normalized to the max of each curve for visualization purposes. In the insets, scatter plots of MyoII mean intensity vs Rho1 sensor mean intensity (b) or Rok mean intensity (d) from ~10 cells in the embryo shown in (a) and ~7 cells in the embryo shown in (c) (see Methods). In the insets in b and d R2 is the square of the Pearson correlation coefficient. In a-d t0 is artbitrary.
Extended Figure 4. Terminal patterning controls MyoII activation in the posterior endoderm:
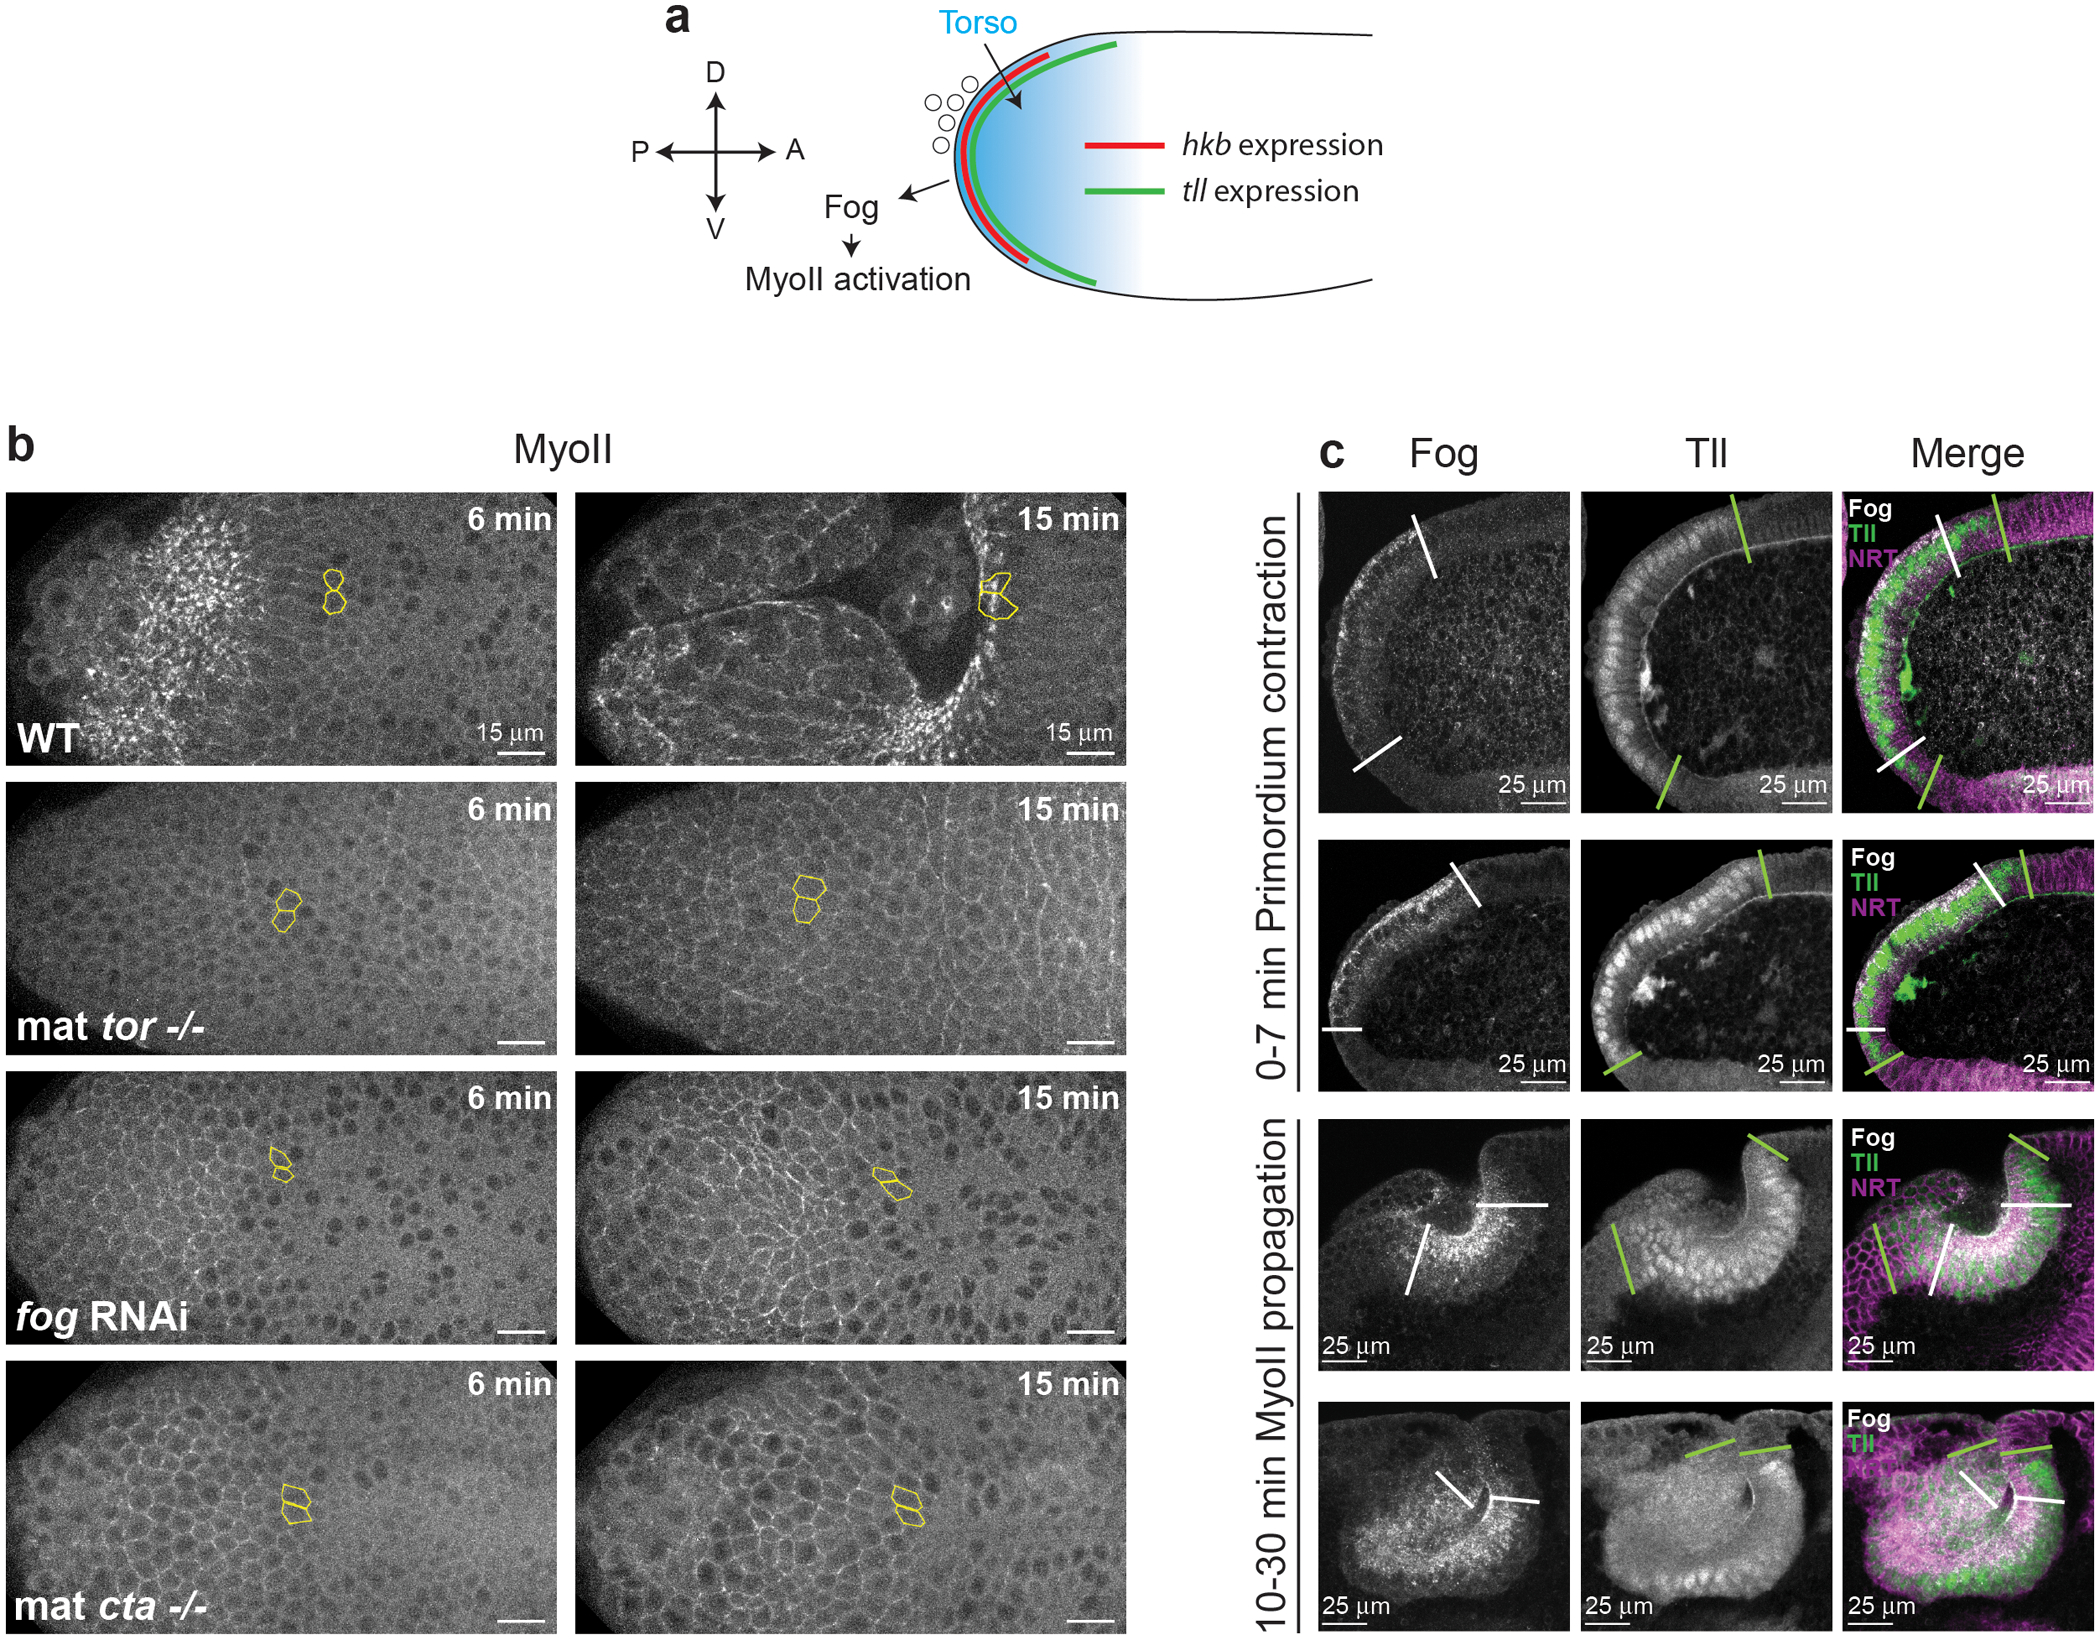
(a) Schematics of the terminal patterning-dependent pathway controlling MyoII activation in the posterior endoderm. (b) MyoII activation in the posterior endoderm in embryos mutant for torso (mat tor−/−), depleted of maternal and zygotic fog (fog RNAi) and mutant for the Gα12/13 concertina (mat cta−/−). Yellow contours mark cells in the propagation region. N=5 embryos for WT, 4 for mat tor−/−, 5 for fog RNAi and 5 for mat cta-/−. (c) Sagittal sections of embryos immunostained for Fog and Tll (together with the membrane marker Neurotactin in the merge) at different stages of posterior endoderm morphogenesis. The white and green lines indicate the boundaries of the expression domains of fog and tll respectively. N=8 embryos for primordium contraction stages and 5 embryos for MyoII propagation stages from 1 independent experiment in this configuration.
Extended Figure 5. MyoII propagation does not depend on gene transcription:
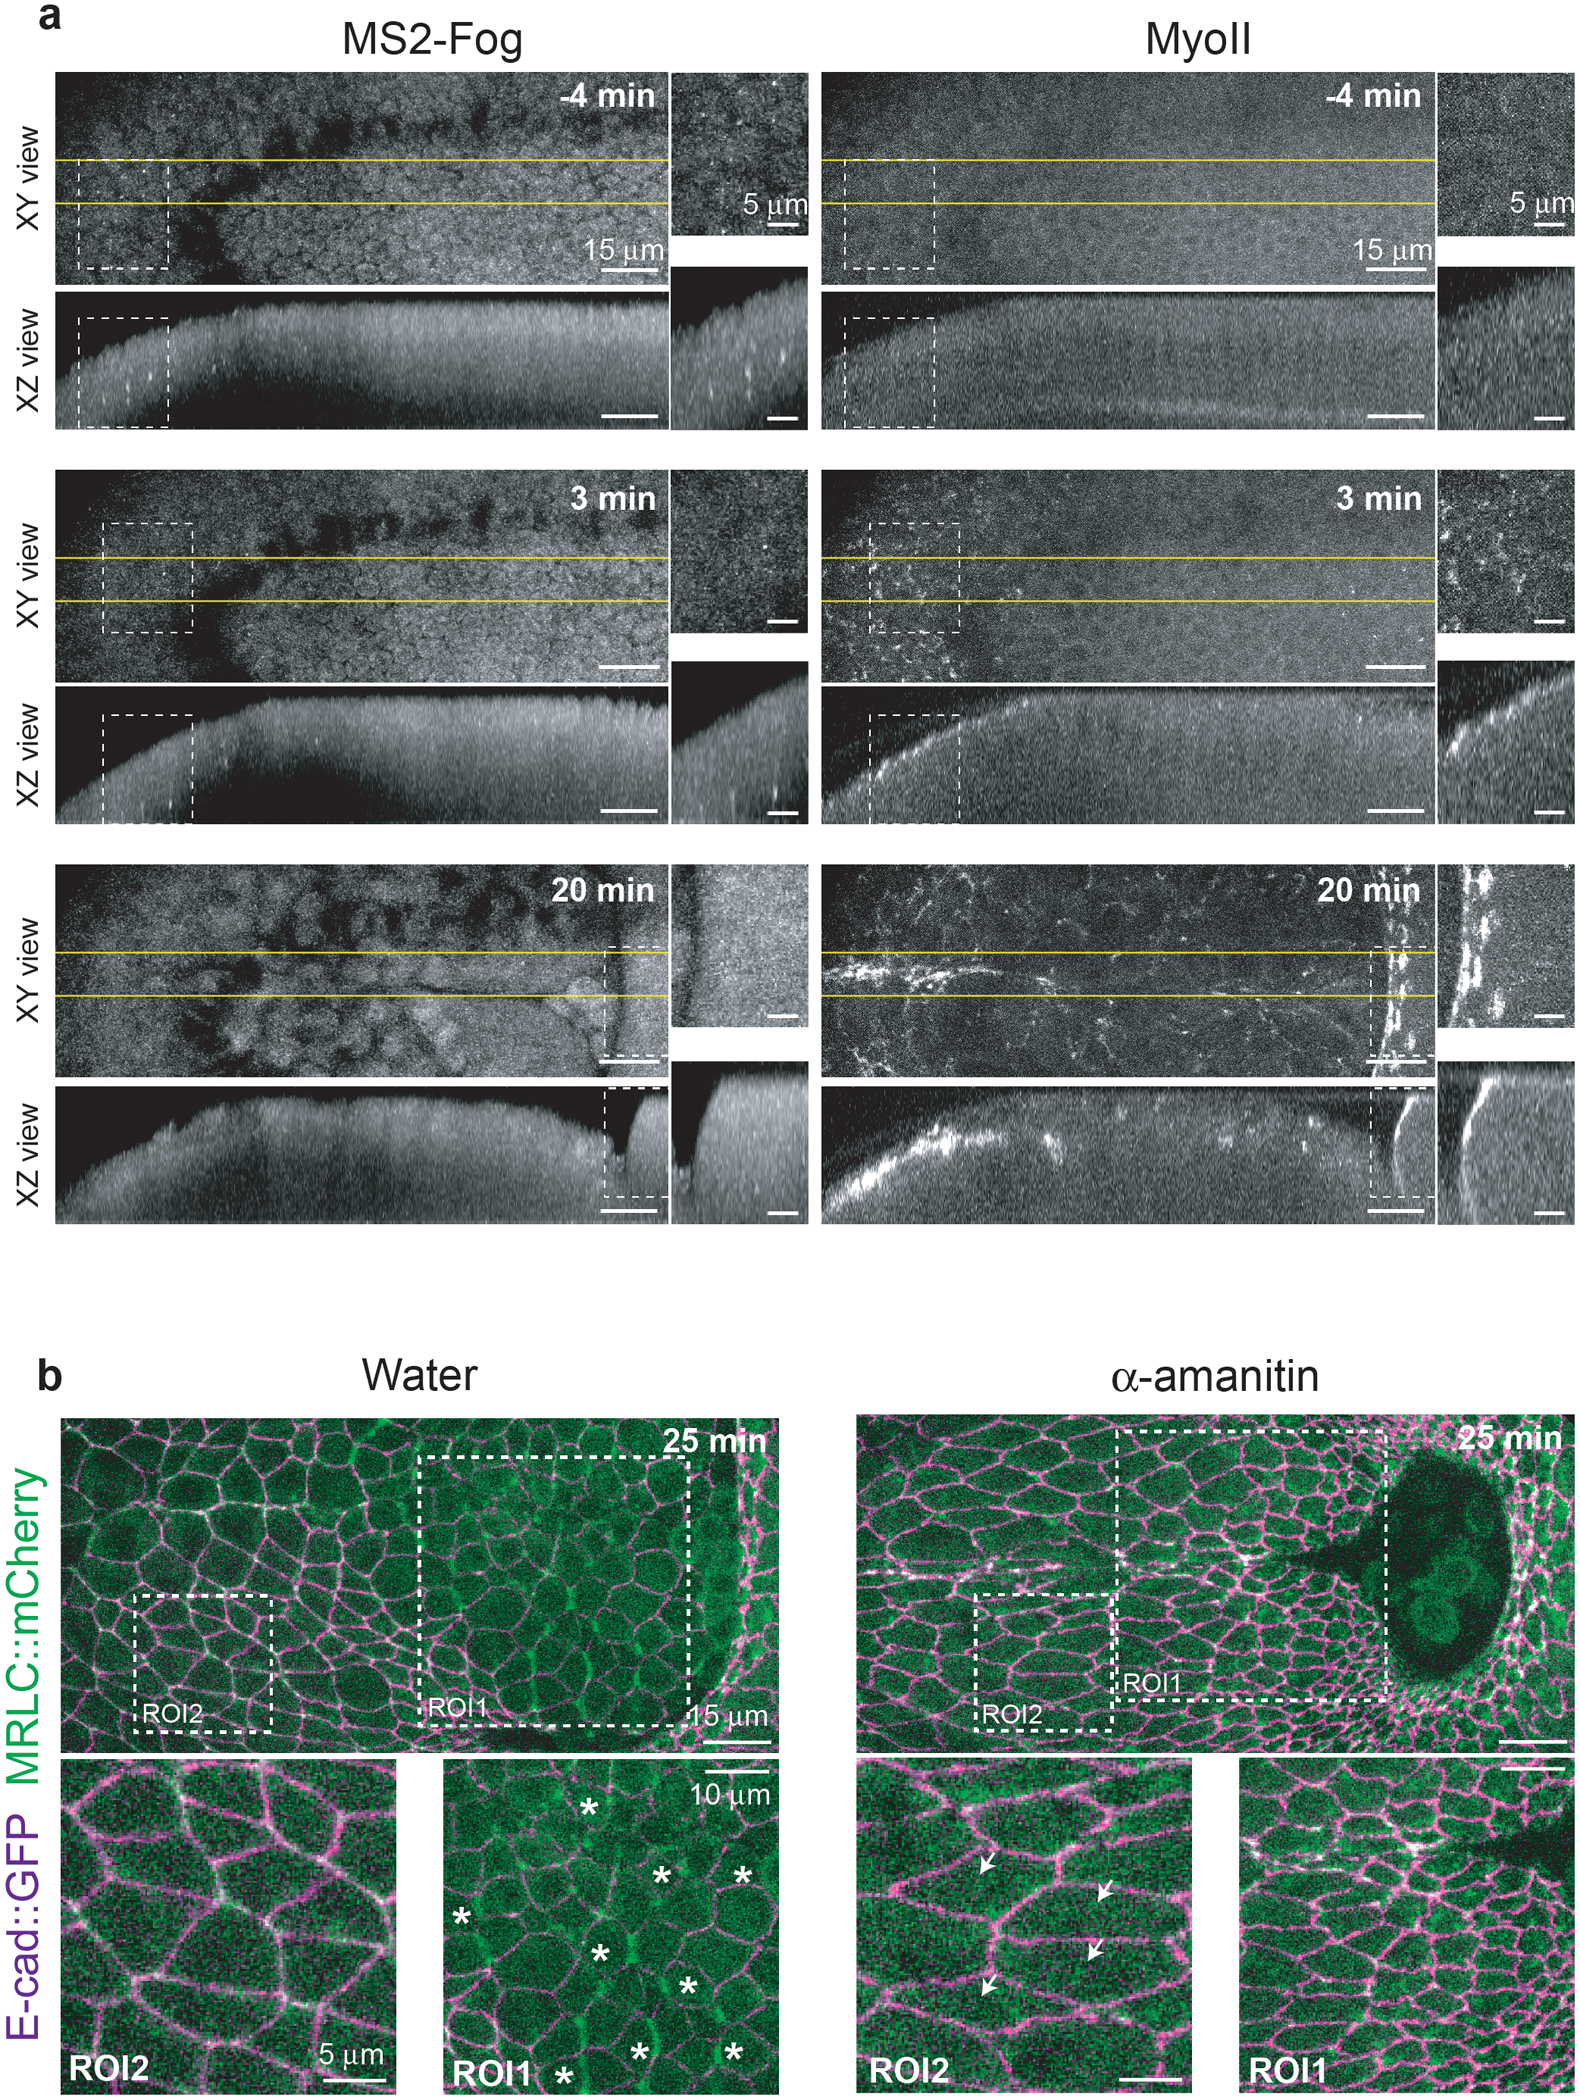
(a) fog expression in the posterior endoderm visualized with the MS2-MCP system35 along with MyoII in living embryos. Top and side views are shown for the indicated time points. White dashed boxes indicate the positions of the close-ups on the right and the yellow lines the region where side-views were generated. fog is expressed in the primordium but not in the propagation zone. N=4 embryos. (b) Stills of a control (water) and α-amanitin injected embryo at a late stage of invagination. Asterisks indicate dividing cells (ROI1) and arrowheads elongated cells in the posterior-ventrolateral ectoderm. Elongated cells in the ectoderm are a hallmark of cell stretching typical of conditions where cell intercalation is affected29,30,62. N=11 for water and N=10 for α-amanitin injected embryos.
Extended Figure 6. Fog diffusion does not control MyoII wave propagation:
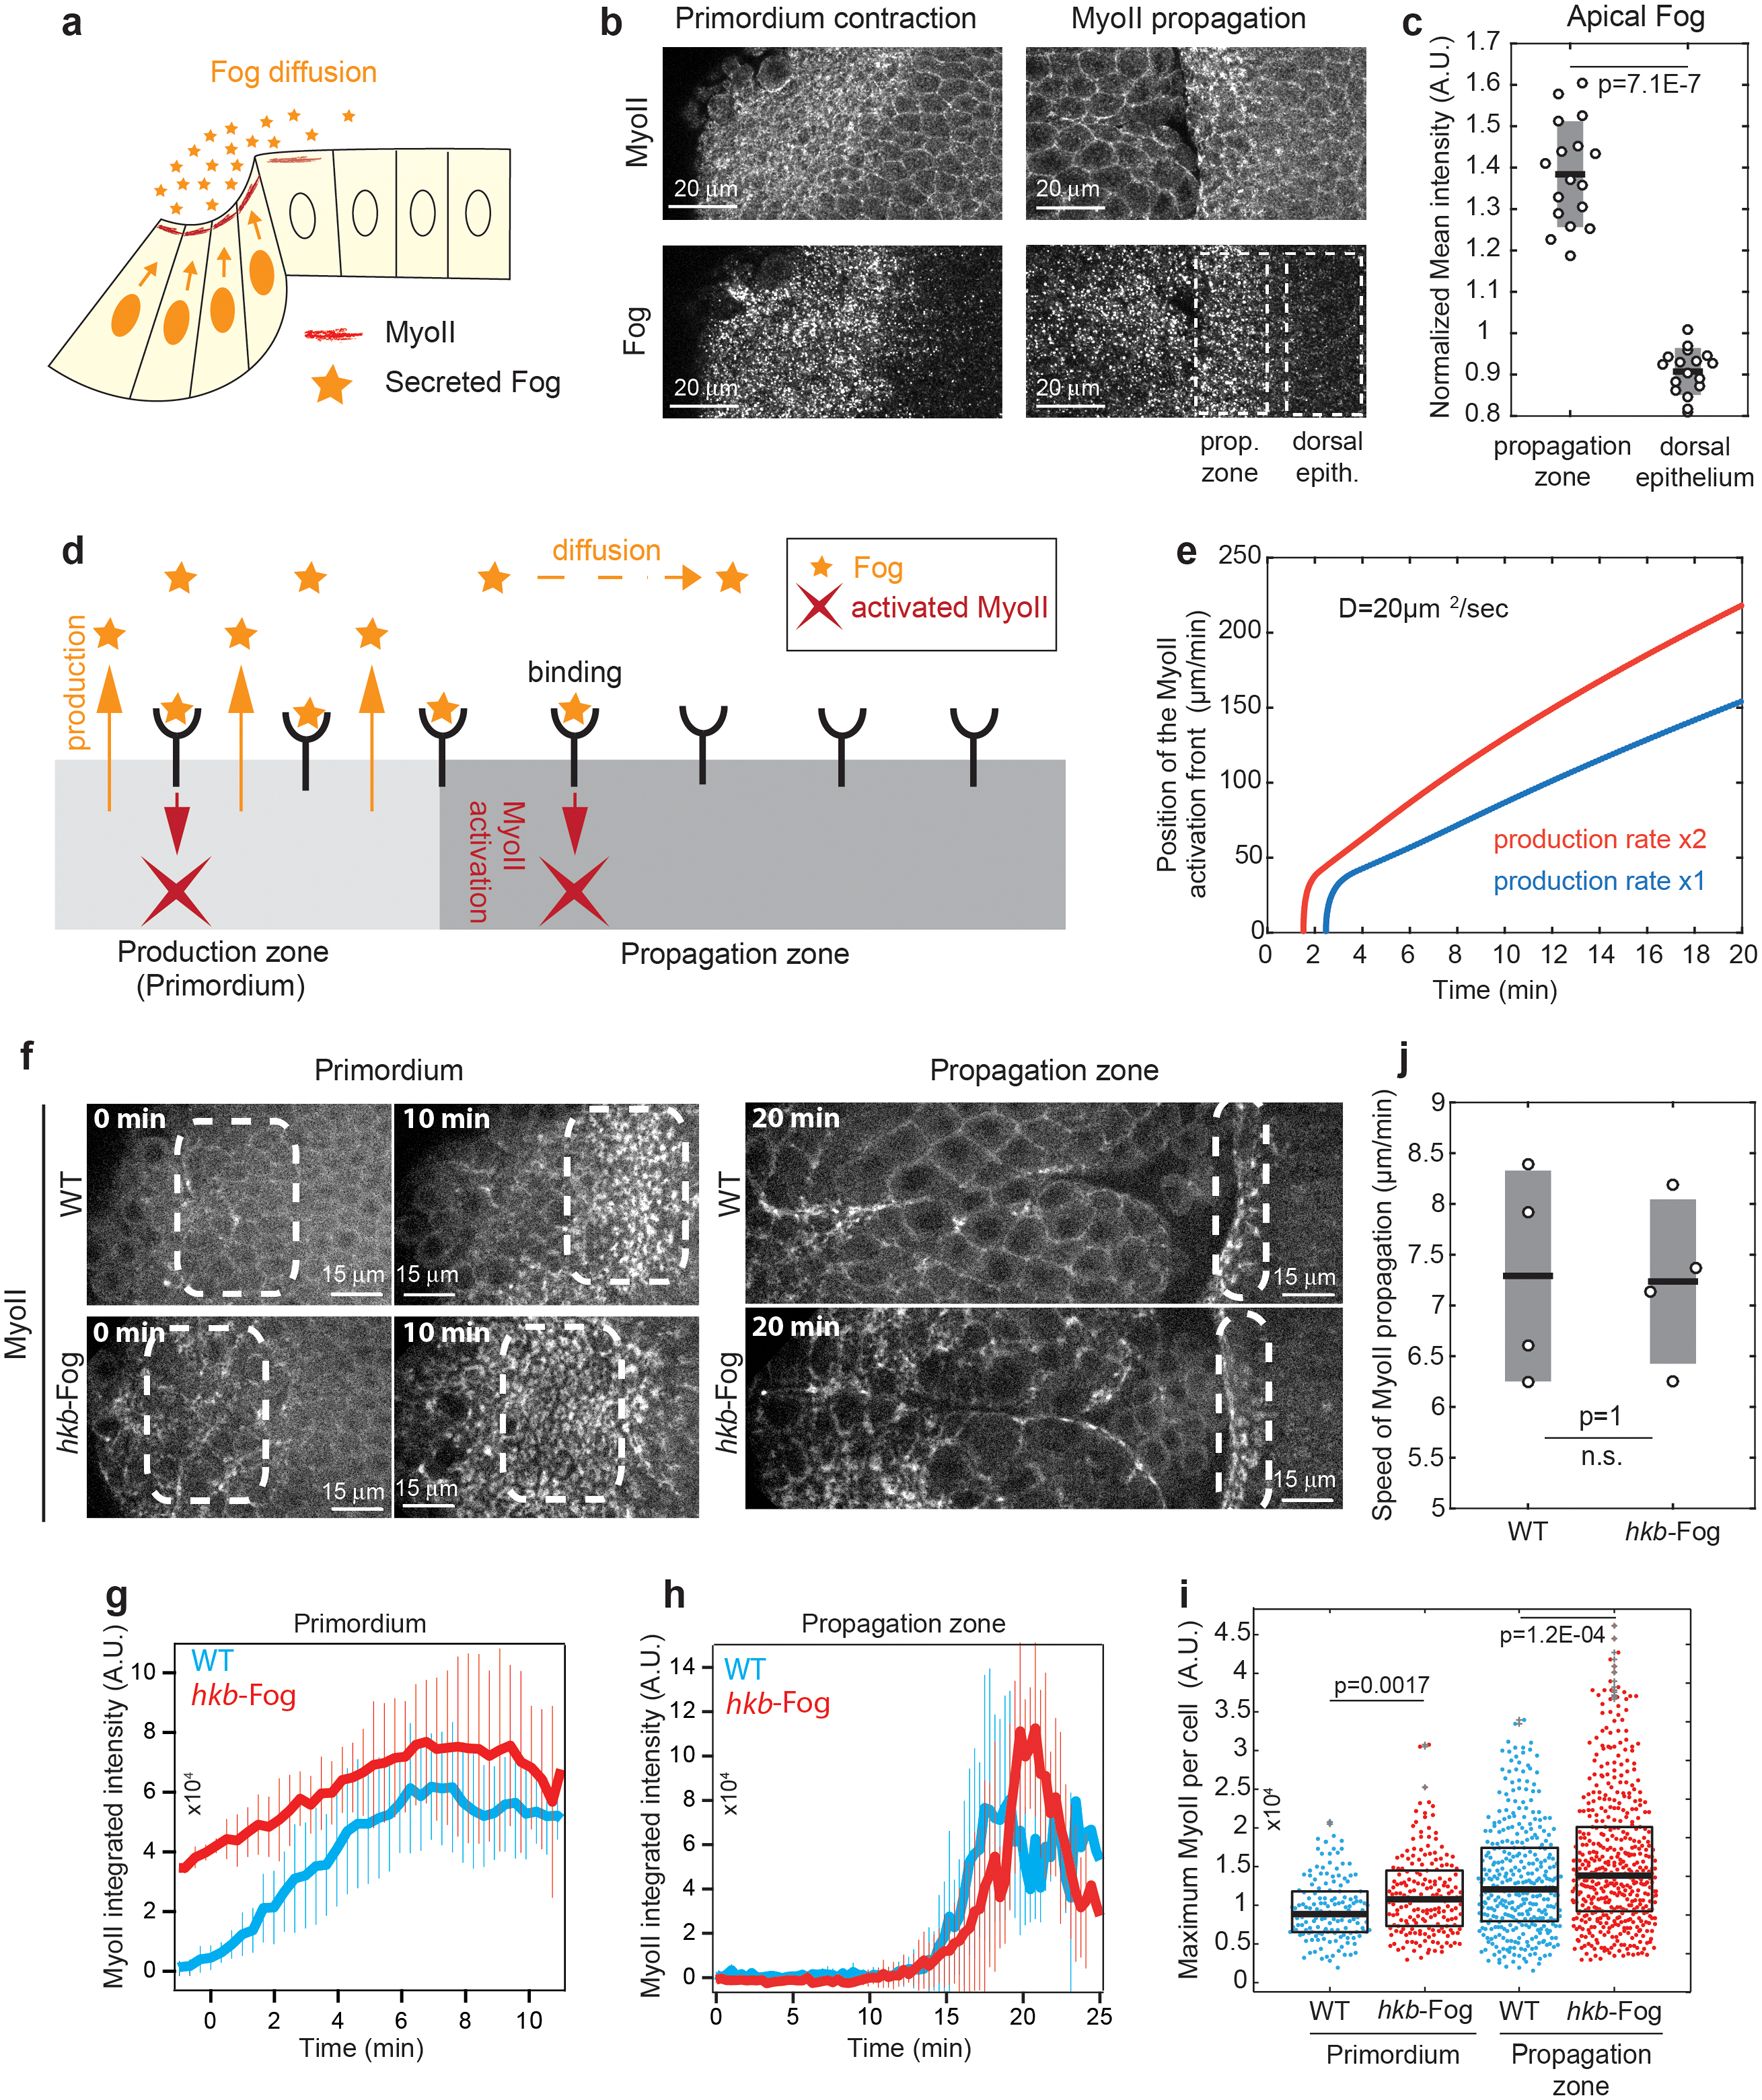
(a) Hypothesis of secreted Fog diffusion from the primordium controlling MyoII propagation. (b) Apical views of embryos stained for Fog and MyoII at primordium contraction and late propagation stages during endoderm morphogenesis. N=7 embryos for primordium contraction from 1 independent experiment and N=17 embryos for propagation stage from 2 independent experiments. (c) Quantifications of Fog mean intensity in the propagation zone and in the dorsal epithelium. Individual embryos data points are superimposed to box plots. Box plots: black line mean, grey box s.d.. N=17 embryos. P=7.1E-7 from a two-sided Mann-Whitney test. (d) Model of Fog secretion, diffusion, receptor binding and MyoII activation (see Supplementary Information). (e) Position of MyoII activation front over time from one simulation of the model in b for the diffusion constant D, a given production rate (blue) and its double (red). (f) Time-lapse of MyoII in the indicated conditions. The boxes mark the primordium and the activated cells in the propagation region. N=4 embryos each. (g-h) MyoII integrated intensity in cells of the primordium (g, N=153 and 191 cells for WT and hkb-fog, from 4 embryos each) and in a 10μm-wide band of cells at ~30μm distance from the primordium at time 0 (h, N=69 and 67 cells for WT and hkb-fog, from 4 embryos each). Mean±SD between different embryos. (i) Maximum of MyoII integrated intensity in cells of the indicated conditions. Boxplots show median and 25th and 75th percentiles. Grey crosses label outliers. N is the number of cells from 4 embryos for each condition. P=1.2E-4 and P=0.0017 from a two-sided Mann-Whitney test. (j) Speed of MyoII propagation in the reference frame of the microscope. Box plots: black line mean, grey box s.d.. N=4 embryos each. N.S. indicates a P=1, two-sided Mann-Whitney test.
Extended Figure 7. Patterned Fog signaling does not control MyoII wave propagation:
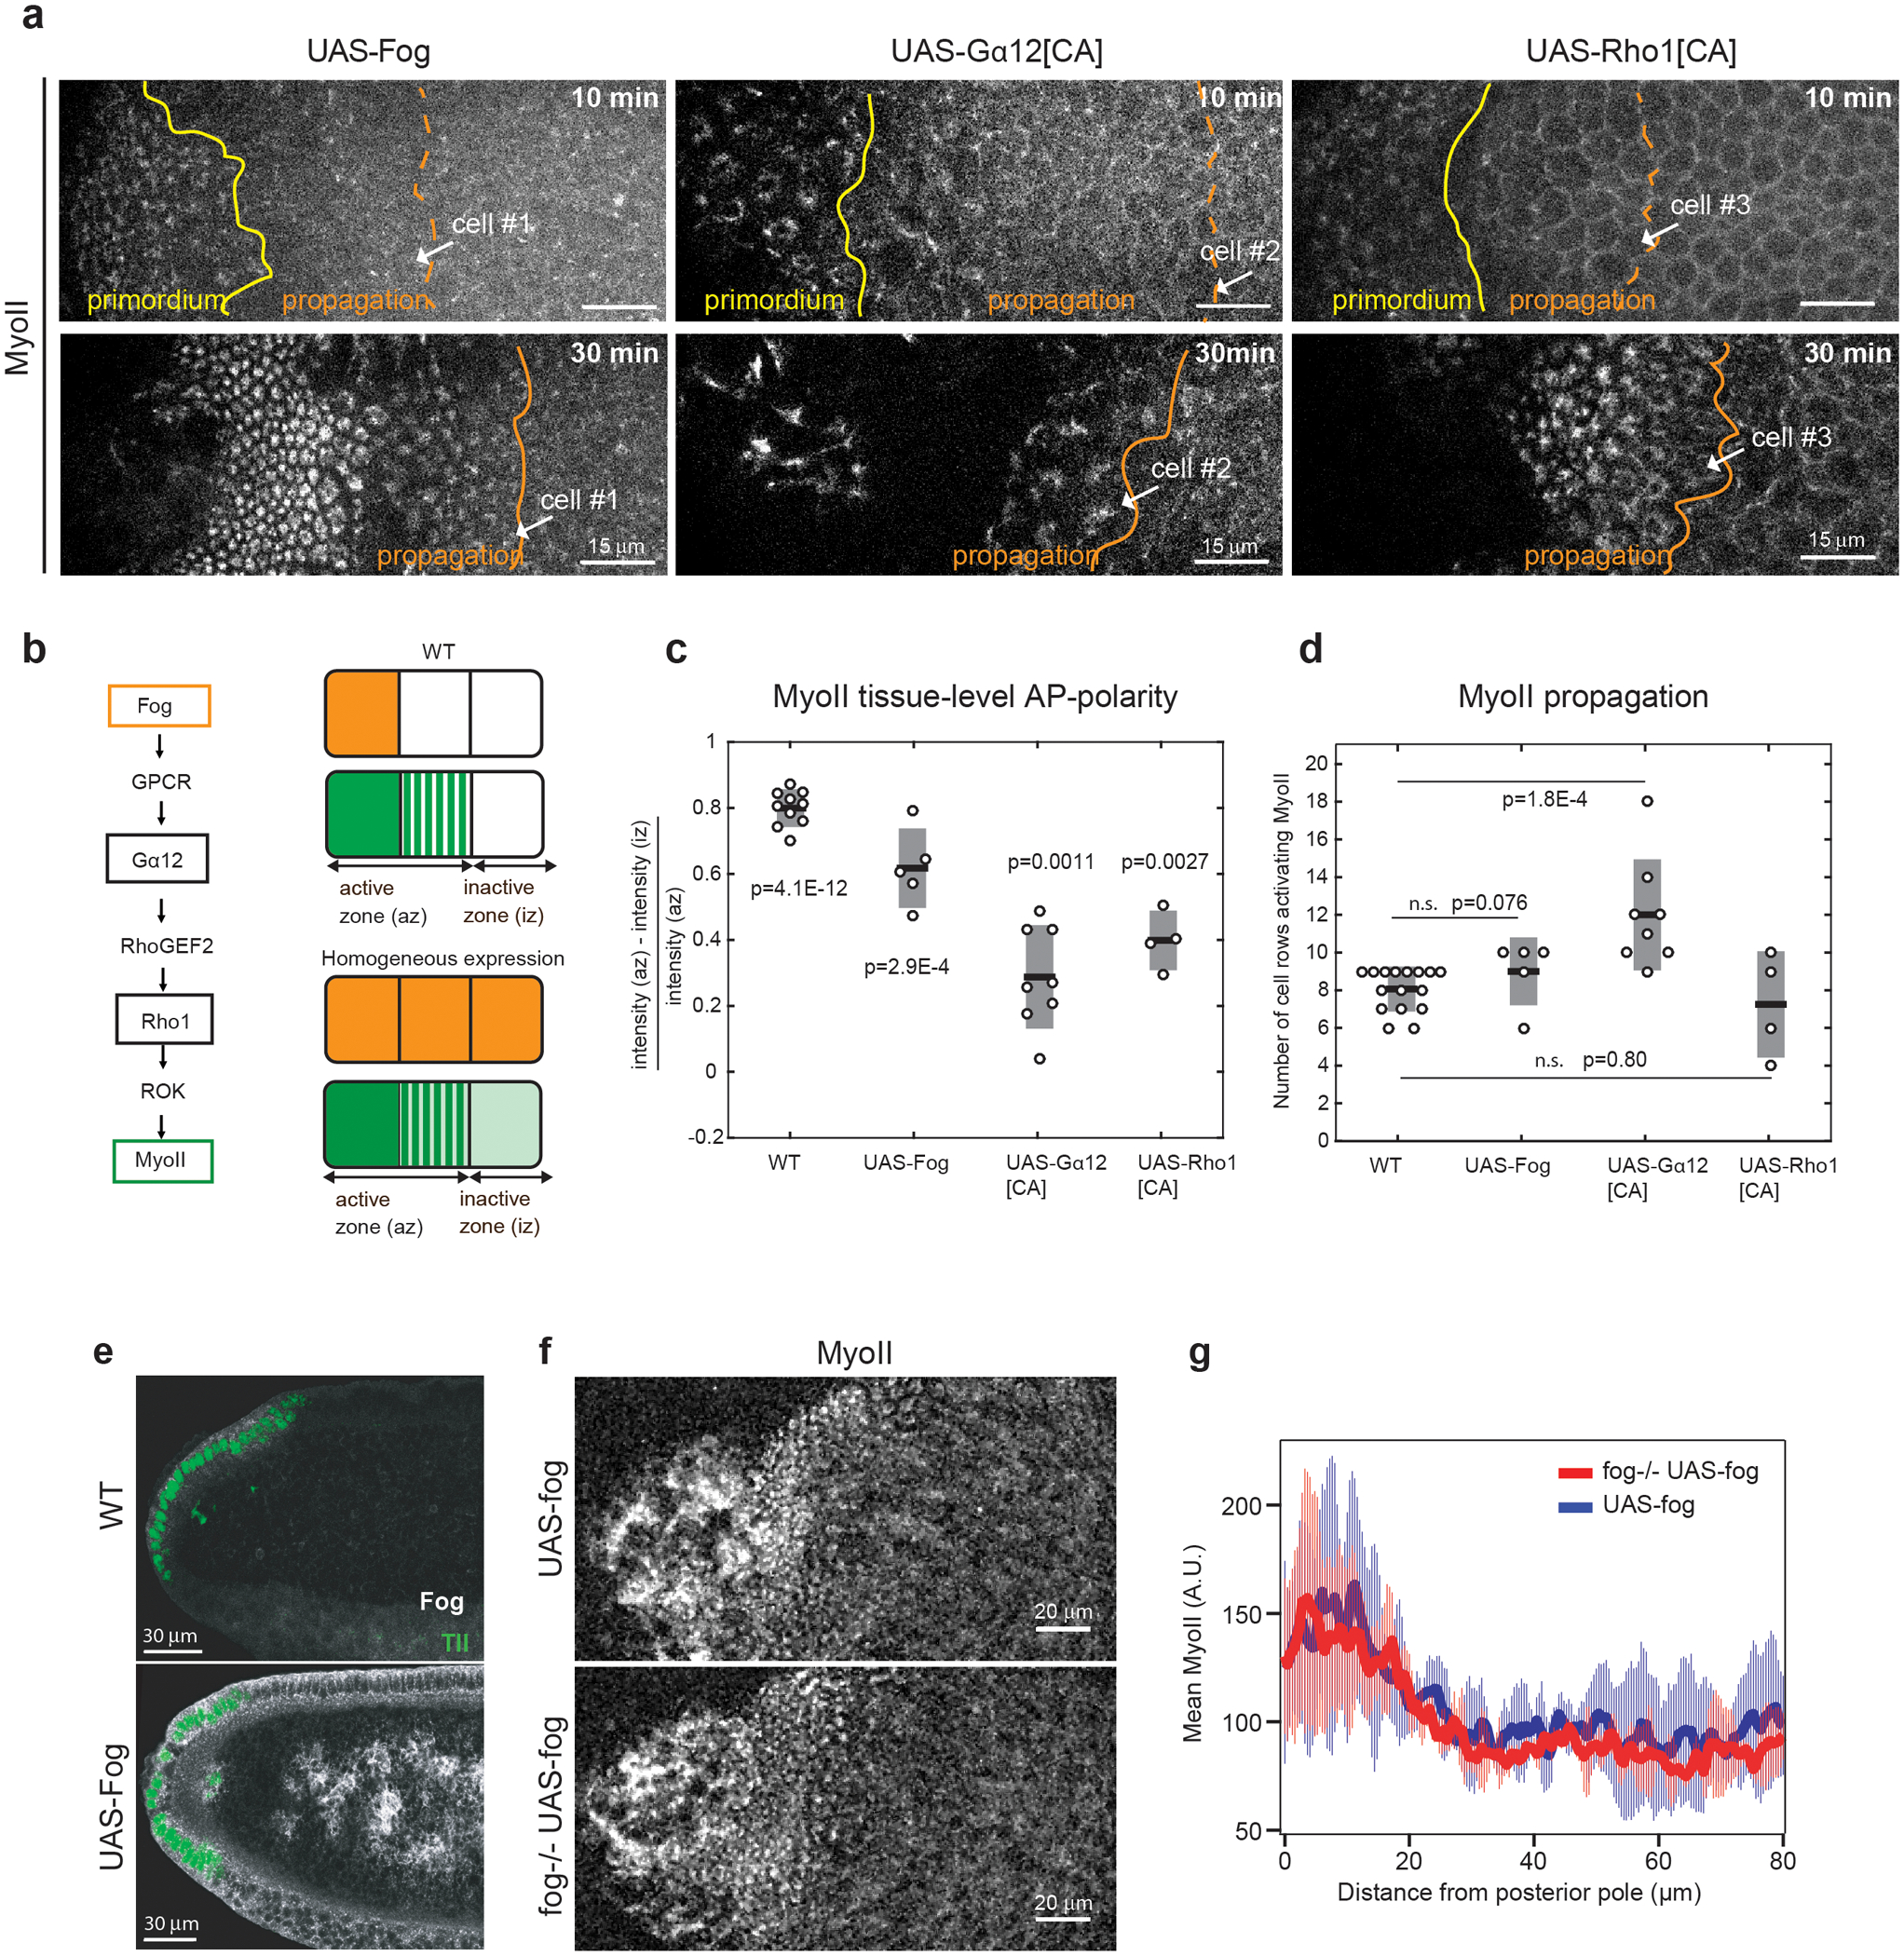
(a) MyoII pattern in embryos where Fog (UAS-Fog), a constitutively active Gα12 (UAS-Gα12[CA]) and Rho1 (UAS-Rho1[CA]) are expressed uniformly. Yellow and orange lines: the limits of the primordium and propagation regions respectively. White arrows point the same cell over time. N=5, N=8 and N=4 embryos for UAS-Fog, UAS-Gα12[CA] and UAS-Rho1[CA] respectively. (b) Left: Pathway of MyoII activation in endoderm cells. Right: Schematic of the Fog expression pattern (orange) in WT and UAS-Fog and of the observed MyoII pattern (green). The active and inactive zones used to calculate the MyoII tissue level polarity in c are indicated. (c-d) Quantifications of MyoII tissue-level polarity 10min after primordium activation (c) and of MyoII propagation (the number of cell rows of the propagation zone activated within 20min) (d) for the indicated conditions. For c, N=10 (P=4.1E-12), N=5 (P=2.9E-4), N=8 (P=0.0011), N=4 (P=0.0027) embryos for WT, UAS-Fog, UAS-Ga12[CA] and UAS-Rho1[CA] respectively with the p-values from a one-sample t-test against the hypothesis that the data are a normally distributed with mean=0. For d, N is as c except N=16 for WT, and P=0.076, P=1.8E-4 and P=0.80 from a two-sided Mann-Whitney test for the indicated comparisons. (e) Sagittal sections of a WT and an embryo ubiquitously expressing Fog (UAS-Fog). Immunolabelling for Fog is in white and for Tailless (Tll) in green. N=10 WT and 2 UAS-Fog embryos from 2 independent experiments. (f) MyoII pattern with Fog ubiquitous expression in a WT and a fog zygotic mutant embryos (imaged with 20X objective). N=3 embryos each. (g) Quantifications of MyoII patterns along the AP-axis in the posterior endoderm of the indicated conditions. N=3 embryos each, Mean±SD.
Extended Fig. 8. Cells in the propagation region are subjected to mechanical stress:
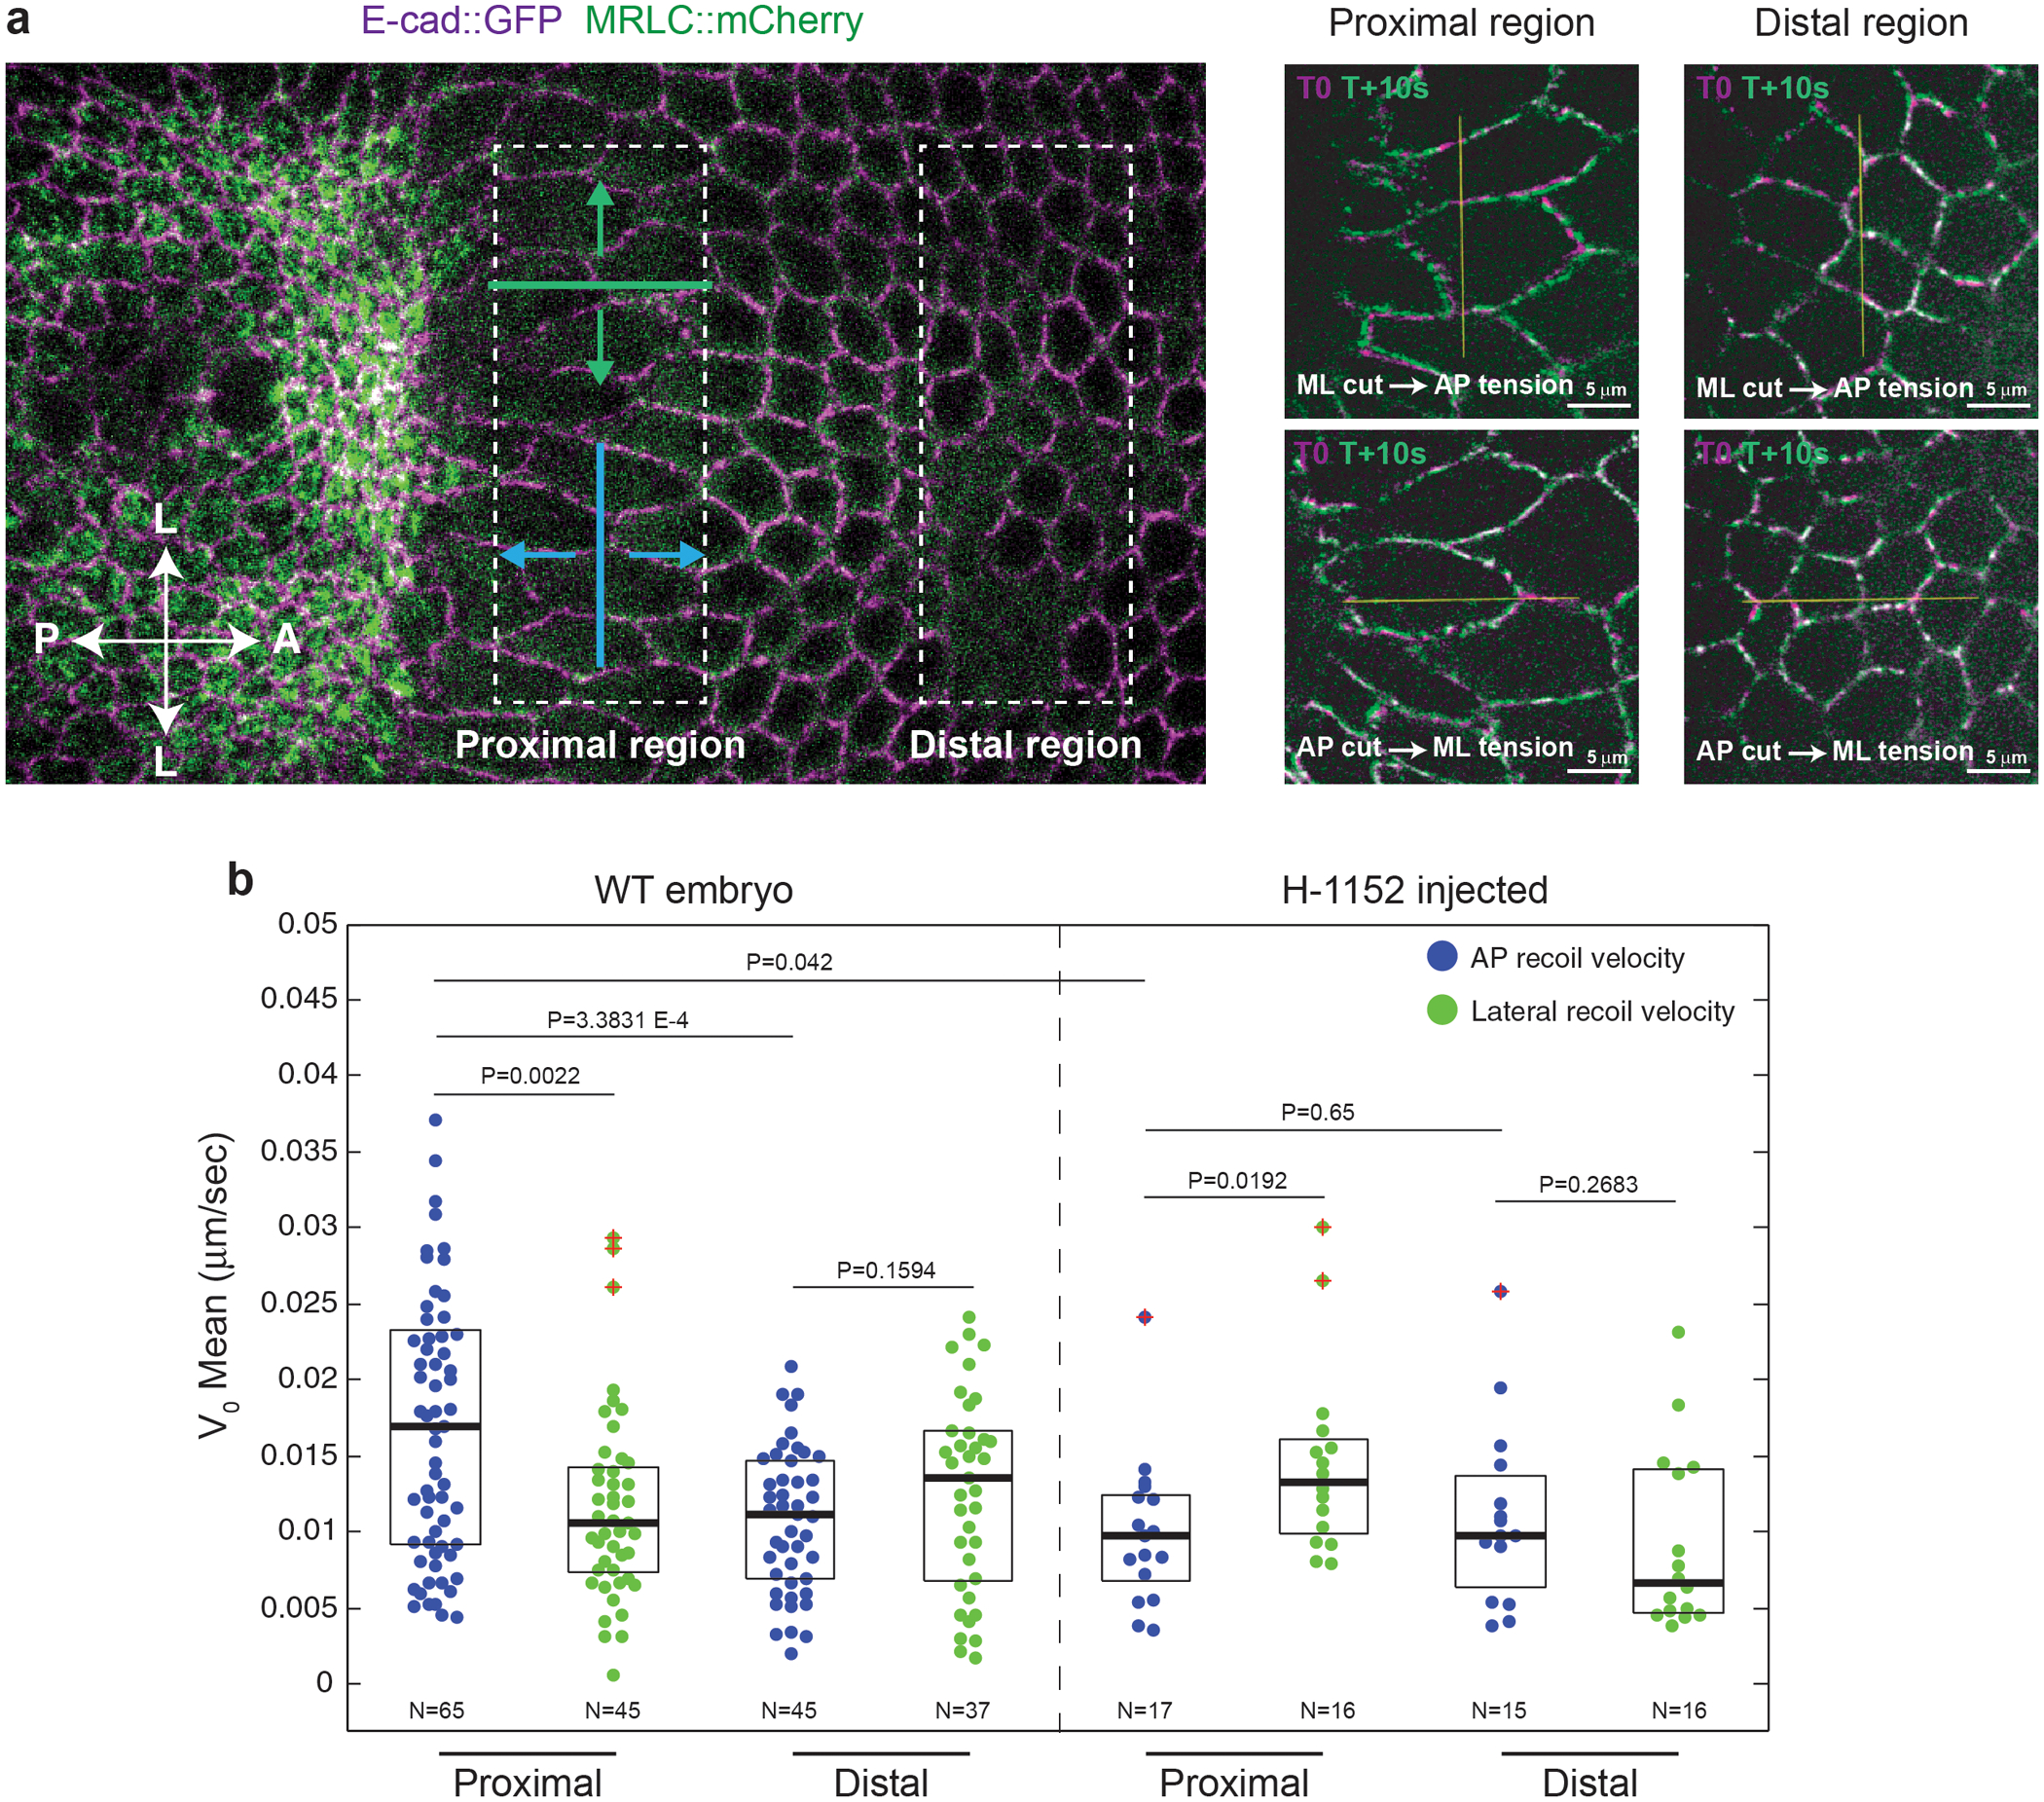
(a) Left: Regions in the dorsal epithelium (corresponding to the propagation region) where tension was probed by line cuts with different orientations (ML cut in blue and AP cut in green). Right: Examples of ML and AP line cuts in the indicated regions. Overlays of the pre-cut (in magenta) and an image 10s post-cut (in green) are shown. The yellow line indicates the line cut. N is as in b for WT. (b) Quantifications of the tissue initial recoil velocity in the regions and line orientations illustrated in WT and H-1152 (Rok inhibitor) injected embryos. N indicates the number of independent ablations extracted from 26 and 7 embryos for WT and H-1152 respectively. Boxplots show the median, the 25th and the 75th percentiles. The red crosses label outliers. P values are from a two-sided Mann-Whitney test.
Extended Fig. 9. Mechanical perturbations affect propagation speed and MyoII recruitment:
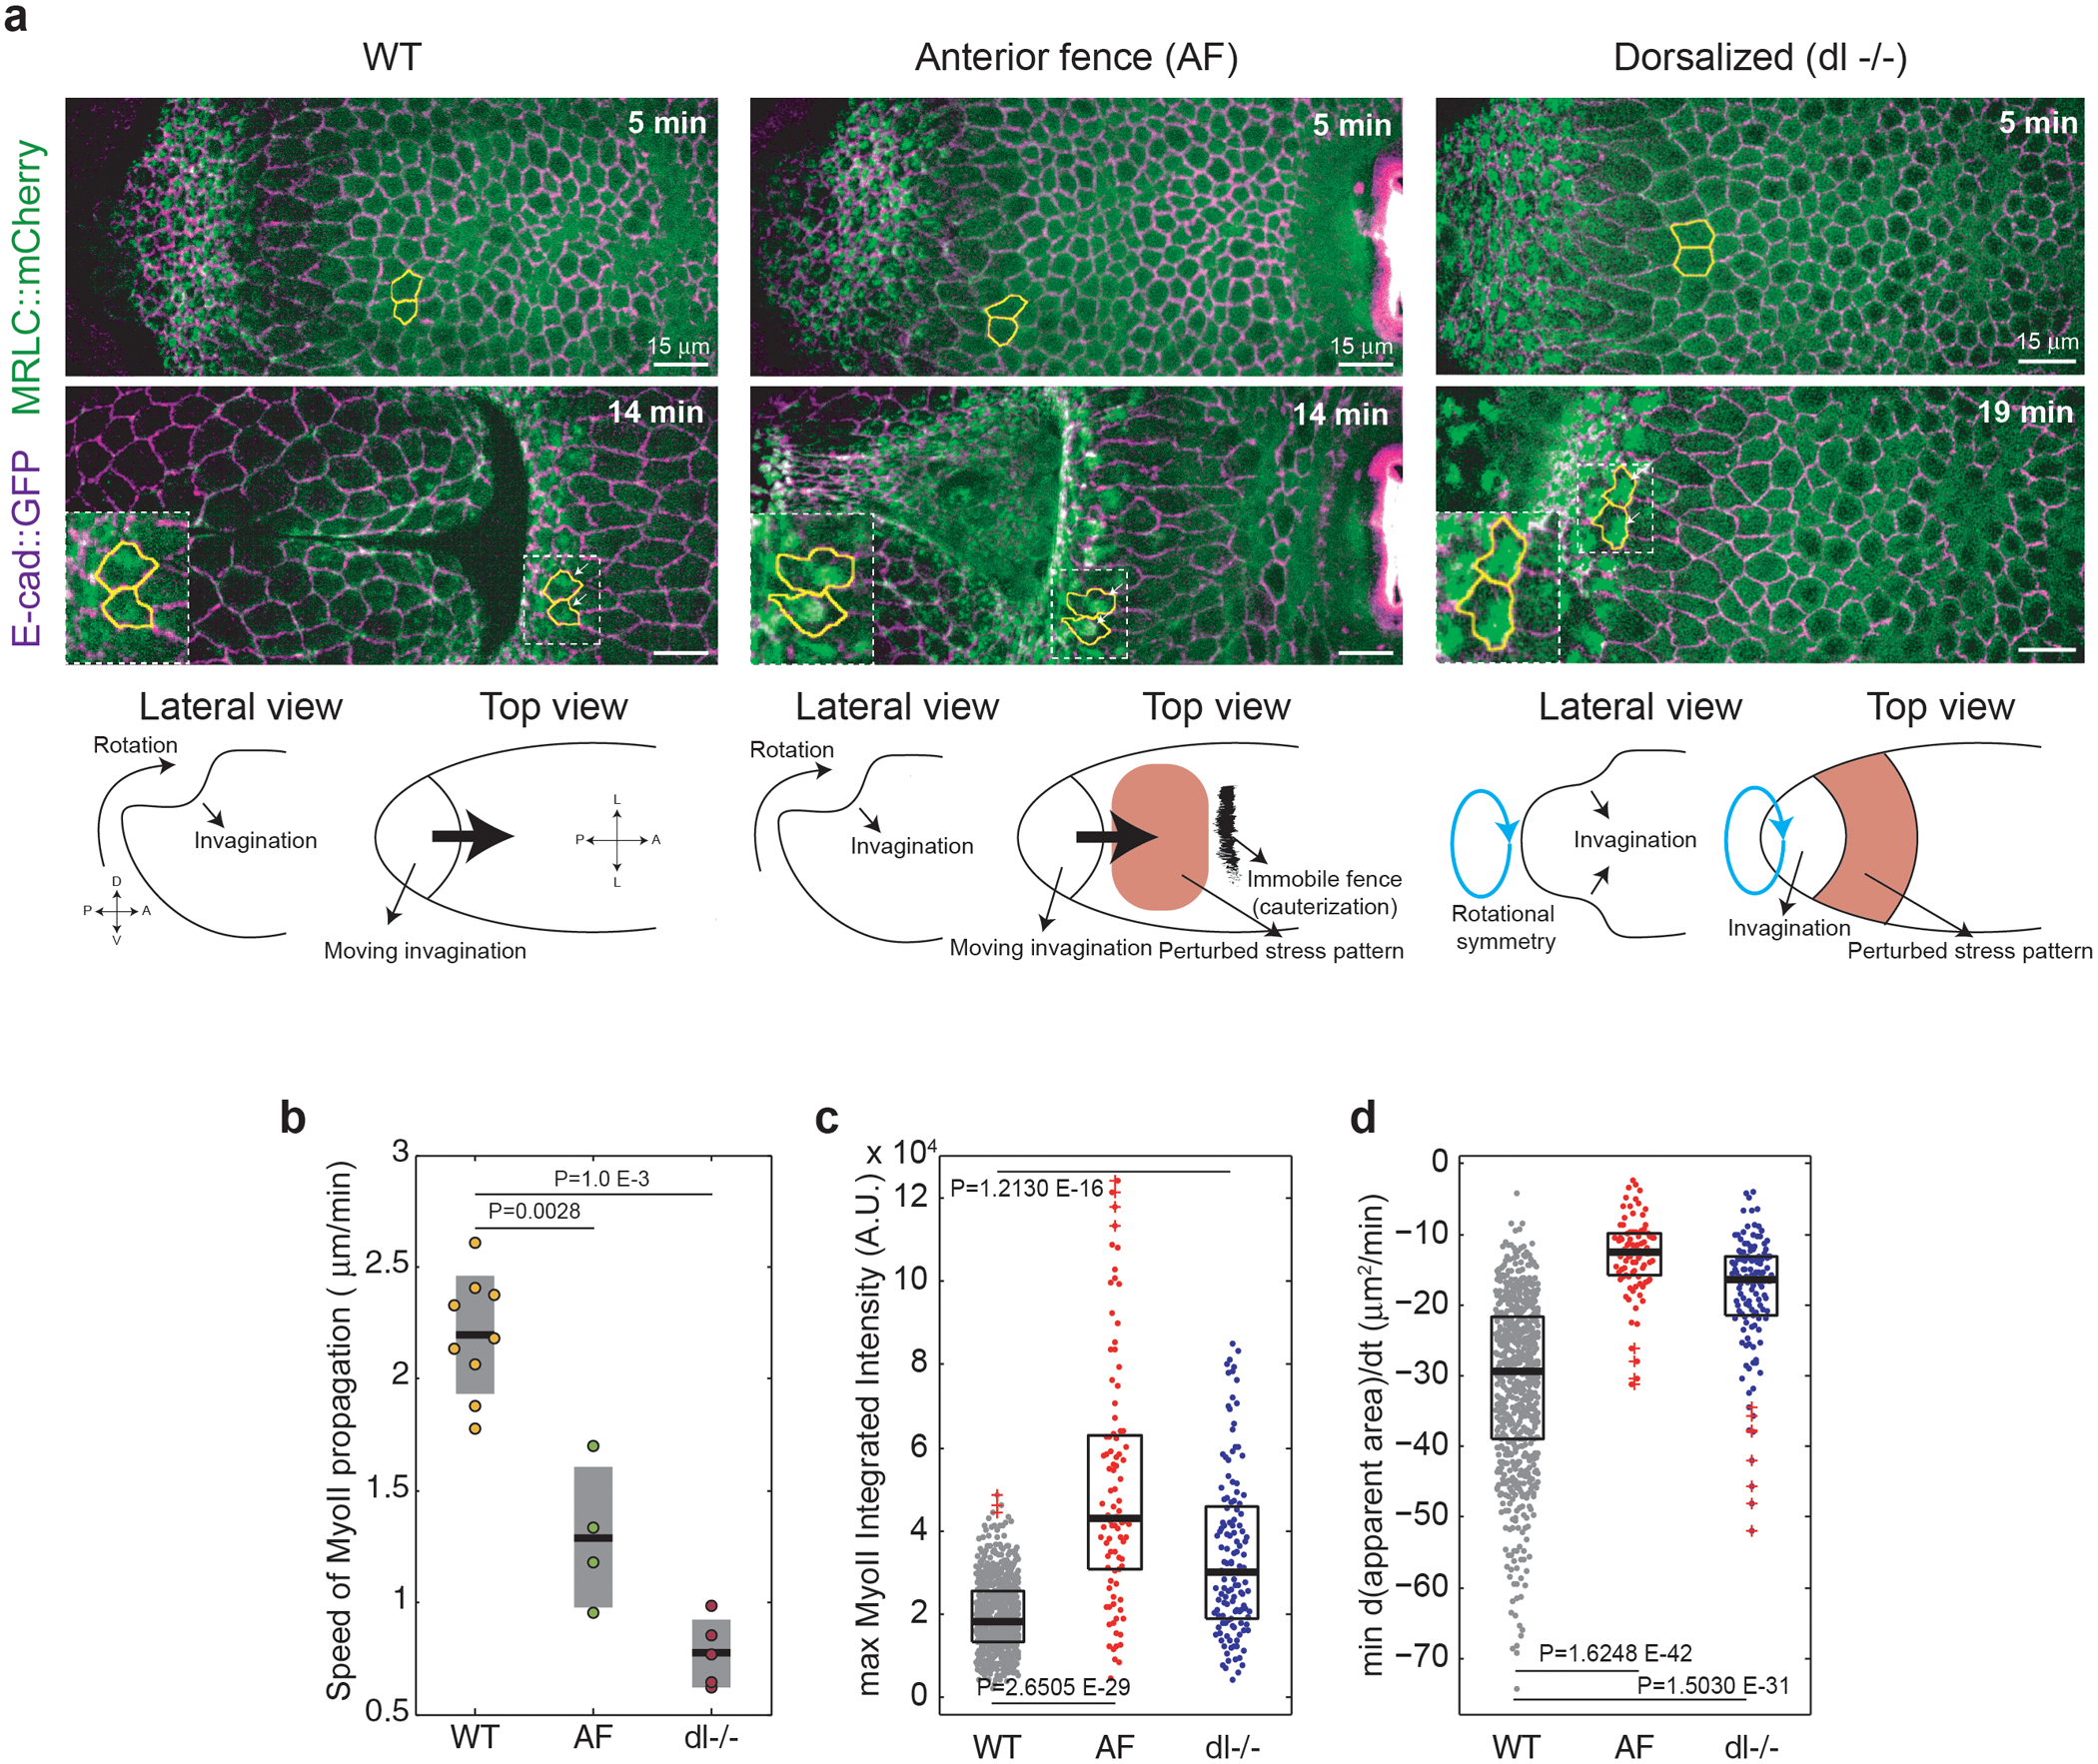
(a) Time-lapse of a WT (left), an embryo with an anterior medio-lateral fence (AF, middle) and a dorsalized embryo (dl−/−, right). Marked in yellow are representative tracked cells in the propagation region. Bottom: Schematic representations of the normal and perturbed conditions. N=9 WT embryos, 4 AF embryos and 5 dl−/− embryos. (b) Speed of MyoII propagation in the reference frame of the tissue in the indicated conditions. N=9 WT embryos, 4 AF embryos and 5 dl−/− embryos. P=0.0028 and P=1.0E-3 from a two-sided Mann-Whitney test. (c-d) Maximum MyoII integrated intensity (c) and minimum rate of apical constriction (d) in cells of the propagation region for the indicated conditions. N=663 cells from 9 WT embryos, 93 cells from 4 AF embryos and 129 cells from 5 dl−/− embryos. P values are from a two-sided Mann-Whitney test. Boxplots show median and 25th and 75th percentiles. The red crosses label outliers.
Extended Fig. 10. Rho1-GTP propagation is affected after Rok inhibitor injection:
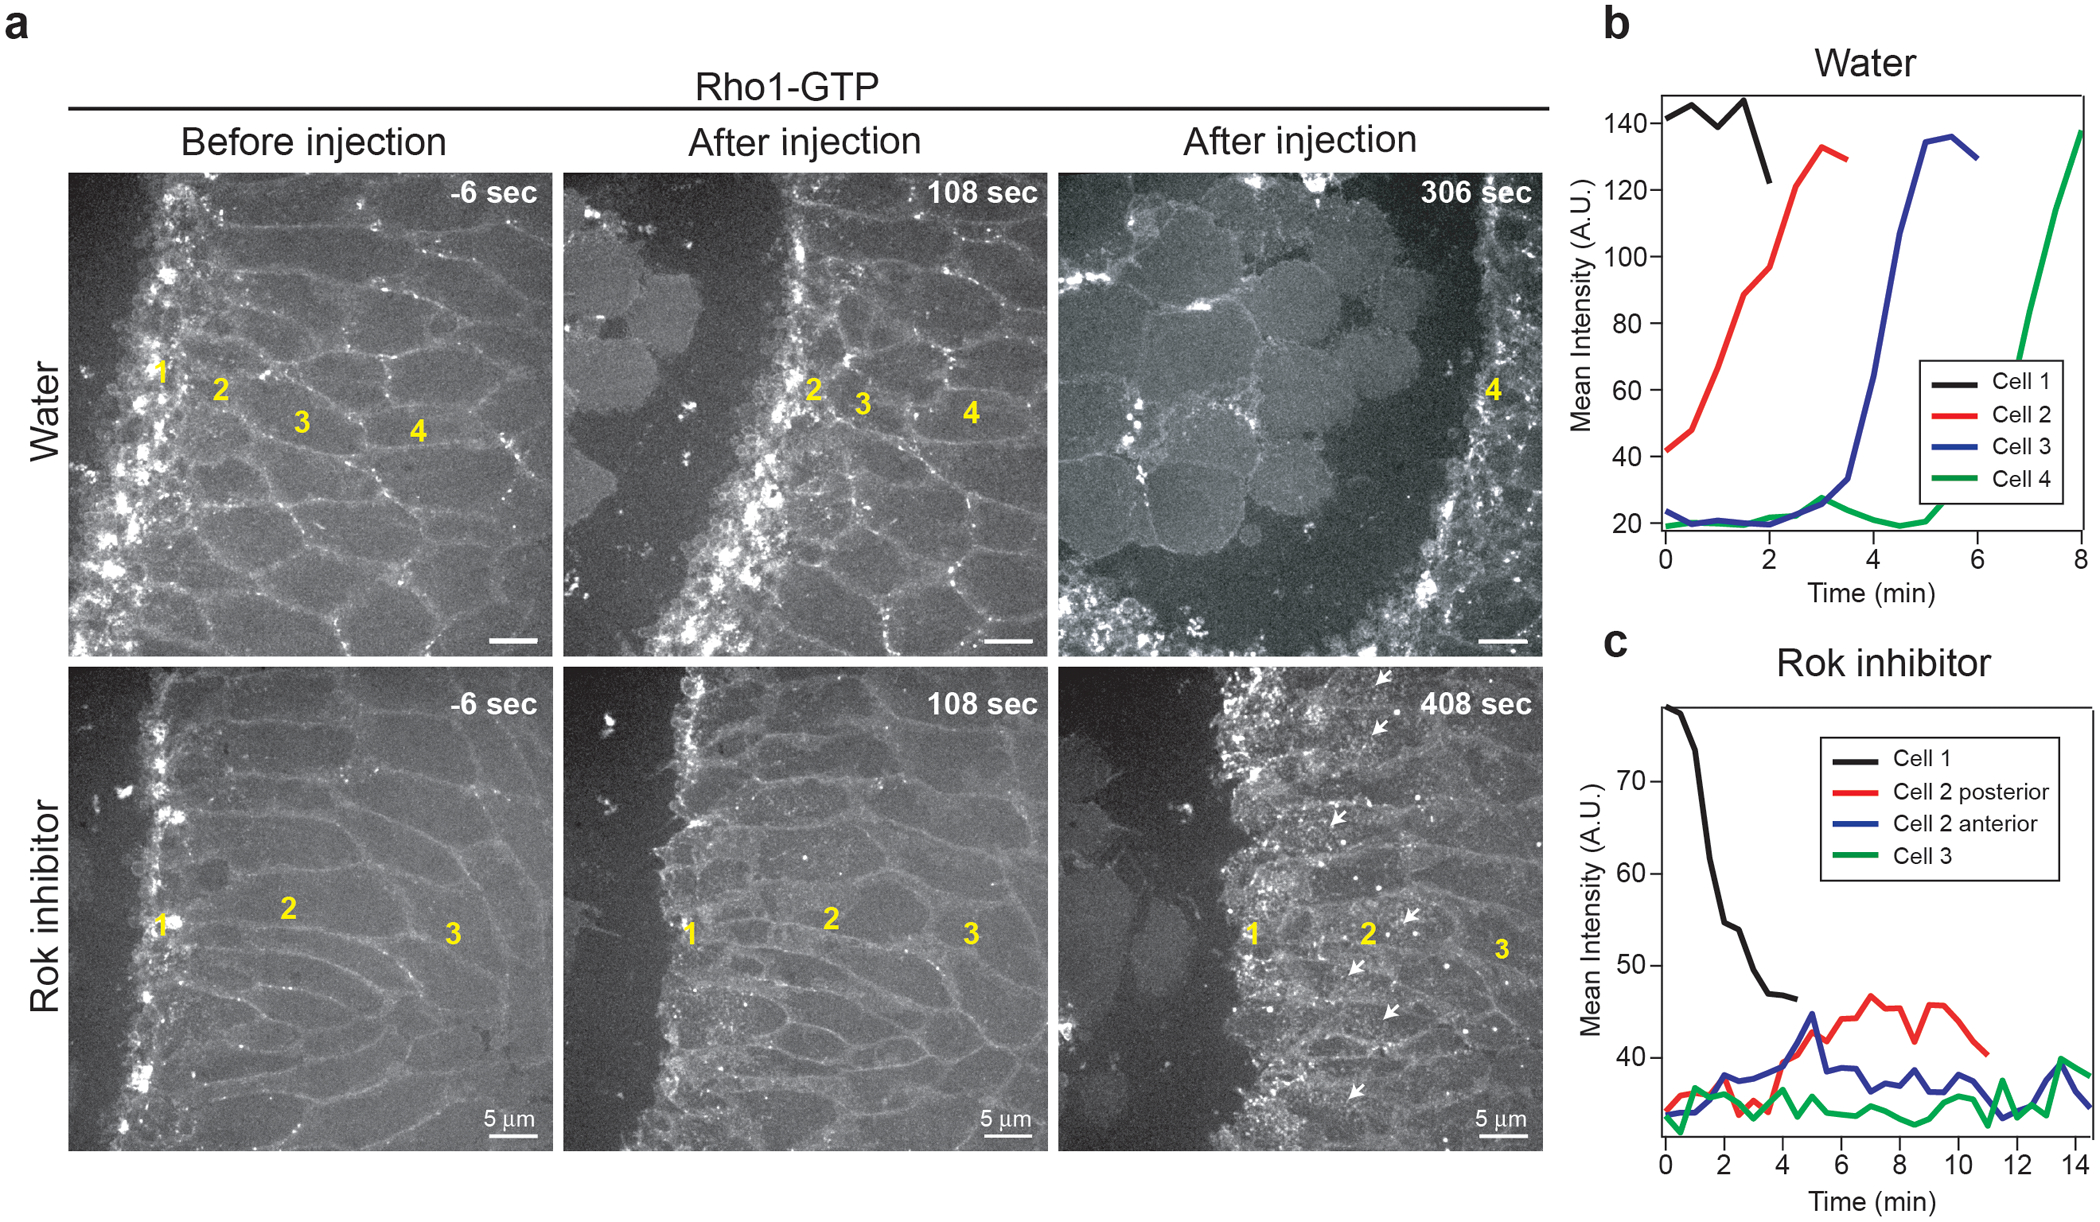
(a) High resolution time-lapse of Rho1-GTP (Anillin(RBD)∷GFP) in a control (water) and an embryo injected with 40mM H-1152 (Rok inhibitor) during propagation. Larger views and later times after injection are shown (compared to Fig.3f). The numbers in yellow indicate cells belonging to cell rows at different distances from the invaginating furrow. N=6 embryos for H-1152 and N=3 for water injections respectively. (b-c) Measurement of Rho1-GTP (Anillin(RBD)∷GFP) mean intensity over time in cells (or regions of cells) at different distances from the invaginating furrow in water (b) and H-1152 (c) injected embryos. Representative of N=47 cells for water and 47 cells for H-1152 injected embryos.
Extended Fig. 11. MyoII activation in cells of the propagation zone:
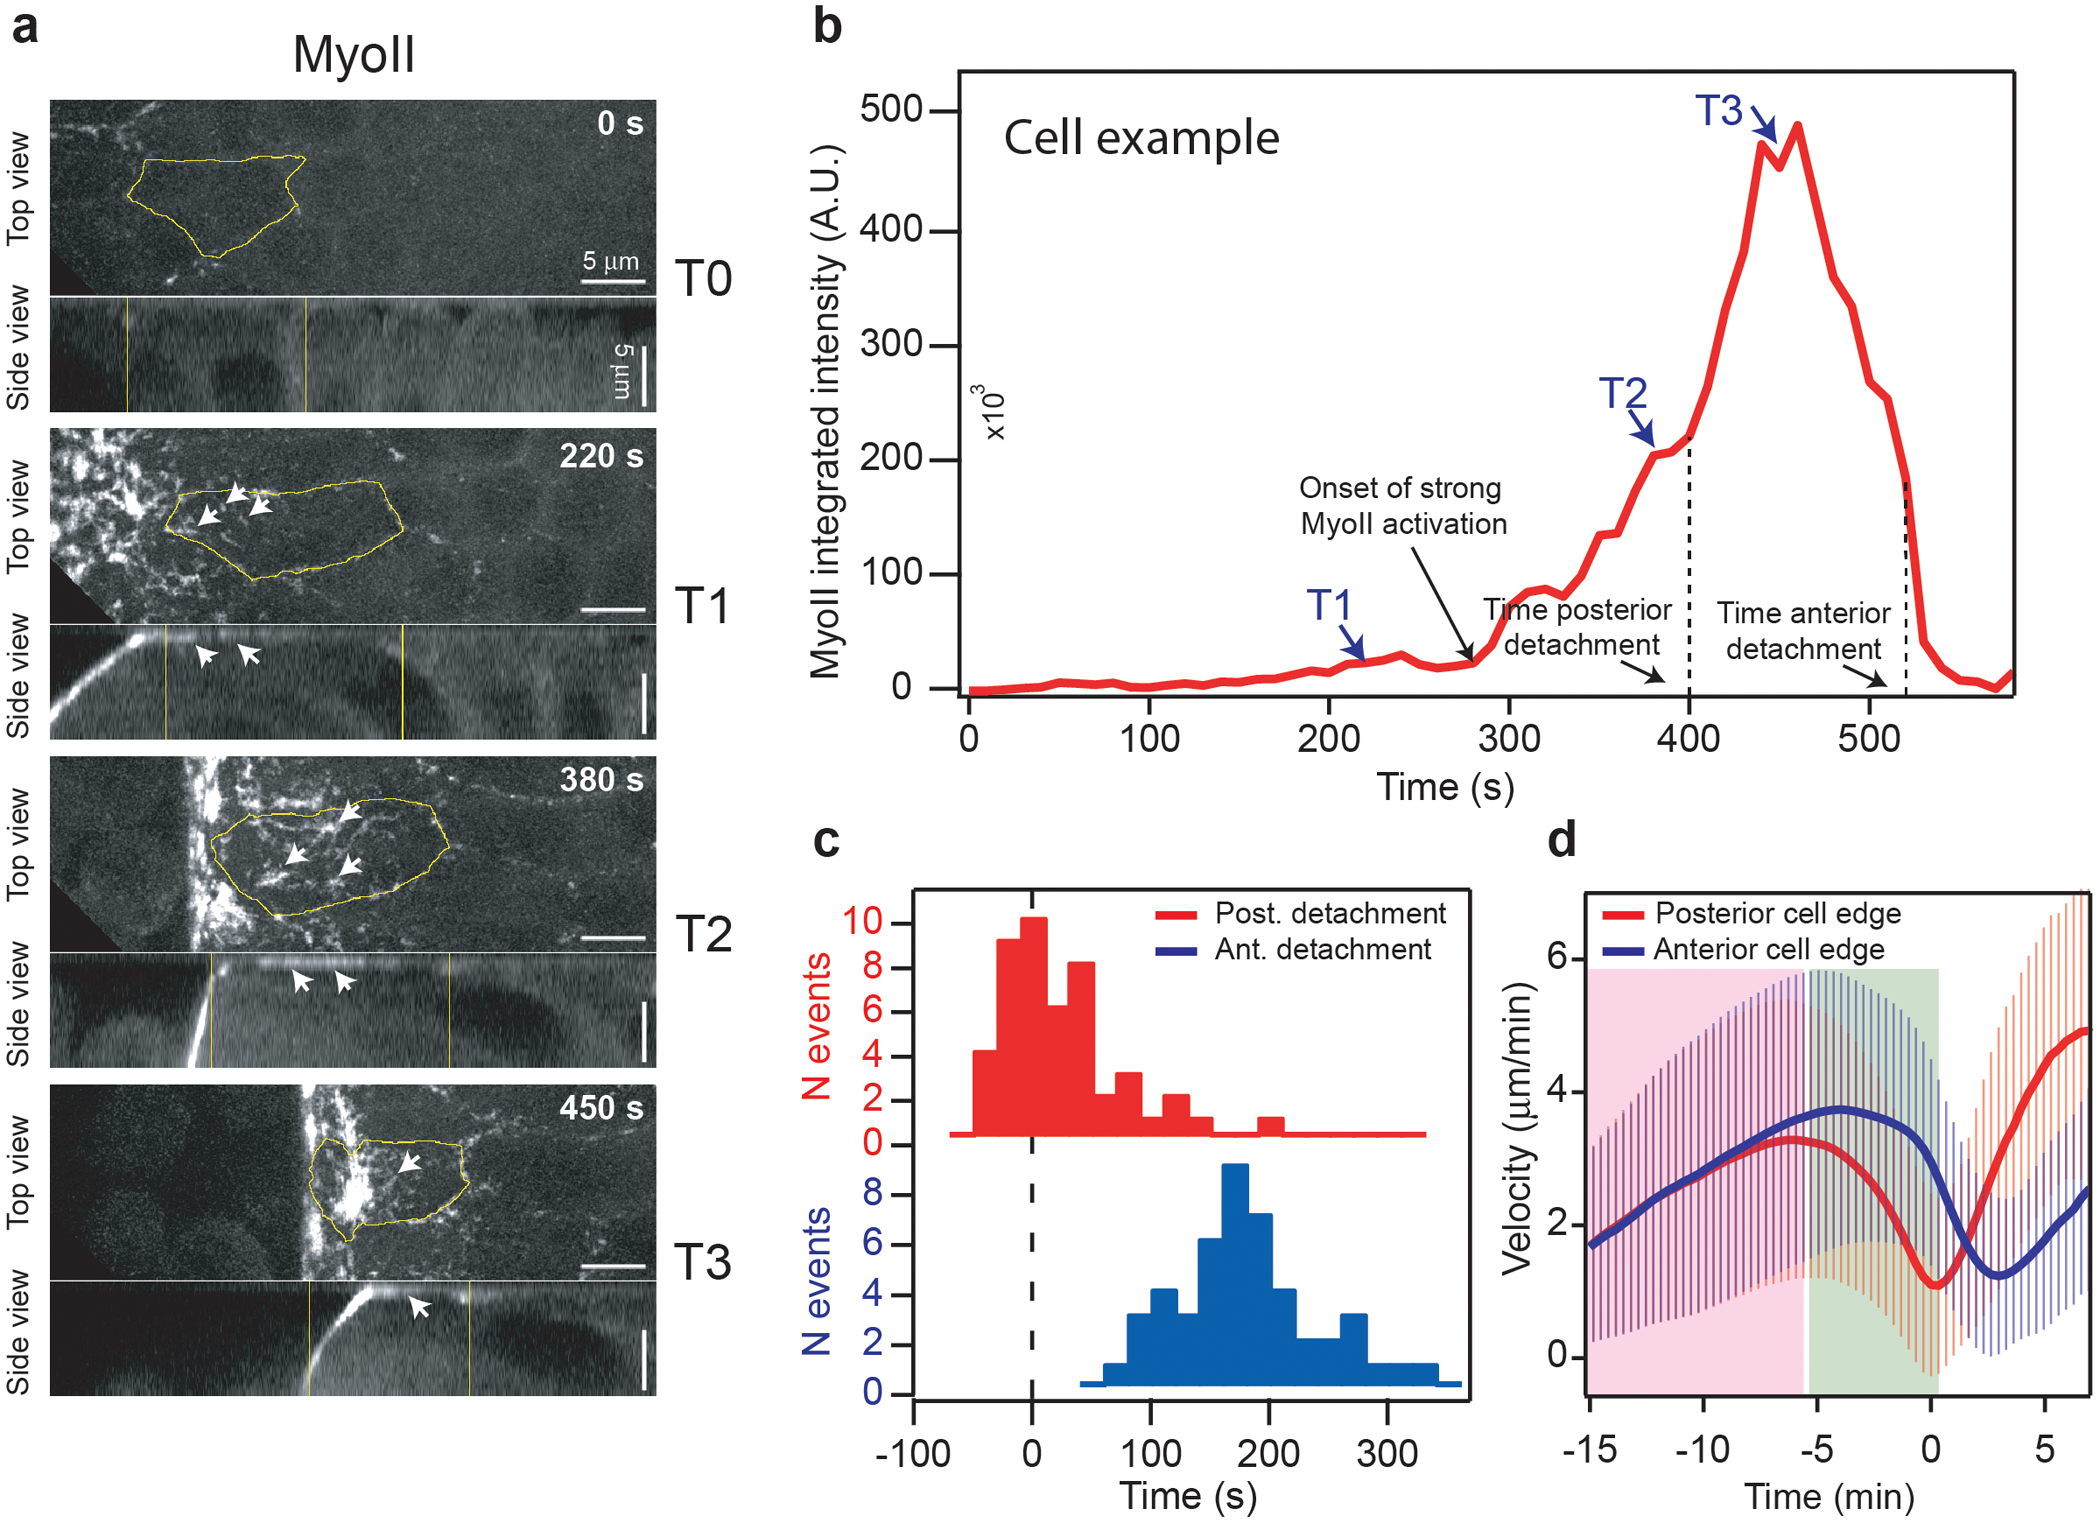
(a) Top and side views of MyoII activation in cells of the propagation region. The cell contour is labelled in yellow. White arrows indicate bright speckles of MyoII in regions of the cell in contact with the vitelline membrane. N=50 cells from 3 embryos. (b) Time trace of MyoII integrated intensity of the cell in a. The selected stills in a are indicated along with the time of the cell posterior and anterior edge detachment. (c) Histogram of the time of cell posterior and anterior edge detachment from the vitelline membrane relatively to the time of MyoII activation (defined as time 0). N=50 cells from 3 embryos. (d) Average velocity (relative to the vitelline membrane) of the posterior and anterior edges of cells in the propagation zone. Pink and green boxes: phases of rapid cell displacement and immobilization of the posterior edge respectively. Time t0 is defined for each cell as the time of max projected area increase rate. Mean±SD. N=456 cells, 6 embryos.
Extended Fig. 12. The 3D cycle of cell deformations during wave propagation depends of sustained MyoII activity:
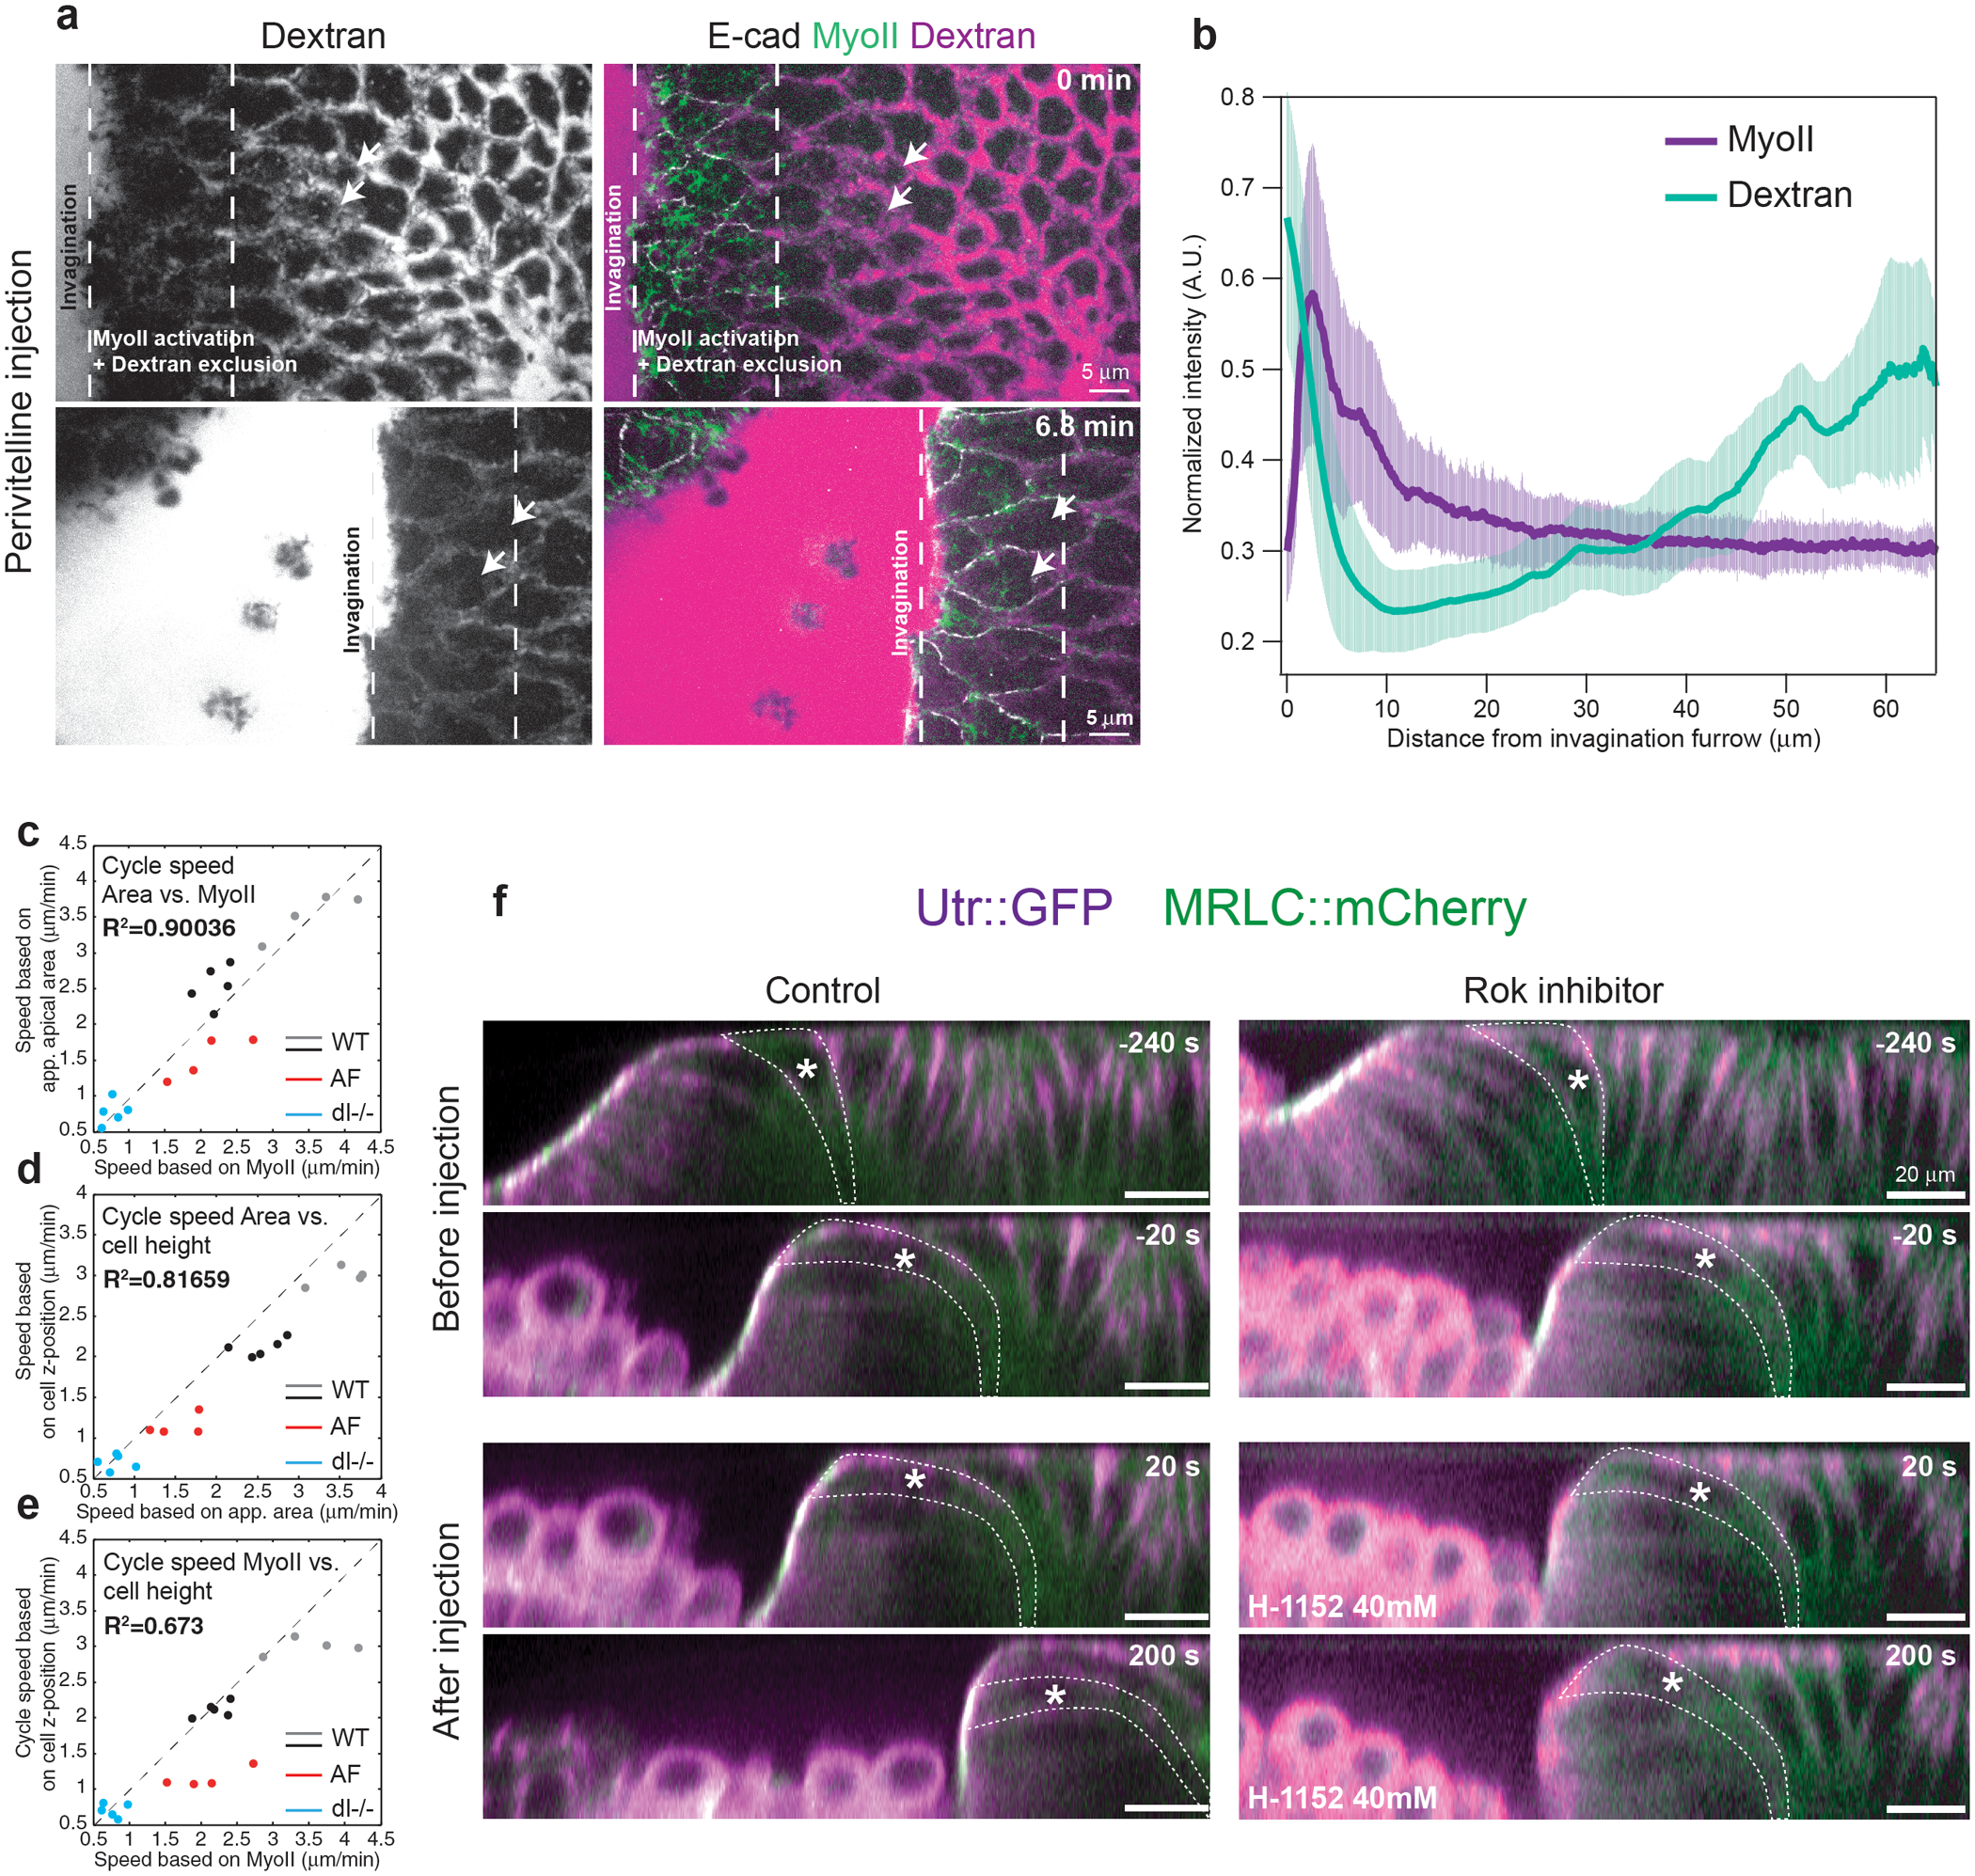
(a) Time-lapse of dextran injection in the perivitelline space. Dextran alone is on the left and merge images with Ecad and MyoII on the right. The arrows indicate the same two cells over time as the invaginating furrows approaches them. (b) Space-intensity plot of MyoII and dextran intensity in the propagation region. N=3 embryos, Mean±SD. (c-e) Scatter plots of the average speed of the mechanical cycle during wave propagation calculated from the MyoII activation front vs the speed calculated from the projected apical cell area or cell position along the apico-basal axis of the tissue for the indicated conditions (N=18 embryos). R2 values for a fit y=x are shown. (f) A control and an embryo injected with H-1152 (Rok inhibitor) during MyoII propagation. Reconstructed side views from confocal stacks are shown. White asterisks and dashed lines mark a single cell over time. Time t0 is the time of injection. N=2 embryos for both control (water) and H-1152 injected embryos.
Supplementary Material
Acknowledgements
We thank all members of the Lecuit and Lenne group for stimulating and useful discussions during the course of this project. We thank the IBDM imaging facility for assistance with maintenance of the microscopes, FlyBase for maintaining curated databases and Bloomington for providing fly stocks. This work was supported by the ERC grants Biomecamorph #323027 and SelfControl #788308. We are grateful to Pavel Tomancak for sharing with us the information regarding the expression pattern of Scab published in [Ref 48] and its function in Tribolium. C.C. was supported by a Human Frontier Science Program Long-Term Fellowship (LT000733/2011-L) and the CNRS, A.B. was supported by a PhD fellowship from the LabEx INFORM (ANR-11-LABX-0054) and of the A*MIDEX project (ANR-11-IDEX-0001-02), funded by the ‘Investissements d’Avenir French Government program’. E.M. was supported by NIGMS 1RO1 GM098441-06. We acknowledge the France-BioImaging infra-structure supported by the French National Research Agency (ANR-10-INBS-04-01, «Investments for the future»).
Footnotes
Supplementary information
Supplementary information is available in the online version of the paper.
The authors declare no competing financial interests.
Code availability
The custom codes used to process images analyze data and run simulations are available upon request.
Data Availability
The authors declare that the data supporting the findings of this study are available within the paper and its supplementary information files. Raw image data are available upon reasonable request.
References
- 1.Lecuit T & Lenne PF Cell surface mechanics and the control of cell shape, tissue patterns and morphogenesis. Nat Rev Mol Cell Biol 8, 633–644, doi: 10.1038/nrm2222 (2007). [DOI] [PubMed] [Google Scholar]
- 2.Gilmour D, Rembold M & Leptin M From morphogen to morphogenesis and back. Nature 541, 311–320, doi: 10.1038/nature21348 (2017). [DOI] [PubMed] [Google Scholar]
- 3.Leptin M Gastrulation in Drosophila: The logic and the cellular mechanisms. Embo Journal 18, 3187–3192, doi:DOI 10.1093/emboj/18.12.3187 (1999). [DOI] [PMC free article] [PubMed] [Google Scholar]
- 4.Heisenberg CP & Bellaiche Y Forces in tissue morphogenesis and patterning. Cell 153, 948–962, doi: 10.1016/j.cell.2013.05.008 (2013). [DOI] [PubMed] [Google Scholar]
- 5.Martin AC, Kaschube M & Wieschaus EF Pulsed contractions of an actin-myosin network drive apical constriction. Nature 457, 495–499, doi: 10.1038/nature07522 (2009). [DOI] [PMC free article] [PubMed] [Google Scholar]
- 6.Solon J, Kaya-Copur A, Colombelli J & Brunner D Pulsed forces timed by a ratchet-like mechanism drive directed tissue movement during dorsal closure. Cell 137, 1331–1342, doi: 10.1016/j.cell.2009.03.050 (2009). [DOI] [PubMed] [Google Scholar]
- 7.Roh-Johnson M et al. Triggering a cell shape change by exploiting preexisting actomyosin contractions. Science 335, 1232–1235, doi: 10.1126/science.1217869 (2012). [DOI] [PMC free article] [PubMed] [Google Scholar]
- 8.Martin AC & Goldstein B Apical constriction: themes and variations on a cellular mechanism driving morphogenesis. Development 141, 1987–1998, doi: 10.1242/dev.102228 (2014). [DOI] [PMC free article] [PubMed] [Google Scholar]
- 9.Mason FM, Tworoger M & Martin AC Apical domain polarization localizes actin-myosin activity to drive ratchet-like apical constriction. Nat Cell Biol 15, 926–936, doi: 10.1038/ncb2796 (2013). [DOI] [PMC free article] [PubMed] [Google Scholar]
- 10.Munjal A, Philippe JM, Munro E & Lecuit T A self-organized biomechanical network drives shape changes during tissue morphogenesis. Nature 524, 351–355, doi: 10.1038/nature14603 (2015). [DOI] [PubMed] [Google Scholar]
- 11.Marston DJ et al. MRCK-1 Drives Apical Constriction in C. elegans by Linking Developmental Patterning to Force Generation. Curr Biol 26, 2079–2089, doi: 10.1016/j.cub.2016.06.010 (2016). [DOI] [PMC free article] [PubMed] [Google Scholar]
- 12.Michaux JB, Robin FB, McFadden WM & Munro EM Excitable RhoA dynamics drive pulsed contractions in the early C. elegans embryo. J Cell Biol 217, 4230–4252, doi: 10.1083/jcb.201806161 (2018). [DOI] [PMC free article] [PubMed] [Google Scholar]
- 13.Kerridge S et al. Modular activation of Rho1 by GPCR signalling imparts polarized myosin II activation during morphogenesis. Nat Cell Biol 18, 261–270, doi: 10.1038/ncb3302 (2016). [DOI] [PubMed] [Google Scholar]
- 14.Manning AJ, Peters KA, Peifer M & Rogers SL Regulation of epithelial morphogenesis by the G protein-coupled receptor mist and its ligand fog. Sci Signal 6, ra98, doi: 10.1126/scisignal.2004427 (2013). [DOI] [PMC free article] [PubMed] [Google Scholar]
- 15.Costa M, Wilson ET & Wieschaus E A putative cell signal encoded by the folded gastrulation gene coordinates cell shape changes during Drosophila gastrulation. Cell 76, 1075–1089 (1994). [DOI] [PubMed] [Google Scholar]
- 16.Dawes-Hoang RE et al. folded gastrulation, cell shape change and the control of myosin localization. Development 132, 4165–4178, doi: 10.1242/dev.01938 (2005). [DOI] [PubMed] [Google Scholar]
- 17.Rauzi M, Lenne PF & Lecuit T Planar polarized actomyosin contractile flows control epithelial junction remodelling. Nature 468, 1110–1114, doi: 10.1038/nature09566 (2010). [DOI] [PubMed] [Google Scholar]
- 18.Munro E, Nance J & Priess JR Cortical flows powered by asymmetrical contraction transport PAR proteins to establish and maintain anterior-posterior polarity in the early C. elegans embryo. Dev Cell 7, 413–424, doi: 10.1016/j.devcel.2004.08.001 (2004). [DOI] [PubMed] [Google Scholar]
- 19.Kim HY & Davidson LA Punctuated actin contractions during convergent extension and their permissive regulation by the non-canonical Wnt-signaling pathway. J Cell Sci 124, 635–646, doi: 10.1242/jcs.067579 (2011). [DOI] [PMC free article] [PubMed] [Google Scholar]
- 20.Maitre JL, Niwayama R, Turlier H, Nedelec F & Hiiragi T Pulsatile cell-autonomous contractility drives compaction in the mouse embryo. Nat Cell Biol 17, 849–855, doi: 10.1038/ncb3185 (2015). [DOI] [PubMed] [Google Scholar]
- 21.Mayer M, Depken M, Bois JS, Julicher F & Grill SW Anisotropies in cortical tension reveal the physical basis of polarizing cortical flows. Nature 467, 617–621, doi: 10.1038/nature09376 (2010). [DOI] [PubMed] [Google Scholar]
- 22.Behrndt M et al. Forces driving epithelial spreading in zebrafish gastrulation. Science 338, 257–260, doi: 10.1126/science.1224143 (2012). [DOI] [PubMed] [Google Scholar]
- 23.Bement WM et al. Activator-inhibitor coupling between Rho signalling and actin assembly makes the cell cortex an excitable medium. Nature Cell Biology 17, 1471–1483, doi: 10.1038/ncb3251 (2015). [DOI] [PMC free article] [PubMed] [Google Scholar]
- 24.Nishikawa M, Naganathan SR, Julicher F & Grill SW Controlling contractile instabilities in the actomyosin cortex. Elife 6, doi: 10.7554/eLife.19595 (2017). [DOI] [PMC free article] [PubMed] [Google Scholar]
- 25.Fernandez-Gonzalez R, Simoes Sde M, Roper JC, Eaton S & Zallen JA Myosin II dynamics are regulated by tension in intercalating cells. Dev Cell 17, 736–743, doi: 10.1016/j.devcel.2009.09.003 (2009). [DOI] [PMC free article] [PubMed] [Google Scholar]
- 26.Chanet S et al. Actomyosin meshwork mechanosensing enables tissue shape to orient cell force. Nat Commun 8, 15014, doi: 10.1038/ncomms15014 (2017). [DOI] [PMC free article] [PubMed] [Google Scholar]
- 27.Mitrossilis D et al. Mechanotransductive cascade of Myo-II-dependent mesoderm and endoderm invaginations in embryo gastrulation. Nat Commun 8, 13883, doi: 10.1038/ncomms13883 (2017). [DOI] [PMC free article] [PubMed] [Google Scholar]
- 28.Tan PY & Zaidel-Bar R Transient membrane localization of SPV-1 drives cyclical actomyosin contractions in the C. elegans spermatheca. Curr Biol 25, 141–151, doi: 10.1016/j.cub.2014.11.033 (2015). [DOI] [PubMed] [Google Scholar]
- 29.Collinet C, Rauzi M, Lenne PF & Lecuit T Local and tissue-scale forces drive oriented junction growth during tissue extension. Nat Cell Biol 17, 1247–1258, doi: 10.1038/ncb3226 (2015). [DOI] [PubMed] [Google Scholar]
- 30.Lye CM et al. Mechanical Coupling between Endoderm Invagination and Axis Extension in Drosophila. PLoS Biol 13, e1002292, doi: 10.1371/journal.pbio.1002292 (2015). [DOI] [PMC free article] [PubMed] [Google Scholar]
- 31.Young PE, Pesacreta TC & Kiehart DP Dynamic changes in the distribution of cytoplasmic myosin during Drosophila embryogenesis. Development 111, 1–14 (1991). [DOI] [PubMed] [Google Scholar]
- 32.Sweeton D, Parks S, Costa M & Wieschaus E Gastrulation in Drosophila: the formation of the ventral furrow and posterior midgut invaginations. Development 112, 775–789 (1991). [DOI] [PubMed] [Google Scholar]
- 33.Casanova J & Struhl G Localized Surface-Activity of Torso, a Receptor Tyrosine Kinase, Specifies Terminal Body Pattern in Drosophila. Gene Dev 3, 2025–2038, doi:DOI 10.1101/gad.3.12b.2025 (1989). [DOI] [PubMed] [Google Scholar]
- 34.Weigel D, Jurgens G, Klingler M & Jackle H Two gap genes mediate maternal terminal pattern information in Drosophila. Science 248, 495–498 (1990). [DOI] [PubMed] [Google Scholar]
- 35.Garcia HG, Tikhonov M, Lin A & Gregor T Quantitative imaging of transcription in living Drosophila embryos links polymerase activity to patterning. Curr Biol 23, 2140–2145, doi: 10.1016/j.cub.2013.08.054 (2013). [DOI] [PMC free article] [PubMed] [Google Scholar]
- 36.Edgar BA, Lehman DA & O’Farrell PH Transcriptional regulation of string (cdc25): a link between developmental programming and the cell cycle. Development 120, 3131–3143 (1994). [DOI] [PMC free article] [PubMed] [Google Scholar]
- 37.Pare AC et al. A positional Toll receptor code directs convergent extension in Drosophila. Nature 515, 523–527, doi: 10.1038/nature13953 (2014). [DOI] [PMC free article] [PubMed] [Google Scholar]
- 38.Kerszberg M & Wolpert L Mechanisms for positional signalling by morphogen transport: a theoretical study. J Theor Biol 191, 103–114, doi: 10.1006/jtbi.1997.0575 (1998). [DOI] [PubMed] [Google Scholar]
- 39.Lander AD, Nie Q & Wan FY Do morphogen gradients arise by diffusion? Dev Cell 2, 785–796 (2002). [DOI] [PubMed] [Google Scholar]
- 40.Seher TC, Narasimha M, Vogelsang E & Leptin M Analysis and reconstitution of the genetic cascade controlling early mesoderm morphogenesis in the Drosophila embryo. Mech Dev 124, 167–179, doi: 10.1016/j.mod.2006.12.004 (2007). [DOI] [PubMed] [Google Scholar]
- 41.Heissler SM & Sellers JR Kinetic Adaptations of Myosins for Their Diverse Cellular Functions. Traffic 17, 839–859, doi: 10.1111/tra.12388 (2016). [DOI] [PMC free article] [PubMed] [Google Scholar]
- 42.Geiger B, Spatz JP & Bershadsky AD Environmental sensing through focal adhesions. Nat Rev Mol Cell Biol 10, 21–33, doi: 10.1038/nrm2593 (2009). [DOI] [PubMed] [Google Scholar]
- 43.Iskratsch T, Wolfenson H & Sheetz MP Appreciating force and shape-the rise of mechanotransduction in cell biology. Nat Rev Mol Cell Biol 15, 825–833, doi: 10.1038/nrm3903 (2014). [DOI] [PMC free article] [PubMed] [Google Scholar]
- 44.Rauzi M et al. Embryo-scale tissue mechanics during Drosophila gastrulation movements. Nat Commun 6, 8677, doi: 10.1038/ncomms9677 (2015). [DOI] [PMC free article] [PubMed] [Google Scholar]
- 45.Odell GM, Oster G, Alberch P & Burnside B The mechanical basis of morphogenesis. I. Epithelial folding and invagination. Dev Biol 85, 446–462 (1981). [DOI] [PubMed] [Google Scholar]
- 46.He B, Doubrovinski K, Polyakov O & Wieschaus E Apical constriction drives tissue-scale hydrodynamic flow to mediate cell elongation. Nature 508, 392–396, doi: 10.1038/nature13070 (2014). [DOI] [PMC free article] [PubMed] [Google Scholar]
- 47.Stark KA et al. A novel alpha integrin subunit associates with betaPS and functions in tissue morphogenesis and movement during Drosophila development. Development 124, 4583–4594 (1997). [DOI] [PubMed] [Google Scholar]
- 48.Munster S et al. Attachment of the blastoderm to the vitelline envelope affects gastrulation of insects. Nature 568, 395–399, doi: 10.1038/s41586-019-1044-3 (2019). [DOI] [PubMed] [Google Scholar]
- 49.Gelens L, Anderson GA & Ferrell JE Jr. Spatial trigger waves: positive feedback gets you a long way. Mol Biol Cell 25, 3486–3493, doi: 10.1091/mbc.E14-08-1306 (2014). [DOI] [PMC free article] [PubMed] [Google Scholar]
- 50.Allard J & Mogilner A Traveling waves in actin dynamics and cell motility. Curr Opin Cell Biol 25, 107–115, doi: 10.1016/j.ceb.2012.08.012 (2013). [DOI] [PMC free article] [PubMed] [Google Scholar]
- 51.Diz-Munoz A, Fletcher DA & Weiner OD Use the force: membrane tension as an organizer of cell shape and motility. Trends Cell Biol 23, 47–53, doi: 10.1016/j.tcb.2012.09.006 (2013). [DOI] [PMC free article] [PubMed] [Google Scholar]
- 52.Hashimoto H, Robin FB, Sherrard KM & Munro EM Sequential contraction and exchange of apical junctions drives zippering and neural tube closure in a simple chordate. Dev Cell 32, 241–255, doi: 10.1016/j.devcel.2014.12.017 (2015). [DOI] [PubMed] [Google Scholar]
- 53.Morize P, Christiansen AE, Costa M, Parks S & Wieschaus E Hyperactivation of the folded gastrulation pathway induces specific cell shape changes. Development 125, 589–597 (1998). [DOI] [PubMed] [Google Scholar]
- 54.Huang J, Zhou W, Dong W, Watson AM & Hong Y From the Cover: Directed, efficient, and versatile modifications of the Drosophila genome by genomic engineering. Proc Natl Acad Sci U S A 106, 8284–8289, doi: 10.1073/pnas.0900641106 (2009). [DOI] [PMC free article] [PubMed] [Google Scholar]
- 55.Venken KJ et al. Versatile P[acman] BAC libraries for transgenesis studies in Drosophila melanogaster. Nat Methods 6, 431–434, doi: 10.1038/nmeth.1331 (2009). [DOI] [PMC free article] [PubMed] [Google Scholar]
- 56.Bertet C, Sulak L & Lecuit T Myosin-dependent junction remodelling controls planar cell intercalation and axis elongation. Nature 429, 667–671, doi: 10.1038/nature02590 (2004). [DOI] [PubMed] [Google Scholar]
- 57.Cavey M & Lecuit T Imaging cellular and molecular dynamics in live embryos using fluorescent proteins. Methods Mol Biol 420, 219–238, doi: 10.1007/978-1-59745-583-1_13 (2008). [DOI] [PubMed] [Google Scholar]
- 58.Muller HA Immunolabeling of embryos. Methods Mol Biol 420, 207–218, doi: 10.1007/978-1-59745-583-1_12 (2008). [DOI] [PMC free article] [PubMed] [Google Scholar]
- 59.Fuse N, Yu F & Hirose S Gprk2 adjusts Fog signaling to organize cell movements in Drosophila gastrulation. Development 140, 4246–4255, doi: 10.1242/dev.093625 (2013). [DOI] [PubMed] [Google Scholar]
- 60.Kosman D, Small S & Reinitz J Rapid preparation of a panel of polyclonal antibodies to Drosophila segmentation proteins. Dev Genes Evol 208, 290–294 (1998). [DOI] [PubMed] [Google Scholar]
- 61.Aigouy B et al. Cell flow reorients the axis of planar polarity in the wing epithelium of Drosophila. Cell 142, 773–786, doi: 10.1016/j.cell.2010.07.042 (2010). [DOI] [PubMed] [Google Scholar]
- 62.Butler LC et al. Cell shape changes indicate a role for extrinsic tensile forces in Drosophila germ-band extension. Nat Cell Biol 11, 859–864, doi: 10.1038/ncb1894 (2009). [DOI] [PubMed] [Google Scholar]
Associated Data
This section collects any data citations, data availability statements, or supplementary materials included in this article.
Supplementary Materials
Data Availability Statement
The authors declare that the data supporting the findings of this study are available within the paper and its supplementary information files. Raw image data are available upon reasonable request.


