

Key Points
Question
Was the US Veterans Affairs initiative to distribute video-enabled tablets during COVID-19 associated with mental health care access, suicide behavior, or emergency department (ED) visits among rural veterans?
Findings
In this retrospective cohort study of 471 791 rural US veterans with a history of mental health care use, receipt of a video-enabled tablet was associated with increased use of mental health care via video, increased psychotherapy visits (across all modalities), and reduced suicide behavior and ED visits.
Meaning
These findings suggest that video-enabled tablets may provide access to critical services for rural patients with mental health needs and reduce instances of suicide behavior and ED visits among them.
This cohort study evaluates the association between the distribution of the US Veterans Affairs’ video-enabled tablets during the COVID-19 pandemic and rural veterans’ mental health service use and suicide-related outcomes.
Abstract
Importance
Suicide rates are rising disproportionately in rural counties, a concerning pattern as the COVID-19 pandemic has intensified suicide risk factors in these regions and exacerbated barriers to mental health care access. Although telehealth has the potential to improve access to mental health care, telehealth’s effectiveness for suicide-related outcomes remains relatively unknown.
Objective
To evaluate the association between the escalated distribution of the US Department of Veterans Affairs’ (VA’s) video-enabled tablets during the COVID-19 pandemic and rural veterans’ mental health service use and suicide-related outcomes.
Design, Setting, and Participants
This retrospective cohort study included rural veterans who had at least 1 VA mental health care visit in calendar year 2019 and a subcohort of patients identified by the VA as high-risk for suicide. Event studies and difference-in-differences estimation were used to compare monthly mental health service utilization for patients who received VA tablets during COVID-19 with patients who were not issued tablets over 10 months before and after tablet shipment. Statistical analysis was performed from November 2021 to February 2022.
Exposure
Receipt of a video-enabled tablet.
Main Outcomes and Measures
Mental health service utilization outcomes included psychotherapy visits, medication management visits, and comprehensive suicide risk evaluations (CSREs) via video and total visits across all modalities (phone, video, and in-person). We also analyzed likelihood of emergency department (ED) visit, likelihood of suicide-related ED visit, and number of VA’s suicide behavior and overdose reports (SBORs).
Results
The study cohort included 13 180 rural tablet recipients (11 617 [88%] men; 2161 [16%] Black; 301 [2%] Hispanic; 10 644 [80%] White; mean [SD] age, 61.2 [13.4] years) and 458 611 nonrecipients (406 545 [89%] men; 59 875 [13%] Black or African American; 16 778 [4%] Hispanic; 384 630 [83%] White; mean [SD] age, 58.0 [15.8] years). Tablets were associated with increases of 1.8 psychotherapy visits per year (monthly coefficient, 0.15; 95% CI, 0.13-0.17), 3.5 video psychotherapy visits per year (monthly coefficient, 0.29; 95% CI, 0.27-0.31), 0.7 video medication management visits per year (monthly coefficient, 0.06; 95% CI, 0.055-0.062), and 0.02 video CSREs per year (monthly coefficient, 0.002; 95% CI, 0.002-0.002). Tablets were associated with an overall 20% reduction in the likelihood of an ED visit (proportion change, −0.012; 95% CI, −0.014 to −0.010), a 36% reduction in the likelihood of suicide-related ED visit (proportion change, −0.0017; 95% CI, −0.0023 to −0.0013), and a 22% reduction in the likelihood of suicide behavior as indicated by SBORs (monthly coefficient, −0.0011; 95% CI, −0.0016 to −0.0005). These associations persisted for the subcohort of rural veterans the VA identifies as high-risk for suicide.
Conclusions and Relevance
This cohort study of rural US veterans with a history of mental health care use found that receipt of a video-enabled tablet was associated with increased use of mental health care via video, increased psychotherapy visits (across all modalities), and reduced suicide behavior and ED visits. These findings suggest that the VA and other health systems should consider leveraging video-enabled tablets for improving access to mental health care via telehealth and for preventing suicides among rural residents.
Introduction
US suicide rates are at their highest since World War II.1 The US veterans’ suicide rate is 1.5 times that of nonveterans2,3 and veterans in rural (vs urban) areas are more likely to die by suicide. Suicide is disproportionately affecting rural (vs urban) residents (17.32 vs 11.92 per 100 000 people),4,5,6,7 partly because of challenging demographic trends such as growing unemployment and lack of health care resources in rural areas, which have been exacerbated by the COVID-19 pandemic.5,6,8,9,10 The pandemic has also intensified suicide risk factors8,11—social isolation, intimate partner violence, and firearm access8,12—which disproportionately affect rural residents. Reduced interaction with routine health care during the pandemic has reduced opportunities to screen and treat rural residents for suicide risk.8,13 Experts have recommended that for rural patients at risk for suicide, ensuring continued access to mental health care via telehealth is crucial.8
The US Department of Veterans Affairs (VA) has been leading efforts to expand telehealth and to improve access to care for veterans residing in rural areas.5,14 The VA’s substantial efforts to improve access for rural veterans during the years 2007 to 2012 likely helped reduce the rural-urban disparity in psychotherapy access, a first-line treatment for most mental health conditions, including suicide risk.5,14,15 Nevertheless, the rural-urban disparity persists as rural veterans continually face challenges related to availability, accessibility, and acceptability of psychotherapy services.14 Although telehealth can improve access to mental health care,16 there is insufficient evidence regarding rural veterans’ engagement via virtual modalities14 and about telehealth’s effectiveness for suicide prevention.17,18,19
In 2016, the VA’s Office of Rural Health and Office of Connected Care began distributing video-enabled tablets to veterans with access barriers to facilitate their participation in home-based telehealth.20,21 The VA’s tablet distribution efforts intensified during the COVID-19 pandemic. As of September 1, 2021, there were 106 451 tablets in circulation, 93% of which were issued during the pandemic, and approximately one-third of those were issued to veterans living in rural areas. The VA-issued tablets present an opportunity to pilot a scenario in which rural veterans face 1 less barrier to accessing home-based telehealth: smart device ownership. To inform telehealth-related policies, especially pertaining to suicide prevention among rural veterans, we evaluated associations between the VA’s video-enabled tablets issued during COVID-19 and frequency of mental health service use, suicide-related behavior, and emergency department (ED) visits among rural veterans with indicated mental health care needs and within a subcohort VA identified as high-risk for suicide.
Methods
Study Cohort
This cohort study included all rural patients who had at least 1 VA mental health care visit in the year 2019 (eFigure 1 in the Supplement). Data on VA patients and visits were obtained from the VA’s Corporate Data Warehouse (CDW), a VA electronic health records repository. Mental health care visits were identified using VA Managerial Cost Accounting stop codes used for characterizing outpatient visits.22 Rurality was defined as Rural-Urban Commuting Areas codes other than 1 or 1.1.23 Veterans were classified as tablet recipients if they received tablets between March 16, 2020, and April 30, 2021. Veterans who received VA tablets outside this period or received VA smartphones were excluded to isolate associations with VA tablets issued during COVID-19. For all veterans, data were obtained 10 months before the baseline month. Veterans were followed until June 30, 2021; we attempted to observe data 10 months posttablet for most veterans. Our subcohort included rural veterans considered high-risk for suicide using VA’s predictive model that analyzes veterans’ health record data.24
This study was designated by the VA’s Office of Rural Health as nonresearch quality improvement and was exempted from review by the Stanford institutional review board, and a waiver of informed patient consent was granted because the study used retrospective observational electronic health records data and data were reported in an aggregate manner in which patients were not identifiable. This study followed the Strengthening the Reporting of Observational Studies in Epidemiology (STROBE) reporting guideline.
Intervention
Veterans were eligible to receive the VA’s video-enabled tablets with data plans if they did not own a device with broadband or cellular internet service, had an access barrier such as living far from the VA or another transportation challenge, and were able to physically and cognitively operate a tablet. Clinicians initiated tablet consultation meetings for patients they thought would qualify. If veterans were considered eligible, tablets were ordered to be mailed to those veterans. Data regarding tablet recipients and tablet shipment dates were obtained from the VA’s Denver Acquisitions and Logistics Center.20,21
Outcomes
Mental health utilization outcomes included psychotherapy visits, medication management visits and comprehensive suicide risk evaluations (CSREs) via video and total visits across all modalities (phone, video, and in-person). Other outcomes were likelihood of ED visit, likelihood of suicide-related ED visit, and number of VA’s suicide behavior and overdose reports (SBORs).
Psychotherapy visits were defined using Current Procedural Terminology codes, and medication management visits were defined as encounters with psychiatrists or other mental health clinicians qualified to prescribe medications (eTable 2, eTable 3, eTable 4, eTable 5, and eTable 6 in the Supplement). CSREs are standardized VA templates used for assessing suicide risk for high-risk veterans and include in-depth questions related to suicidal ideation, history of attempts, warning signs, risk factors, protective factors and reasons for living.25,26 SBORs are standardized VA templates that may be completed by the first clinical staff member who learns of a veteran’s suicide event or overdose.19,26,27
Visit data were obtained from the VA’s CDW. Video visits were identified using VA stop codes of 179, 648, and 679, which indicated clinic-to-home and clinic-to-other/non-VA settings video telehealth care.22 Data on CSREs and SBORs were obtained from the VA’s Program Evaluation Resource Center (PERC).28 Data on ED visits were obtained from the VA’s CDW. Suicide-related ED visits were identified using PERC’s list of suicide-related International Statistical Classification of Diseases and Related Health Problems, Tenth Revision (ICD-10) diagnosis codes (eTable 7 and eTable 8 in the Supplement). In sensitivity analyses, we used alternate suicide-related ICD-10 codes from prior studies.29,30
Covariates
All models were adjusted for veterans’ age, sex, race, number of physical and mental health chronic conditions (eTable 9 in the Supplement),22,31,32,33 indicators for diagnoses of substance use disorder (SUD), posttraumatic stress disorder (PTSD) and depression, VA-estimated 1-year probability of hospitalization or death called VA Care Assessment Needs (CAN) score,34 VA priority-based enrollment categories (based on veterans’ service-connected disabilities and other factors22,35), marital status, homelessness, high suicide risk indicator, and monthly COVID-19 cases in patients’ counties. To account for any remaining fixed difference between tablet recipients and nonrecipients, we included an indicator for being a tablet recipient. We included fixed effects for patients’ closest secondary care facility to control for any time-invariant facility characteristics. We included month fixed effects to control for shocks or events of each month. Month fixed effects, among other things, controlled for the pandemic in any given month.
Age, sex, race and ethnicity, diagnoses, CAN score, VA priority-based and marital status were obtained from the VA’s CDW electronic health record data. We adjusted for race and ethnicity in our models because these factors may influence outcomes. Distances to patients’ closest facilities were obtained from the VA’s Planning Systems Support Group. Homelessness was defined using outpatient stop codes indicating use of the VA’s homeless services and diagnosis codes.22 Data on county-level COVID-19 cases were obtained from The New York Times.36
Statistical Analysis
We used event studies37,38,39 and difference-in-differences (DiD) estimation to compare outcomes for veterans who received VA-issued tablets and veterans who never received tablets, before and after tablet shipment. DiD estimation leverages a comparison group not exposed to tablets to adjust for temporal variation in outcomes that was not due to treatment exposure.40 DiD assumes treatment and control groups would have exhibited similar or parallel trends in the absence of treatment (tablets in our case). Recent developments in DiD methods show that with variation in treatment timing (ie, differential timing of tablet shipment across veterans), event studies improve on the usual DiD estimator.41,42,43 Event studies provide DiD estimates for each period (each month in our case) prior to and after treatment (ie, pretablet and posttablet shipment).41,43 Pretreatment (or pretablet) model-adjusted differences between the treatment group (vs control) are visually assessed for significance or trending that could obscure or mask true differences in the posttreatment period.41,43,44 Pretreatment trends provide important context for interpreting posttreatment differences.44 The absence of pretreatment associations or trends, followed by abruptly different and significant posttreatment associations strengthen attributability of associations to the treatment (tablets).41,43,44 In this study, the intervention variable for event studies was month-relative-to-tablet-shipment, where shipment month was relative month 0. We excluded relative months −1 and 0 to avoid attributing tablet assignment- and setup-related visits to tablet-associated outcomes, making relative month −2 (ie, 2 months prior to tablet shipment) the baseline month. For estimating usual DiD estimates, the intervention variable was the interaction between indicators for tablet recipient and posttablet (method details in eAppendix 1 in the Supplement). In sensitivity analyses, we conducted the same analyses with a subcohort of matched veterans, using 1:1 nearest neighbor matching.45,46
The statistical significance threshold was P < .05, and all testing was 2-sided. All statistical analyses were conducted in Stata version 15.1 (StataCorp) from November 2021 to February 2022.
Results
Table 1 presents unadjusted baseline characteristics for 13 180 veterans living in rural areas who received tablets (11 617 [88%] men; 2161 [16%] Black or African American; 301 [2%] Hispanic; 10 644 [80%] White; mean [SD] age, 61.2 [13.4] years) and 458 611 veterans who did not receive tablets (406 545 [89%] men; 59 875 [13%] Black or African American; 16 778 [4%] Hispanic; 384 630 [83%] White; mean [SD] age, 58.0 [15.8] years). The follow-up period ranged from 1 to 10 months with a mean of 8.7 months and a median of 10 months.
Table 1. Unadjusted Baseline Characteristics for Tablet Recipients and Nonrecipients.
| Characteristic | Participants, No. (%) | P valuea | |
|---|---|---|---|
| Rural tablet nonrecipients (n = 458 611) | Rural tablet recipients (n = 13 180) | ||
| Outcomes | |||
| Any psychotherapy visit | 56 775 (12) | 2534 (19) | <.001 |
| Any video psychotherapy visit | 640 (0.1) | 673 (5) | <.001 |
| Any video medication management visit | 378 (0.1) | 317 (2) | <.001 |
| Any video visit for a Comprehensive Suicide Risk Evaluation | 14 (0.003) | 17 (0.013) | <.001 |
| Any ED visit | 25 050 (5) | 775 (6) | <.001 |
| Any suicide-related ED visit | 850 (0.2) | 68 (0.5) | <.001 |
| Any VA suicide behavior or overdose report | 576 (0.1) | 64 (0.5) | <.001 |
| Covariates | |||
| Sex | |||
| Male | 406 545 (89) | 11 617 (88) | .07 |
| Female | 52 066 (11) | 1563 (12) | .07 |
| Age, mean (SD) | 58.0 (15.8) | 61.2 (13.4) | <.001 |
| Homeless | 9005 (2) | 924 (7) | <.001 |
| Distance to closest VA primary care site, mean | 25.5 | 23.8 | <.001 |
| No. of physical chronic conditions in 2019, mean | 4.5 | 5.5 | <.001 |
| No. of mental chronic conditions, mean | 1.8 | 2.3 | <.001 |
| Diagnosed with substance use disorder in 2019 | 76 779 (17) | 3615 (27) | <.001 |
| Diagnosed with PTSD in 2019 | 208 359 (45) | 6687 (51) | <.001 |
| Diagnosed with depression in 2019 | 222 653 (49) | 7476 (57) | <.001 |
| VA Care Assessment Needs score | 0.1 | 0.2 | <.001 |
| VA classification of high-risk for suicideb | |||
| Never classified as high-risk for suicide | 443 106 (97) | 12 023 (91) | <.001 |
| Classified as high-risk for suicide (but < top 1% of risk) | 14 551 (3) | 1009 (8) | <.001 |
| Classified as top 1% of suicide risk | 954 (0.2) | 148 (1) | <.001 |
| VA priority-based enrollment categories | |||
| 1 | 270 364 (59) | 7345 (56) | <.001 |
| 2 | 31 856 (7) | 810 (6) | <.001 |
| 3 | 40 009 (9) | 1138 (9) | .72 |
| 4 | 10 623 (2) | 627 (5) | <.001 |
| 5 | 66 682 (15) | 2639 (20) | <.001 |
| 6 | 8459 (2) | 106 (1) | <.001 |
| 7 | 4504 (1) | 90 (1) | <.001 |
| 8 | 26 114 (6) | 425 (3) | <.001 |
| Ethnicity | |||
| Hispanic | 16 778 (4) | 301 (2) | <.001 |
| Not Hispanic | 435 235 (95) | 12 705 (97) | |
| Unknown | 6598 (1) | 174 (1) | .26 |
| Race | |||
| American Indian or Alaska Native | 8208 (2) | 245 (2) | .56 |
| Asian | 2107 (0.5) | 39 (0.3) | .006 |
| Black or African American | 59 875 (13) | 2161 (16) | <.001 |
| Native Hawaiian or other Pacific Islander | 3791 (1) | 91 (1) | .09 |
| White | 384 630 (83) | 10 644 (80) | <.001 |
| Marital status | |||
| Divorced | 108 606 (24) | 3837 (29) | <.001 |
| Married | 253 143 (55) | 6091 (46) | <.001 |
| Separated | 17 750 (4) | 685 (5) | <.001 |
| Widowed | 15 296 (3) | 565 (4) | <.001 |
| Unknown | 4539 (1) | 65 (0.5) | <.001 |
Abbreviations: ED, emergency department; PTSD, posttraumatic stress disorder; VA, US Department of Veterans Affairs.
Differences in proportions of dichotomous variables were tested using the Pearson χ2 test. Differences in means of continuous variables were tested using the 2-sample t test.
The VA classifies veterans as high-risk for suicide using the VA’s model that analyzes existing data from veterans’ health records to identify statistically elevated risk for suicide, hospitalization, illness, or other adverse outcomes.
Table 1 shows that recipients and nonrecipients were similar with respect to their sex distribution, distance to closest primary care site, and priority-based enrollment categories. Compared with nonrecipients, tablet recipients had higher mean (SD) age (61.2 [13.4] years vs 58.0 [15.8] years; P < .001), were more likely to be homeless (7% [n = 924] vs 2% [n = 9005]; P < .001), had higher mean (SD) physical chronic conditions (5.5 [3.3] vs 4.5 [3.1]; P < .001) and mental chronic conditions (2.3 [1.4]vs 1.8 [1.2]; P < .001), were more likely to be diagnosed with SUD (27% [n = 3615] vs 17% [n = 76 779]; P < .001), PTSD (51% [n = 6687] vs 45% [n = 208 359]; P < .001), or depression (57% [n = 7476] vs 49% [n = 222 653]; P < .001), had higher clinical risk based on CAN score (0.2 [0.2] vs 0.1 [0.1]; P < .001), and were more likely to be classified as high-risk for suicide (8% [n = 1009] vs 3% [n = 14 551]; P < .001). Tablet recipients were more likely to be Black or African American (16% [n = 2161] vs 13% [n = 59 875]; P < .001) and were less likely to be married (46% [n = 6091] vs 55% [n = 253 143]; P < .001).
Figure 1 and Figure 2 present model-adjusted mean differences in frequency of visits between tablet recipients, compared with baseline or nonrecipients. Figures 1 and 2 broadly show that after adjusting for covariates, there were few significant differences in outcomes between recipients and nonrecipients and no meaningful trending in these differences in the months prior to tablet shipment, followed by significant associations posttablet shipment. Calendar-time graphs demonstrated that the pandemic did not differentially affect tablet recipients and nonrecipients such that nonrecipients provided a strong counterfactual trend for recipients even during the COVID-19 period (eFigure3 in Supplement). We did not find significant associations between tablets and visits for medication management visits or CSREs across all modalities (eFigure 2 in the Supplement). For video psychotherapy visits (Figure 1), there was slight upward trending prior to tablet shipment (ie, tablet recipients appeared to be increasing video psychotherapy visits slightly over time compared with their baseline and compared with tablet nonrecipients prior to tablet shipment). However, posttablet shipment associations were abruptly different than the pretablet trend such that associations did not seem mere continuation of the pretablet trend. For all outcomes, results were similar for the same analyses conducted using the matched subcohort of veterans.
Figure 1. Event Study Estimates of Adjusted Differences in Mental Health Service Use for Tablet Recipients vs Recipients’ Baseline and Nonrecipients.
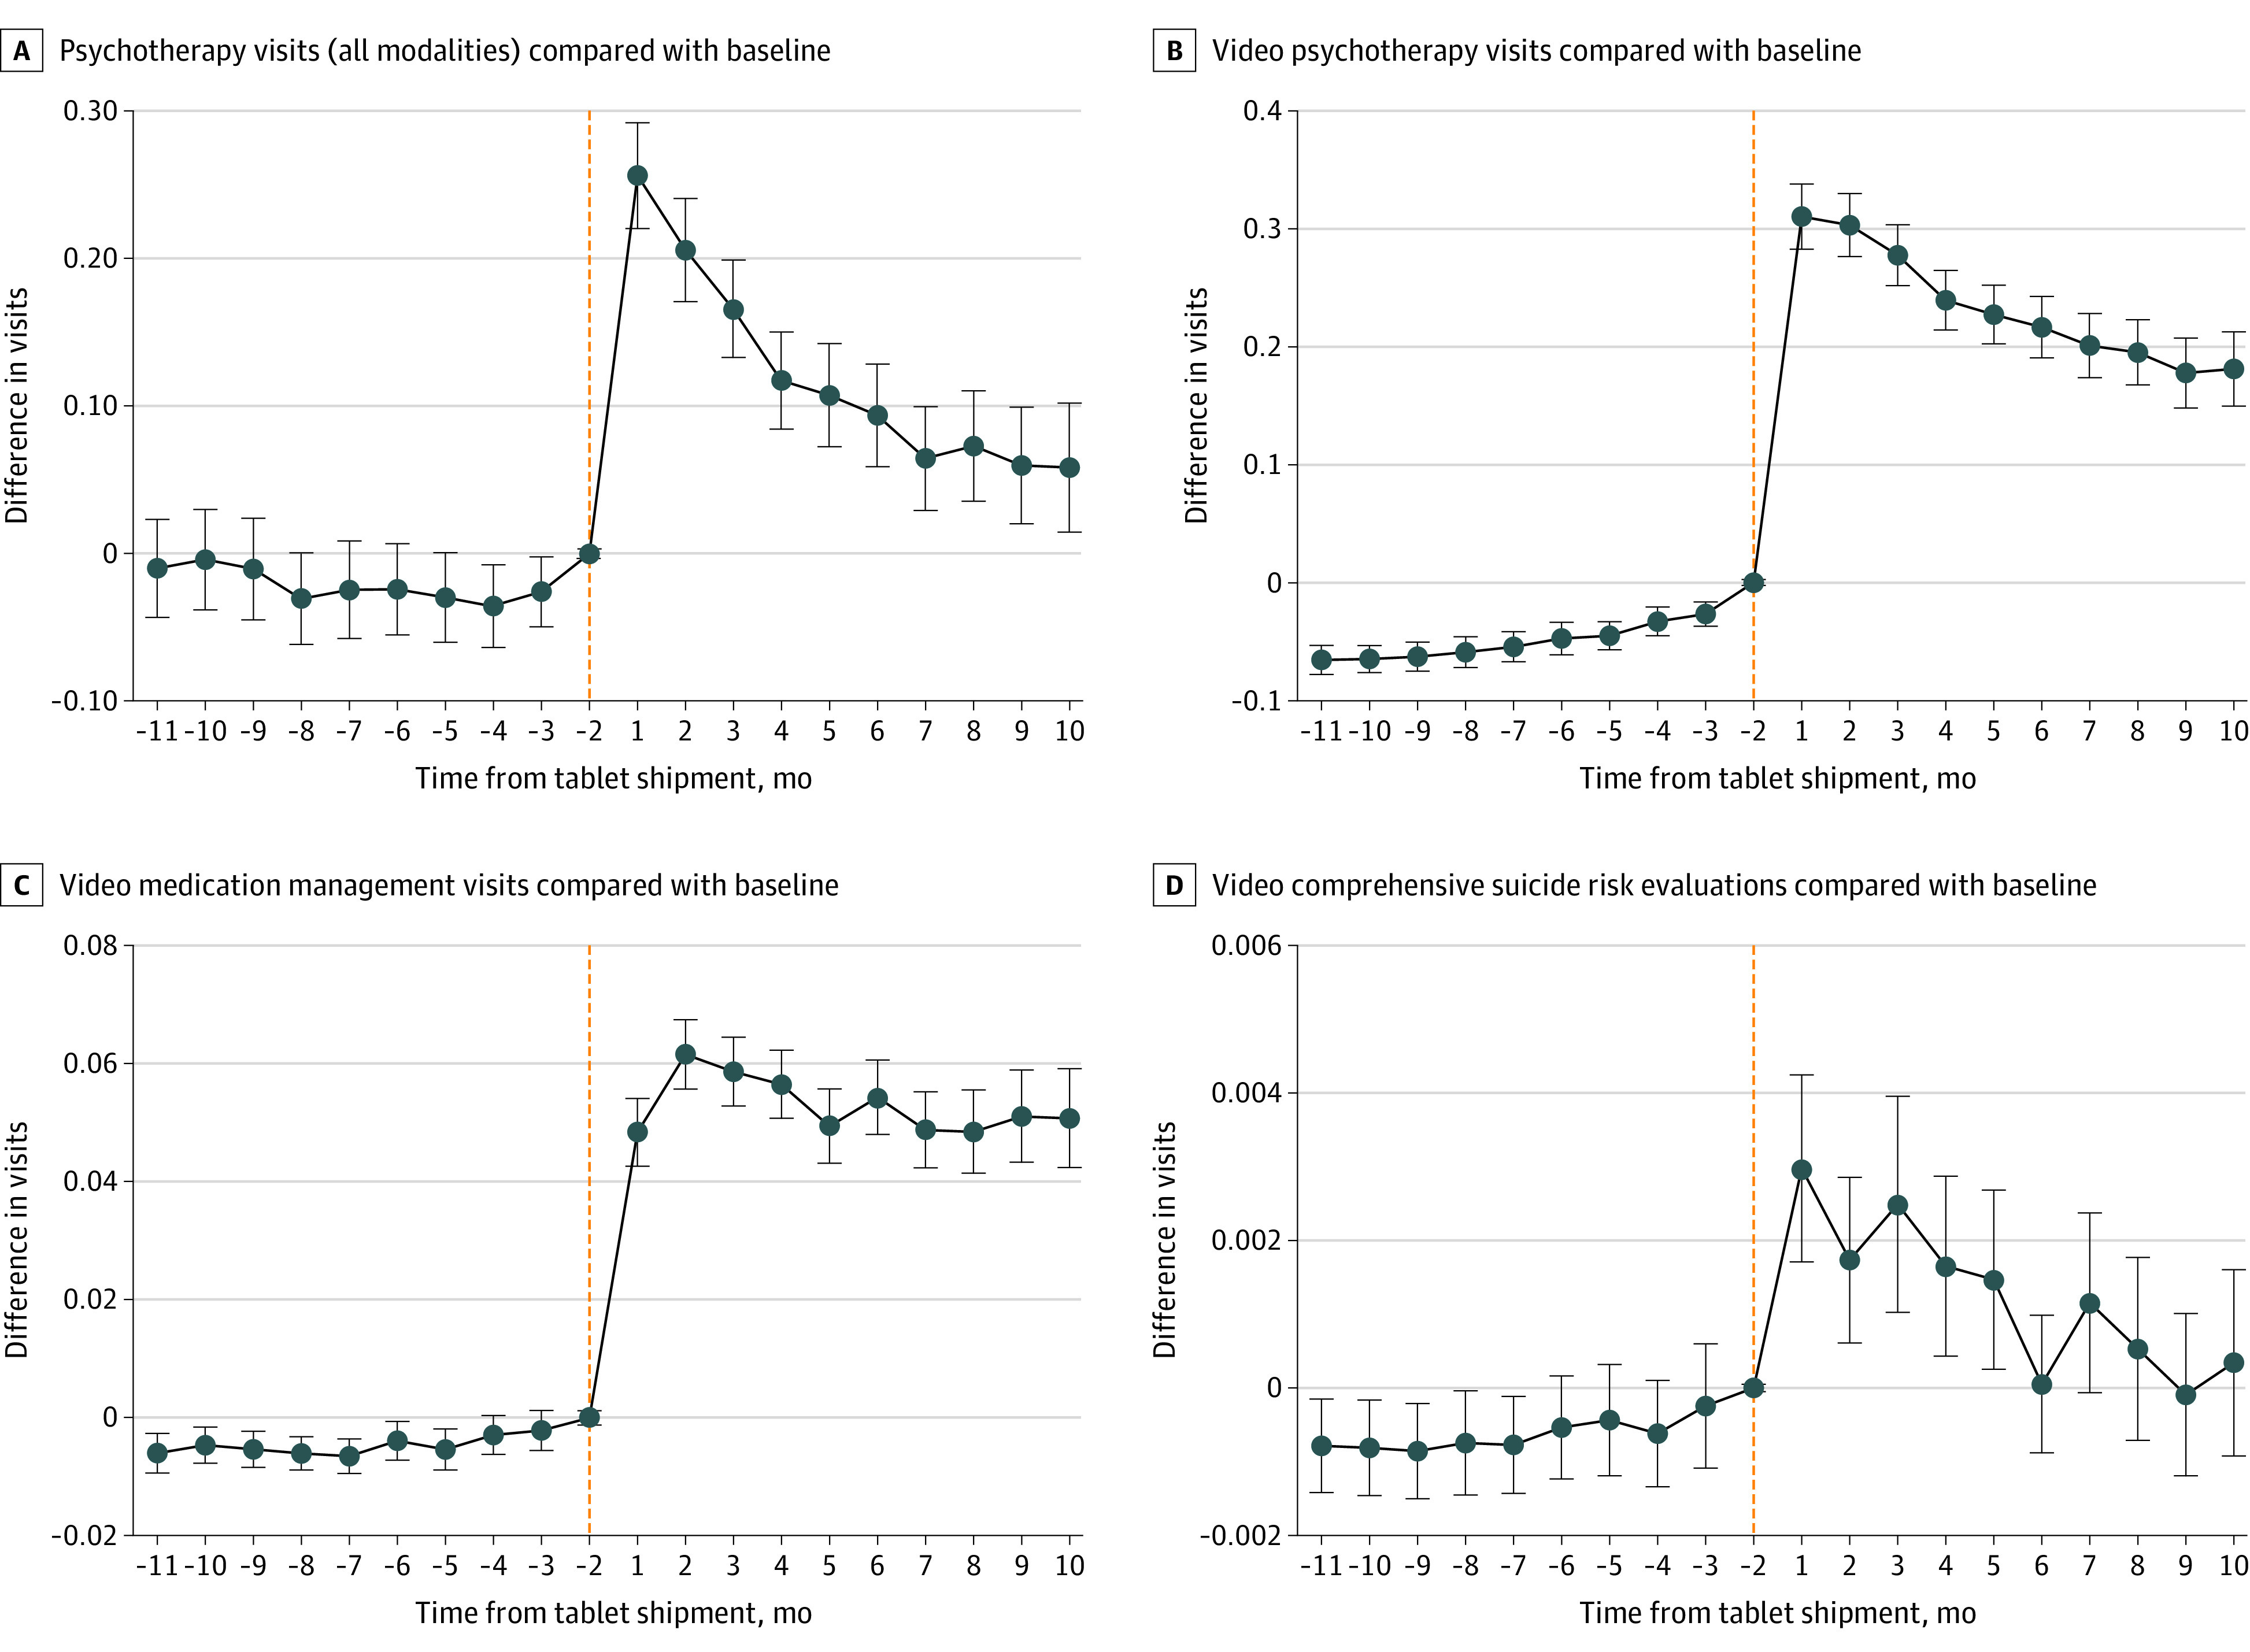
Month −1 and month 0 were excluded because treatment assignment (ie, tablet assignment) likely occurred in these months and we did not want to attribute tablet assignment-related visits to tablet-associated outcomes. All models adjusted for veterans' sociodemographic and clinical characteristics, county-level COVID-19 cases, and the fixed effects of being a tablet recipient, of each month, and of each facility.
Figure 2. Event Study Estimates of Adjusted Differences in Emergency Department (ED) Visits and Suicide Behavior for Tablet Recipients vs Recipients’ Baseline and Nonrecipients.
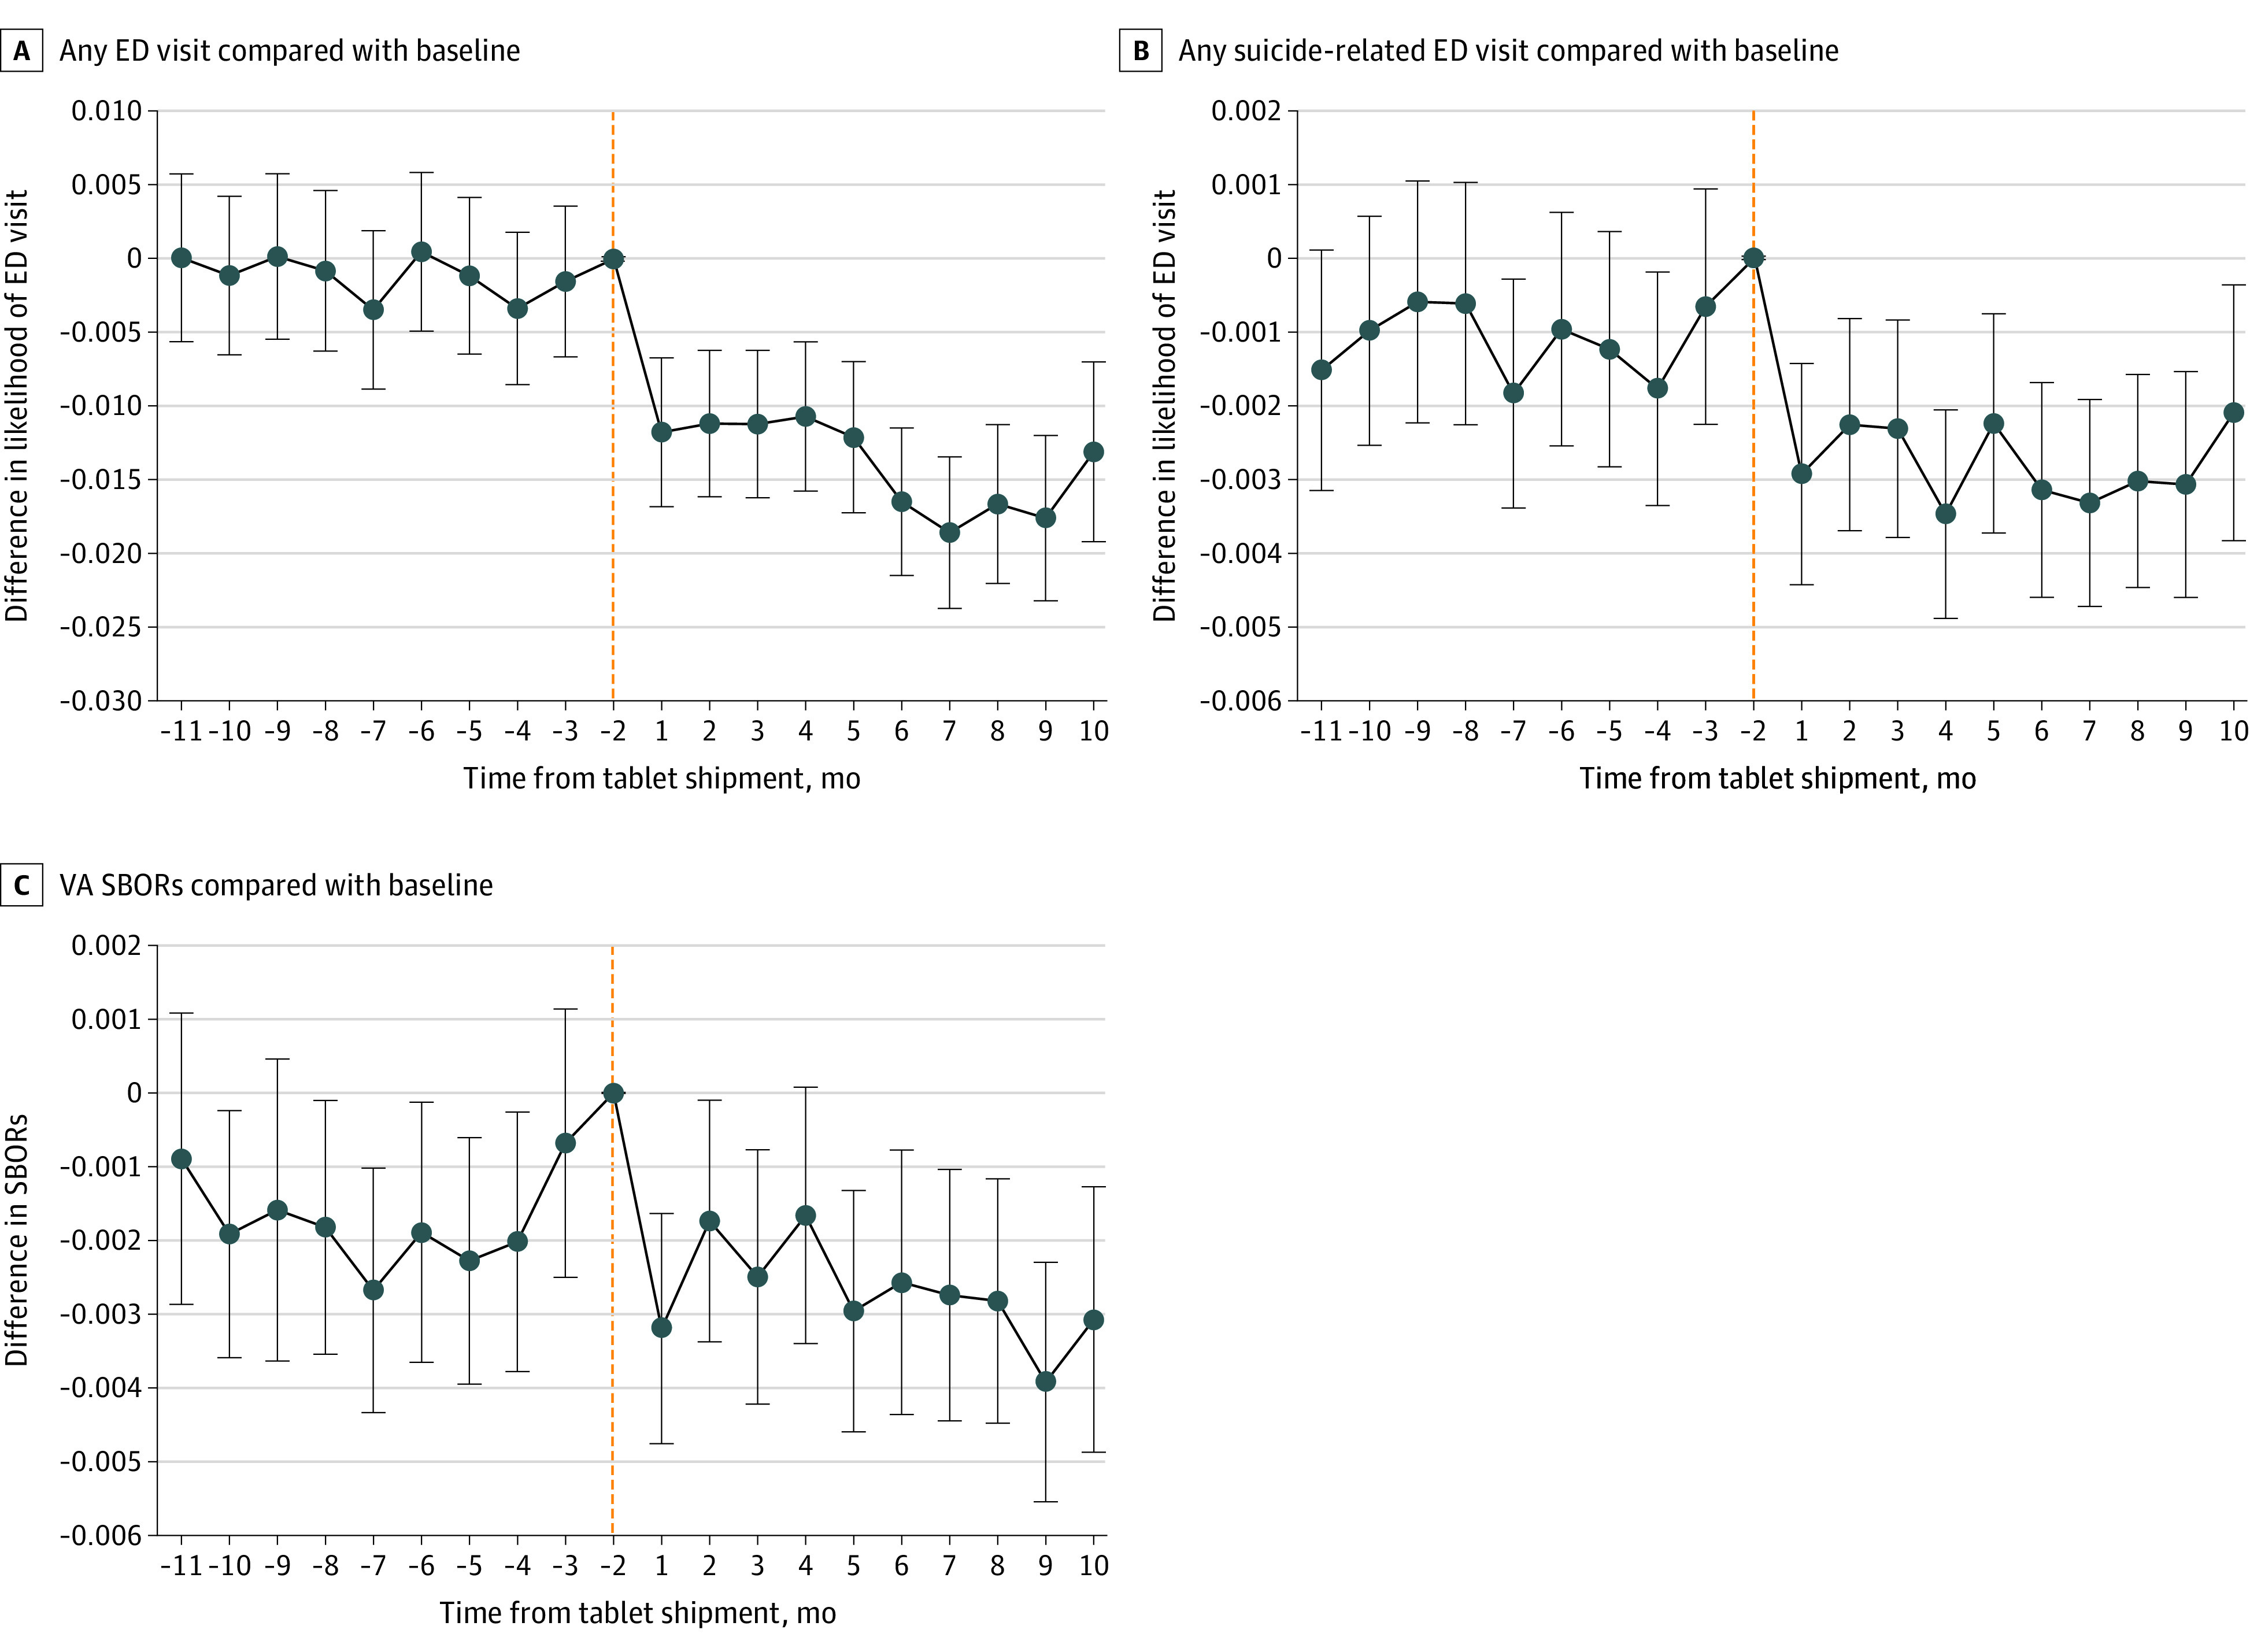
Month −1 and month 0 were excluded because treatment assignment (ie, tablet assignment) likely occurred in these months and we did not want to attribute tablet assignment-related visits to tablet-associated outcomes. All models adjusted for veterans' sociodemographic and clinical characteristics, county-level COVID-19 cases, and fixed effect of being a tablet recipient, of each month, and of each facility.
SBOR indicates suicide behavior and overdose report; VA indicates US Department of Veterans Affairs.
For the full cohort, tablets were associated with additional yearly increases for psychotherapy visits across all modalities (1.8 visits per year [monthly coefficient, 0.15; 95% CI, 0.13-0.17]), video psychotherapy visits (3.5 visits per year [monthly coefficient, 0.29; 95% CI, 0.27-0.31]), video medication management visits (0.7 visits per year [monthly coefficient, 0.06; 95% CI, 0.055-0.062]), and video visits for CSREs (0.02 visits per year [monthly coefficient, 0.002; 95% CI, 0.002-0.002]) (Table 2). Given baseline frequency of psychotherapy visits for tablet recipients in our full cohort was 5.5 visits per year (0.46 per month) and in the high-risk sub-cohort was 13.7 visits per year (1.14 per month) (Table 2), tablet-associated increases of 1.8 visits per year 8 and 3.1 visits per year for the full cohort and high-risk subcohort translated to increases of 33% and 23%, respectively. Tablets were associated with a decrease in the likelihood of an ED visit of 20% (proportion change, −0.012; 95% CI, −0.014 to −0.010), decrease in the likelihood of suicide-related ED visit of 36% (proportion change, −0.0017; 95% CI, −0.0023 to −0.0013), and 22% decrease in SBORs (monthly coefficient, −0.0011; 95% CI, −0.0016 to −0.0005). For the full cohort of tablet recipients, the results translate to a tablet-associated decrease of 158 ED visits and 24 suicide-related ED visits during the 10-month period and with about 168 fewer suicide behavior reports per year (Table 2).
Table 2. Adjusted Differences in Outcomes for Tablet Recipients vs Recipients’ Baseline and Nonrecipientsa.
| Characteristic | Difference-in-difference coefficients (95% CI) | ||||||
|---|---|---|---|---|---|---|---|
| Psychotherapy (all modalities) | Video psychotherapy | Video medication management | Video visits for CSREs | Any ED visit (Y/N) | Any suicide-related ED Visit (Y/N) | VA SBORs | |
| Full cohort of rural veterans with ≥1 VA mental health visit in 2019b | |||||||
| TabletRecipientc | 0.213 (0.20 to 0.23) | 0.013 (0.008 to 0.02) | −0.001 (−0.002 to 0.0004) | 0.0001 (−0.000 05 to 0.0002) | −0.0013 (−0.0031 to 0.0004) | 0.0005 (0.000 02 to 0.0009) | 0.0017 (0.0012 to 0.0021) |
| TabletRecipient × Posttabletd | 0.151 (0.13 to 0.17) | 0.291 (0.27 to 0.31) | 0.058 (0.055 to 0.062) | 0.002 (0.002 to 0.002) | −0.012 (−0.014 to −0.010) | −0.0018 (−0.0023 to −0.0013) | −0.0011 (−0.0016 to −0.0005) |
| % Change from recipients’ baselinee | 32.8 | 243 | 193 | 200 | −20.3 | −36.0 | −22.0 |
| Tablets-associated change in the population, visits/mof | +1990 | +3835 | +764 | +26 | −158g | −24g | −14h |
| Subcohort of rural veterans the VA identified as high-risk for suicideb | |||||||
| TabletRecipientc | 0.333 (0.24 to 0.43) | 0.030 (0.004 to 0.06) | −0.002 (−0.007 to 0.003) | 0.0001 (−0.001 to 0.001) | 0.0086 (−0.0013 to 0.184) | 0.0051 (0.0004 to 0.0097) | 0.0102 (0.0060 to 0.0144) |
| TabletRecipient × Posttabletd | 0.263 (0.15 to 0.38) | 0.485 (0.39 to 0.58) | 0.071 (0.06 to 0.09) | 0.007 (0.004 to 0.01) | −0.033 (−0.044 to −0.023) | −0.012 (−0.017 to −0.0065) | −0.0075 (−0.125 to −0.0026) |
| % Change from recipients’ baselinee | 23.0 | 169.0 | 161.4 | 700.0 | −18.9 | −25.5 | −22.1 |
| Tablets-associated change in the subpopulation, visits/mof | +304 | +561 | +82 | +8 | −38g | −13g | −8h |
Abbreviations: CSRE, comprehensive suicide risk evaluation; ED, emergency department; SBORs, suicide behavior and overdose reports; VA, US Department of Veterans Affairs.
We excluded month −1 and month 0 because treatment assignment (ie, tablet assignment) likely occurred in these months and we did not want to attribute tablet assignment-related visits to the tablet-associated outcomes. All models adjusted for veterans’ age, sex, race, number of physical and mental health chronic conditions, diagnoses of substance use disorder, posttraumatic stress disorder and depression, VA-estimated 1-year probability of hospitalization or death, VA priority-based enrollment, marital status, homelessness indicator, high suicide risk indicator, cumulative monthly COVID-19 cases in the patient’s county. All models included indicators for calendar month to adjust for events occurring in each month and indicators for patients’ closest secondary care facility to control for any time-invariant facility characteristics. In all models, standard errors accounted for clustering at the patient-level.
The full-cohort analyses included 471 791 rural veterans (13 180 of whom were tablet recipients) and 17 794 410 veteran-monthly observations. The high-risk sub-cohort analyses included 16 662 rural veterans (1157 of whom were tablet recipients) and 591 066 veteran-monthly observations.
The coefficient on the variable TabletRecipient indicates the fixed difference between tablet recipients and nonrecipients.
The coefficient on TabletRecipient × Posttablet represents difference-in-differences estimate (ie, it averages the associations of tablets across all posttablet months). These coefficients represent monthly changes in visits or in likelihood of visits. The monthly change in likelihood of visits is the same as an estimated yearly change in likelihood of visits. For outcomes looking at the number of visits, we multiply coefficients by 12 to estimate yearly changes in the number of visits reported in the study.
Full-cohort tablet recipients’ baseline means used for calculating percentage change were: psychotherapy (all modalities), 0.46 per month; video psychotherapy, 0.12 per month; video medication management, 0.03 per month; video CSREs, 0.001 per month; any ED visit, 0.059 per month; any suicide-related ED visit, 0.005 per month; VA SBORs, 0.005 per month. Subcohort tablet recipients’ baseline means used for calculating percentage change were: psychotherapy (all modalities), 1.142 per month; video psychotherapy, 0.287 per month, video medication management, 0.044 per month; video CSREs, 0.001 per month; any ED visit, 0.175 per month; any suicide-related ED visit, 0.047 per month; VA SBORs, 0.034 per month.
To calculate the population-level and subpopulation-level estimates, we multiplied the difference-in-difference estimates in the previous rows by the size of the cohort, 13 180, and subcohort, 1157, respectively.
Measured as change in the population visits per 10-month period.
Measured as SBORs per month.
For the subcohort of rural veterans at high-risk for suicide, tablets were associated with an increase in the yearly psychotherapy visits across all modalities (3.1 visits per year [monthly coefficient, 0.26; 95% CI, 0.15-0.38]), an increase in video psychotherapy visits (5.9 visits per year [monthly coefficient, 0.49; 95% CI, 0.39-0.58), an increase in video medication management visits (0.8 visits per year [monthly coefficient, 0.07; 95% CI, 0.06-0.09]), and an increase in video visits for CSREs (0.1 visits per year [monthly coefficient, 0.007; 95% CI, 0.004-0.01]). For this subcohort, tablets were associated with a decrease in the likelihood of an ED visit of 19% (proportion change, −0.033; 95% CI, −0.044 to −0.023), a decrease in the likelihood of a suicide-related visit of 26% (proportion change, −0.012; 95% CI, −0.017 to −0.0065), and a decrease in SBORs of 22% (monthly coefficient, −0.0075; 95% CI, −0.125 to −0.0026). For the subcohort of tablet recipients considered high-risk for suicide, the results translate to a tablet-associated decrease of 38 ED visits and 13 suicide-related ED visits during the 10-month period and with about 96 fewer suicide behavior reports per year (Table 2).
Discussion
To our knowledge, this study was the largest evaluation of a health system intervention to distribute video-enabled telehealth tablets to patients with access barriers and mental health needs. We examined associations between VA’s video-enabled tablets distributed during COVID-19 and veterans’ mental health care use, suicide behavior, and ED visits. We leveraged differential timing of tablet issuance across veterans and compared outcomes for rural tablet recipients and nonrecipients, 10 months before and after tablet-shipment, to isolate associations occurring posttablet issuance. Tablets were associated with additional 3.5 video psychotherapy visits per year for the full rural cohort and with 5.9 video visits per year for the subcohort at high-risk for suicide. The tablet-associated increase in psychotherapy visits across all modalities was smaller than the tablet-associated increase in video psychotherapy visits, at 1.8 and 3.1 psychotherapy visits per year for the full cohort and high-risk cohort, respectively, because video visits replaced phone or in-person visits in some cases whereas in other cases video visits were new or additional visits. These results reinforced a previous finding that tablets improved continuity of mental health care, and extended prior work by showing tablet-associated reductions in ED visits and suicide behavior.16
To contextualize these tablet associations, note that baseline frequency of psychotherapy visits for tablet recipients in our full cohort was 5.5 visits per year (0.46 per month) and in the high-risk subcohort was 13.7 visits per year (1.14 per month) (Table 2). Thus, tablet-associated increases of 1.8 visits per year and 3.1 visits per year for the full cohort and high-risk sub-cohort translated to increases of 33% and 23%, respectively. Clinical importance of these tablet-associations is supported by studies showing that each psychotherapy session leads to patient improvements (if total visits do not exceed 26)47,48,49; studies have shown that 1 to 2 psychotherapy sessions were associated with an additional 10% to 16% of patients improving,50,51,52 and that the session range required for patient improvement for low-risk patients was 2 to 13 and for high-risk patients was 2 to 25.52 Studies have shown that less or equal to 2 sessions per year reduced suicide attempts and adverse symptoms.53
Clinical importance is further emphasized by our complementary findings that tablets were associated with decreases in likelihood of ED visits and suicide-related ED visits, and decreases in suicide behavior and overdose reports. As these were infrequent outcomes (Table 1), program-level estimates are helpful. The VA’s tablet distribution during COVID-19 was associated with approximate decreases of 158 ED visits and 24 suicide-related ED visits during the 10-month period and with about 168 fewer suicide behavior reports per year (Table 2). Compared with the baseline number of tablet recipients with at least 1 ED visit (n = 775), and at least 1 suicide-related ED visit (n = 68) (Table 1), the tablet-associations translated to reductions of 36% and 22%, respectively. These tablet-associations were not readily comparable with prior studies that focused on specific suicide-related interventions whereas tablets likely allowed simultaneous access to many types of care or applications. Nevertheless, the magnitudes of these associations were consistent with prior work on suicide-related interventions showing reductions in suicide behavior of 30%54 and 45%.27
Limitations
This study had some limitations. A natural limitation of evaluating a health system initiative like tablets was that tablet assignments were nonrandom. There were baseline differences between rural tablet recipients and rural nonrecipients; recipients were more likely to engage in mental health service use, ED use, and had more clinical indicators for poor health. To address these concerns, we leveraged the difference-in-differences approach which allowed for such level differences between tablet recipients and nonrecipients, but was sensitive to differences in unobserved trends that influence outcomes and tablet receipt. Difference-in-differences can handle the existence of unobserved drivers of outcomes so long as unobserved factors do not lead to differential trends for tablet recipients and nonrecipients in the posttablet period. Using the VA’s rich data, our models adjusted for several patient characteristics and leveraged the large cohort size and many periods to explicitly adjust for any remaining fixed difference between tablet recipients and nonrecipients (details in eAppendix 1 in the Supplement). As the assumption of similar trends for recipients and nonrecipients is key for assessing validity of difference-in-differences, we used event studies that improve upon the usual difference-in-differences by allowing direct empirical testing of adjusted pretablet trends. We also provided unadjusted monthly outcome graphs going back to 2018 (eFigure 3 in the Supplement) to show that tablet recipients and nonrecipients had similar trends. It is rare for difference-in-differences analyses to have so many periods of pre-treatment data for assessing the trends assumption. Thus, although there were unavoidable methodological constraints in using real-world data for evaluating tablets, our rigorous methods enhanced attributability of results to tablets.
Another limitation was the difficulty in disentangling the COVID-19 pandemic-related associations from tablet-related associations. To address this, we included in our models the monthly number of COVID-19 cases in each county and included month indicators to capture any remaining secular shocks occurring in each month (eAppendix 1 in the Supplement). Nonetheless, if unobserved factors during the pandemic led to differential post-pandemic trends such as tablet recipients (nonrecipients) reducing ED visits more than nonrecipients (tablet recipients), then ED reductions observed would be overstating (understating) true tablet associations. To address this, we provided calendar-time graphs showing that the pandemic did not differentially affect tablet recipients and nonrecipients such that nonrecipients provided a strong counterfactual trend for recipients even during the COVID-19 period (eFigure 3 in the Supplement). Calendar-time graphs (eFigure 3 in the Supplement) showed that post-pandemic declines in care utilization occurred similarly for both tablet recipients and nonrecipients, and only when adjusted outcomes were viewed in time-relative-to-tablet-shipment (Figure 1 and Figure 2), tablet-specific associations were isolated. The methods used enhanced confidence that observed associations were attributable to tablets.
The scope of this study was limited. We could not analyze all potential mechanisms through which tablets may reduce suicide behavior and ED visits (eg, other mental health services, physical health care services, care timeliness or convenience, and social and digital connectivity). Future studies should examine the range of mechanisms and outcomes tablets can influence, as well as tablet-associated program and utilization costs. As these results may not readily generalize to non-VA settings, studies examining device-enabled virtual care outside the VA are also needed.
Conclusions
This cohort study of the VA’s distribution of video-enabled tablets to rural veterans during the COVID-19 pandemic suggests that tablet-receipt was associated with increased video mental health service use, increased psychotherapy visits, reduced suicide behavior, and reduced ED visits. These findings suggest that the VA and other health systems should consider leveraging video-enabled tablets for improving access to mental health care via telehealth and for preventing suicides among rural residents.
eFigure 1. Flow Chart Describing the Construction of the Study Cohort and Sub-Cohort
eTable 1. Criteria for Identifying Psychotherapy Visits
eTable 2. CPT Codes Used as Part of the Criteria for Identifying Psychotherapy Visits
eTable 3. Criteria for Identifying Medication Management Visits
eTable 4. Mental Health VA E&M Stop Codes, Used as Part of the Criteria for Identifying Medication Management Visits
eTable 5. E&M CPT Codes, Used as Part of the Criteria for Identifying Medication Management Visits
eTable 6. VA Codes for Providers and Qualified Prescribers, Used as Part of the Criteria for Identifying Medication Management Visits
eTable 7. ICD-10 Codes for Identifying Mental Health Conditions, Used as Part of the Criteria for Identifying Psychotherapy and Medication Management Visits
eTable 8. ICD-10 Codes Used for Identifying Suicide-Related ED Visits
eTable 9. Physical and Mental Health Chronic Condition Included as Covariates
eAppendix 1. Methods Details
eFigure 2. Tablet Recipients’ Visits for Medication Management and CSREs Compared to the Baseline and Compared to Non-Recipients - Regression Coefficients From Event Study Specifications
eFigure 3. Unadjusted Average Number of Monthly Visit Outcomes for Rural Tablet Recipients and Rural Tablet Non-Recipients by Calendar Month-Year
References
- 1.Ducharme J. Suicide rates are the highest they’ve been since World War II. Time Magazine . Published June 20, 2019. Accessed March 3, 2022. https://time.com/5609124/us-suicide-rate-increase/
- 2.Department of Veterans Affairs . 2019 National veteran suicide prevention annual report. 2019. Accessed March 3, 2022. https://www.mentalhealth.va.gov/docs/data-sheets/2019/2019_National_Veteran_Suicide_Prevention_Annual_Report_508.pdf
- 3.U.S. Department of Veterans Affairs . 2020 National veteran suicide prevention annual report. 2020. Accessed March 3, 2022. https://www.mentalhealth.va.gov/docs/data-sheets/2020/2020-National-Veteran-Suicide-Prevention-Annual-Report-11-2020-508.pdf
- 4.Centers for Disease Control and Prevention (CDC) . Americans in rural areas more likely to die by suicide.; 2017. Accessed March 3, 2022. https://www.cdc.gov/media/releases/2017/p1005-rural-suicide-rates.html
- 5.Shiner B, Peltzman T, Cornelius S, Gui J, Forehand J, Watts B. Recent trends in the rural–urban suicide disparity among veterans using VA health care. J Behav Med. 2020. [DOI] [PubMed] [Google Scholar]
- 6.Steelesmith DL, Fontanella CA, Campo JV, Bridge JA, Warren KL, Root ED. Contextual factors associated with county-level suicide rates in the United States, 1999 to 2016. JAMA Netw Open. 2019;2(9):e1910936. doi: 10.1001/jamanetworkopen.2019.10936 [DOI] [PMC free article] [PubMed] [Google Scholar]
- 7.McCarthy JF, Blow FC, Ignacio RV, Ilgen MA, Austin KL, Valenstein M. Suicide among patients in the Veterans Affairs health system: rural-urban differences in rates, risks, and methods. Am J Public Health. 2012;102(suppl 1):S111-S117. doi: 10.2105/AJPH.2011.300463 [DOI] [PMC free article] [PubMed] [Google Scholar]
- 8.Monteith L, Holiday R, Brown T, Brenner L, Mohatt NV. Preventing Suicide in Rural Communities During the COVID-19 Pandemic. J Rural Health. 2021;37(1):179-184. [DOI] [PMC free article] [PubMed] [Google Scholar]
- 9.Gujral K, Basu A. The Impact of Rural and Urban Hospital Closures on Inpatient Mortality. National Bureau of Economic Research; 2019. doi: 10.3386/w26182 [DOI] [Google Scholar]
- 10.Gujral K. Rural hospital closures increase mortality. VOX EU; 2020. [Google Scholar]
- 11.Gunnell D, Appleby L, Arensman E, et al. ; COVID-19 Suicide Prevention Research Collaboration . Suicide risk and prevention during the COVID-19 pandemic. Lancet Psychiatry. 2020;7(6):468-471. doi: 10.1016/S2215-0366(20)30171-1 [DOI] [PMC free article] [PubMed] [Google Scholar]
- 12.Lee K, Chabria A. As the coronavirus pandemic grows, gun sales are surging in many states. Los Angeles Times . Published March 16, 2020. Accessed March 3, 2022. https://www.latimes.com/world-nation/story/2020-03-15/coronavirus-pandemic-gun-sales-surge-us-california
- 13.Rosen CS, Morland LA, Glassman LH, et al. Virtual mental health care in the Veterans Health Administration’s immediate response to coronavirus disease-19. Am Psychol. 2021;76(1):26-38. [DOI] [PubMed] [Google Scholar]
- 14.Mott JM, Grubbs KM, Sansgiry S, Fortney JC, Cully JA. Psychotherapy utilization among rural and urban veterans from 2007 to 2010. J Rural Health. 2015;31(3):235-243. [DOI] [PubMed] [Google Scholar]
- 15.Brown GK, Jager-Hyman S. Evidence-based psychotherapies for suicide prevention: future directions. Am J Prev Med. 2014;47(3)(suppl 2):S186-S194. doi: 10.1016/j.amepre.2014.06.008 [DOI] [PubMed] [Google Scholar]
- 16.Jacobs JC, Blonigen DM, Kimerling R, et al. Increasing Mental Health Care Access, Continuity, and Efficiency for Veterans Through Telehealth With Video Tablets. Psychiatr Serv. 2019;70(11):976-982. doi: 10.1176/appi.ps.201900104 [DOI] [PubMed] [Google Scholar]
- 17.Sall J, Brenner L, Bell AM, Colston M. Assessment and management of patients at risk for suicide: synopsis of the 2019 U.S. Department of Veterans Affairs and U.S. Department of Defense clinical practice guidelines. Ann Intern Med. 2019;171(5):343-353. doi: 10.7326/M19-0687 [DOI] [PubMed] [Google Scholar]
- 18.Rojas SM, Carter SP, McGinn MM, Reger MA. A review of telemental health as a modality to deliver suicide-specific interventions for rural populations. Telemed J E Health. 2020;26(6):700-709. doi: 10.1089/tmj.2019.0083 [DOI] [PubMed] [Google Scholar]
- 19.Rojas SM, Piccirillo ML, McCann RA, Reger MA, Felker B. An examination of suicidal behaviour among veterans receiving mental-health appointments in person versus clinical video telehealth. J Telemed Telecare. Published online July 21, 2020. doi: 10.1177/1357633X20942041 [DOI] [PubMed] [Google Scholar]
- 20.Zulman DM, Wong EP, Slightam C, et al. Making connections: nationwide implementation of video telehealth tablets to address access barriers in veterans. JAMIA Open. 2019;2(3):323-329. doi: 10.1093/jamiaopen/ooz024 [DOI] [PMC free article] [PubMed] [Google Scholar]
- 21.Heyworth L, Kirsh S, Zulman D, Ferguson J, Kizer K. Expanding access through virtual care: the VA’s early experience with Covid-19. NEJM Catal. Accessed March 3, 2022. https://catalyst.nejm.org/doi/full/10.1056/CAT.20.0327
- 22.Ferguson JM, Jacobs J, Yefimova M, Greene L, Heyworth L, Zulman DM. Virtual care expansion in the Veterans Health Administration during the COVID-19 pandemic: clinical services and patient characteristics associated with utilization. J Am Med Inform Assoc. 2021;28(3):453-462. doi: 10.1093/jamia/ocaa284 [DOI] [PMC free article] [PubMed] [Google Scholar]
- 23.Office of Rural Health . Rural veterans. Published 2021. Accessed October 4, 2021. https://www.ruralhealth.va.gov/aboutus/ruralvets.asp
- 24.Office of Public and Intergovernmental Affairs . VA REACH VET initiative helps save veterans lives: program signals when more help is needed for at-risk veterans. VA.gov . Published 2017. Accessed March 3, 2022. https://www.va.gov/opa/pressrel/pressrelease.cfm?id=2878
- 25.VAntage Point . VA sets standards in suicide risk assessment, offers support to community providers. Published 2019. Accessed March 3, 2022. https://blogs.va.gov/VAntage/55281/va-sets-standards-in-suicide-risk-assessment-offers-support-to-community-providers/
- 26.Department of Veterans Affairs Veterans Health Administration . VHA directive 1160.07, suicide prevention program. Published 2021. Accessed March 3, 2022. https://www.google.com/url?sa=t&rct=j&q=&esrc=s&source=web&cd=&ved=2ahUKEwiR7eye8-PyAhUYKVkFHY0LC9QQFnoECAMQAQ&url=https%3A%2F%2Fwww.va.gov%2Fvhapublications%2FViewPublication.asp%3Fpub_ID%3D9270&usg=AOvVaw1FNhFwbjir7gpPbPdxSYHX
- 27.Stanley B, Brown GK, Brenner LA, et al. Comparison of the safety planning intervention with follow-up vs usual care of suicidal patients treated in the emergency department. JAMA Psychiatry. 2018;75(9):894-900. doi: 10.1001/jamapsychiatry.2018.1776 [DOI] [PMC free article] [PubMed] [Google Scholar]
- 28.Program Evaluation & Resource Center (PERC) . Requests for Operational Use of PERC Data. July 31, 2021. https://www.hsrd.research.va.gov/cdp/toolkit/mentor.cfm?RecordID=10
- 29.Brignone E, Sorrentino AE, Roberts CB, Dichter ME. Suicidal ideation and behaviors among women veterans with recent exposure to intimate partner violence. Gen Hosp Psychiatry. 2018;55:60-64. doi: 10.1016/j.genhosppsych.2018.10.006 [DOI] [PubMed] [Google Scholar]
- 30.Healthcare Cost and Utilization Project - Agency for Healthcare Research and Quality . Suicide ideation, suicide attempt, or self-inflicted harm: pediatric emergency department visits, 2010-2014, 2016. Accessed March 3, 2022. https://www.hcup-us.ahrq.gov/reports/ataglance/HCUPanalysisPedEDVisitsSuicide.pdf
- 31.Yu W, Ravelo A, Wagner TH, et al. Prevalence and costs of chronic conditions in the VA health care system. Med Care Res Rev. 2003;60(3)(suppl):146S-167S. doi: 10.1177/1077558703257000 [DOI] [PubMed] [Google Scholar]
- 32.Fishman P, Von Korff M, Lozano P, Hecht J. Chronic care costs in managed care. Health Aff (Millwood). 1997;16(3):239-247. doi: 10.1377/hlthaff.16.3.239 [DOI] [PubMed] [Google Scholar]
- 33.Ray GT, Collin F, Lieu T, et al. The cost of health conditions in a health maintenance organization. Med Care Res Rev. 2000;57(1):92-109. doi: 10.1177/107755870005700106 [DOI] [PubMed] [Google Scholar]
- 34.Wang L, Porter B, Maynard C, et al. Predicting risk of hospitalization or death among patients receiving primary care in the Veterans Health Administration. Med Care. 2013;51(4):368-373. [DOI] [PubMed] [Google Scholar]
- 35.Wang JZ, Dhanireddy P, Prince C, Larsen M, Schimpf M, Pearman G. Survey of Veteran Enrollees’ Health and Use of Health Care. Accessed March 3, 2022. https://www.va.gov/VHASTRATEGY/SOE2021/2021_Enrollee_Data_Findings_Report-508_Compliant.pdf
- 36.The New York Times . Coronavirus (Covid-19) Data in the United States. Published June 2021. Accessed March 3, 2022. https://github.com/nytimes/covid-19-data
- 37.Abouk R, Pacula RL, Powell D. Association between state laws facilitating pharmacy distribution of naloxone and risk of fatal overdose. JAMA Intern Med. 2019;179(6):805-811. doi: 10.1001/jamainternmed.2019.0272 [DOI] [PMC free article] [PubMed] [Google Scholar]
- 38.Raifman J, Bor J, Venkataramani A. Association between receipt of unemployment insurance and food insecurity among people who lost employment during the COVID-19 pandemic in the United States. JAMA Netw Open. 2021;4(1):e2035884. doi: 10.1001/jamanetworkopen.2020.35884 [DOI] [PMC free article] [PubMed] [Google Scholar]
- 39.Liao JM, Gupta A, Zhao Y, et al. Association between hospital voluntary participation, mandatory participation, or nonparticipation in bundled payments and Medicare episodic spending for hip and knee replacements. JAMA. 2021. doi: 10.1001/jama.2021.10046 [DOI] [PMC free article] [PubMed] [Google Scholar]
- 40.Abadie A. Semiparametric difference-in-differences estimators. Rev Econ Stud. 2005;72(1):1-19. doi: 10.1111/0034-6527.00321 [DOI] [Google Scholar]
- 41.Wing C, Simon K, Bello-Gomez RA. Designing difference in difference studies: best practices for public health policy research. Annu Rev Public Health. 2018;39:453-469. doi: 10.1146/annurev-publhealth-040617-013507 [DOI] [PubMed] [Google Scholar]
- 42.Goodman-Bacon A. Difference-in-Differences with Variation in Treatment Timing. The National Bureau of Economic Research; 2018. doi: 10.3386/w25018 [DOI] [Google Scholar]
- 43.Sun L, Abraham S. Estimating dynamic treatment effects in event studies with heterogeneous treatment effects. J Econom. 2020;225(2):175-199. doi: 10.1016/j.jeconom.2020.09.006 [DOI] [Google Scholar]
- 44.Freyaldenhoven S, Hansen C, Shapiro JM. Pre-event Trends in the Panel Event-Study Design. Am Econ Rev. 2019;109(9):3307-38. doi: 10.1257/aer.20180609 [DOI] [Google Scholar]
- 45.Becker S, Ichino A. Estimation of average treatment effects based on propensity scores. Stata J. 2002;2(4):358-377. doi: 10.1177/1536867X0200200403 [DOI] [Google Scholar]
- 46.Leuven E, Sianesi B. PSMATCH2: Stata module to perform full mahalanobis and propensity score matching, common support graphing, and covariate imbalance testing. Boston College Department of Economics . Published 2018. Accessed March 4, 2022. https://ideas.repec.org/c/boc/bocode/s432001.html
- 47.Robinson, L., Delgadillo, J., Kellett, S.. The dose-response effect in routinely delivered psychological therapies: a systematic review. Psychother Res. 2020;30(1):79-96. doi: 10.1080/10503307.2019.1566676 [DOI] [PubMed] [Google Scholar]
- 48.Saxon D, Firth N, Barkham M. The relationship between therapist effects and therapy delivery factors: therapy modality, dosage, and non-completion. Adm Policy Ment Health. 2017;44(5):705-715. doi: 10.1007/s10488-016-0750-5 [DOI] [PMC free article] [PubMed] [Google Scholar]
- 49.Holmes, SC, Johnson, CM, Suvak, MK, Sijercic, I, Monson, CM, Stirman, SW. Examining patterns of dose response for clients who do and do not complete cognitive processing therapy. J Anxiety Disord. 2019;68(102120). doi: 10.1016/j.janxdis.2019.102120 [DOI] [PMC free article] [PubMed] [Google Scholar]
- 50.Cully JA, Tolpin L, Henderson L, Jimenez D, Kunik ME, Petersen LA. Psychotherapy in the Veterans Health Administration: missed opportunities? Psychol Serv. 2008;5(4):320-331. doi: 10.1037/a0013719 [DOI] [PMC free article] [PubMed] [Google Scholar]
- 51.Howard KI, Kopta SM, Krause MS, Orlinsky DE. The dose-effect relationship in psychotherapy. Am Psychol. 1986;41(2):159-164. doi: 10.1037/0003-066X.41.2.159 [DOI] [PubMed] [Google Scholar]
- 52.Kadera SW, Lambert MJ, Andrews AA. How much therapy is really enough?: a session-by-session analysis of the psychotherapy dose-effect relationship. J Psychother Pract Res. 1996;5(2):132-151. [PMC free article] [PubMed] [Google Scholar]
- 53.Calati R, Courtet P. Is psychotherapy effective for reducing suicide attempt and non-suicidal self-injury rates? Meta-analysis and meta-regression of literature data. J Psychiatr Res. 2016;79:8-20. doi: 10.1016/j.jpsychires.2016.04.003 [DOI] [PubMed] [Google Scholar]
- 54.Miller IW, Camargo CA Jr, Arias SA, et al. ; ED-SAFE Investigators . Suicide prevention in an emergency department population: the ED-SAFE Study. JAMA Psychiatry. 2017;74(6):563-570. doi: 10.1001/jamapsychiatry.2017.0678 [DOI] [PMC free article] [PubMed] [Google Scholar]
Associated Data
This section collects any data citations, data availability statements, or supplementary materials included in this article.
Supplementary Materials
eFigure 1. Flow Chart Describing the Construction of the Study Cohort and Sub-Cohort
eTable 1. Criteria for Identifying Psychotherapy Visits
eTable 2. CPT Codes Used as Part of the Criteria for Identifying Psychotherapy Visits
eTable 3. Criteria for Identifying Medication Management Visits
eTable 4. Mental Health VA E&M Stop Codes, Used as Part of the Criteria for Identifying Medication Management Visits
eTable 5. E&M CPT Codes, Used as Part of the Criteria for Identifying Medication Management Visits
eTable 6. VA Codes for Providers and Qualified Prescribers, Used as Part of the Criteria for Identifying Medication Management Visits
eTable 7. ICD-10 Codes for Identifying Mental Health Conditions, Used as Part of the Criteria for Identifying Psychotherapy and Medication Management Visits
eTable 8. ICD-10 Codes Used for Identifying Suicide-Related ED Visits
eTable 9. Physical and Mental Health Chronic Condition Included as Covariates
eAppendix 1. Methods Details
eFigure 2. Tablet Recipients’ Visits for Medication Management and CSREs Compared to the Baseline and Compared to Non-Recipients - Regression Coefficients From Event Study Specifications
eFigure 3. Unadjusted Average Number of Monthly Visit Outcomes for Rural Tablet Recipients and Rural Tablet Non-Recipients by Calendar Month-Year