Abstract
Meningeal lymphatics near the cribriform plate undergo lymphangiogenesis during neuroinflammation to drain excess fluid. Here, we hypothesized that lymphangiogenic vessels may acquire an altered phenotype to regulate immunity. Single-cell RNA sequencing of meningeal lymphatics near the cribriform plate from healthy and experimental autoimmune encephalomyelitis in the C57BL/6 model, we report that neuroinflammation induces the upregulation of genes involved in antigen presentation such as MHC II, adhesion molecules including Vcam-1, and immunoregulatory molecules such as PD-L1, where many of these changes are mediated by IFN-g. The inflamed lymphatics retain CD11c+ cells and CD4 T cells where they capture and present antigen, creating an immune-regulatory niche that represents an underappreciated interface in the regulation of neuroinflammation. We also find discontinuity of the arachnoid membrane near the cribriform plate that provides unrestricted access to the cerebrospinal fluid. These findings highlight a novel function of local meningeal lymphatics in regulating immunity that has only previously been seen in the draining lymph nodes.
Introduction
Meningeal lymphatics surrounding the central nervous system (CNS) facilitate the drainage of fluid and macromolecules in both steady-state and neuroinflammation1–4. Global inhibition of meningeal lymphatic function using the VEGFR3 tyrosine kinase inhibitor MAZ51 or locally using photoablation prior to experimental autoimmune encephalomyelitis (EAE) onset can reduce CNS-derived autoantigen drainage and delay EAE onset4,5 or worsen pathology during Alzheimer’s disease6 and traumatic brain injury7. In contrast, augmenting meningeal lymphatic function through VEGFC can improve anti-tumor immunity8,9 and improve cognitive function during aging6. These data suggest that manipulation of lymphatic drainage can influence disease outcome, highlighting the significance of meningeal lymphatic vessels in the drainage of fluid, antigens, and cells.
Lymphatic endothelial cells (LECs) of the lymph nodes are heterogeneous, containing both afferent and efferent lymphatics that are structurally organized and specialized for different functions such as antigen processing and presentation with leukocytes from the lymph, pathogen interactions, and remodeling10,11. Functionally, lymph node LECs directly regulate leukocytes through cell-cell signaling, tolerance through PD-L1/PD-1, as well as antigen processing, archival, and presentation12–18. These data suggest that LECs play a more significant and direct role in regulating immunity than previously hypothesized, which have important implications for targeting lymphatic function during autoimmunity and/or antitumor immunity12. While these functions have been attributed to lymph node resident LECs, it is unknown if meningeal LECs can display these functions.
We tested if meningeal lymphatics near the cribriform plate can adapt to a neuroinflammatory microenvironment, display immune regulatory functions, engage in leukocyte crosstalk, and if so, how this may influence immunity. We focused on cribriform plate lymphatic endothelial cells (cpLECs) due to their unique ability to undergo lymphangiogenesis during EAE4. Single-cell RNA sequencing (scRNA-seq) of FACS sorted cpLECs from naive and EAE mice revealed an enrichment in genes of normal lymphatic function such as leukocyte adhesion/chemotaxis, as well as genes involved in leukocyte crosstalk such as antigen processing and presentation, and regulation of leukocyte activation. Inflamed cpLECs increase their ability to bind CD11chigh CD11b+ dendritic cells and CD4+ T cells, contain intracellular CNS-derived antigens, express MHC II, and increase the expression of immunoregulatory proteins such as PD-L1 in an IFN-γ-dependent fashion. Additionally, cpLECs have unique access to the cerebrospinal fluid (CSF) due to gaps in the arachnoid barrier separating the cpLECs from the subarachnoid space (SAS), correlating with elevated fluid accumulation near the cribriform plate relative to other regions while expressing the water channel AQP-1. These data implicate lymphangiogenic cpLECs as a potential site of immune regulation through leukocyte binding/crosstalk, an acquired phenotype during neuroinflammation. Lastly, gaps in the SAS suggest cpLECs have direct access to CSF.
Results
CpLECs display a unique phenotype during neuroinflammation.
Neuroinflammation drives VEGFR3-dependent lymphangiogenesis near the cribriform plate, which can functionally drain CNS-derived antigens, cells, and fluid4. To characterize the differences between cpLECs in steady-state and in neuroinflammatory conditions, we measured cpLECs by flow cytometry from healthy and EAE mice after generating a single cell suspension of the cribriform plate region (Extended Data Fig. 1). For the EAE group, an EAE clinical score of 3.0 at 15 days post-immunization was used for all experiments. CpLECs were identified as Podoplanin+ and CD31+ after gating for live Ghostnegative singlets and excluding CD45intermediate microglia and CD45high leukocytes2,6,8,19(Extended Data Fig. 1b–d). Quantitation of the average number of cpLECs revealed EAE-induced LEC expansion (Extended data Fig. 1l). These data confirm that cpLECs undergo expansion with increased cell numbers and are not merely due to widening of vessels4. Characterization of the excluded CD45intermediate or CD45high cells confirmed that we have excluded CD45intermediate CD11b+ microglia and CD45high leukocytes including CD11b+ CD11c− macrophages, CD11b+ CD11c+ myeloid cells, CD4 and CD8 T cells, and B220+ B cells (Extended Data Fig. 1e–j). Gating on CD31+ endothelial cells confirmed that LECs in this gate express both Podoplanin and Lyve-1, excluding venous endothelial cells (Fig.1 c,d)
Figure 1: cpLECs display a unique phenotype during neuroinflammation.
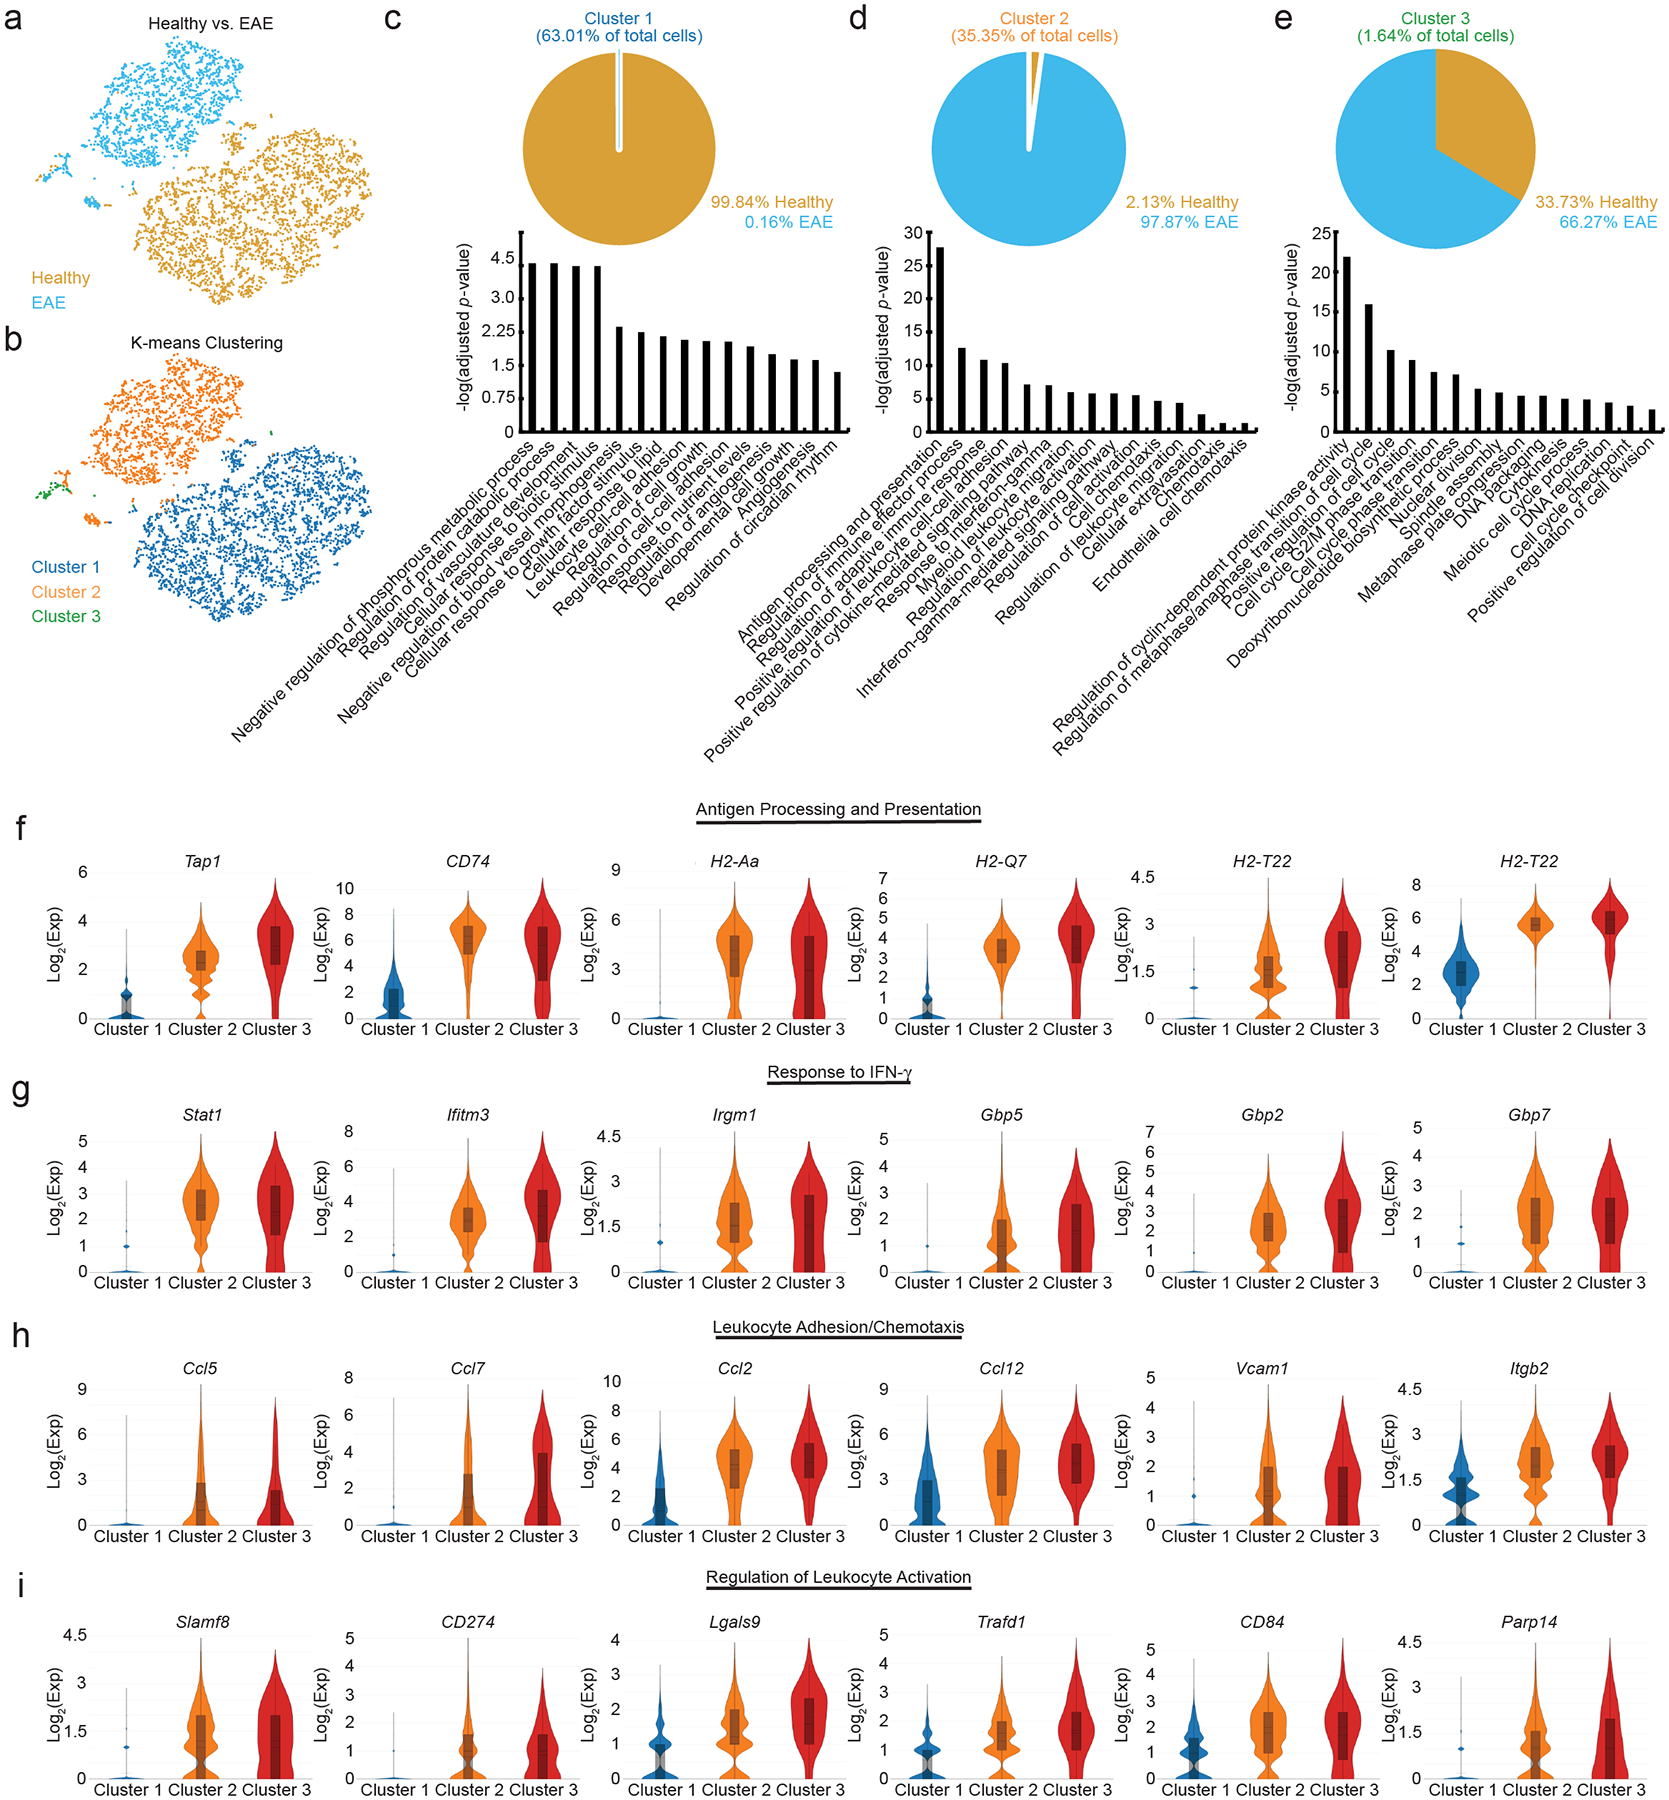
(a): t-SNE plot showing the distribution of healthy and EAE cells.
(b): t-SNE plot showing sub-populations of cells after K-means clustering.
(c – e): Top panels: pie chart showing the cellular composition of cluster 1 (c), cluster 2 (d), and cluster 3 (e) as shown in (c – e). Bottom panels: Representative bar plots of gene ontologies enriched for each cluster.
(f – i): Gene ontology analysis of Cluster 2 which comprised mostly of EAE cells were sub-divided into four main categories: antigen processing and presentation (f), response to IFN- γ (g), leukocyte adhesion/chemotaxis (h), and regulation of leukocyte activation (i). Violin plots show the relative expression distribution of several genes within each category. The box reflects the lower (q1) and upper (q3) quartiles, the center line shows the median, and the whiskers represent 95% confidence interval.
After validating the isolation of cpLECs and confirming lymphangiogenesis, we processed cpLECs for single-cell RNA sequencing (scRNA-seq) after cell sorting using the LEC markers CD31 and Podoplanin after gating for live Ghostnegative singlets and excluding CD45high leukocytes2,6,8,19. After sorting and pooling cells from 5 naïve C57BL/6J control mice separately from 5 EAE C57BL/6J mice, cpLECs were processed with 10x Genomics Chromium Single Cell Gene Expression Assay and sequenced using the Novaseq 6000 (Extended Data Fig. 1). Non-LECs that appeared in our analysis were excluded, which consisted primarily of autofluorescent cells in the olfactory epithelium20 or contained genes enriched by glial cells and neurons. T-SNE plot of healthy vs. EAE cells revealed that these two populations of cpLECs separate almost exclusively into different clusters, suggesting unique phenotypes between healthy and EAE cells (Fig. 1a). Traditional K-means clustering grouped both healthy and EAE cpLECs into three clusters (Fig. 1b), with cluster 1 consisting primarily of healthy cells (99.84%) (Fig. 1c, top panel), and clusters 2 (Fig. 1d, top panel) and 3 (Fig. 1e, top panel) consisting primarily of EAE cells (97.87% for cluster 2, 66.27% for cluster 3). scRNA-seq revealed that cluster 1 contained 341 differentially expressed upregulated genes (* FDR < 0.1, Methods) and 406 differentially expressed down-regulated genes; cluster 2 contained 286 differentially expressed upregulated and 393 differentially expressed down-regulated genes, and cluster 3 contained 90 differentially expressed upregulated genes with no differentially expressed down-regulated genes when locally distinguishing between the other clusters. Representative volcano plots for each of the three clusters highlight the top 50 most upregulated and downregulated genes (Extended Data Fig. 2a). Gene enrichment analysis of cluster 1 revealed pathways associated with lymphatic functions such as catabolic processes, regulation of vasculature development, and cell-cell adhesion, consistent with its makeup of primarily naive cells (Fig. 1c, bottom panel). Cluster 2 consisting primarily of EAE cpLECs were enriched in pathways associated with an activated state (Fig. 1d, bottom panel) with genes involved in leukocyte crosstalk. The majority of cluster 3 consisted of EAE cpLECs (66.27%), and is enriched in proliferation genes consistent with lymphangiogenesis by cpLECs4 (Fig. 1e, bottom panel). These data suggest that steady state cpLECs undergo a baseline level of proliferation to maintain lymphatic cell numbers, and neuroinflammation drives lymphangiogenesis by increasing cell proliferation.
We next looked to characterize the differences between healthy and EAE cpLECs, which may reveal novel functions of cpLECs in addition to their canonical roles in drainage. Since Cluster 2 consists primarily of EAE cpLECs, we focused on the genes enriched within this cluster relative to the other groups. Gene enrichment pathways for cluster 2 were divided into four main categories: 1) antigen processing and presentation (Fig. 1f), 2) response to IFN-γ (Fig. 1g), 3) leukocyte adhesion/chemotaxis (Fig. 1h), and 4) regulation of leukocyte activation (Fig. 1i), in which six representative genes associated with these pathways are shown. For each cluster, representative Cnet plots highlight the steady-state pathways in cluster 1, leukocyte crosstalk pathways in cluster 2, and proliferation pathways in cluster 3 along with all the associated genes and their relative strength of contribution to each pathway (Extended Data Fig. 2b, d, f). These data demonstrate that cpLECs may engage in crosstalk with leukocytes through antigen processing/presentation, leukocyte adhesion/chemotaxis, and regulation of leukocyte activation, where some of these functions may be acquired in response to IFN-γ during neuroinflammation.
Visualizing cpLEC trajectories.
Since both healthy and EAE cells were almost exclusively clustered, we asked if proliferation-driven lymphangiogenesis can account for all the lymphangiogenic cells in cluster 2, or if there may be another mechanism that can account for increased numbers of cpLECs during EAE. There is evidence that inflammation-driven lymphangiogenesis may occur through trans-differentiation of myeloid cells21–23. To investigate this, we visualized single-cell trajectories through pseudotime as previously described24–26, which allows us to visualize cell transitions from one state to another and how far a cell has moved through a biological process. Visualization of cell trajectories through pseudotime revealed that a steady-state cell in cluster 1 transitioned into a proliferative state in cluster 3 on its way to become an EAE-like state in cluster 2 (Extended Data Fig. 3a). Visualizing specific genes revealed an upregulation of chemotactic genes such as CCL12, CCL2, CCL5, and CCL7 (Extended Data Fig. 3b); IFN-γ response genes such as Ifitm3, Gbp2, and Stat1 (Extended Data Fig. 3c); and antigen processing and presentation genes such as H2-Aa, H2-Q7, and Tap1 (Extended Data Fig. 3d) through pseudotime early, while genes involved in leukocyte activation such as Parp14, Slamf8, and CD274 (PD-L1) (Extended Data Fig. 3e) were upregulated later through pseudotime. These data suggest that lymphangiogenesis through the proliferation of pre-existing LECs seems to drive some of the phenotypic changes of cpLECs during EAE. Additionally, the proliferation of pre-existing lymphangiogenic vessels seem to account for the EAE-like cells in cluster 2. Of note however, scRNA-seq revealed expression of many myeloid-associated genes by cpLECs in addition to LEC genes despite exclusion of CD45intermediate microglia and CD45high leukocytes (Extended Data Fig. 1) at the protein level while FACS sorting. Therefore, we can confirm that increased proliferation of cpLECs may at least partially account for lymphangiogenesis as shown here and previously through increased Ki67 expression at the protein level4. However, we cannot exclude the involvement of myeloid cells in the origin of LECs as previously described and reviewed27,28.
Neuroinflammation increases leukocyte binding to cpLECs.
Recent[ZF1] evidence has suggested that lymph node LECs can regulate immunity through leukocyte crosstalk via PD-L1 and/or antigen presentation12,15–18. Here we show that cpLECs are enriched for genes involved in antigen processing/presentation, leukocyte adhesion/chemotaxis, and regulation of leukocyte activation during EAE, suggesting that cpLECs may acquire some of these phenotypes during EAE. Using cell-cell interaction analysis by flow cytometry29,30, we compared healthy and EAE cell interactions by gating on live doublets that express both the pan-leukocyte marker CD45 and cpLEC markers CD31, Podoplanin, and Lyve-1 (Extended Data Fig. 4a). CD45high, CD11chigh, CD11b+ cells were identified as likely dendritic cells, macrophages as CD45high, CD11b+, CD11clow; CD4 T cells as CD45high CD11b− CD11c− CD4+, CD8 T cells as CD45high CD11b− CD11c− CD8+, and B cells as CD45high CD11b− CD11c− CD4− CD8− B220+. Consistent with an expansion of cpLECs during EAE, there was an approximately 146-fold increase in cpLEC cell number bound to CD45+ leukocytes, suggesting an increased affinity for cell binding by cpLECs during EAE (Fig. 2a). Of the leukocytes, a significant increase in the number of CD11chigh CD11b+ dendritic cells (≈ 173-fold higher than steady-state) and to a lesser extent CD11b+ CD11clow myeloid cells (≈ 135-fold higher than steady-state) and CD4+ T cells (≈ 21-fold higher than steady-state) were bound to cpLECs (Fig. 2a). This data is consistent with the role of dendritic cells as professional antigen-presenting cells that can migrate through lymphatics4. Further characterization of CD11c+ cells reveal that the majority of these cells are Ly6G− and F4/80−, excluding CD11c+ neutrophils or macrophages (Extended Data Fig. 4p–u). No elevation was seen in the number of CD8+ T cells or B220+ B cells that were bound to cpLECs during EAE (Fig. 2a). Of the leukocytes that bind to cpLECs, CD11chigh CD11b+ dendritic cells made up the dominant cell type, with other myeloid cells and CD4 T cells binding to a lesser extent (Fig. 2b). To further validate our data, we induced EAE in CD11c-eYFP mice and harvested cpLECs for visualization with confocal microscopy using the same harvest process. Doublets in the cell suspension consisted primarily of a CD11c-eYFP+ cell bound to a CD31+ Podoplanin+ cell (Fig. 2c). In some cases, CD31 was expressed by both CD11c-eYFP+ cells and Podoplanin+ LECs, consistent with its function as a homophilic adhesion molecule31. We next validated the ex vivo cpLEC-leukocyte cell binding using coronal sections of EAE CD11c-eYFP transgenic reporter mice to visualize dendritic cell-LEC binding in situ. IMARIS 3D surface volume rendering identified several CD11c-eYFP+ cells in contact with cpLECs during EAE (Fig. 2d). These data confirm that in response to neuroinflammation, CD11chigh CD11b+ dendritic cells and, to a lesser extent CD4+ T cells, interact with cpLECs during EAE.
Figure 2: Neuroinflammation increases leukocyte binding to cpLECs.
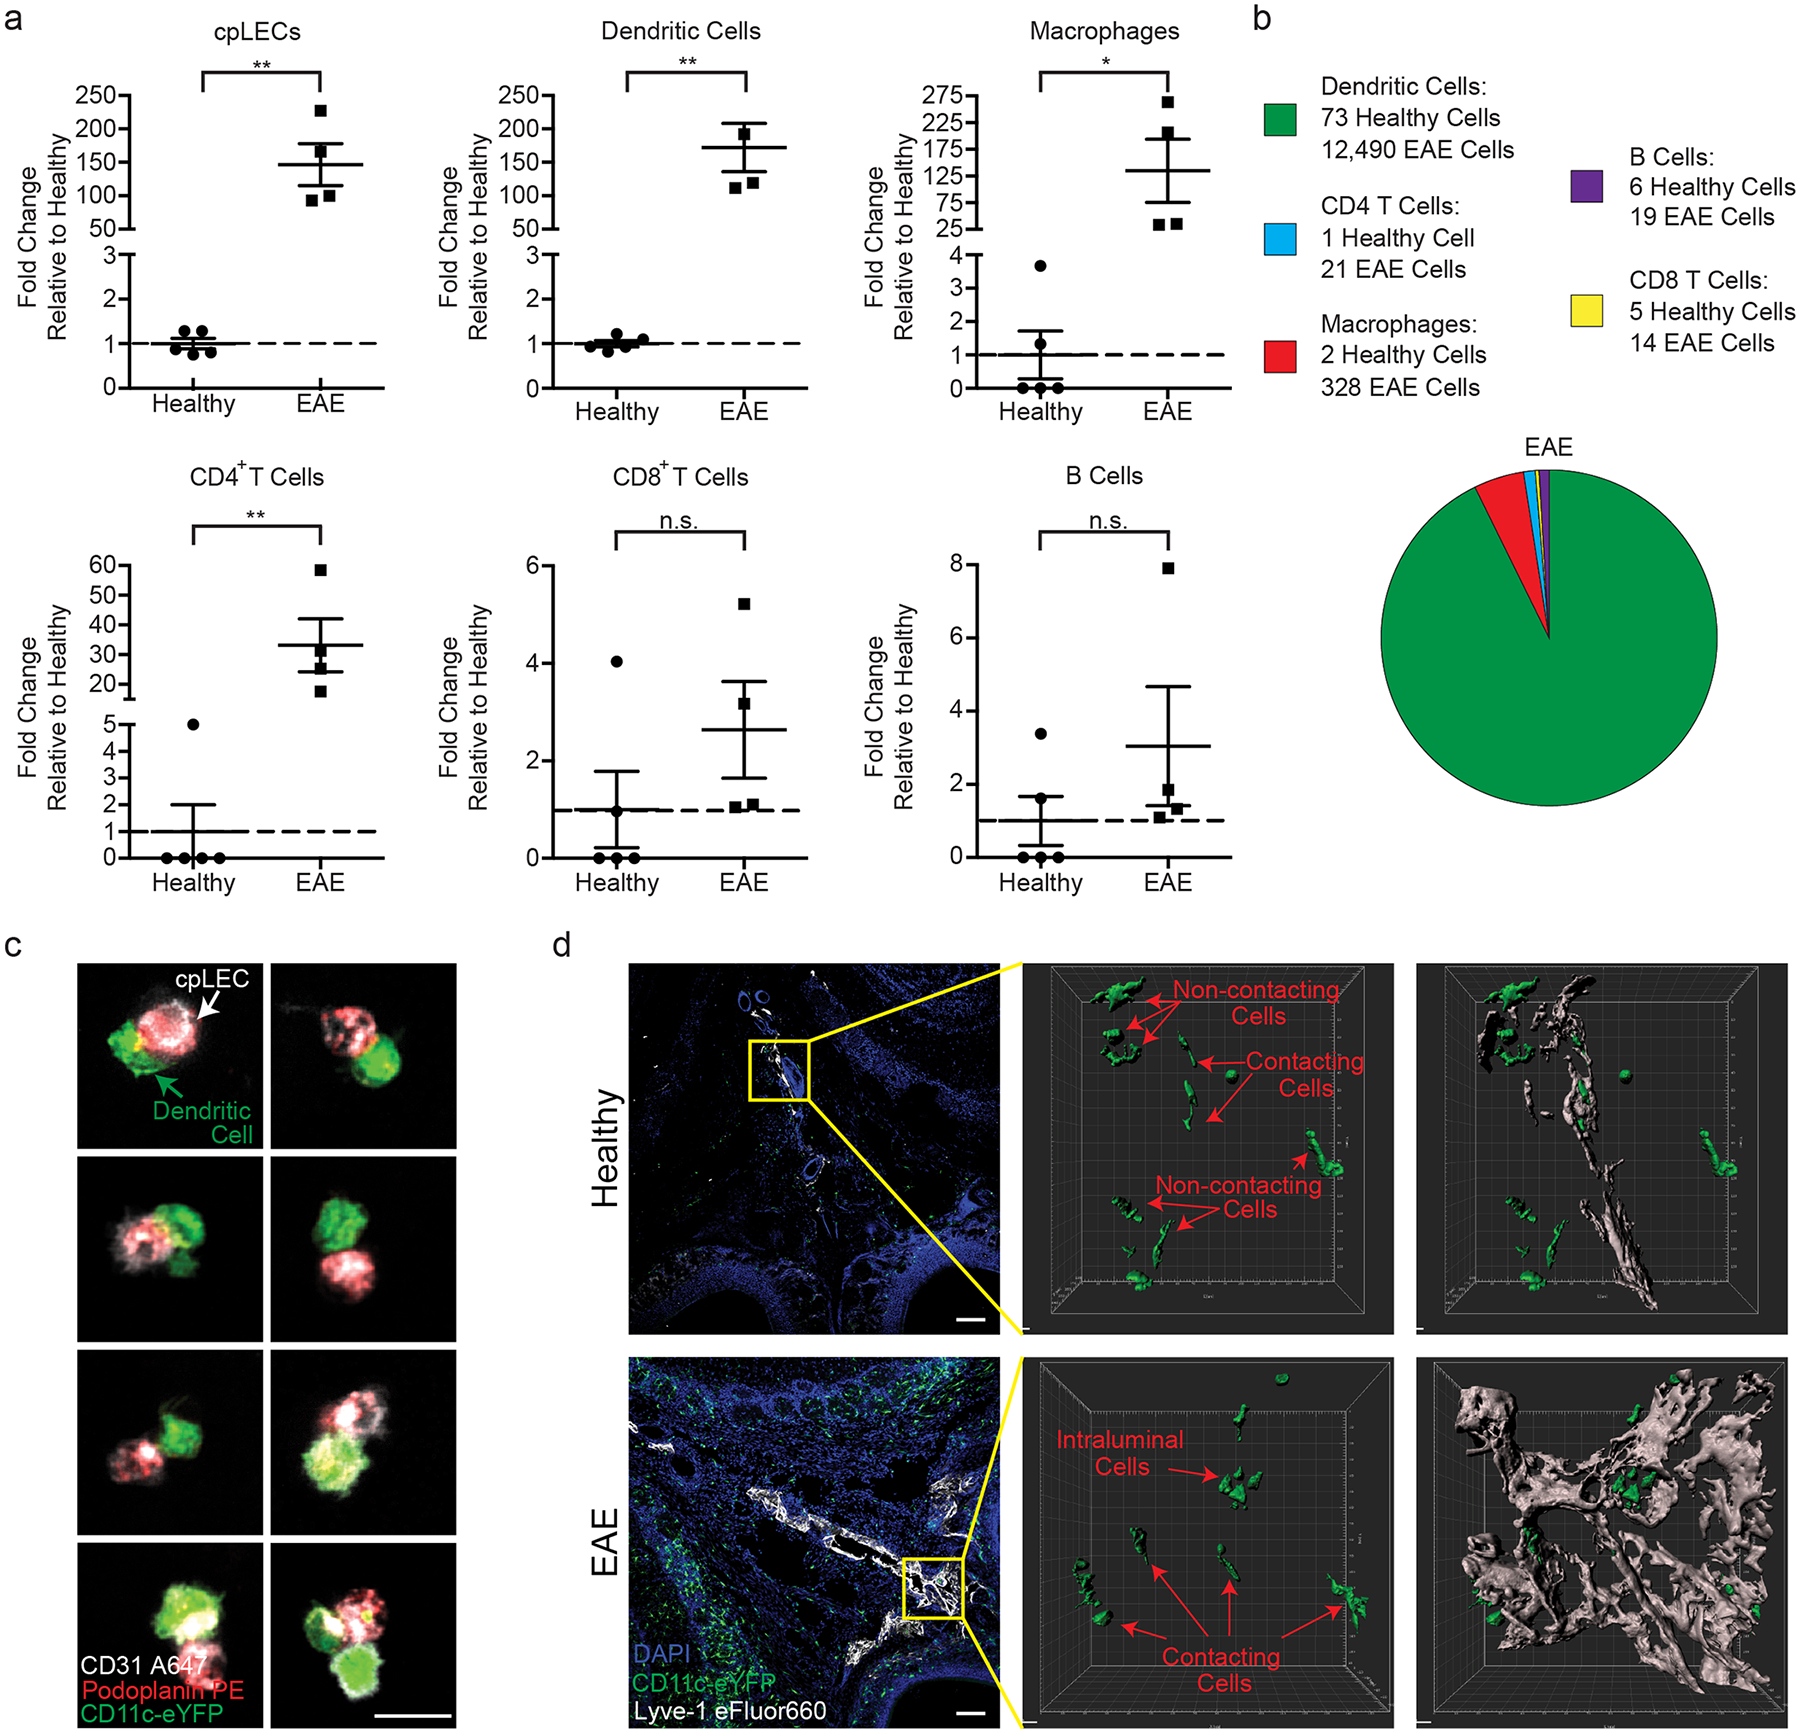
(a): Quantitation of the average fold changes in cpLECs, dendritic cells, macrophages, CD4 and CD8 T cells, and B cell numbers during EAE score 3.0 relative to healthy. n = 5 healthy mice, 4 EAE mice; data are represented as mean ± standard error of the mean. cpLECs, p = 0.0012; dendritic cells, p = 0.0010; macrophages, p = 0.0367, CD4 T cells, p = 0.0047, CD8 T cells, p = 0.2300, B cells, p = 0.2474; unpaired Student’s t-test.
(b): Pie charts showing the relative composition of different leukocytes bound to cpLECs in healthy controls and EAE mice. 12,872 cells total.
(c): CD11c-eYFP transgenic reporter mice were induced with EAE and underwent the same harvest protocol as (a – b) to visualize leukocyte – LEC binding using confocal microscopy on day 15 post-immunization at score 3.0. Representative confocal microscopy images show doublets and the occasional triplet consisting primarily of a CD11c+ dendritic cell bound to a CD31+ Podoplanin+ LEC. Scale bar = 10 μm
(d): CD11c-eYFP transgenic reporter mice were induced for EAE, and dendritic cell – LEC interactions were visualized in situ using immunohistochemistry and 3D rendering with IMARIS. The top panel is representative of healthy, and the bottom panel is representative of EAE animals at score 3.0, 15 days post-immunization. Scale bar = 100 μm
CpLECs capture and present CNS-derived antigens.
Of the gene pathways involved in cpLEC-leukocyte crosstalk, antigen processing and presentation was the most significant, which correlates with the increased number of CD11chigh CD11b+ dendritic cells and CD4+ T cell binding to cpLECs. To validate antigen presentation, we induced EAE in CNP-Cre x OVAfl/fl (CNP-OVA) transgenic mice, in which OVA257–264-OVA323–339-GFP is endogenously expressed under the CNPase promoter to drive expression by oligodendrocytes as previously described32. These mice contain OVA257–264-OVA323–339-GFP within oligodendrocytes, which can functionally contribute to the proliferation of OVA-specific T cells in the draining lymph nodes during neuroinflammation4,32,33. Importantly, these mice allow us to investigate if cpLECs can access CNS-derived antigens without disrupting the arachnoid barrier through cisterna magna or intracerebral injection of exogenous peptide. Immunolabeling of the cortex in CNP-OVA mice with antibodies against GFP and CNPase confirms expression of OVA-GFP within oligodendrocytes of the CNS (Fig. 3a–c). During EAE, OVA-GFP+ expression could be observed both near cpLECs and within Podoplanin+ MHC II+ cpLECs (Fig. 3d–l), suggesting cpLECs can access and potentially present CNS-derived antigens during EAE. Orthogonal views of a Podoplanin+ MHC II+ LEC confirms the intracellular labeling of OVA-GFP (Fig. 3e–eii). Intracellular OVA-GFP was also confirmed within Podoplanin+ MHC II+ cells by IMARIS 3D surface rendering (Fig. 3i–l). Furthermore, plot profile intensity analysis of cpLECs and nearby non-cpLECs reveal that a subpopulation of cpLECs contain OVA-GFP and express MHC II (Fig. 3m). Control immunolabeling of the cribriform plate without anti-GFP antibody confirmed the lack of unspecific GFP signal in this region (Fig. 3n–p). The expression of MHC II by cpLECs during EAE was also be validated by flow cytometry, where steady state cpLECs contain much lower, if any, MHC II expression (Fig. 3q). A large accumulation of CD11chigh MHC II+ dendritic cells containing OVA-GFP can also be observed within and near cpLECs during EAE (Fig. 3r–v), suggesting that at least some CNS-derived antigens may be transported to cpLECs within dendritic cells. MHC II expression by cpLECs containing intracellular OVA-GFP also correlated with a large accumulation of CD4 T cells near cpLECs in situ (Fig. 3w–yii). Taken together, these data suggest that lymphangiogenic cpLECs can capture CNS-derived antigens, express MHC II, and interact with dendritic and CD4 T cells during neuroinflammati.
Figure 3: cpLECs capture and present CNS-derived antigen.
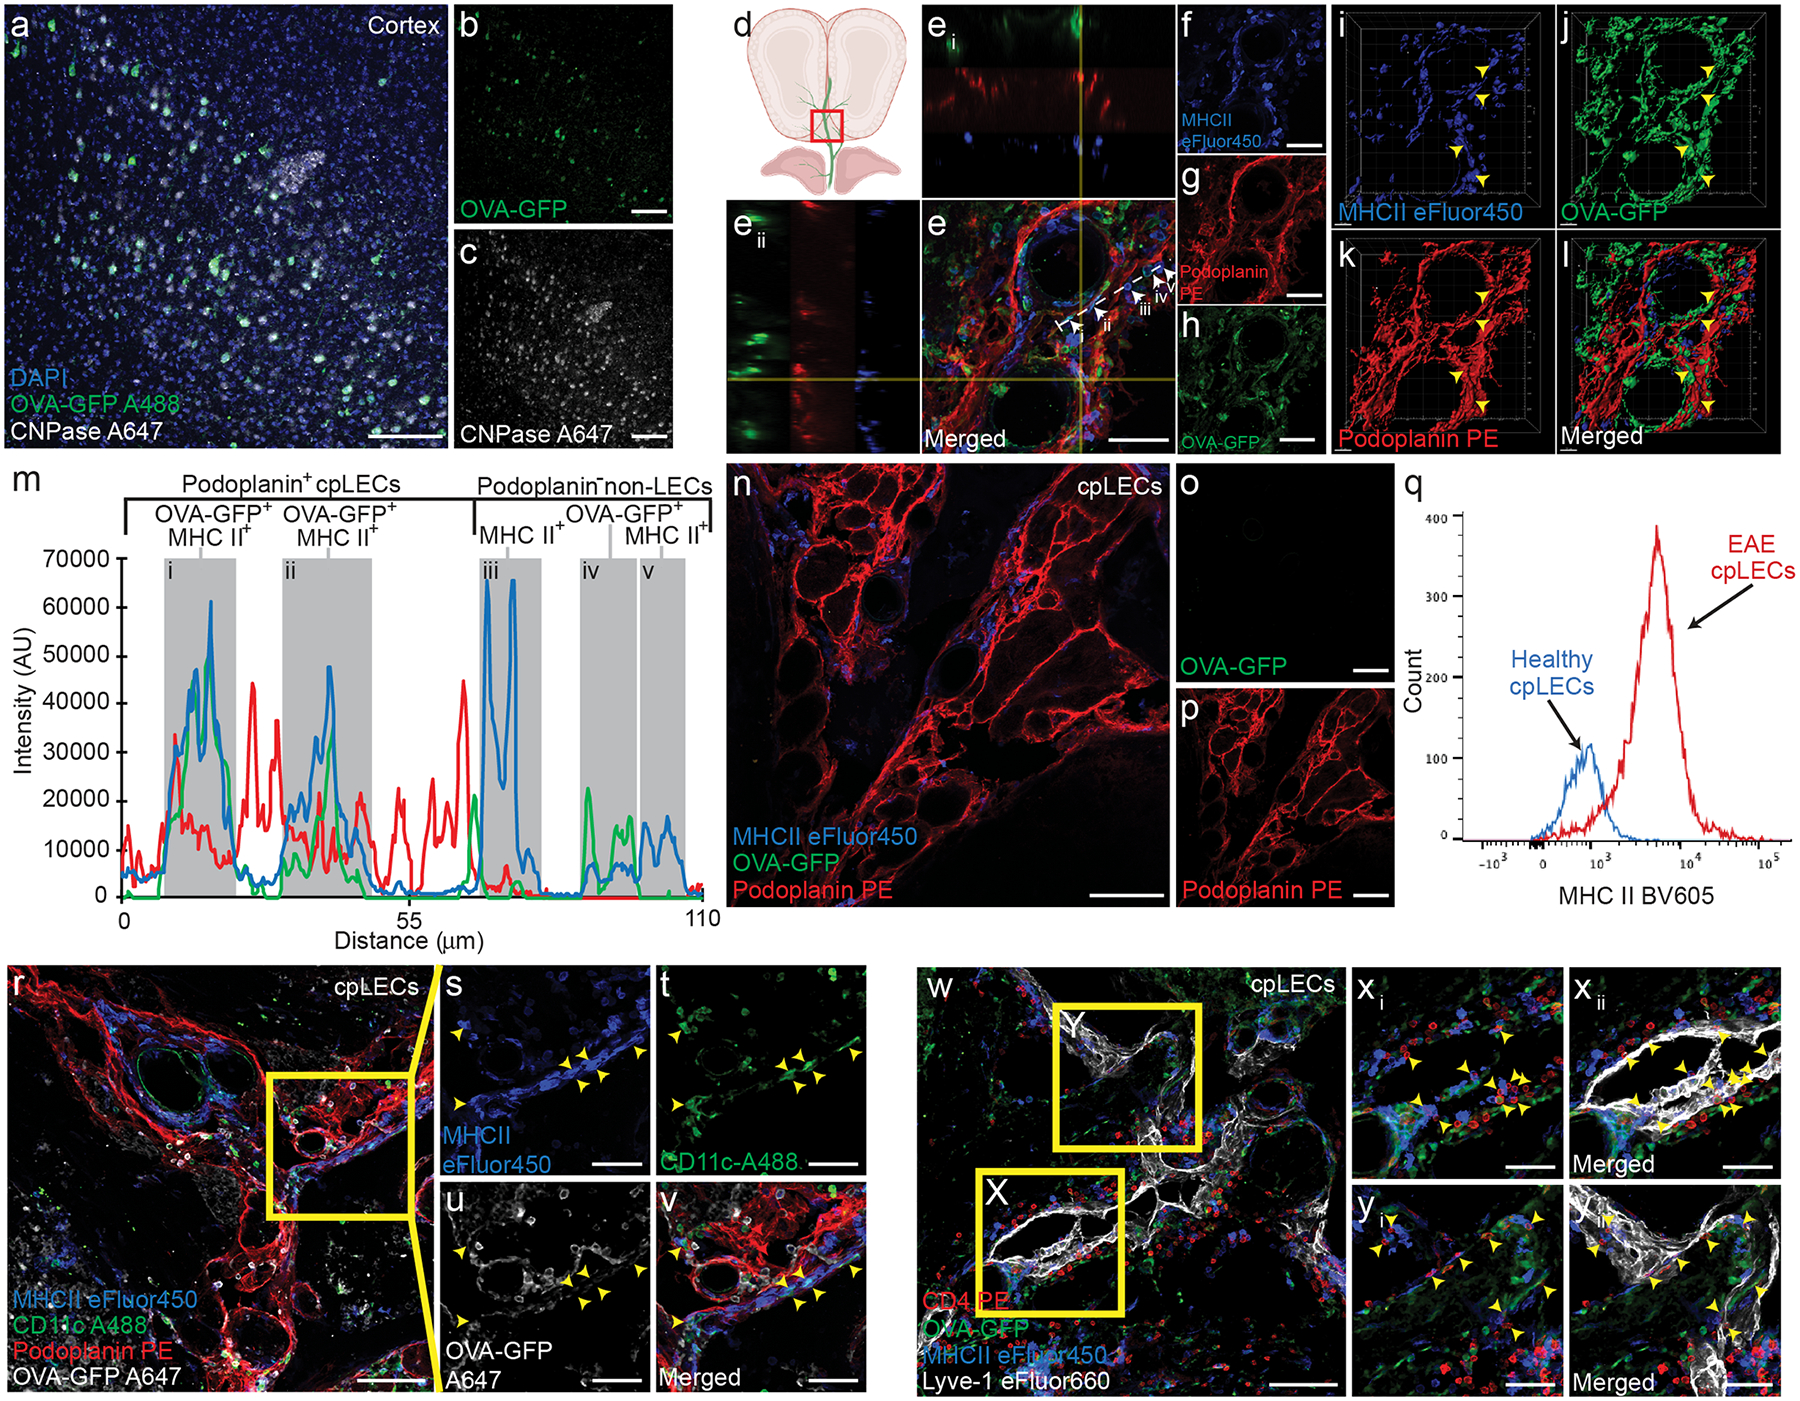
(a – c): EAE was induced in CNP-OVA transgenic mice and analyzed on day 15 post-immunization at score 3.0, in which OVA-GFP+ fl/fl expression is driven by the oligodendrocyte specific CNPase-Cre. Immunohistochemistry of layers V/VI of the cortex confirm OVA-GFP expression by CNPase+ oligodendrocytes within the CNS when immunolabeled with an anti-GFP antibody. Scale bar = 100 μm
(d – h): Immunolabeling of cpLVs confirm MHC II expression and OVA-GFP+ signal by a subset of Podoplanin+ cpLECs. Perpendicular yellow lines highlight two orthogonal views (Ei) and (Eii) along x and y axis indicating colocalization. White dotted line denotes profile intensity of ROI analyzed in (m).
(i – l): 3-D reconstruction of (e – h). Yellow arrowheads indicate MHC II+ OVA-GFP+ cpLECs. Scale bar = 50 μm
(m): Representative plot profile intensity of cells as indicated by the white line shown in (e) showing 5 representative cells, consisting of MHC II+ OVA-GFP+ cpLECs (i and ii), MHC II+ non-cpLECs (iii and v), and MHC II+ OVA-GFP+ non-cpLEC (iv).
(n – p): Control immunolabeling of Podoplanin+ cpLECs with MHCII and without an anti-GFP primary antibody, confirming that there is no unspecific labeling of GFP with the secondary antibody. Scale bar = 100 μm
(q): The median fluorescence intensity histogram of MHCII of cpLECs.
(r – v): Immunolabeling of cpLVs with Podoplanin and dendritic cells near the cribriform plate with CD11c along with MHC II and OVA-GFP. Yellow arrowheads indicate MHC II+ OVA-GFP+ CD11c+ dendritic cells in contact with Podoplanin+ cpLECs. Scale bar = 100 μm (r), 50 μm (s – v)
(w – yii): Immunolabeling of cpLVs with Lyve-1 and CD4+ T cells near the cribriform plate with MHC II and OVA-GFP. Yellow arrowheads indicate CD4+ T cells in contact with MHC II+ OVA-GFP+ Lyve-1+ cpLECs. Scale bar = 100 μm (w), 50 μm (xi – yii)
Immunolabeling with CD11b confirms that there is OVA-GFP+ expression within Podoplanin+ MHC II+ LECs outside of potential CD11b+ antigen presenting cells that may be migrating through LECs (Extended Data Fig. 4b–i). This is similar for both healthy and EAE, consistent with the idea that immune surveillance occurs during steady-state conditions32. The average percent area of CD11b−, Podoplanin+ LECs containing OVA-GFP did not change between healthy and EAE (Extended Data Fig. 4j), likely because of increased Podoplanin+ area due to lymphangiogenesis. Quantifying total area of OVA-GFP within CD11b− Podoplanin+ LECs during EAE reveal a significant increase relative to healthy controls (Extended Data Fig. 4k), suggesting increased CNS-derived antigen accumulation within cpLECs during neuroinflammation. There was also a significant increase in the number of CD11b+ cells containing OVA-GFP within Podoplanin+ LECs during EAE (Extended Data Fig. 4l), indicating that OVA-GFP accumulation near the cribriform plate may also be carried within recruited myeloid cells. These data confirm that a population of inflamed cpLECs can process CNS-derived antigens. Additionally, the upregulation of the adhesion molecule Vcam-1 as shown by scRNAseq was also confirmed by immunohistochemistry (Extended Data Fig. 4m–o).
To test if cpLECs can present antigen, we cocultured cpLECs with 2D2 T cells to measure the ability of cpLECs to activate MOG35–55 specific 2D2 T cells (Fig. 4). cpLECs from healthy or EAE-induced wild-type mice were FACS sorted and co-cultured with magnetically purified 2D2 T cells from splenocytes of naive 2D2 T cell receptor transgenic mice using CD4 negative selection. Healthy cpLECs induce negligible levels of T cell activation (approximately 6% of 2D2 T cells expressing CD69) (Fig. 4a–b). In contrast, cpLECs from EAE mice are able to induce CD69 expression in approximately 43% of 2D2 T cells (Fig. 4a–b), suggesting that cpLECs are able to engage in antigen processing and presentation during EAE. After 72 h of co-culture, healthy cpLECs induced T cell proliferation in approximately 22% of 2D2 T cells (Fig. 4c–d), while EAE-primed cpLECs induced T cell proliferation in approximately 38% of 2D2 T cells (Fig. 4c–d), reflecting a 1.7 fold increase in T cell proliferation with many of T cells undergoing additional cycles of proliferation. Additionally, EAE-primed cpLECs can also functionally present another antigenic peptide, OVA323–339, to activate OVA323–339-specific OT-II CD4 T cells using the same co-culture model when cpLECs were isolated from EAE-induced CNP-OVA transgenic mice (Extended Data Fig. 5). These data show that unlike steady-state lymphatics, EAE-primed cpLECs can functionally process and present CNS-derived antigens to CD4 T cells during EAE.
Figure 4: Inflamed cpLECs activate naïve 2D2 T cells.
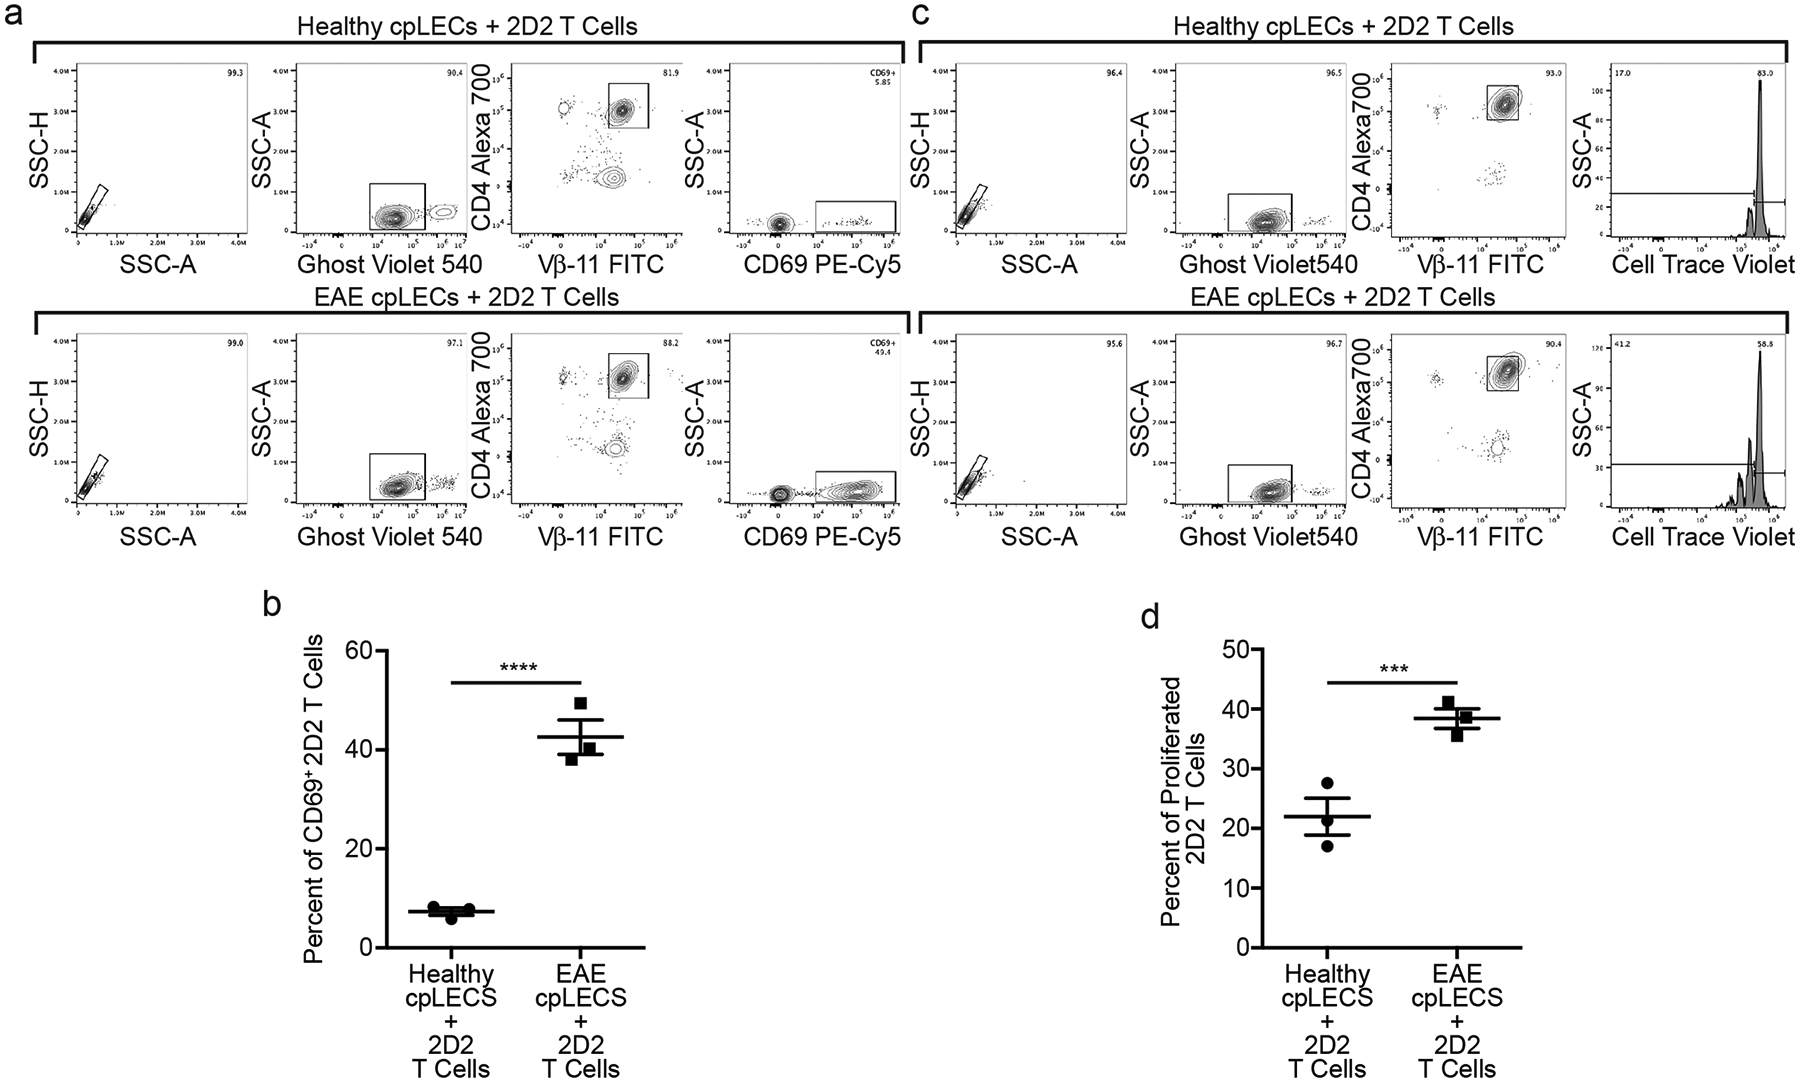
(a – b): Gating strategy for cpLECs collected from EAE and healthy control mice were co-cultured for 24 h with 2D2 T-cells. (a). Quantification of percent of activated (CD69+) 2D2 T-cells after 24 h of co-culture (b). n = 3 experimental replicates, pooled from 4 healthy and 4 EAE mice; data are represented as mean ± standard error of the mean. p = 0.0006; unpaired Student’s t-test.
(c – d): Gating strategy for cpLECs collected from EAE and healthy control mice were co-cultured for 72 h with 2D2 T-cells. (c). Quantification of percent of proliferated (CellTrace Violet) 2D2 T-cells after 72 h of co-culture (d). n = 3 experimental replicates, pooled from 4 healthy and 4 EAE mice; data are represented as mean ± standard error of the mean. p = 0.0092; unpaired Student’s t-test.
EAE increases proteins related to cpLEC-leukocyte interactions.
While characterizing cpLECs by flow cytometry, we noticed that many of the markers used to identify LECs were upregulated at the protein level during neuroinflammation. Podoplanin, Lyve-1, and CD31 are all implicated in lymphatic vessel-leukocyte interactions34–37, consistent with our previous data showing cpLEC-leukocyte binding (Fig. 2). While scRNA-seq was unable to screen for these particular markers with sufficient average counts, other genes such as PD-L1 (CD274), a tolerogenic ligand that can interact with the PD-1 receptor expressed by dendritic cells and T cells during inflammation12,15–17, was also enriched by cpLECs during EAE (Fig. 1). In order to investigate if these same markers correlated with dendritic cell and CD4 T cell binding to cpLECs, we validated Podoplanin, Lyve-1, CD31, and PD-L1 upregulation by cpLECs during EAE at the protein level using flow cytometry (Extended Data Fig 6a). When gating for live, singlet cpLECs, the expression of Podoplanin, Lyve-1, CD31, and PD-L1 were indeed upregulated during EAE compared to healthy controls (Extended Data Fig. 6b–q). The expression of these proteins was further upregulated when gating for cpLEC-leukocyte doublets with the exception of Lyve-1, which may suggest that leukocytes preferably bind to cpLECs with the highest expression of these proteins. Alternatively, CD3134 and PD-L115 have also been reported to be expressed by leukocytes/dendritic cells, which may increase the doublet median fluorescence intensity (MFI) when bound to a cpLEC that also expresses these markers. While background MFI of doublets versus singlets could be observed for some markers, the increase in MFI due to doublet background was negligible when compared to protein expression (Extended Data Fig. 7). Increased cpLEC expression of Podoplanin, Lyve-1, CD31, and PD-L1 during EAE suggests that cpLECs functionally alter their phenotype to promote leukocyte adhesion/chemotaxis and regulation.
Upregulation of Podoplanin and PD-L1 is mediated by IFN-γ.
We next investigated what potential cytokines may be involved in cpLEC-leukocyte interactions during EAE. EAE induced in C57BL/6 mice are characterized by a strong Th1/Th17 response38, which has also been hypothesized to regulate both Podoplanin and PD-L1 expression by peripheral lymphatics during inflammation39,40. Furthermore, genes involved in response to IFN-γ by cpLECs appeared earlier in pseudotime compared to genes involved in leukocyte activation such as PD-L1 (Extended Data Fig. 3), suggesting that IFN-γ may regulate the expression of PD-L1. Mice deficient in the pro-inflammatory cytokine IFN-γ have exacerbated EAE41,42, highlighting a tolerogenic role for IFN-γ. Thus, we hypothesized that IFN-γ may be responsible for the increased expression of Podoplanin and PD-L1 by cpLECs, which may partially explain the tolerogenic role of IFN-γ during EAE. EAE was induced in wild-type and IFN-γ−/− mice, and at EAE score 3.0 were analyzed for the expression of Podoplanin and PD-L1 (Extended Data Fig. 8a, Fig. 5a–b). Identically scored EAE mice were used to prevent nonspecific effects due to differences in EAE severity between wild-type and IFN-γ−/− mice since IFN-γ−/− mice41,42. Similar to our previous results, EAE upregulates Podoplanin, PD-L1, and CD31 expression by cpLECs, as well as PD-L1 expression by dendritic cells (Fig. 5a–d). CpLECs from IFN-γ−/− mice have reduced expression of Podoplanin and PD-L1 while CD31 expression remained unchanged, suggesting Podoplanin and PD-L1 up-regulation during EAE are both dependent on IFN-γ signaling (Fig. 5a–d).
Figure 5: Upregulation of Podoplanin and PD-L1 is mediated by IFN-γ.
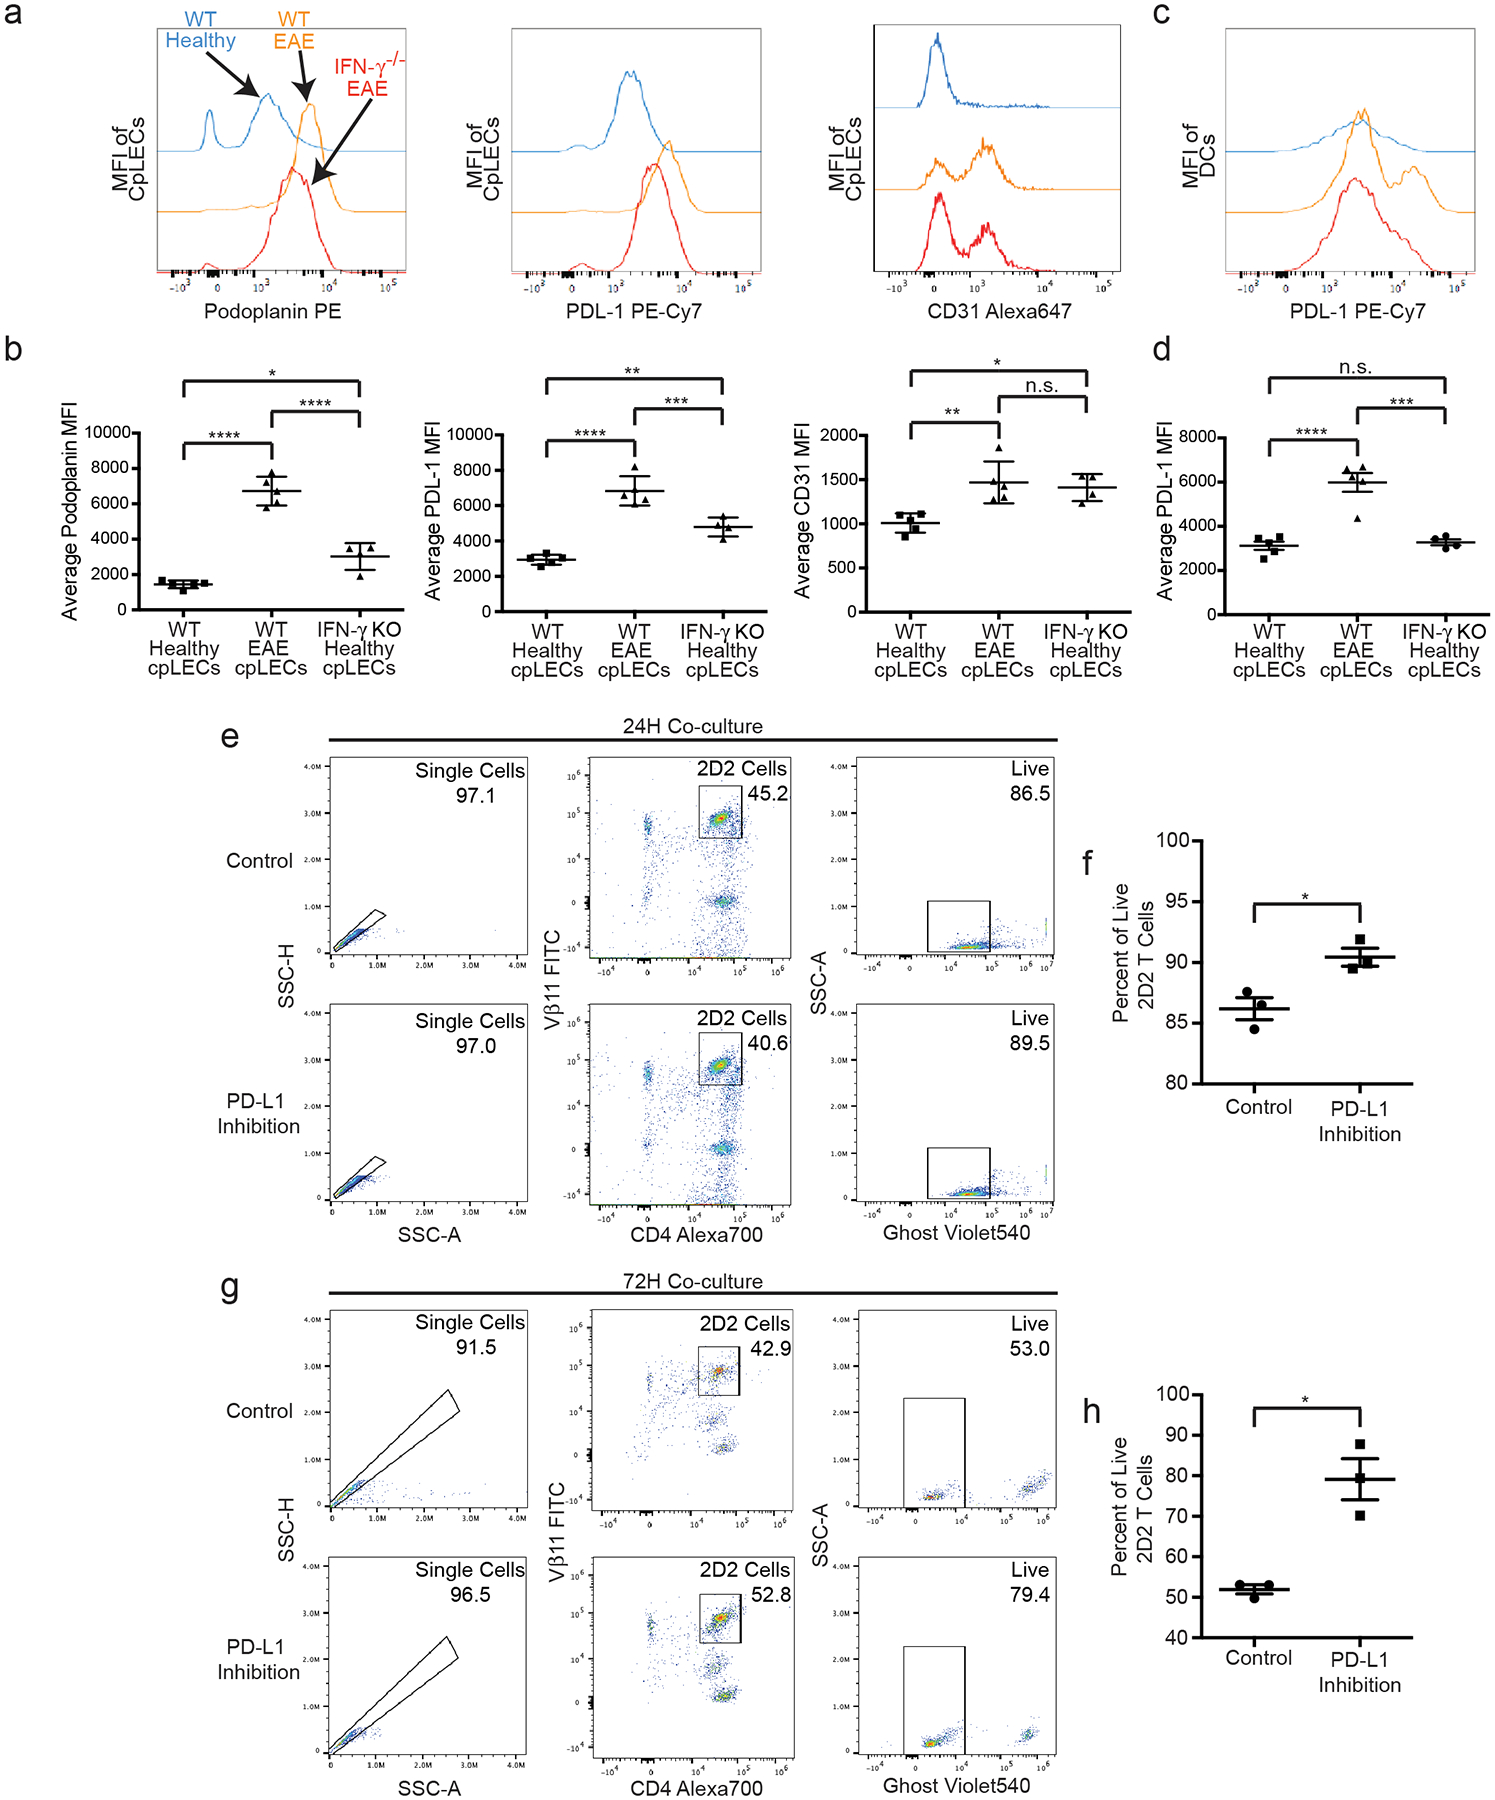
(a – b): The median fluorescence intensity and quantitation of Podoplanin, PD-L1, and CD31 in cpLEC of wild-type and IFN-γ−/− C57BL/6J mice. n = 5 wild-type healthy mice, 5 wild-type EAE mice, 4 IFN-γ−/− EAE mice; data are represented as mean ± standard error of the mean. For Podoplanin MFI, wild-type healthy vs. wild-type EAE, p < 0.0001; wild-type healthy vs. IFN-γ−/− EAE, p = 0.0101; wild-type EAE vs. IFN-γ−/− EAE, p < 0.0001. For PD-L1 MFI, wild-type healthy vs. wild-type EAE, p < 0.0001; wild-type healthy vs. IFN-γ−/− EAE, p = 0.0020; wild-type EAE vs. IFN-γ−/− EAE, p = 0.0010. For CD31 MFI, wild-type healthy vs. wild-type EAE, p = 0.0043; wild-type healthy vs. IFN-γ−/− EAE, p < 0.0001; wild-type EAE vs. IFN-γ−/− EAE, p < 0.0001; one-way ANOVA with Tukey’s post-hoc multiple comparisons test.
(c – d): The median fluorescence intensity and quantitation of PD-L1 in dendritic cells of wild-type and IFN-γ−/− C57BL/6J mice. n = 5 wild-type healthy mice, 5 wild-type EAE mice, 4 IFN-γ−/− EAE mice; data are represented as mean ± standard error of the mean. For PD-L1 MFI, wild-type healthy vs. wild-type EAE, p < 0.0001; wild-type healthy vs. IFN-γ−/− EAE, p = 0.9314; wild-type EAE vs. IFN-γ−/− EAE, p < 0.0002; one-way ANOVA with Tukey’s post-hoc multiple comparisons test.
(e – f): Gating strategy for cpLECs collected from EAE mice were co-cultured for 24 h with 2D2 T-cells and treated with either a PD-L1 inhibitor or PBS control (e). Quantification of percent live (Ghost−) 2D2 T-cells after 24 h of co-culture (f). n = 3 experimental replicates, pooled from 4 healthy and 4 EAE mice; data are represented as mean ± standard error of the mean. Control vs. PD-L1 inhibition, p = 0.0225; unpaired Student’s t-test.
(g – h): Gating strategy for cpLECs collected from EAE mice were co-cultured for 72 h with 2D2 T-cells with either a PD-L1 inhibitor or PBS control (g). Quantification of percent live (Ghost−) 2D2 T-cells after 24 h of co-culture (h). n = 3 experimental replicates, pooled from 4 healthy and 4 EAE mice; data are represented as mean ± standard error of the mean. Control vs. PD-L1 inhibition, p = 0.0064; unpaired Student’s t-test.
To functionally test the tolerogenic role of PD-L1, we co-cultured EAE-primed cpLECs with naive 2D2 T cells in vitro in the presence or absence of PD-L1 blocking antibody (Fig. 5e–h). PD-L1 inhibition significantly improved cell viability after 72 h of co-culture (Fig. 5g–h), suggesting that PD-L1 signaling by cpLECs contributes to naïve 2D2 T cell death. The increase in cell death after 72 h likely reflects the fact that naïve T cells do not initially express PD-1 and undergo activation/proliferation before PD-1 expression52.
Since IFN-γ seemed to regulate some of the phenotypes of EAE-induced lymphangiogenic cpLECs, we looked to see if IFN-γ is required for lymphangiogenesis. We gated for cpLECs from healthy wild-type mice, EAE wild-type mice, and EAE IFN-γ−/− mice. CpLECs from IFN-γ−/− mice still underwent lymphangiogenesis during EAE (Extended Data Fig. 8), suggesting that although lymphangiogenesis does not require IFN-γ signaling, some of the acquired phenotypes of lymphangiogenic vessels including Podoplanin and PD-L1 upregulation require IFN-γ signaling.
CpLECs are in a prime position to access CSF.
Although meningeal lymphatics can access CSF1–4, how they access the CSF-filled SAS through E-Cadherin+ epithelial cells that make up the arachnoid barrier is unknown43. To visualize the epithelial cells that comprise the arachnoid barrier separating the meningeal LECs above the sinuses, base of the brain, and cpLECs from the SAS, we immunolabeled coronal sections with the epithelial adherens junction protein E-Cadherin (Fig. 6a–c). We validated a continuous, uninterrupted E-Cadherin+ arachnoid barrier separating both the dural LECs and basal LECs from the SAS, with basal LECs residing in closer proximity to the SAS3 (Fig. 6b–c). In contrast, there are large gaps in E-Cadherin labeling between cpLECs and the SAS (Fig. 6a), which has only been seen in developing rats44. These data suggest that lymphatics near the cribriform plate may have direct access to CSF through gaps in the arachnoid barrier.
Figure 6: cpLECs are in a prime position to access CSF.
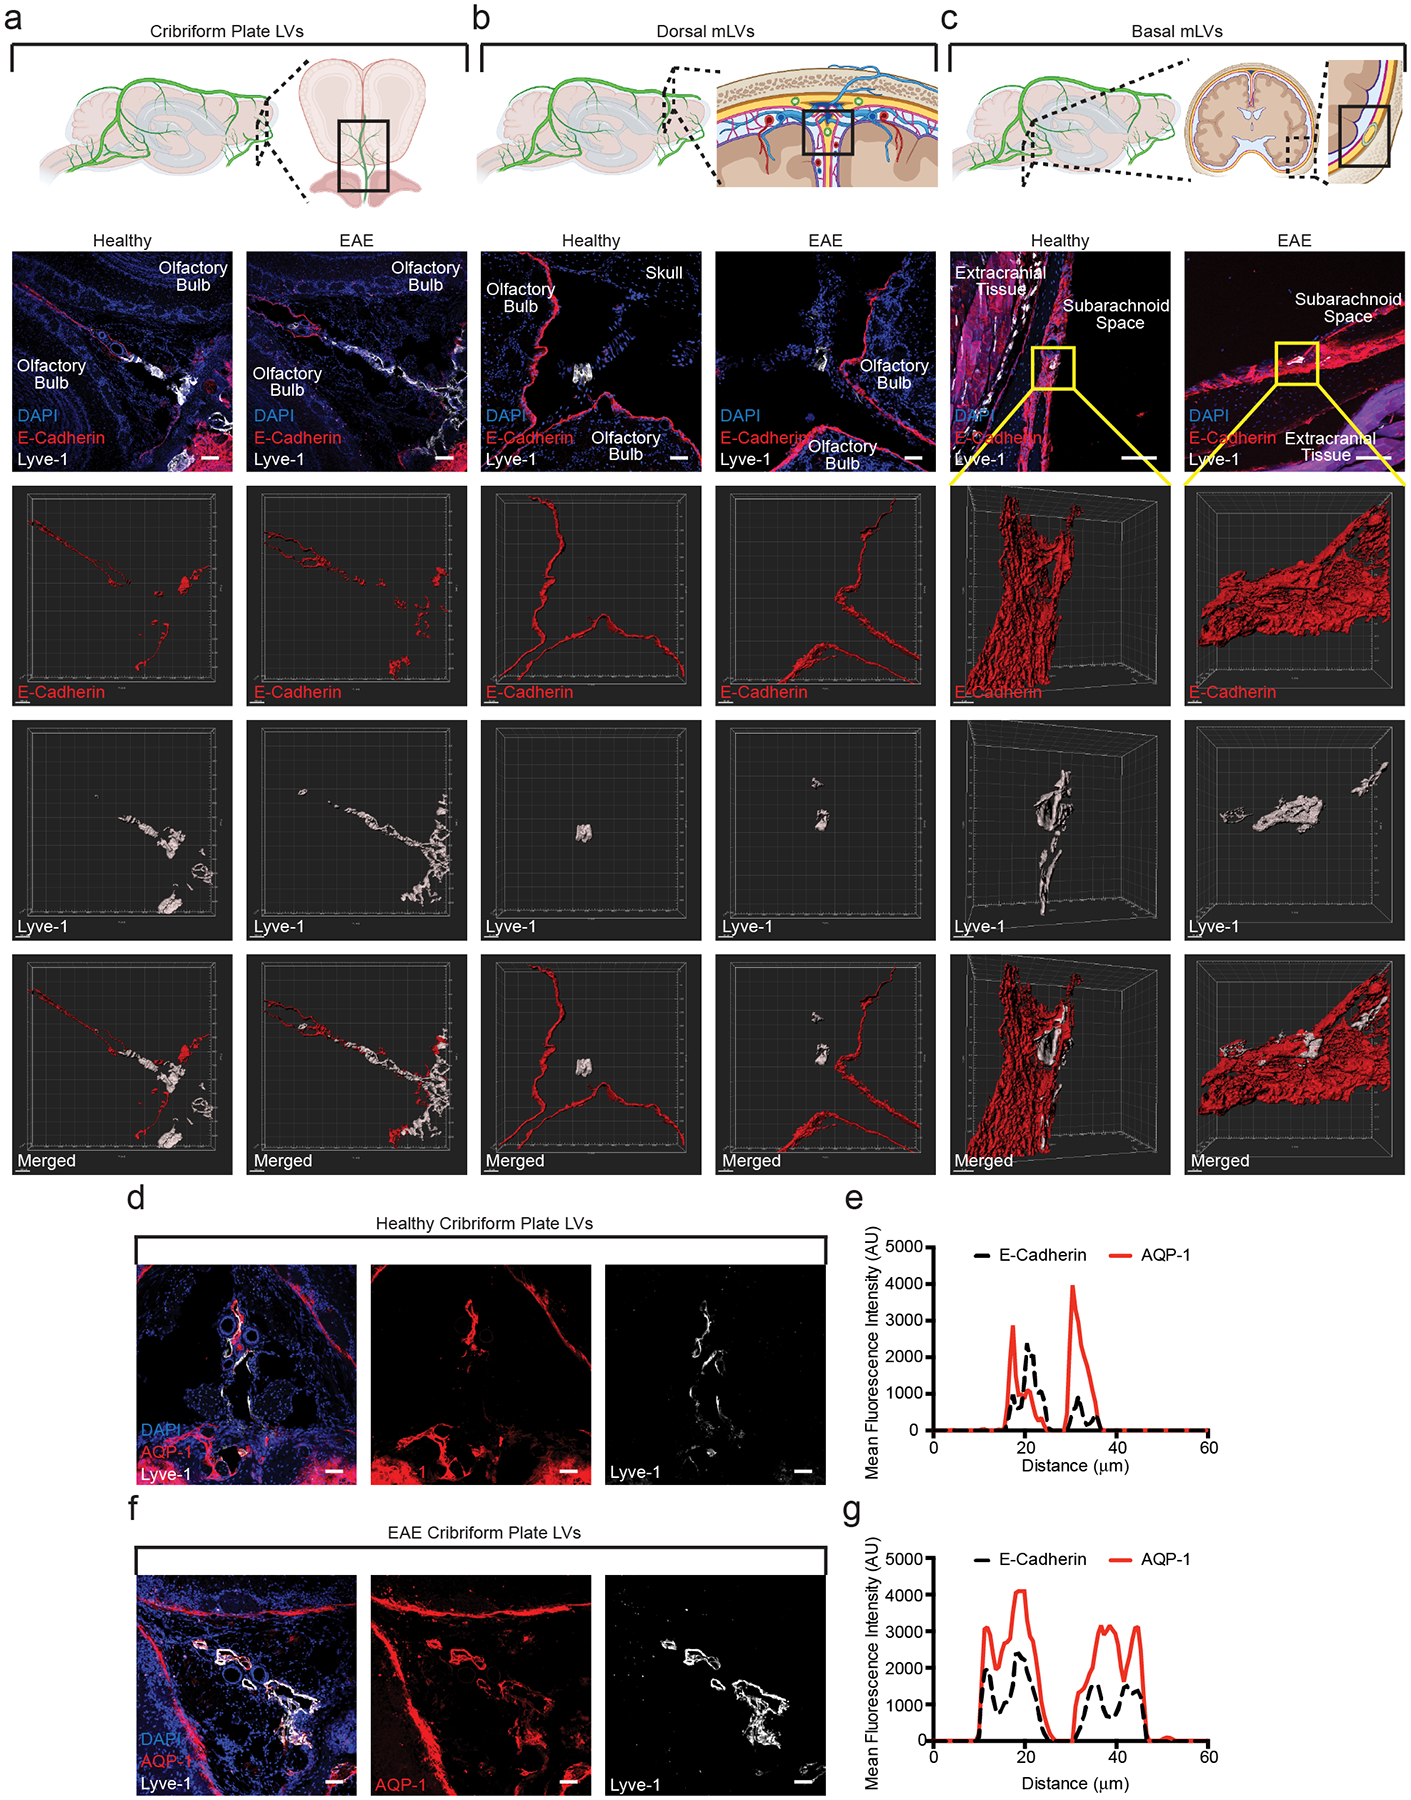
(a – c): Immunolabeling of the cribriform plate (a), dura above the olfactory bulbs (b), and basal meninges below the brain (c). Top row: Schematics outlining where each of the confocal images are taken. All sections are coronal sections of the whole head. Second row: merged immunohistochemistry images labeled with DAPI to visualize nuclei, E-Cadherin for the epithelial cells that comprise the arachnoid barrier, and Lyve-1 for lymphatic vessels. Third row: 3D surface rendering of the E-Cadherin+ arachnoid barrier. Fourth row: 3D surface rendering of the Lyve-1+ lymphatic vessels. Fifth row: 3D surface rendering of both the E-Cadherin+ arachnoid barrier and Lyve-1+ lymphatic vessels together. EAE sections are taken at day 15 post-immunization at EAE score 3.0. Scale bar = 50 μm
(d – g): Immunolabeling of the cribriform plate from either healthy (d) or EAE (f) for the water channel AQP-1 and Lyve-1. Scale bar = 50 μm. Representative plot profile intensity analysis confirms co-localization of AQP-1 expression with Lyve-1+ lymphatic vessels in both healthy (e) and EAE (g). EAE sections are taken at day 15 post-immunization at EAE score 3.0.
We also looked to see if cpLECs express proteins involved in fluid uptake such as Aquaporin-1 (AQP-1)45. Immunohistochemistry reveals the expression of AQP-1 by cpLECs, highlighting a potential mechanism of CSF uptake (Fig. 6d–g). Additionally, AQP-1 is expressed throughout the lymphatic vessel, even after lymphangiogenic expansion of cpLECs (Fig. 6d–g). These data suggest that there may be compensatory mechanisms to manage neuroinflammation-induced edema by increasing the numbers of AQP-1+ LECs through lymphangiogenesis. Gaps in the arachnoid barrier near cpLECs highlight their ability to sample CSF and may explain their unique ability to undergo lymphangiogenesis during EAE.
We also visualized CSF dynamics using Magnetic Resonance Imaging (MRI) before and after Gadolinium injection into the cisterna magna (Fig. 7a–e). Similar to a previous report, the majority of Gadolinium accumulation over time occurred at the base of the brain3 (Fig. 7b). We also found a relatively large amount of Gadolinium accumulation at the base of the olfactory bulbs near the cribriform plate, suggesting that cpLECs reside near a reservoir of CSF (Fig. 7b). A relative increase in Gadolinium accumulation near the base of the brain and cribriform plate during EAE is also consistent with inflammation-induced edema (Fig. 7b, d). Consequently, there was an increase in Gadolinium drainage to the deep cervical lymph nodes (Fig. 7c, e), which correlates with functional lymphangiogenesis by cpLECs. This data suggests that cpLECs have direct access to a CSF reservoir, where lymphangiogenesis occurs to potentially manage inflammation-induced edema.
Figure 7: cpLECs have direct access to the subarachnoid space.
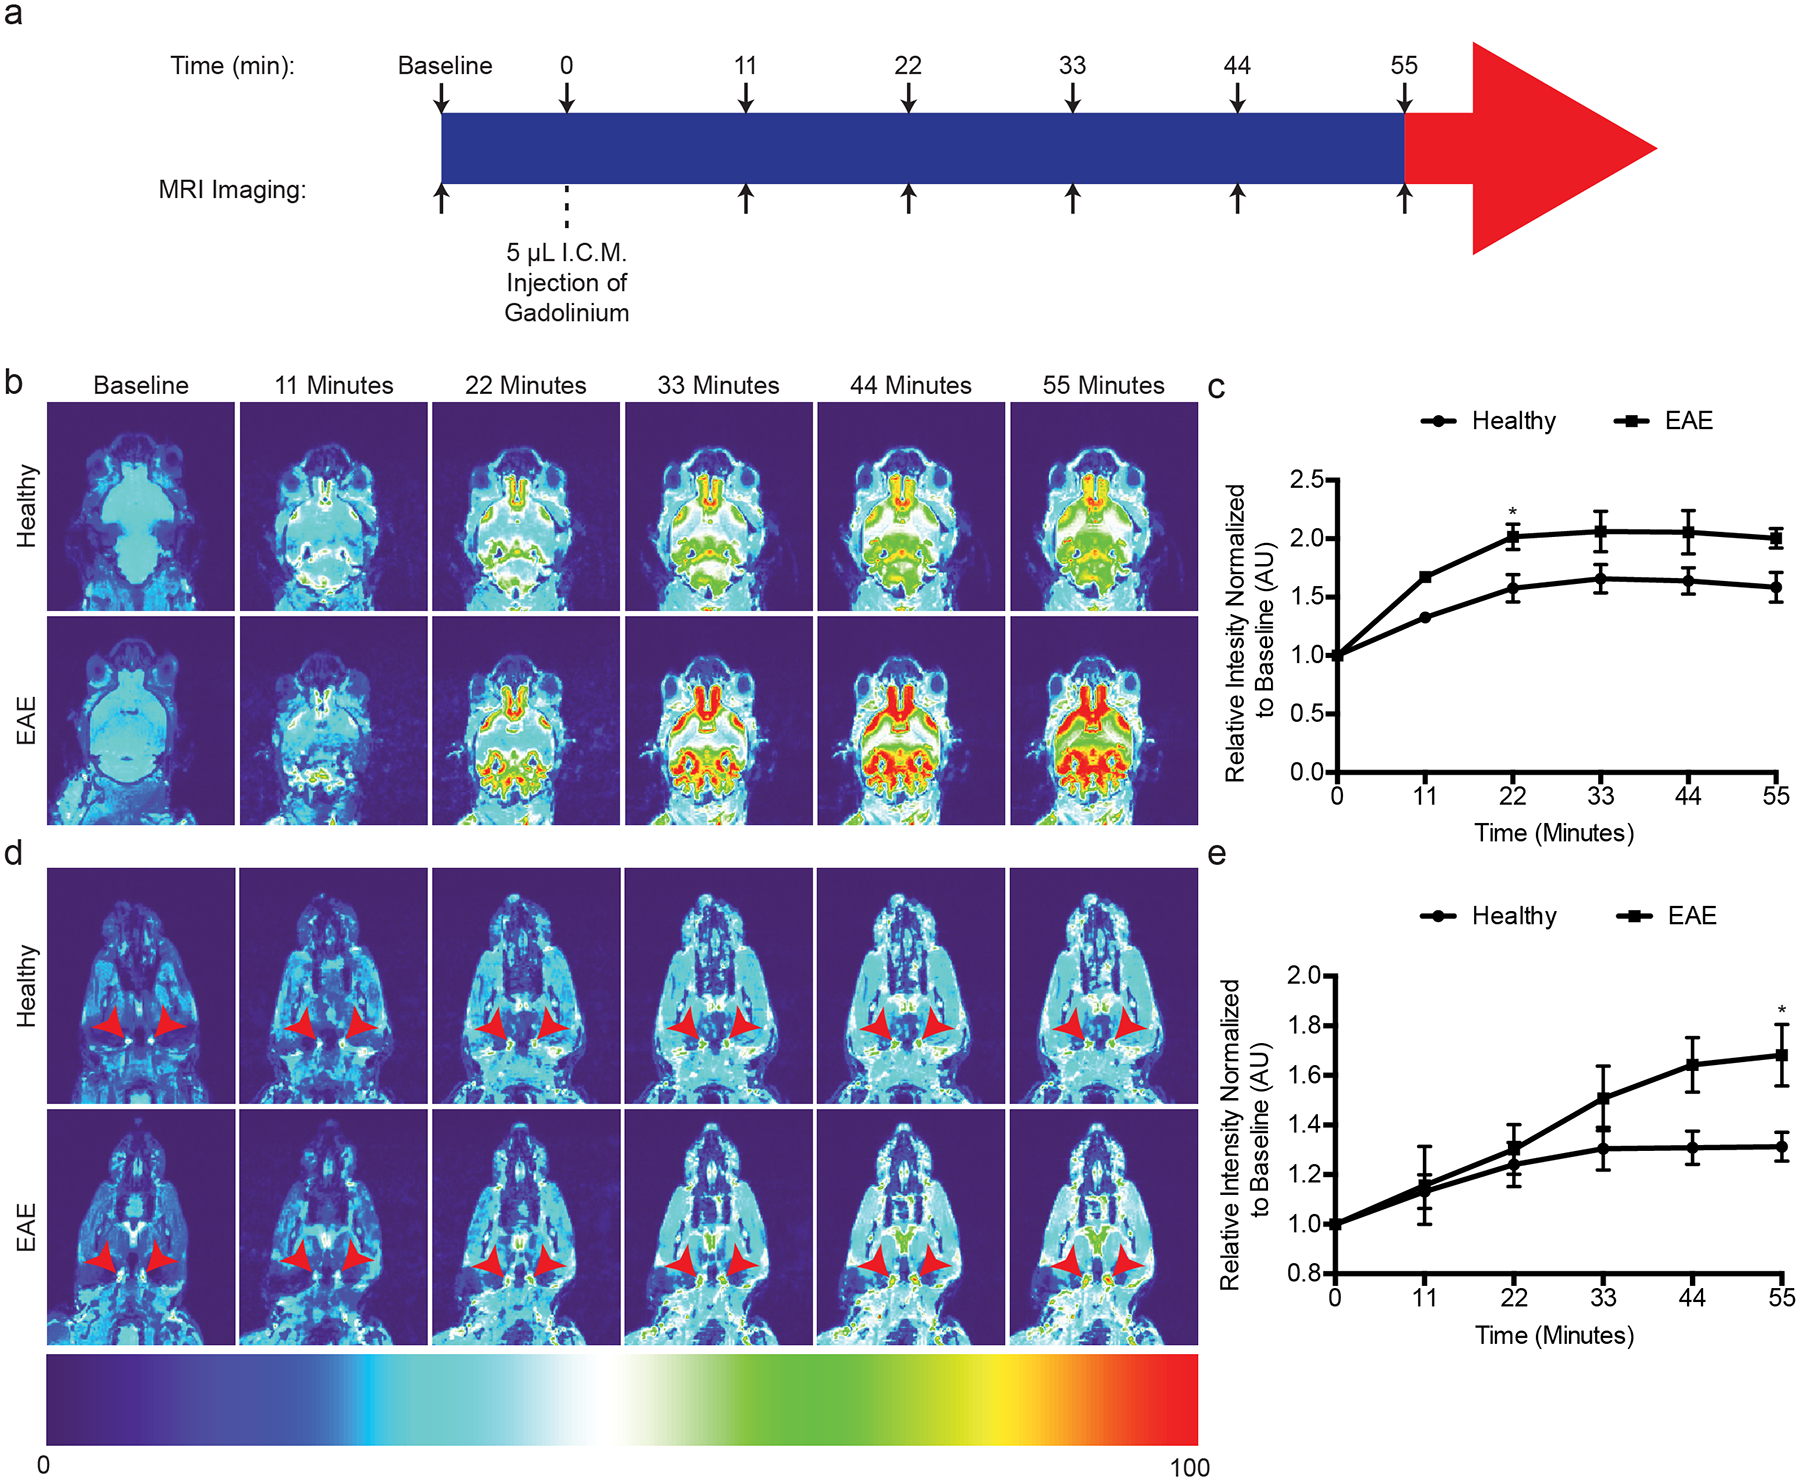
(a): Schematic of experimental design.
(b): Representative T1-weighted scans of the base of the brain and olfactory bulbs where the basal mLVs and cpLVs reside at baseline before Gadolinium infusion, and serial T1-weighted scans after Gadolinium infusion. Representative serial MRI images comparing healthy and EAE score 3.0 are shown. Note the accumulation of Gadolinium signal between the olfactory bulbs and base of the brain.
(c): Quantitation of the average pixel intensity where cpLVs reside, ventral medially to the olfactory bulbs normalized to baseline between healthy and EAE. n = 5 healthy mice, 4 EAE mice; data are represented as mean ± standard error of the mean. For healthy vs. EAE, t = 0 min, p > 0.9999; t = 11 min, p = 0.1707; t = 22 min, p = 0.0398; t = 33 min, p = 0.0707; t = 44 min, p = 0.0568 min; t = 55 min, p = 0.0567; two-way ANOVA using Sidaks multiple comparisons test.
(d): Representative scans of the neck showing the dCLNs as indicated by the red arrowheads comparing healthy and EAE score 3.0.
(e): Quantitation of the average pixel intensity of the dCLNs as indicated by the red arrowheads in (d) normalized to baseline between healthy and EAE. n = 5 healthy mice, 4 EAE mice; data are represented as mean ± standard error of the mean. For healthy vs. EAE, t = 0 min, p > 0.9999; t = 11 min, p > 0.9999; t = 22 min, p = 0.9976; t = 33 min, p = 0.5281; t = 44 min, p = 0.0694 min; t = 55 min, p = 0.0350; two-way ANOVA using Sidaks multiple comparisons test.
Discussion
Unlike lymph node LECs that can engage in leukocyte crosstalk and regulation10–14, it is unknown if meningeal lymphatics are also capable of leukocyte crosstalk46. Nevertheless, the meninges has recently been highlighted as a neuro-immune interface through resident antigen presenting leukocytes46. We posit that neuroinflammation can prime cpLECs to undergo lymphangiogenesis and engage in leukocyte crosstalk and regulation, similar to lymph node resident LECs. During neuroinflammation, cpLECs dynamically respond to the CNS microenvironment to alter their phenotype. These cues induce a variety of changes including lymphangiogenesis driven by VEGFC-producing myeloid cells4, upregulation of leukocyte crosstalk and regulation proteins such as Podoplanin and PD-L1 through IFN-γ, and expression of the antigen processing and presentation machinery. CpLECs can then regulate leukocytes during EAE, which consists primarily of dendritic cells and to a lesser extent CD4 T cells. Additionally, migratory antigen presenting dendritic cells traffic to lymph nodes through lymphatics during inflammation through a variety of signaling mechanisms such as CCR7/CCL2147,48, Podoplanin/Clec235,49, Vcam-150, CD3137, and Lyve-136,51. Here we show that cpLECs not only facilitate the drainage of leukocytes, but functionally bind to dendritic cells and CD4 T cells to engage in cross talk. Dendritic cells can also express the PD-L1 receptor PD-152–56, suggesting that some of the dendritic cells bound to cpLECs may become tolerized. Finally, we demonstrate that cpLECs can capture CNS-derived antigens and functionally present antigen to activate antigen specific CD4 T cells during EAE.
EAE-primed cpLECs functionally present antigens to naive 2D2 T cells to drive activation and proliferation, while simultaneously expressing tolerogenic ligands such as PD-L1. Naive T cells lack PD-1 expression, suggesting that in this co-culture system, antigen presentation by cpLECs drives naive 2D2 T cell activation/proliferation followed by T cell death in a PD-1-dependent manner after activation-induced PD-1 expression. The balance of T cell activation through antigen presentation and tolerance likely depends on the T cell state. During neuroinflammation, the meninges contains a mixture of naive T cells, differentiated effector T cells that have re-encountered their cognate antigen, and/or exhaustive T cells driven by excessive antigen stimulation, all of which may behave differently when interacting with EAE-primed cpLECs. In addition to T cells, the interactions between cpLECs and other leukocytes such as dendritic cells may add an additional layer of complexity. Future studies will look at the mechanisms and consequences of cellular crosstalk between meningeal LECs, different T cell subtypes, and/or dendritic cells.
ScRNA-seq of cpLECs revealed an upregulation of genes involved in the IFN-γ response, one of the highest-enriched cytokines in the CNS during EAE57. Interestingly IFN-γ is not required for lymphangiogenesis but is required for the upregulation of PD-L1 and Podoplanin. EAE is exacerbated in mice deficient in IFN-γ signaling41, suggesting a tolerogenic role for IFN-γ in CNS autoimmunity which coincides with PD-L1 expression by cpLECs. IFN-γ is also required for dendritic cell expression of PD-L1 during EAE, and depletion of dendritic cells after the onset of EAE exacerbates EAE severity58, suggesting that both cpLECs and dendritic cells may play an IFN-γ-dependent tolerogenic role in the later phase of EAE.
Lymphangiogenesis often accompanies inflammation, however lymphangiogenesis of meningeal lymphatics seems to be contextual. For example, lymphangiogenesis could not be observed by dural lymphatics above the sinuses during EAE4,5. RNA sequencing of dural lymphatics have highlighted dysregulation of genes involved in extracellular matrix, focal adhesion, angiogenesis, responses to endogenous and external stimuli, development, proliferation, and stiffness, which may account for their limited ability to undergo lymphangiogenesis5. Nevertheless, lymphangiogenesis by dural lymphatics can occur when inflammation is local, such as in traumatic brain injury, chronically implanted EEGs, and intracranial tumors7,8,59. RNA sequencing of the dural lymphatics in a subdural tumor model revealed an enrichment in antigen processing and presentation and other similar immune related genes8, suggesting that although there is heterogeneity in the ability of meningeal lymphatics to undergo lymphangiogenesis, the ability of lymphangiogenic vessels to engage in leukocyte crosstalk and regulate leukocyte function during neuroinflammation may be shared.
One of the primary roles of lymphatics is to maintain fluid homeostasis. Because meningeal lymphatics reside outside of the CNS parenchyma, how meningeal lymphatics access CSF through the arachnoid barrier is controversial. In rodent models, the meningeal lymphatics at the base of the brain are hypothesized to access CSF due to their relatively close proximity to the SAS3, and here we show gaps in the arachnoid barrier separating the SAS and meninges near the cribriform plate44. Although the dural lymphatics are relatively distal from the SAS, macromolecules infused into the CSF have highlighted “hotspots” where CSF is uptaken by dural lymphatics5,7. Visualizing CSF drainage in animal models has consistently shown CSF accumulation near the cribriform plate43. How CSF drainage occurs in humans is less consistent, where non-invasive imaging techniques lack the resolution to determine precisely how CSF exits the SAS. For example, CSF can consistently be found on the CNS-side of the cribriform plate in humans, but whether CSF can exit through the cribriform plate into the nasal mucosa has yielded mixed results43,60,61. We hypothesize that meningeal lymphatics in the dura, the cribriform plate, and base of the brain likely all play a role in drainage and may be connected as one large network that can sample from different regions.
Here we show that lymphatics near the cribriform plate can acquire an altered phenotype during neuroinflammation to engage in leukocyte crosstalk and regulation, where some of these phenotypes are regulated by IFN-γ. The crosstalk between dendritic cells, cpLECs, and CD4 T cells involve antigen transfer, presentation, and regulation of molecules such as MHC II and PD-L1, highlighting a previously underappreciated interface at the meningeal lymphatics near the cribriform plate as an immune-regulatory niche. This is in addition to their physiological role in accessing CSF through gaps in the arachnoid barrier, where lymphangiogenesis correlates with excess fluid accumulation during neuroinflammation.
Methods
Animals
Female C57BL/6J wild-type (stock #: 000664), IFN-γ−/− mice (stock #: 002287), 2D2 TCR transgenic mice (stock #: 006912), and OT-II TCR transgenic mice (stock #: 004194) were purchased from Jackson Laboratories. CD11c-eYFP transgenic reporter mice were a generous gift from M.C. Nussenzweig at Rockefeller University. CNP-Cre transgenic mice were a generous gift from B. Popko at the University of Chicago. pZ/EG-OP OVA257–264-OVA323–339 (OVAfl/fl mice) were generated by our lab as previously described in the C57BL/6 background32. OVAfl/fl mice were crossed with CNP-Cre mice to generate CNP-OVA transgenic mice that express OVA257–264 and OVA323–339 with GFP under the CNS oligodendrocyte-specific Cnp promoter4,32. Eight to twelve-week old female mice were used for all EAE experiments along with the appropriate age and sex matched controls. All experiments were conducted in accordance with guidelines from the National Institutes of Health and the University of Wisconsin – Madison Institutional Animal Care and Use Committee.
EAE Induction
EAE was induced in 8 to 12-week-old female mice by subcutaneous immunization with 100 μg of MOG35–55 emulsified in Complete Freund’s Adjuvant (CFA) between the shoulder blades. 200 ng of Pertussis Toxin (PTX) was injected intraperitoneally at 0 days post immunization (d.p.i.) and 2 d.p.i. The onset of clinical scores were observed between day 8 and 12 post-immunization, and were assessed daily as follows: 0, no clinical symptoms; 1, limp/flaccid tail; 2, partial hind limb paralysis; 3, complete hind limb paralysis; 4, quadriplegia; 5, moribund. Intermediate scores were also given for the appropriate symptoms. An EAE clinical score of 3.0 at day 15 post-immunization was used for all experiments.
Magnetic Resonance Imaging.
MRI experiments were done using a 4.7T small animal MRI (Agilent Technologies Inc.) and acquired using VnmrJ (Agilent Technologies Inc.). After scout scans, isotropic 3D T1-weighted scans were used to detect gadolinium using the following parameters: TR = 9.3 ms; TE = 4.7 ms; Flip Angle = 20 degrees; Field of View = 40×20×20 mm; Resolution = 256×128×128; Averages = 4; Voxel Size = 156 μm3. These resulted in a time scan of approximately 11 min. Animals were anesthetized using isoflurane administered through a nose-cone, and 10 μl of gadolinium was injected into the cisterna magna at a rate of 2 μl/min as previously described1,6. Respiratory rates and body temperature were monitored to ensure normal physiology. A baseline scan was acquired prior to gadolinium injection, and image processing was done using FIJI software. One potential limitation is the volume of 10 μL at a rate of 2 μL/min which has been shown to temporarily increase intracranial pressure, and consequently may influence CSF dynamics62.
Histology.
Mice were terminally anesthetized with isoflurane and transcardially perfused with PBS followed by perfusion with 4% paraformaldehyde (PFA) in PBS. Mice were then decapitated and the skin surrounding the head was removed using forceps and scissors to separate the skin from the muscle and ear canal. The whole heads were fixed in 4% PFA in PBS overnight. The whole heads were then decalcified in 14% ethylenediaminetetraacetic acid (EDTA) in PBS for 7 days followed by cryoprotection in 30% sucrose in PBS for 3 days. The EDTA was replaced with fresh 14% EDTA each day. The decalcified mouse heads were then embedded in Tissue-Tek OCT Compound, frozen on dry ice, then stored at −80°C. 60 μm thick frozen sections were obtained on a Leica CM1800 cryostat, mounted on Superfrost Plus microscope slides and stored at −80°C. For dural tissues, the skullcap was isolated and collected after decalcification and stored at 4°C in a 48-well non-tissue culture treated plate containing PBS.
Immunohistochemistry
Sections were thawed at 20°C for 10 min, washed with PBS for 10 min, then unspecific binding blocked with 10% bovine serum albumin (BSA) with 0.1% Triton-X for permeabilization in PBS for 60 min. Sections were then incubated with the appropriate primary antibodies in 1% BSA and 0.1% Triton-X in PBS at 4°C overnight in a humidified chamber. The following antibodies were used for immunohistochemistry: Podoplanin PE (eBioscience, Catalog #: 12-5381-80), CD31 Alexa647 (BD Biosciences, Catalog #: 563608), Lyve-1 eFluor660 (Thermo Fisher Scientific, Catalog #: 50-0443-80), chicken anti-GFP unconjugated (Novus Biologicals, Catalog #: NB100-1614-0.02ml), CNPase Alexa647 (BioLegend, Catalog #: 836407), MHC II eFluor450 (eBioscience, Catalog #: 48-5321-80), CD11c Alexa488 (Thermo Fisher Scientific, Catalog #: 53-0114-80), CD4 PE (BD Pharmingen, Catalog #: 553049), Goat anti-E-Cadherin unconjugated (R&D Systems, Catalog #: AF748), and rabbit anti-AQP-1 unconjugated (EMD Millipore, Catalog #: AB2219). Sections were then washed three times with PBS for 10 min each, then incubated with the appropriate secondary antibodies in 1% BSA and 0.1% Triton-X in PBS at 20°C for 120 min. The following secondary antibodies were used: Donkey anti-Chicken Alexa488 (Invitrogen, Catalog #: A11039), Donkey anti-Chicken Alexa647 (Invitrogen, Catalog #: A21449), Donkey anti-Goat Alexa568 (Invitrogen, Catalog #: A11057), and/or Donkey anti-rabbit Alexa568 (Invitrogen, Catalog #: A10042). Sections were then washed three times with PBS for 10 min each, mounted with Prolong Gold mounting medium with DAPI, and images acquired using an inverted Olympus Fluoview FV1200 confocal microscope. For imaging of the dura, the whole dura attached to the skullcap underwent the same immunohistochemistry protocol above using a free-floating method in a 48-well plate. The whole skullcap with the dura attached was placed on a microscope slide and imaged using an inverted Olympus Fluoview FV1200 confocal microscope, with occasional application of PBS to prevent dehydration. The brightness/contrast of each image was applied equally across the entire image and equally across all images and analyzed using either FIJI or IMARIS software.
Single Cell Suspension
Mice were terminally anesthetized with isoflurane and transcardially perfused with PBS. Mice were then decapitated, and the skin was cut dorsal to the midline of the skullcap rostrally to expose the brain. The skullcap was then removed along with the brain and dura after separation from the olfactory bulbs. The cribriform plate and its associated tissues which included the olfactory bulbs, the cribriform plate, and dorsal parts of the nasal mucosa were dissected out and placed in a 70-μm strainer submerged in RPMI-1640 in a non-tissue culture treated dish. The tissues were then mechanically dissociated by pushing the tissue through the strainer using a syringe plunger. The mechanically dissociated cells were then spun down, washed, and resuspended in FACS buffer (1% Bovine Serum Albumin in PBS) for FACS staining.
Flow Cytometry
After resuspension of mechanically dissociated cells in fluorescence-activated cell sorting (FACS) buffer (pH = 7.4, PBS, 1 mM EDTA, 1% BSA), the cells underwent staining with conjugated antibodies/dyes. Conjugated antibodies were diluted 1:200 in FACS buffer, and the following antibodies and dyes were used: Ghost UV450 (Tonbo Biosciences, Catalog #: 13-0868-T500) or Ghost Violet540 (Tonbo Biosciences, Catalog #: 13-0879-T100) to visualize live/dead cells; CD31 Alexa647 (BD Biosciences, Catalog #: 563608), Podoplanin PE (eBioscience, Catalog #: 12-5381-82), and Lyve-1 Alexa488 (eBioscience, Catalog #: 53-0443-82) to visualize lymphatic endothelial cells; CD45 APC-Cy7 (BioLegend, Catalog #: 103116) or CD45 APC eFluor780 (eBioscience, Catalog #: 47-0451-80) to visualize leukocytes; CD11b PerCP-Cy5.5 (BioLegend, Catalog #: 101227) or CD11b PE-Cy5 (BioLegend, Catalog #: 101210) to visualize myeloid cells; CD11c BV421 (BioLegend, Catalog #: 117329) or CD11c FITC (BioLegend, Catalog #: 117305) to visualize dendritic cells; CD8 PE-Cy7 to visualize cytotoxic T cells (BioLegend, Catalog #: 100721); CD4 BUV496 to visualize T helper cells (BD Bioscience, Catalog #: 564667); B220 BV510 to visualize B cells (BioLegend, Catalog #: 103247); PD-L1 PE-Cy7 to visualize the tolerogenic ligand PD-L1 (BioLegend, Catalog #: 124313). After staining for 30 min at 4°C, cells were washed 3 times with FACS buffer and processed using BD LSR II or Cytek’s 3-laser Northern Lights.
FACS Sorting
After generating a single cell suspension and staining for cpLECs with Ghost UV450 (Tonbo Biosciences, Catalog #: 13-0868-T500), CD31 Alexa 647 (BD Biosciences, Catalog #: 565608), Podoplanin PE (eBioscience, Catalog #: 12-5381-82), and CD45 APC-Cy7 (BioLegend, Catalog #: 103116), the cells were sorted with a FACS Aria III with a nozzle size of 130 μm at the UW Flow Core satellite facility in the UW Biotechnology Center. LECs were gated for singlets using both FSC and SSC, dead cells excluded by gating for Ghostnegative live cells, and LECs were identified using both CD31+ Podoplanin+ after excluding both CD45intermediate microglia and CD45+ leukocytes as previously described2,6,8,19. Cells were sorted into either FACS buffer (1% BSA in PBS) for scRNA-seq, or RPMI containing 10% FBS, 2-mercaptoethanol, and penicillin/streptomycin for in vitro co-culture experiments.
In vitro T cell activation assay
Healthy or EAE cpLECs were isolated and FACS sorted as previously described and cultured in a 96-well flat bottom non-tissue culture treated plate in RPMI containing 10% heat-inactivated fetal bovine serum (FBS), 2-mercaptoethanol, and penicillin/streptomycin. Splenocytes were generated from either naive 2D2 TCR transgenic mice for MOG35–55 specific 2D2 CD4 T cells, or from OT-II TCR transgenic mice for OVA323–339 specific OT-II CD4 T cells using a magnetic negative selection kit (Miltenyi, Catalog#: 130-104-454) following the manufacturer’s recommended protocol. Once purified, 2D2 or OT-II T cells were labeled with Cell Trace Violet (ThermoFisher Scientific, Catalog#: C34557) following the manufacturer’s recommended protocol, and co-cultured with cpLECs (100,000–200,000 CD4 T cells:5,000–10,000 cpLECs). 100 μg/mL of MOG35–55 was added to the culture for 2D2 T cell co-culture experiments, and 100 μg/mL of OVA323–339 was added to the culture for OT-II T cell co-culture experiments. After 24 h the co-culture underwent FACS staining and analysis to measure the early T cell activation marker CD69 (BioLegend, Catalog#: 104510), or after 72 h T cell proliferation through the dilution of Cell Trace Violet.
For PD-L1 inhibition experiments, EAE-primed cpLECs were co-cultured with naive 2D2 T cells as described above. Prior to co-culture, EAE-primed cpLECs were pre-treated with 20 μg/mL of PD-L1 blocking antibody (BioXcell, Catalog #: BE0101) for 1 h. EAE-primed cpLECs were then co-cultured with naive 2D2 T cells in the presence of 20 μg/mL of PD-L1 blocking antibody for 24 or 72 h, and cell death measured with Ghost viability dye as described above.
scRNA Sequencing
5 healthy mice were pooled for the control group, and 5 EAE mice were pooled for the experimental EAE group. A single cell suspension of the cribriform plate and its associated tissues were generated as described, and cpLECs were FACS sorted for singlets, Ghost− live cells, CD45lo, Podoplanin+, and CD312,5,6,8,19. Sorted cpLECs were then provided to the Biotechnology Core facility at the University of Wisconsin Madison for single cell sequencing using the 10x Genomics Chromium Single Cell Gene Expression Assay. A total of 25,102 cells from the control group and 53,224 cells from the experimental group post-sort were provided to the Biotechnology Core for scRNA-seq. Cells were loaded onto a Chromium Controller to generate a single cell + barcoded gel-bead emulsion. Libraries were prepped with the 10X Genomics 3’ reagents kit (v3 chemistry). The target recovery rate was 3,000 cells with a targeted read depth of 48,000 per cell. Cells were sequenced on the NovaSeq S1 100-cycle flow cell in collaboration with the University of Wisconsin Biotechnology Center (UWBC) DNA Sequencing Facility. Data were analyzed by the UW Bioinformatics Resource Center. Experimental data were demultiplexed using the Cell Ranger Single Cell Software Suite, mkfastq command wrapped around Illumina’s bcl2fastq. The MiSeq balancing run was quality controlled using calculations based on UMI tools63. Sample libraries were balanced for the number of estimated reads per cell and run on an Illumina NovaSeq system. Cell Ranger software was then used to perform demultiplexing, alignment, filtering, barcode counting, UMI counting, and gene expression estimation for each sample according to the 10x Genomics documentation. Barcodes containing unusually high numbers of detected transcripts indicative of a doublet signature were excluded, and cells that co-express marker genes of distinct cell types were also excluded. The resulting data were then analyzed and explored using the Loupe Cell Browser software and the R packages clusterProlifer and/or monacle3 after excluding non-LEC cells that made it through the FACS-enrichment. In total, 6,272 cells were identified and 1,218 cells were excluded due to non-LEC signatures. The median genes per cell in this analysis was 2,558, and the median UMI counts per cell was 7,480.
Gene ontologies
Genes identified to be differentially expressed from each cluster were separately assessed by gene ontological analyses using R package clusterProfiler64. The genes that passed filtering during alignment were used as the background set during over-representation analyses. Significant gene ontological terms were identified using an adjusted P-value < 0.05. Bar plots, gene-concept network plots, and enrichment maps were visualized and generated using clusterProfiler.
Single cell trajectory analysis
R package monocle324,25,26 was employed for pseudotime analysis. Feature, gene annotation, and cell annotation matrices were regenerated for cells stemming from clusters of interest using the cellranger reanalyze function. A cell dataset was generated using these matrices and preprocessed using 50 as the maximum number of dimensions. Dimensions were reduced using UMAP methodology. Cells were clustered and trajectories were learned using default parameters by monocle3. Cells were ordered and pseudotime was calculated in reference to a node in the healthy cell cluster. Expression data was extracted for genes of interest and plotted against estimated pseudotime, using a minimum expression cutoff of 5 reads for visualization purposes.
Statistics
When comparing results from two groups, unpaired Student’s t-test was used. When comparing results from three groups, one-way ANOVA using Tukey’s post-hoc multiple comparisons test was used. When comparing results across time, two-way ANOVA using Sidak’s multiple comparisons test was used. All statistical analysis was performed using Graphpad Prism 6.0 software. Data is portrayed as the mean +/− standard error of the mean (S.E.M.), and significance portrayed as: n.s. = non-significant, p > 0.05; *p < 0.05; **p < 0.01; ***p < 0.001; ****p < 0.0001.
Extended Data
Extended Data Fig. 1. Characterization of cribriform plate cell suspension.
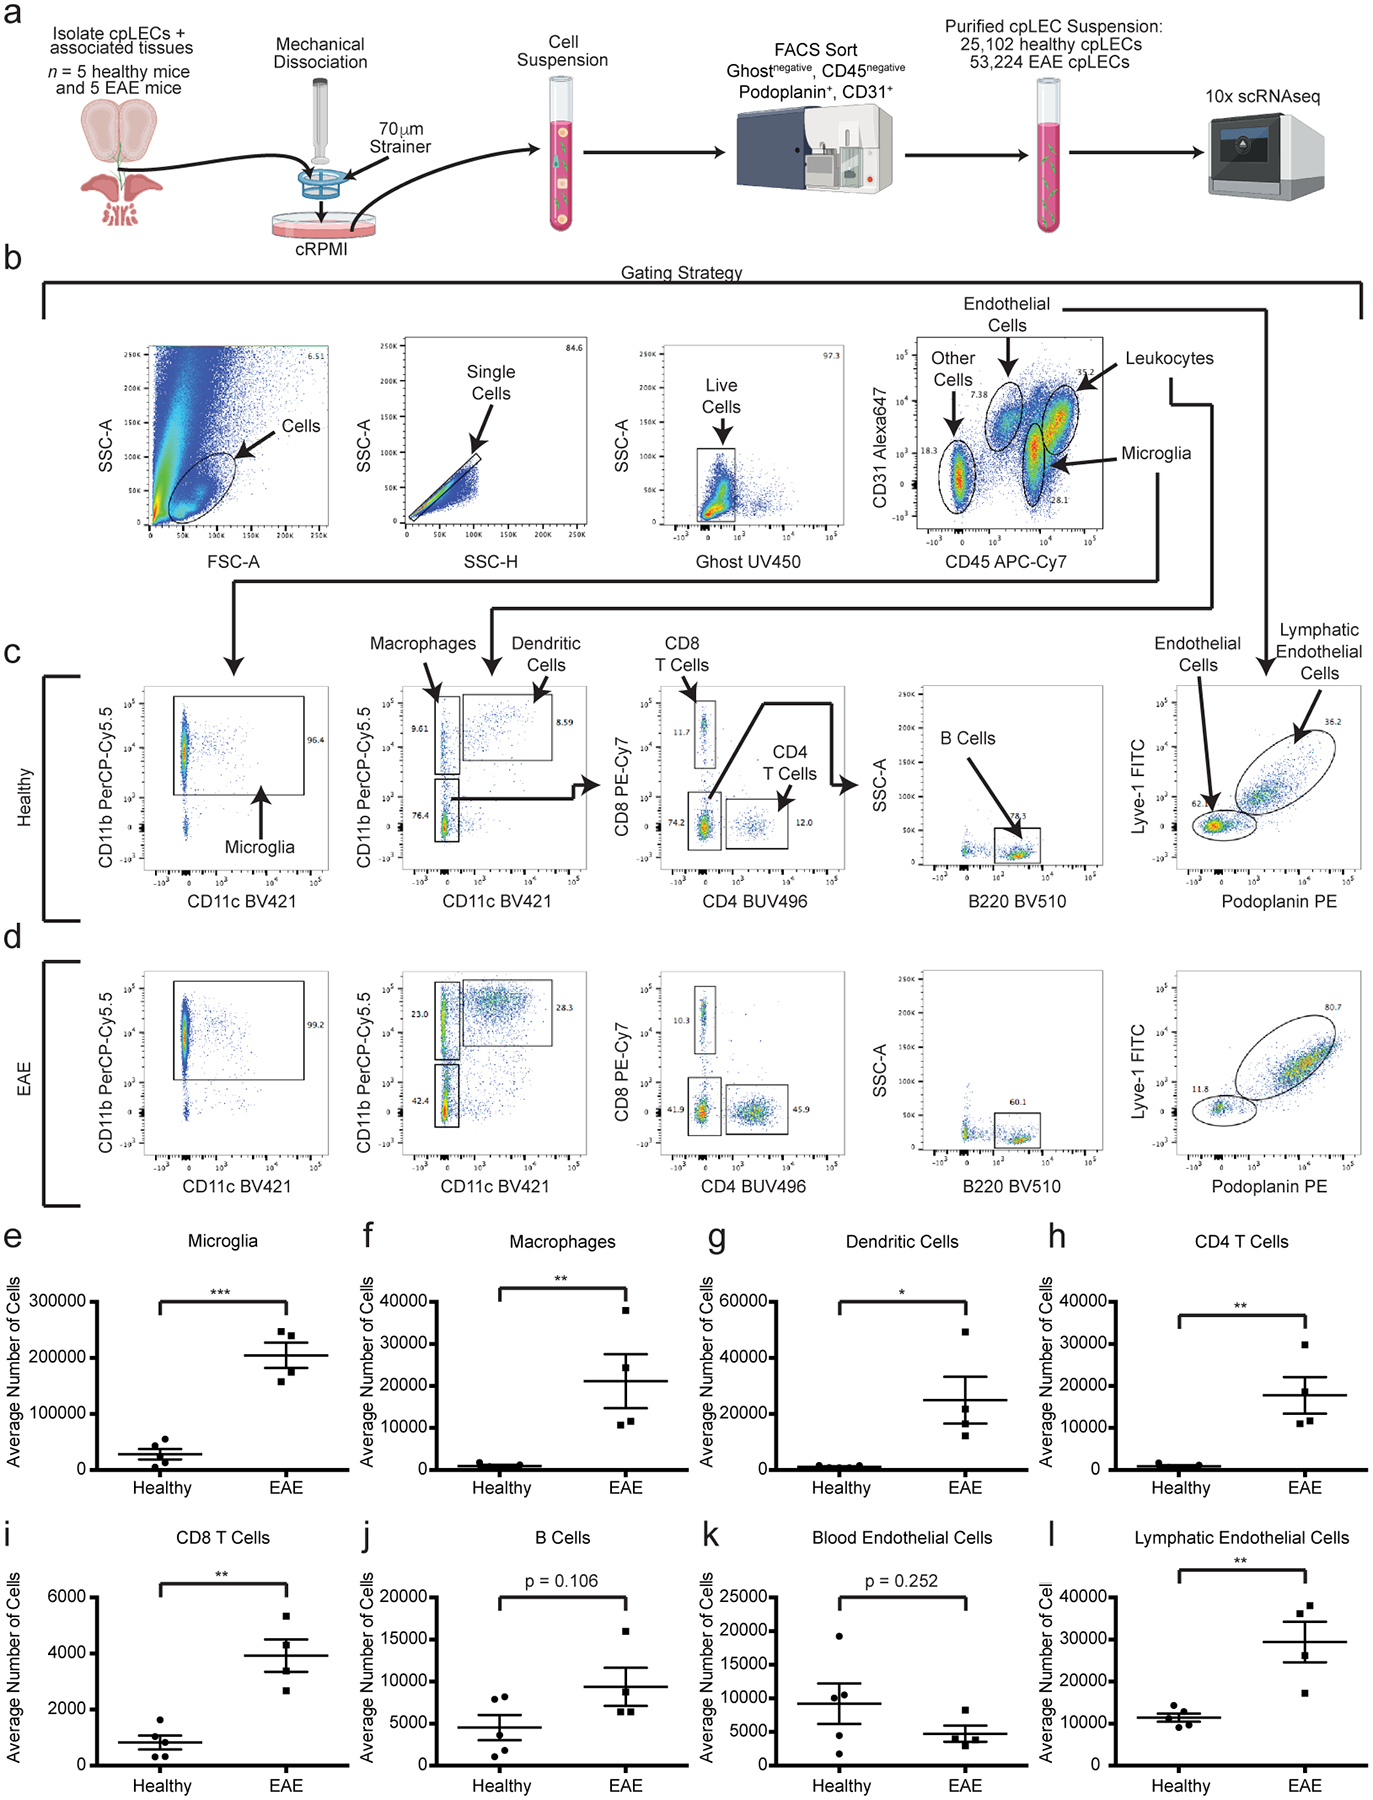
(a): Experimental design for generating a single cell suspension of the cribriform plate.
(b – d): Gating strategy used to identify cell types from the cpLEC cell suspension between healthy (c) and EAE score 3.0 (d). Microglia are identified as CD45intermediate CD11b+, macrophages as CD45+ CD11b+ CD11c−, dendritic cells as CD45+ CD11b+ CD11c+, CD4 T cells as CD45+ CD11b− CD11c− CD4+, CD8 T cells as CD45+ CD11b− CD11c− CD8+, B cells as CD45+ CD11b− CD11c− CD4− CD8− B220+, blood endothelial cells as CD45low CD31+ Lyve-1− Podoplanin−, and lymphatic endothelial cells as CD45low CD31+ Lyve-1+ Podoplanin+.
(e – l): Quantitation of the average cell numbers of microglia (e), macrophages (f), dendritic cells (g), CD4 T cells (h), CD8 T cells (i), B cells (j), blood endothelial cells (k), and lymphatic endothelial cells (l) between healthy and EAE score 3.0. n = 5 healthy mice, 4 EAE mice; data are represented as mean ± standard error of the mean. For microglia, p = 0.0001; for macrophages, p = 0.0091; for dendritic cells, p = 0.0141; for CD4 T cells, p = 0.0031; for CD8 T cells, p = 0.0011; for B cells, p = 0.1059; for blood endothelial cells, p = 0.2523; for lymphatic endothelial cells, p = 0.0045; unpaired Student’s t-test.
Extended Data Fig. 2. Volcano and CNET plots of scRNAseq.
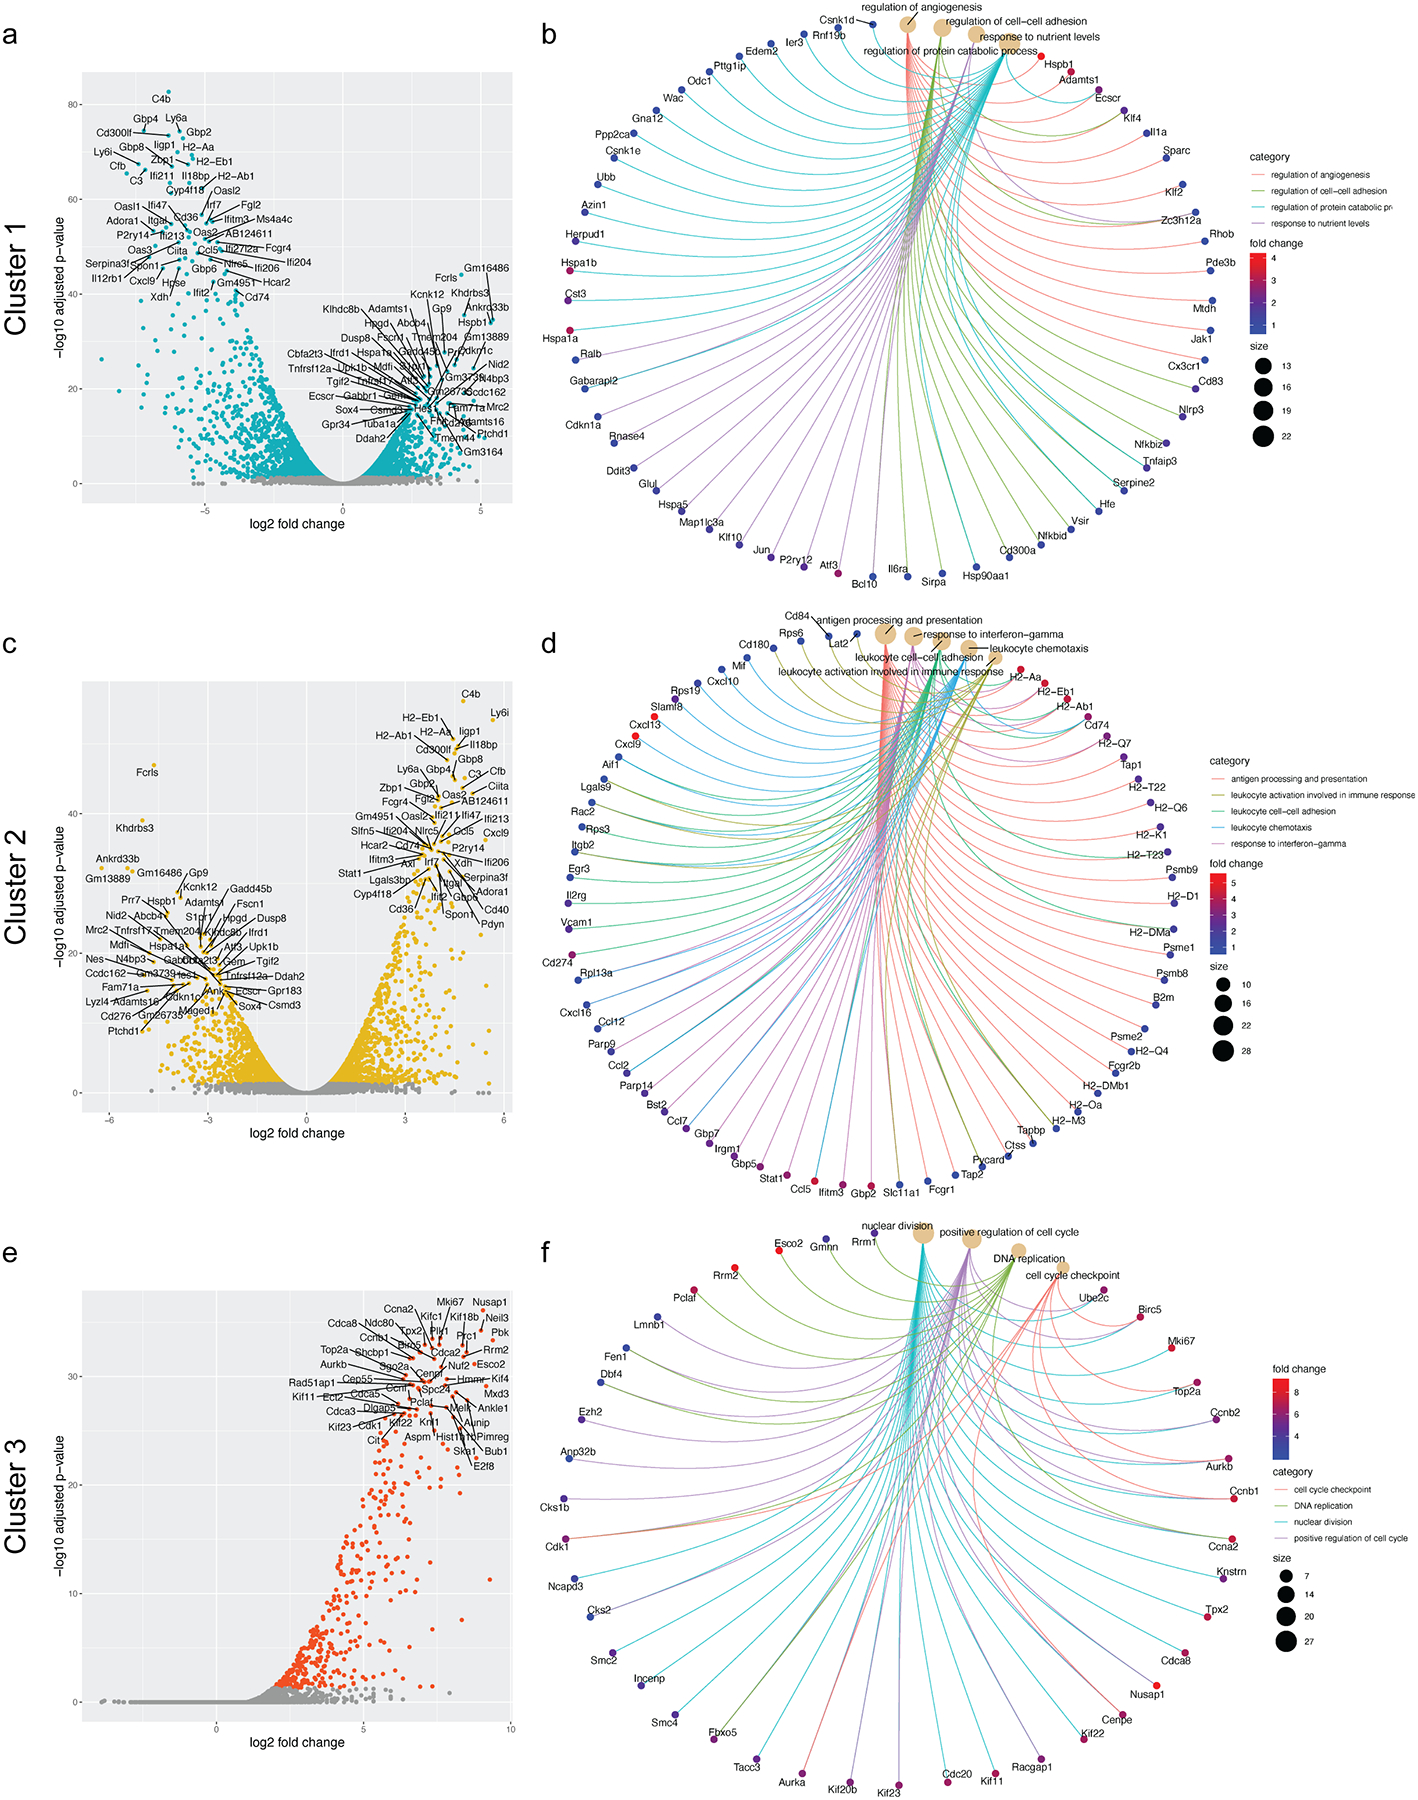
(a): Volcano plot showing the top 50 most up-regulated and down-regulated genes in Cluster 1.
(b): Cnet plot detailing the strength of association between representative GO enrichment terms for Cluster 1 for regulation of angiogenesis, regulation of protein catabolic process, regulation of cell-cell adhesion, and response to nutrient levels along with their associated genes.
(c): Volcano plot showing the top 50 most up-regulated and down-regulated genes in Cluster 2.
(d): Cnet plot detailing the strength of association between representative GO enrichment terms for Cluster 2 for antigen processing and presentation, response to interferon-gamma, leukocyte cell-cell adhesion, leukocyte chemotaxis, and leukocyte activation involved in immune response along with their associated genes.
(e): Volcano plot showing the top 50 most up-regulated genes in Cluster 3.
(f): Cnet plot detailing the strength of association between representative GO enrichment terms for Cluster 3 for nuclear division, positive regulation of cell cycle, DNA replication, and cell cycle checkpoint along with their associated genes.
Extended Data Fig. 3. Visualizing cpLEC trajectories.
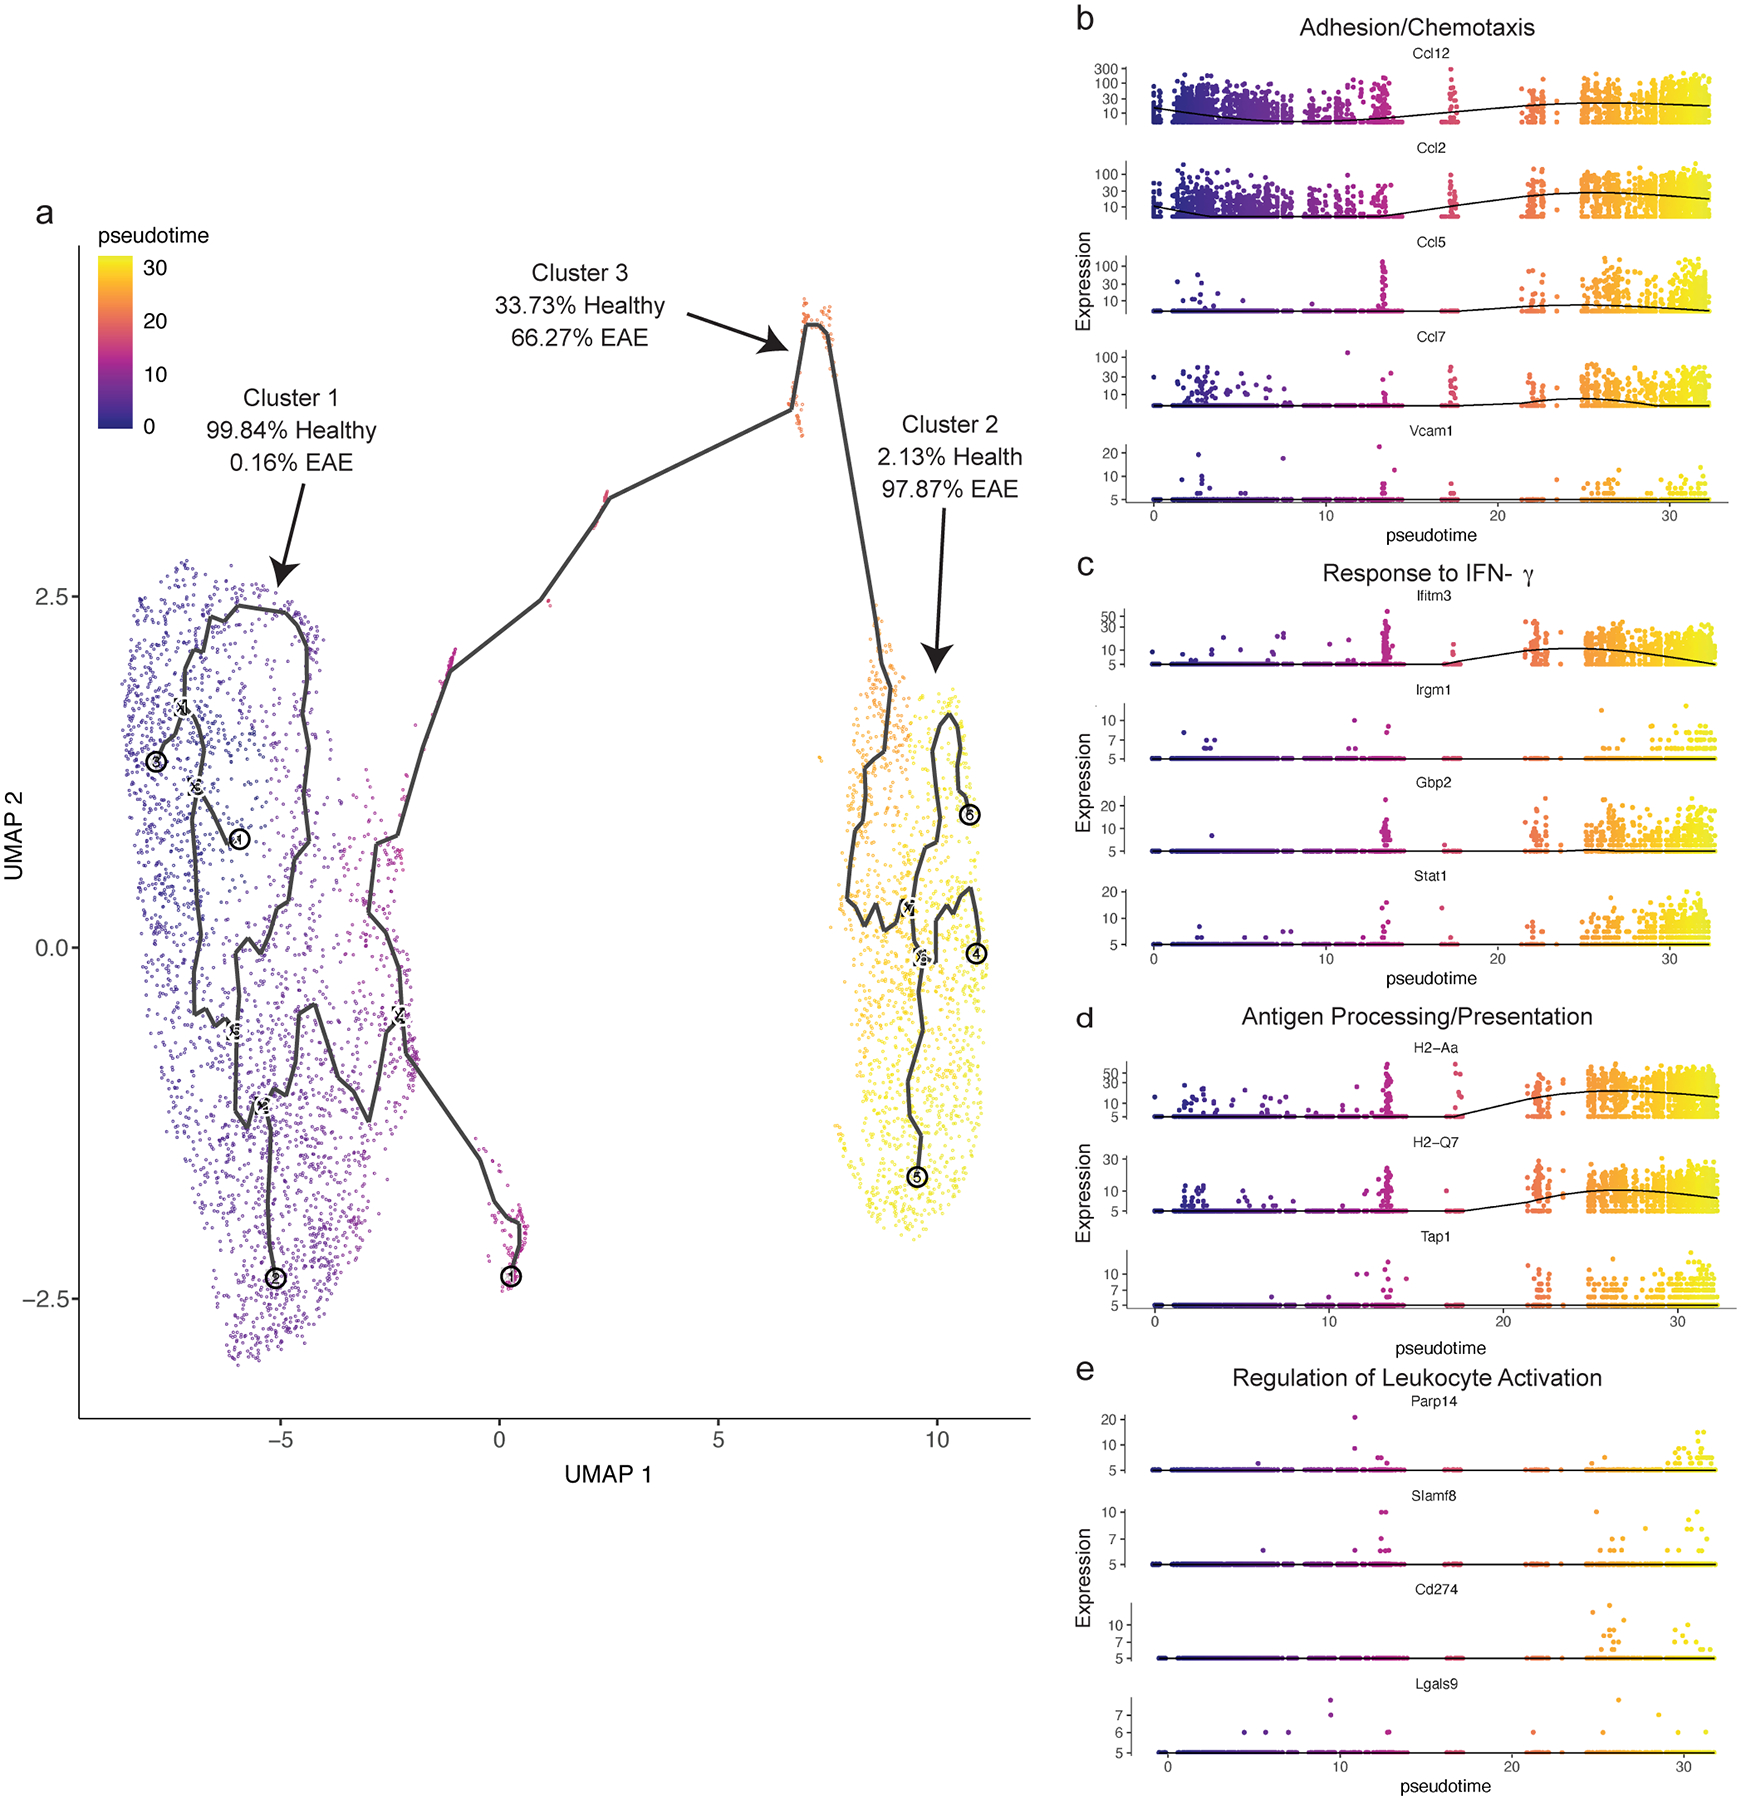
(a): Single cell data was clustered using UMAP methodology and trajectories learned using default parameters by monacle3. Trajectories through pseudotime are shown for the three clusters; note that cluster 3 lies in between clusters 1 and 2 through pseudotime, and there are no direct connections between clusters 1 and 2.
(b): 5 representative genes associated with the GO enrichment term adhesion/chemotaxis that is enriched in cluster 2 are shown through pseudotime.
(c): 4 representative genes associated with the GO enrichment term response to IFN-γ that is enriched in cluster 2 are shown through pseudotime.
(d): 3 representative genes associated with the GO enrichment term antigen processing/presentation that is enriched in cluster 2 are shown through pseudotime.
(e): 4 representative genes associated with the GO enrichment term leukocyte activation that is enriched in cluster 2 are shown through pseudotime. Note that these genes tend to be up-regulated later through pseudotime relative to genes associated with the other 3 enrichment terms.
Extended Data Fig. 4. Characterizing cpLEC-leukocyte doublets.
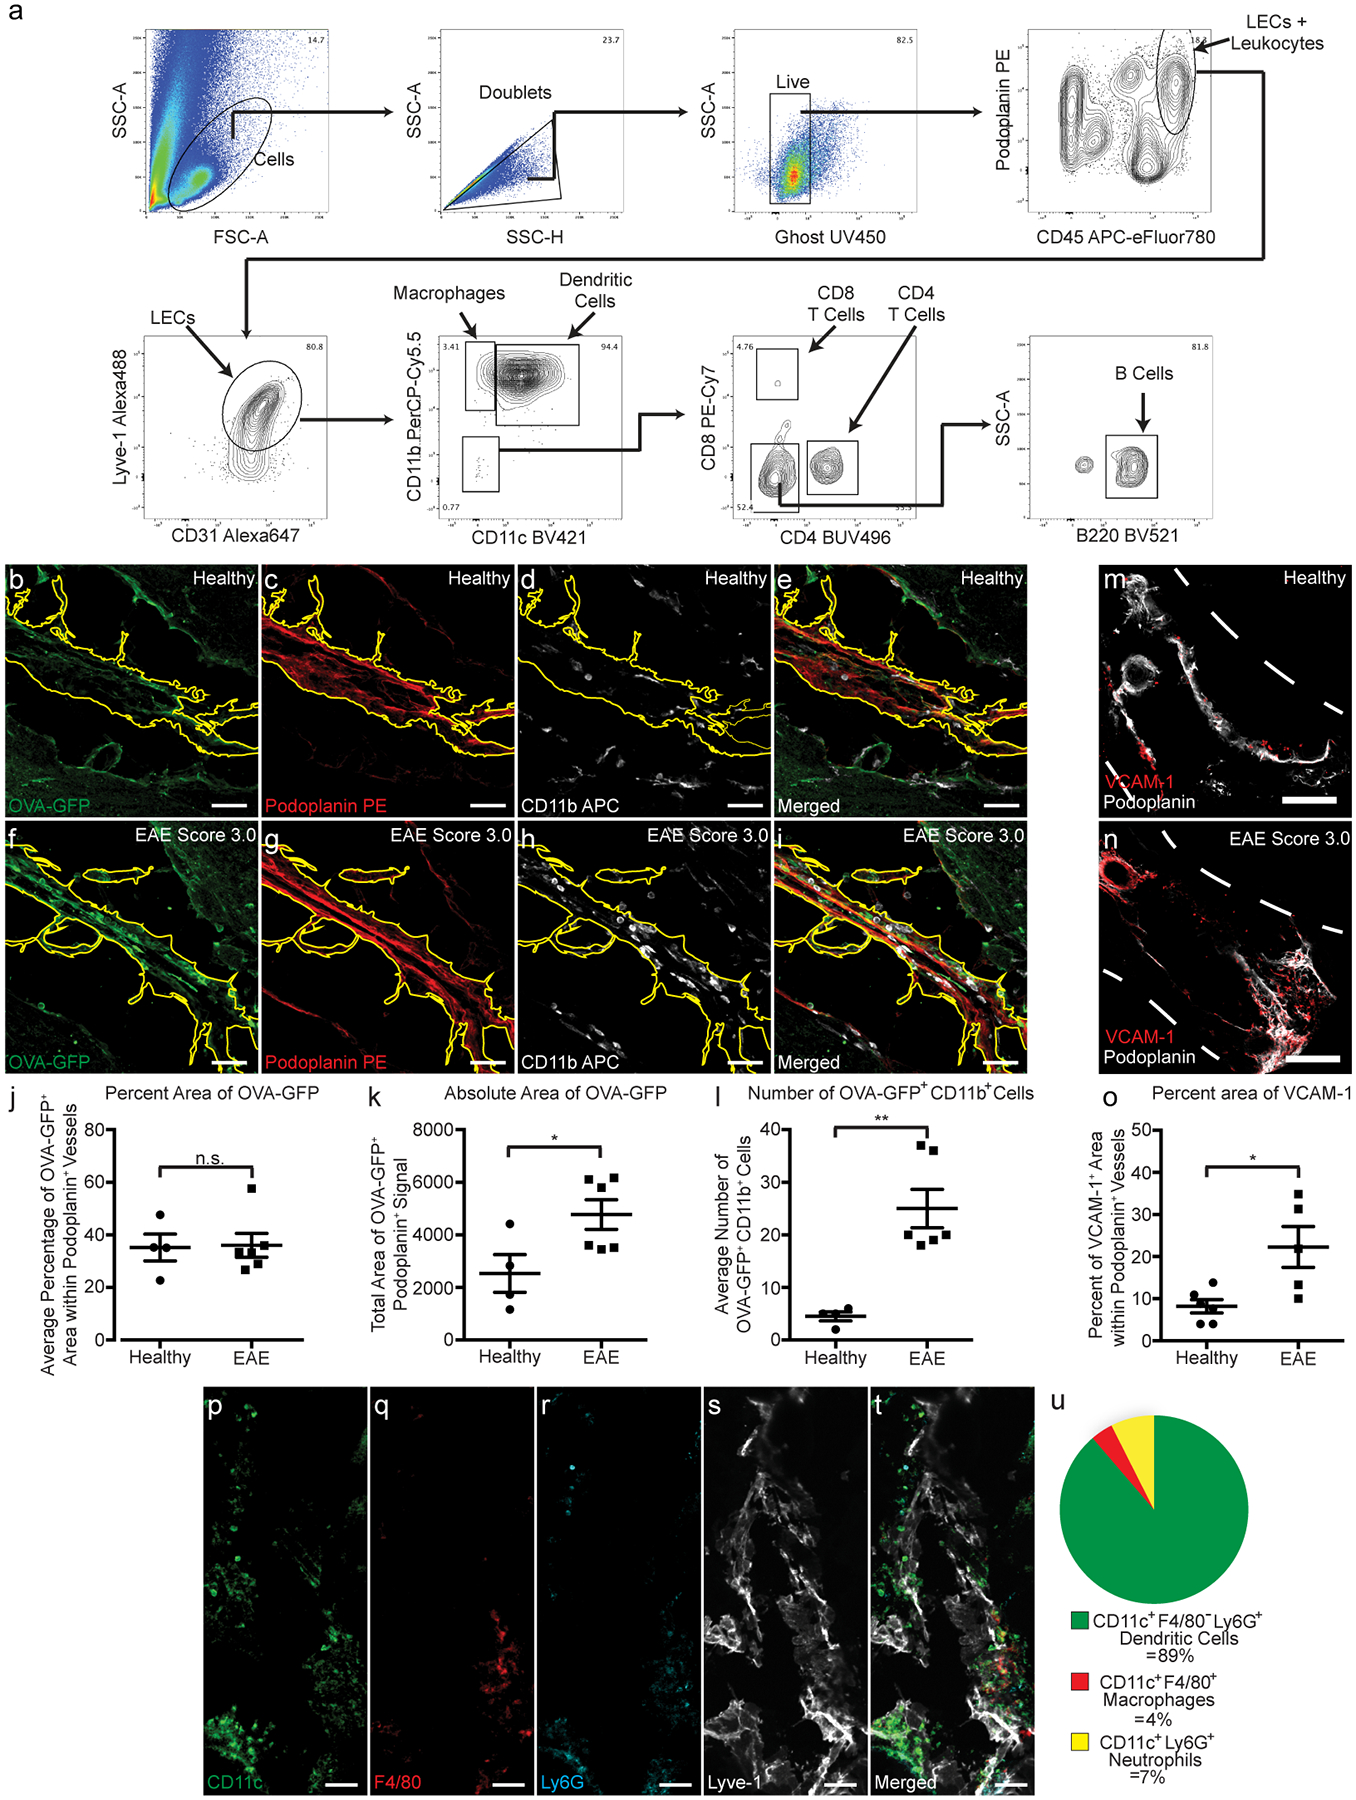
(a): Gating strategy used to visualize leukocyte – LEC binding. Live Ghost UV450− doublets were gated for, and a leukocyte bound to a LEC were gated for both the leukocyte marker CD45 and LEC markers Podoplanin, Lyve-1, and CD31. Leukocytes were further gated for CD11b+ macrophages, CD11b+ CD11c+ dendritic cells, CD4+ T cells, CD8+ T cells, and B220+ B cells.
(b-e): Representative confocal images taken of a healthy cribriform plate section immunolabeled with OVA-GFP (b), Podoplanin (c), CD11b (d), and merged (e). Scale bar = 50 μm
(f-i): Representative confocal images taken of an EAE score 3.0 cribriform plate section immunolabeled with OVA-GFP (f), Podoplanin (g), CD11b (h), and merged (i). Scale bar = 50 μm
(j): Quantitation of the average percent area of OVA-GFP within Podoplanin+ cpLECs after excluding CD11b+ area. n = 4 healthy mice, 6 EAE mice; data are represented as mean ± standard error of the mean. For percent area of OVA-GFP, p = 0.9079; unpaired Student’s t-test.
(k): Quantitation of the absolute area of OVA-GFP within Podoplanin+ cpLECs. n = 4 healthy mice, 6 EAE mice; data are represented as mean ± standard error of the mean. For absolute area of OVA-GFP, p = 0.0380; unpaired Student’s t-test.
(l): Quantitation of the average number of CD11b+ cells containing intracellular OVA-GFP within Podoplanin+ cpLECs. n = 4 healthy mice, 6 EAE mice; data are represented as mean ± standard error of the mean. For number of OVA-GFP+ CD11b+ cells, p = 0.0022; unpaired Student’s t-test
(m – o): Representative confocal images taken of the cribriform plate from healthy (m) or EAE score 3.0 at 15 days post-immunization (n) immunolabeled with VCAM-1 and Podoplanin. Scale bar = 200um
(o): Quantitation of the average percent area of Podoplanin+ meningeal lymphatic vessels near the cribriform plate that express Vcam-1. n = 6 mice per group; data are represented as mean ± standard error of the mean. For percent area of Vcam-1+ labeling within Podoplanin+ cells, p = 0.0152; unpaired Student’s t-test.
(p – u): Representative confocal images taken of an EAE score 3.0 cribriform plate section immunolabeled with CD11c (p), F4/80 (q), Ly6G (r), Lyve-1 (s), and merged (t). Quantitation reveals that during EAE, the majority of CD11c+ cells in contact with Lyve-1+ cpLECs are F4/80− and Ly6G−, with a relatively minor subset of CD11c+ cells identified as F4/80+ macrophages or Ly6G+ neutrophils (u). Scale bar = 50 μm
Extended Data Fig. 5. cpLECs can present OVA323–339 to OT-II T cells.
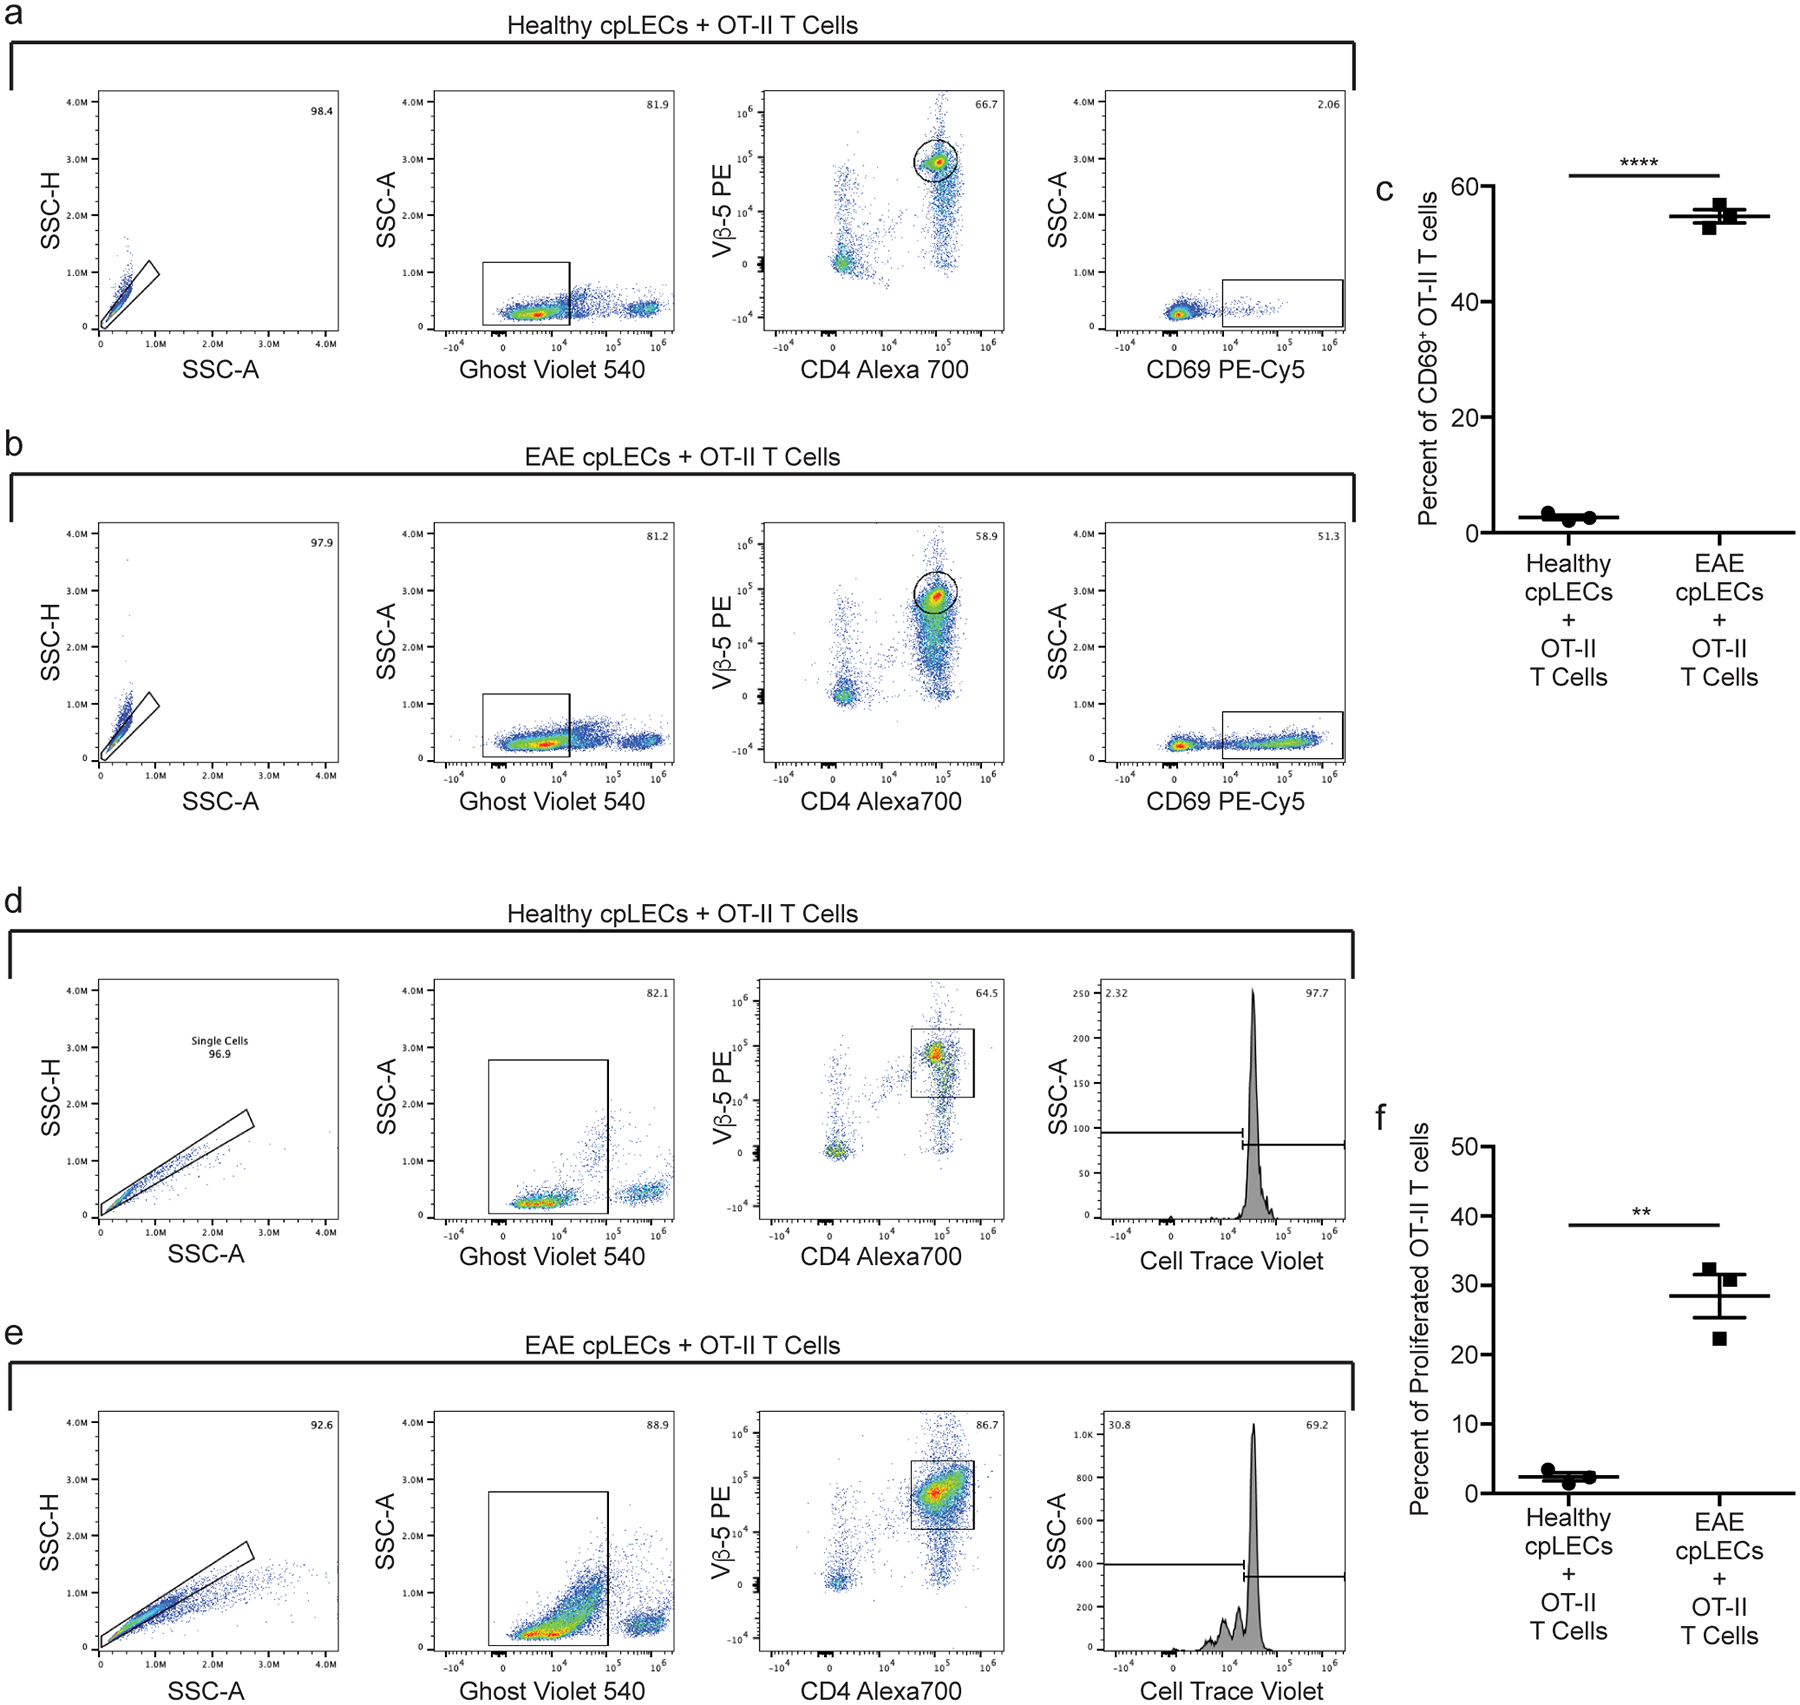
(a – f): Healthy or EAE score 3.0 cpLECs were FACS sorted as CD31+ Podoplanin+ after excluding CD45intermediate microglia, CD45+ leukocytes, Ghost+ dead cells, and doublets. Sorted cpLECs were then co-cultured with magnetically purified CD4 OT-II T cells from splenocytes using negative selection after Cell Trace Violet labeling in the presence of 100 μg/mL of OVA323–339 for either 24 hours (a – c) or 72 hours (d – f).
(a – b): Gating strategy for measuring the early T cell activation marker CD69 by OT-II T cells after 24 hours of co-culture.
(c): Quantitation of the average percentage of 2D2 T cells expressing CD69 after 24 hours of co-culture. n = 3 replicates per group, pooled from 4 healthy and 4 EAE mice; data are represented as mean ± standard error of the mean. For percent of CD69 OT-II cells, p < 0.0001.
(d – e): Gating strategy for measuring T cell proliferation by the dilution of Cell Trace Violet by OT-II T cell after 72 hours of co-culture.
(f): Quantitation of the average percent of proliferated OT-II T cells after 72 hours of co-culture. n = 3 replicates per group, pooled from 4 healthy and 4 EAE mice; data are represented as mean ± standard error of the mean. For percent of proliferated OT-II cells, p = 0.0012.
Extended Data Fig. 6. cpLECs upregulate CD31, Podoplanin, Lyve-1, and PD-L1 during EAE.
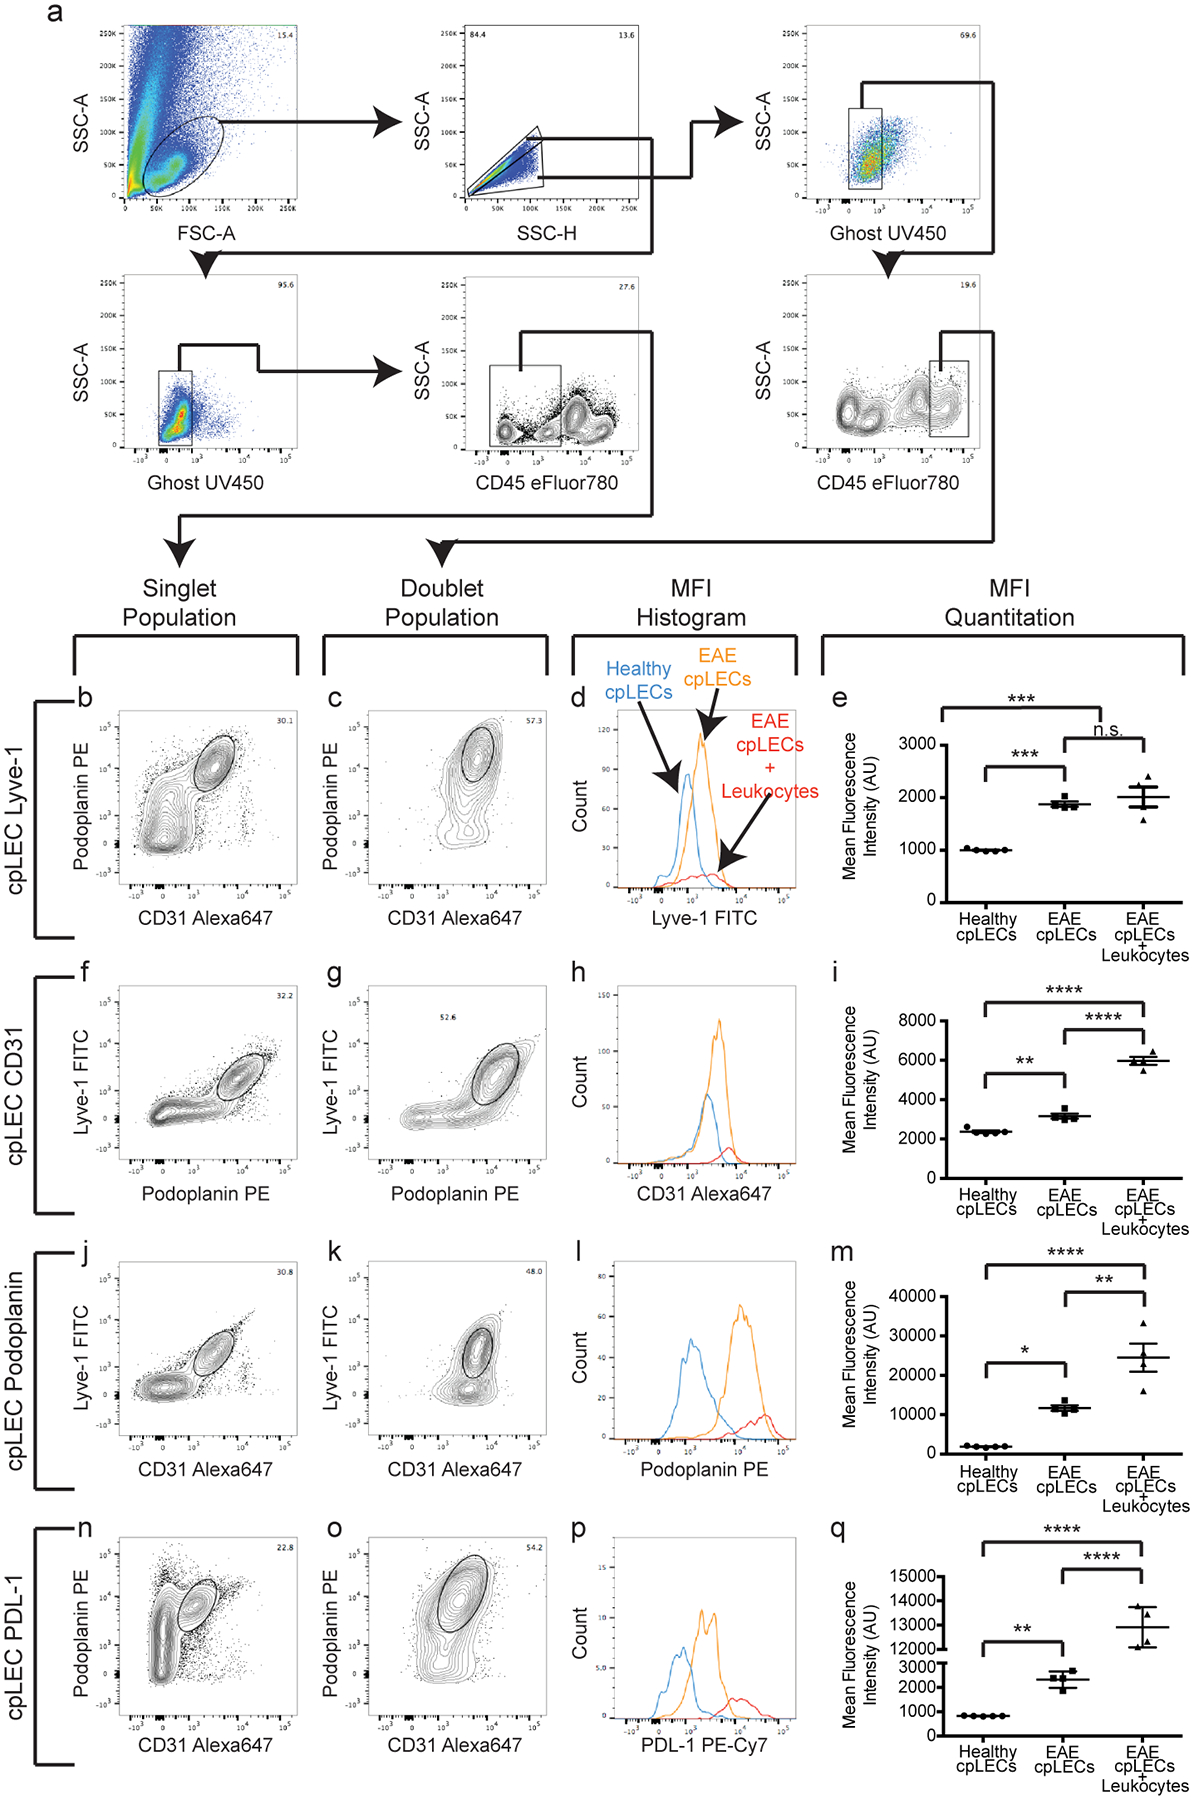
(a): Gating strategy used to confirm the up-regulation of CD31, Podoplanin, Lyve-1, and PDL-1 at the protein level during EAE score 3.0.
(b – q): After gating for cpLECs as either Podoplanin+ CD31+ (b – e, n – q), Podoplanin+ Lyve-1+ (f – i), or Lyve-1+ CD31+ (j – m), the median fluorescence intensity (MFI) of Lyve-1 (b – e), CD31 (f – i), Podoplanin (j – m), and PDL-1 (n – q) by both singlet cpLECs and doublets in which a cpLEC is bound to a CD45+ leukocyte. n = 5 healthy cpLECs, 4 EAE cpLECs, and 4 EAE cpLECs + leukocytes; data are represented as mean ± standard error of the mean. For Lyve-1 MFI, healthy cpLECs vs. EAE cpLECs, p = 0.0003, healthy cpLECs vs. EAE cpLECs + leukocytes, p = 0.0001, EAE cpLECs vs. EAE cpLECs + leukocytes, p = 0.6590; for CD31 MFI, healthy cpLECs vs. EAE cpLECs, p = 0.0043, healthy cpLECs vs. EAE cpLECs + leukocytes, p < 0.0001, EAE cpLECs vs. EAE cpLECs + leukocytes, p < 0.0001; for Podoplanin MFI, healthy cpLECs vs. EAE cpLECs, p = 0.0112, healthy cpLECs vs. EAE cpLECs + leukocytes, p < 0.0001, EAE cpLECs + EAE cpLECs + leukocytes, p = 0.0028; for PD-L1 MFI, healthy cpLECs vs. EAE cpLECs, p = 0.0027, healthy cpLECs vs. EAE cpLECs + leukocytes, p < 0.0001, EAE cpLECs + EAE cpLECs + leukocytes, p < 0.0001; one-way ANOVA using Tukey’s multiple comparisons test.
Extended Data Fig. 7. Background doublet MFI is negligible compared to protein expression.
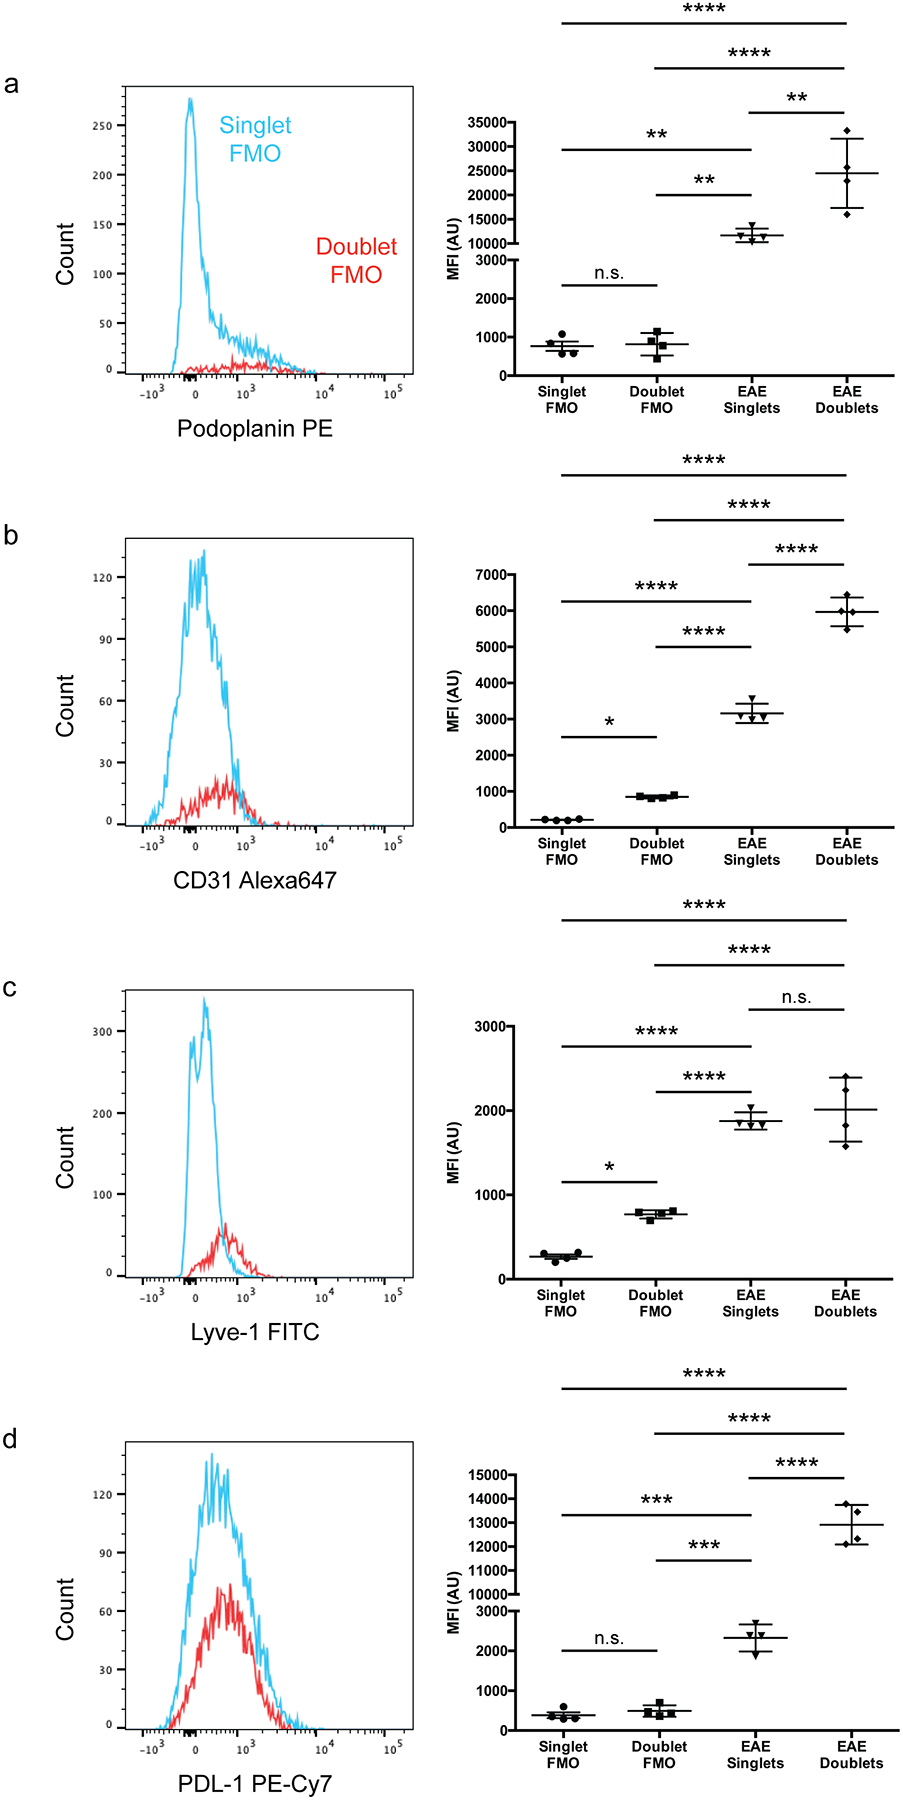
(a – d): FMO controls showing the increase in MFI of Podoplanin (a), CD31 (b), Lyve-1 (c), and PDL-1 (d) of doublets relative to singlets due to background is negligible relative to actual protein expression. n = 4 mice per group; data are represented as mean ± standard error of the mean. For Podoplanin MFI (a), singlet FMO vs. doublet FMO, p > 0.9999, singlet FMO vs. EAE singlets, p = 0.0055, singlet FMO vs. EAE doublets, p < 0.0001, doublet FMO vs. EAE singlets, p = 0.0057, doublet FMO vs. EAE doublets, p < 0.0001, EAE singlets vs. EAE doublets, p = 0.0016; for CD31 MFI (b), singlet FMO vs. doublet FMO, p = 0.0130, singlet FMO vs. EAE singlets, p < 0.0001, singlet FMO vs. EAE doublets, p < 0.0001, doublet FMO vs. EAE singlets, p < 0.0001, doublet FMO vs. EAE doublets, p < 0.0001, EAE singlets vs. EAE doublets, p < 0.0001; for Lyve-1 MFI (c), singlet FMO vs. doublet FMO, p = 0.0182, singlet FMO vs. EAE singlets, p < 0.0001, singlet FMO vs. EAE doublets, p < 0.0001, doublet FMO vs. EAE singlets, p < 0.0001, doublet FMO vs. EAE doublets, p < 0.0001, EAE singlets vs. EAE doublets, p = 0.7736; for PD-L1 MFI (d), singlet FMO vs. doublet FMO, p = 0.9828, singlet FMO vs. EAE singlets, p = 0.0003, singlet FMO vs. EAE doublets, p < 0.0001, doublet FMO vs. EAE singlets, p = 0.0005, doublet FMO vs. EAE doublets, p < 0.0001, EAE singlets vs. EAE doublets, p < 0.0001; one-way ANOVA with Tukey’s post-hoc multiple comparisons test.
Extended Data Fig. 8. Lymphangiogenesis does not require IFN-γ.
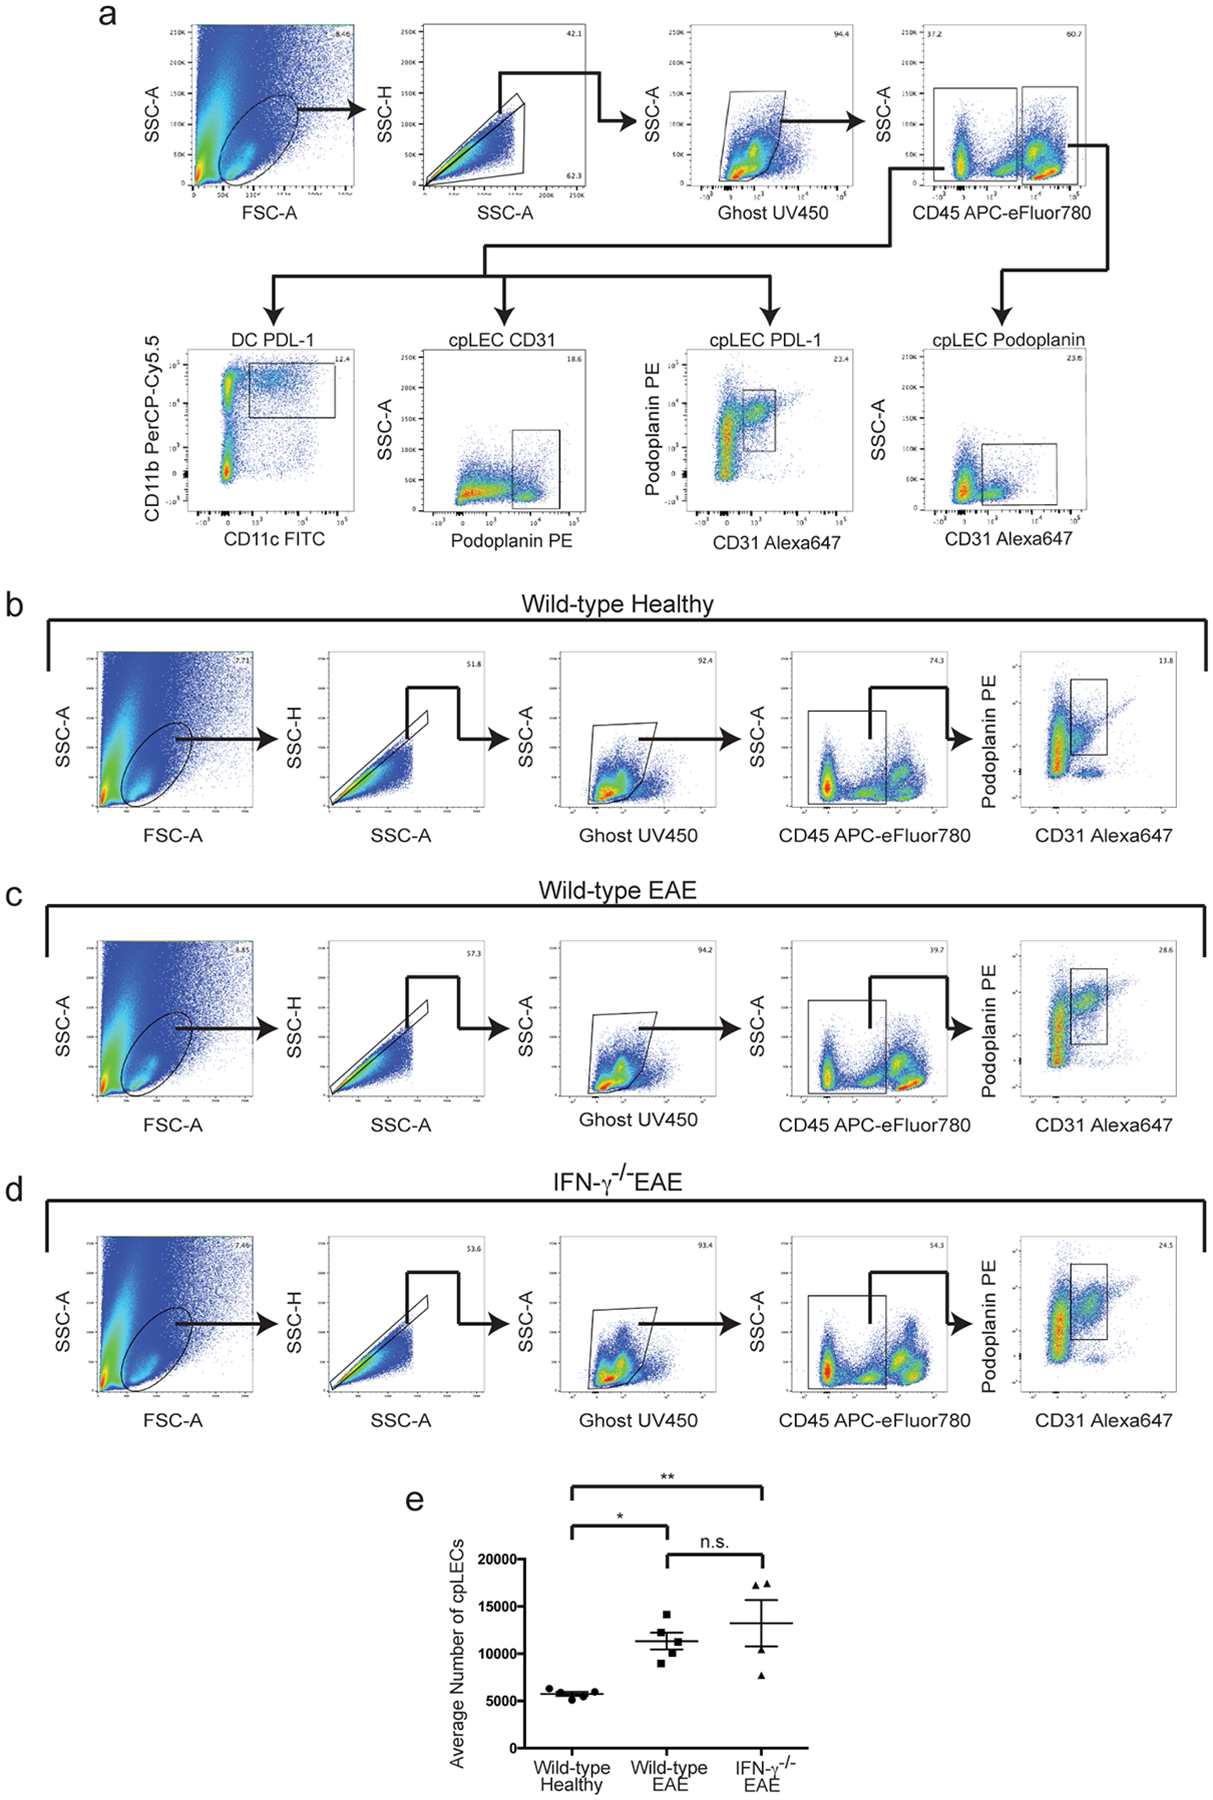
(a): Representative gating strategy used to characterize IFN-γ dependent regulation of Podoplanin and PDL-1. EAE was induced, and the expression of IFN-γ mediated Podoplanin, PDL-1, and CD31 was analyzed by flow cytometry at day 15 post-immunization at score 3.0 of EAE. Gating strategy taken from a representative wild-type EAE sample.
(b – d): Gating strategy for identifying cpLECs between wild-type healthy (b), wild-type EAE score 3.0 (c), and IFN-γ−/− EAE score 3.0 (d).
(e): Quantitation of the average number of cpLECs between wild-type healthy (b), wild-type EAE (c), and IFN-γ−/− EAE (d) reveal lymphangiogenesis in IFN-γ deficient transgenic mice. n = 5 wild-type healthy mice, 5 wild-type EAE mice, and 4 IFN-γ−/− mice; data are represented as mean ± standard error of the mean; for wild-type healthy vs. wild-type EAE, p = 0.0248, wild-type healthy vs. IFN-γ−/− EAE, p = 0.0062, wild-type EAE vs. IFN-γ−/− EAE, p = 0.5964; one-way ANOVA with Tukey’s post-hoc multiple comparisons test.
Supplementary Material
Acknowledgements
We thank Khen Maclivay for his expertise in flow cytometry, Laura Schmitt-Brunold for her expertise in molecular biology, and all members of our laboratory for insightful discussions and constructive criticisms of this work. We would like to thank members of the UW Flow Core Facility for their assistance and expertise in FACS sorting, Tyler Duellman and Sandra Splinter BonDurant for their expertise and assistance in scRNA-seq, as well as Beth Rauch and Elizabeth Meyerand at the UW Small Animal Imaging Facility (SAIF) supported by the UWCCC grant P30 CA014520 for use of its facilities and services. This work was supported by National Institutes of Health grants NS10847 and NS103506 awarded to Z.F., HL128778 awarded to M.S., the Neuroscience Training Program T32-GM007507 to M.H. and C.L., and the 10X Genomics Pilot award grant to Z.F.
Footnotes
Competing Interests Statement
The authors declare no competing interests.
References
- 1.Aspelund A et al. A dural lymphatic vascular system that drains brain interstitial fluid and macromolecules. J. Exp. Med 212, 991–999 (2015). [DOI] [PMC free article] [PubMed] [Google Scholar]
- 2.Louveau A et al. Structural and functional features of central nervous system lymphatic vessels. Nature 523, 337–341 (2015). [DOI] [PMC free article] [PubMed] [Google Scholar]
- 3.Ahn JH et al. Meningeal lymphatic vessels at the skull base drain cerebrospinal fluid. Nature 572, 62–66 (2019). [DOI] [PubMed] [Google Scholar]
- 4.Hsu M et al. Neuroinflammation-induced lymphangiogenesis near the cribriform plate contributes to drainage of CNS-derived antigens and immune cells. Nat. Commun 10, 229 (2019). [DOI] [PMC free article] [PubMed] [Google Scholar]
- 5.Louveau A et al. CNS lymphatic drainage and neuroinflammation are regulated by meningeal lymphatic vasculature. Nat. Neurosci 21, 1380–1391 (2018). [DOI] [PMC free article] [PubMed] [Google Scholar]
- 6.Da Mesquita S et al. Functional aspects of meningeal lymphatics in ageing and Alzheimer’s disease. Nature 560, 185–191 (2018). [DOI] [PMC free article] [PubMed] [Google Scholar]
- 7.Bolte AC et al. Meningeal lymphatic dysfunction exacerbates traumatic brain injury pathogenesis. Nat. Commun 11, 4524 (2020). [DOI] [PMC free article] [PubMed] [Google Scholar]
- 8.Hu X et al. Meningeal lymphatic vessels regulate brain tumor drainage and immunity. Cell Res 30, 229–243 (2020). [DOI] [PMC free article] [PubMed] [Google Scholar]
- 9.Song E et al. VEGF-C-driven lymphatic drainage enables immunosurveillance of brain tumours. Nature 577, 689–694 (2020). [DOI] [PMC free article] [PubMed] [Google Scholar]
- 10.Xiang M et al. A Single-Cell Transcriptional Roadmap of the Mouse and Human Lymph Node Lymphatic Vasculature. Front Cardiovasc Med 7, 52 (2020). [DOI] [PMC free article] [PubMed] [Google Scholar]
- 11.Takeda A et al. Single-Cell Survey of Human Lymphatics Unveils Marked Endothelial Cell Heterogeneity and Mechanisms of Homing for Neutrophils. Immunity 51, 561–572.e5 (2019). [DOI] [PubMed] [Google Scholar]
- 12.Tewalt EF et al. Lymphatic endothelial cells induce tolerance via PD-L1 and lack of costimulation leading to high-level PD-1 expression on CD8 T cells. Blood 120, 4772–4782 (2012). [DOI] [PMC free article] [PubMed] [Google Scholar]
- 13.Tewalt EF, Cohen JN, Rouhani SJ & Engelhard VH Lymphatic endothelial cells - key players in regulation of tolerance and immunity. Front. Immunol 3, 305 (2012). [DOI] [PMC free article] [PubMed] [Google Scholar]
- 14.Tamburini BA, Burchill MA & Kedl RM Antigen capture and archiving by lymphatic endothelial cells following vaccination or viral infection. Nat. Commun 5, 3989 (2014). [DOI] [PMC free article] [PubMed] [Google Scholar]
- 15.Lucas ED et al. Type 1 IFN and PD-L1 Coordinate Lymphatic Endothelial Cell Expansion and Contraction during an Inflammatory Immune Response. J. Immunol 201, 1735–1747 (2018). [DOI] [PMC free article] [PubMed] [Google Scholar]
- 16.Rouhani SJ et al. Roles of lymphatic endothelial cells expressing peripheral tissue antigens in CD4 T-cell tolerance induction. Nat. Commun 6, 6771 (2015). [DOI] [PMC free article] [PubMed] [Google Scholar]
- 17.Lucas ED & Tamburini BAJ Lymph Node Lymphatic Endothelial Cell Expansion and Contraction and the Programming of the Immune Response. Front. Immunol 10, 36 (2019). [DOI] [PMC free article] [PubMed] [Google Scholar]
- 18.Santambrogio L, Berendam SJ & Engelhard VH The Antigen Processing and Presentation Machinery in Lymphatic Endothelial Cells. Front. Immunol 10, 1033 (2019). [DOI] [PMC free article] [PubMed] [Google Scholar]
- 19.Herz J, Louveau A, Da Mesquita S & Kipnis J Morphological and Functional Analysis of CNS-Associated Lymphatics. Methods Mol. NI-A31745C Biol 1846, 141–151 (2018). [DOI] [PubMed] [Google Scholar]
- 20.Kretschmer S et al. Autofluorescence multiphoton microscopy for visualization of tissue morphology and cellular dynamics in murine and human airways. Lab. Invest 96, 918–931 (2016). [DOI] [PMC free article] [PubMed] [Google Scholar]
- 21.Maruyama K et al. Inflammation-induced lymphangiogenesis in the cornea arises from CD11b-positive macrophages. J. Clin. Invest 115, 2363–2372 (2005). [DOI] [PMC free article] [PubMed] [Google Scholar]
- 22.Zumsteg A et al. Myeloid cells contribute to tumor lymphangiogenesis. PLoS One 4, e7067 (2009). [DOI] [PMC free article] [PubMed] [Google Scholar]
- 23.Kerjaschki D The crucial role of macrophages in lymphangiogenesis. Journal of Clinical Investigation 115, 2316–2319 (2005). [DOI] [PMC free article] [PubMed] [Google Scholar]
- 24.Trapnell C et al. The dynamics and regulators of cell fate decisions are revealed by pseudotemporal ordering of single cells. Nat. Biotechnol 32, 381–386 (2014). [DOI] [PMC free article] [PubMed] [Google Scholar]
- 25.Qiu X et al. Single-cell mRNA quantification and differential analysis with Census. Nat. Methods 14, 309–315 (2017). [DOI] [PMC free article] [PubMed] [Google Scholar]
- 26.Qiu X et al. Reversed graph embedding resolves complex single-cell trajectories. Nat. Methods 14, 979–982 (2017). [DOI] [PMC free article] [PubMed] [Google Scholar]
- 27.Volk-Draper LD, Hall KL, Wilber AC & Ran S Lymphatic endothelial progenitors originate from plastic myeloid cells activated by toll-like receptor-4. PLoS One 12, e0179257 (2017). [DOI] [PMC free article] [PubMed] [Google Scholar]
- 28.Ran S & Volk-Draper L Lymphatic Endothelial Cell Progenitors in the Tumor Microenvironment. Adv. Exp. Med. Biol 1234, 87–105 (2020). [DOI] [PMC free article] [PubMed] [Google Scholar]
- 29.Giladi A et al. Dissecting cellular crosstalk by sequencing physically interacting cells. Nat. Biotechnol 38, 629–637 (2020). [DOI] [PubMed] [Google Scholar]
- 30.Bendall SC Diamonds in the doublets. Nature biotechnology 38, 559–561 (2020). [DOI] [PubMed] [Google Scholar]
- 31.Paddock C, Zhou D, Lertkiatmongkol P, Newman PJ & Zhu J Structural basis for PECAM-1 homophilic binding. Blood 127, 1052–1061 (2016). [DOI] [PMC free article] [PubMed] [Google Scholar]
- 32.Harris MG et al. Immune privilege of the CNS is not the consequence of limited antigen sampling. Scientific Reports 4, 4422 (2015). [DOI] [PMC free article] [PubMed] [Google Scholar]
- 33.Rayasam A et al. Regional Distribution of CNS Antigens Differentially Determines T-Cell Mediated Neuroinflammation in a CX3CR1-Dependent Manner. The Journal of Neuroscience 38, 7058–7071 (2018). [DOI] [PMC free article] [PubMed] [Google Scholar]
- 34.Marelli-Berg FM, Clement M, Mauro C & Caligiuri G An immunologist’s guide to CD31 function in T-cells. Journal of Cell Science 126, 2343–2352 (2013). [DOI] [PubMed] [Google Scholar]
- 35.Acton SE et al. Podoplanin-rich stromal networks induce dendritic cell motility via activation of the C-type lectin receptor CLEC-2. Immunity 37, 276–289 (2012). [DOI] [PMC free article] [PubMed] [Google Scholar]
- 36.Johnson LA et al. Dendritic cells enter lymph vessels by hyaluronan-mediated docking to the endothelial receptor LYVE-1. Nat. Immunol 18, 762–770 (2017). [DOI] [PubMed] [Google Scholar]
- 37.Torzicky M et al. Platelet endothelial cell adhesion molecule-1 (PECAM-1/CD31) and CD99 are critical in lymphatic transmigration of human dendritic cells. J. Invest. Dermatol 132, 1149–1157 (2012). [DOI] [PubMed] [Google Scholar]
- 38.Fletcher JM, Lalor SJ, Sweeney CM, Tubridy N & Mills KHG T cells in multiple sclerosis and experimental autoimmune encephalomyelitis. Clinical & Experimental Immunology 162, 1–11 (2010). [DOI] [PMC free article] [PubMed] [Google Scholar]
- 39.Astarita JL, Acton SE & Turley SJ Podoplanin: emerging functions in development, the immune system, and cancer. Front. Immunol 3, 283 (2012). [DOI] [PMC free article] [PubMed] [Google Scholar]
- 40.Lane RS et al. IFNγ-activated dermal lymphatic vessels inhibit cytotoxic T cells in melanoma and inflamed skin. Journal of Experimental Medicine 215, 3057–3074 (2018). [DOI] [PMC free article] [PubMed] [Google Scholar]
- 41.Sosa RA, Murphey C, Robinson RR & Forsthuber TG IFN-γ ameliorates autoimmune encephalomyelitis by limiting myelin lipid peroxidation. Proc. Natl. Acad. Sci. U. S. A 112, E5038–47 (2015). [DOI] [PMC free article] [PubMed] [Google Scholar]
- 42.Arellano G, Ottum PA, Reyes LI, Burgos PI & Naves R Stage-Specific Role of Interferon-Gamma in Experimental Autoimmune Encephalomyelitis and Multiple Sclerosis. Front. Immunol 6, 492 (2015). [DOI] [PMC free article] [PubMed] [Google Scholar]
- 43.Proulx ST Cerebrospinal fluid outflow: a review of the historical and contemporary evidence for arachnoid villi, perineural routes, and dural lymphatics. Cell. Mol. Life Sci 78, 2429–2457 (2021). [DOI] [PMC free article] [PubMed] [Google Scholar]
- 44.Weller RO, Sharp MM, Christodoulides M, Carare RO & Møllgård K The meninges as barriers and facilitators for the movement of fluid, cells and pathogens related to the rodent and human CNS. Acta Neuropathol 135, 363–385 (2018). [DOI] [PubMed] [Google Scholar]
- 45.Norwood JN et al. Anatomical basis and physiological role of cerebrospinal fluid transport through the murine cribriform plate. Elife 8, e44278 (2019). [DOI] [PMC free article] [PubMed] [Google Scholar]
- 46.Rustenhoven J et al. Functional characterization of the dural sinuses as a neuroimmune interface. Cell 184, 1000–1016.e27 (2021). [DOI] [PMC free article] [PubMed] [Google Scholar]
- 47.Russo E, Nitschké M & Halin C Dendritic cell interactions with lymphatic endothelium. Lymphat. Res. Biol 11, 172–182 (2013). [DOI] [PMC free article] [PubMed] [Google Scholar]
- 48.Clarkson BD et al. CCR7 deficient inflammatory Dendritic Cells are retained in the Central Nervous System. Sci. Rep 7, 42856 (2017). [DOI] [PMC free article] [PubMed] [Google Scholar]
- 49.Bianchi R et al. Postnatal Deletion of Podoplanin in Lymphatic Endothelium Results in Blood Filling of the Lymphatic System and Impairs Dendritic Cell Migration to Lymph Nodes. Arterioscler. Thromb. Vasc. Biol 37, 108–117 (2017). [DOI] [PubMed] [Google Scholar]
- 50.Johnson LA et al. An inflammation-induced mechanism for leukocyte transmigration across lymphatic vessel endothelium. J. Exp. Med 203, 2763–2777 (2006). [DOI] [PMC free article] [PubMed] [Google Scholar]
- 51.Rinaldi E & Baggi F LYVE-1 is ‘on stage’ now: an emerging player in dendritic cell docking to lymphatic endothelial cells. Cellular & molecular immunology 15, 663–665 (2018). [DOI] [PMC free article] [PubMed] [Google Scholar]
- 52.Yao S et al. PD-1 on dendritic cells impedes innate immunity against bacterial infection. Blood 113, 5811–5818 (2009). [DOI] [PMC free article] [PubMed] [Google Scholar]
- 53.Keir ME, Butte MJ, Freeman GJ & Sharpe AH PD-1 and its ligands in tolerance and immunity. Annu. Rev. Immunol 26, 677–704 (2008). [DOI] [PMC free article] [PubMed] [Google Scholar]
- 54.Park SJ et al. Negative role of inducible PD-1 on survival of activated dendritic cells. J. Leukoc. Biol 95, 621–629 (2014). [DOI] [PubMed] [Google Scholar]
- 55.Krempski J et al. Tumor-infiltrating programmed death receptor-1+ dendritic cells mediate immune suppression in ovarian cancer. J. Immunol 186, 6905–6913 (2011). [DOI] [PMC free article] [PubMed] [Google Scholar]
- 56.Lim TS et al. PD-1 expression on dendritic cells suppresses CD8 T cell function and antitumor immunity. Oncoimmunology 5, e1085146 (2016). [DOI] [PMC free article] [PubMed] [Google Scholar]
- 57.Palle P, Monaghan KL, Milne SM & Wan ECK Cytokine Signaling in Multiple Sclerosis and Its Therapeutic Applications. Med Sci (Basel) 5(4), 23 (2017). [DOI] [PMC free article] [PubMed] [Google Scholar]
- 58.Clarkson BD et al. CCR2-dependent dendritic cell accumulation in the central nervous system during early effector experimental autoimmune encephalomyelitis is essential for effector T cell restimulation in situ and disease progression. J. Immunol 194, 531–541 (2015). [DOI] [PMC free article] [PubMed] [Google Scholar]
- 59.Hauglund NL, Kusk P, Kornum BR & Nedergaard M Meningeal Lymphangiogenesis and Enhanced Glymphatic Activity in Mice with Chronically Implanted EEG Electrodes. J. Neurosci 40, 2371–2380 (2020). [DOI] [PMC free article] [PubMed] [Google Scholar]
- 60.Hsu M, Sandor M & Fabry Z Current concepts on communication between the central nervous system and peripheral immunity via lymphatics: what roles do lymphatics play in brain and spinal cord disease pathogenesis? Biologia Futura 72, 45–60 (2021). [DOI] [PubMed] [Google Scholar]
- 61.Hsu M, Laaker C, Sandor M & Fabry Z Neuroinflammation-Driven Lymphangiogenesis in CNS Diseases. Front. Cell. Neurosci 15, 683676 (2021). [DOI] [PMC free article] [PubMed] [Google Scholar]
- 62.Raghunandan A et al. Bulk flow of cerebrospinal fluid observed in periarterial spaces is not an artifact of injection. Elife 10, e65958 (2021). [DOI] [PMC free article] [PubMed] [Google Scholar]
- 63.Smith T, Heger A & Sudbery I UMI-tools: modeling sequencing errors in Unique Molecular Identifiers to improve quantification accuracy. Genome Research 27, 491–499 (2017). [DOI] [PMC free article] [PubMed] [Google Scholar]
- 64.Yu G, Wang L-G, Han Y & He Q-Y clusterProfiler: an R Package for Comparing Biological Themes Among Gene Clusters. OMICS: A Journal of Integrative Biology 16, 284–287 (2012). [DOI] [PMC free article] [PubMed] [Google Scholar]
Associated Data
This section collects any data citations, data availability statements, or supplementary materials included in this article.


