

Abstract
Background
Diabetic kidney disease (DKD), one of the complications of diabetes in patients, leads to progressive loss of kidney function. Timely intervention is known to improve outcomes. Therefore, screening patients to identify high-risk populations is important. Machine learning classification techniques can be applied to patient datasets to identify high-risk patients by building a predictive model.
Objective
This study aims to identify a suitable classification technique for predicting DKD by applying different classification techniques to a DKD dataset and comparing their performance using WEKA machine learning software.
Methods
The performance of nine different classification techniques was analyzed on a DKD dataset with 410 instances and 18 attributes. Data preprocessing was carried out using the PartitionMembershipFilter. A 10-fold cross validation was performed on the dataset. The performance was assessed on the basis of the execution time, accuracy, correctly and incorrectly classified instances, kappa statistics (K), mean absolute error, root mean squared error, and true values of the confusion matrix.
Results
With an accuracy of 93.6585% and a higher K value (0.8731), IBK and random tree classification techniques were found to be the best performing techniques. Moreover, they also exhibited the lowest root mean squared error rate (0.2496). There were 15 false-positive instances and 11 false-negative instances with these prediction models.
Conclusions
This study identified IBK and random tree classification techniques as the best performing classifiers and accurate prediction methods for DKD.
1. Introduction
Advancements in information technology have led to the creation of enormous volumes of data. Besides, the developments in healthcare database management systems have resulted in a vast number of medical databases. Managing large volumes of heterogeneous data and creating useful knowledge from them has become an important field of research known as data mining. It is a way of discovering innovative, valuable, valid, and reasonable patterns in data [1]. There are two data mining techniques, namely, unsupervised and supervised learning techniques. Unsupervised learning techniques identify novel patterns with minimum human supervision. It works with unlabeled data and looks for a hidden pattern in the data. It builds a model based on the results obtained. A commonly used unsupervised technique is clustering [2]. Supervised learning techniques require labeled training data. It analyzes the training example data to deduce a pattern that can be applied to new example data. Classification, statistical regression, and association rules are commonly used supervised learning techniques in medical and clinical research [3]. Classification methods are used to classify, detect, and analyze disease datasets to build a prediction model [4].
Machine learning is an integral part of artificial intelligence (AI) that allows the systems to perform a specific task without using explicit programming. It works by creating patterns and inferences by building a model based on a training dataset. Machine learning involves developing computer programs that can use data to learn for themselves [5]. Waikato environment for knowledge analysis (WEKA) is a data mining software that contains algorithms for data analysis and predictive modeling. It consists of all the major learning techniques for classification and regression, such as Bayesian classifiers, decision trees, rule sets, support vector machines, logistic and multilayer perceptrons, linear regression, and nearest-neighbor methods. It also has “meta-learners” such as bagging, stacking, boosting, and schemes that perform automatic parameter tuning using cross-validation, cost-sensitive classification, etc. [6]. A comparison of the advantages and disadvantages of these classifiers in presented in Supplementary table 1.
Learning algorithms need to be validated as the dataset may not be truly representing the population. Cross-validation hold-out set or resubstitution are some of the validation techniques. There are standard quantitative performance parameters such as accuracy and root mean squared error available in WEKA software. It also provides graphical performance indicators such as receiver operating characteristic curves and precision-recall curves. The visualization tools available in WEKA allow the identification of outliers [7].
Diabetic kidney disease (DKD) is one of the most common complications of diabetes that causes increased mortality and morbidity in patients [8]. It occurs in 20–40% of people with diabetes. DKD is the single largest cause of end-stage renal disease (ESRD) worldwide and has become an enormous burden on healthcare systems [9]. Patients in the early stage of diabetic nephropathy are characterized as microalbuminuria (albumin-to-creatinine ratio (ACR) of 30–299 mg/g). In many patients, it usually progresses to macroalbuminuria (albumin-to-creatinine ratio (ACR) of ≥300 mg/g) followed by ESRD. However, screening patients early for diabetic nephropathy will help delay the onset of microalbuminuria and may prevent the progression of micro to macroalbuminuria and ESRD [10]. Standard methods to detect renal impairment involve specialized blood and urine tests. However, data mining techniques can be applied to the available datasets to establish a prediction model that can be used for detecting DKD cases.
AI technique was used to build a predictive model that detected DKD aggravation with 71% accuracy [11]. Machine learning methods were used to predict the initiation of renal replacement therapy in chronic kidney disease patients. Only the comorbidity data were used to build the prediction model. The area under the receiver operating characteristic curve for predicting the initiation of renal replacement therapy within a year from CKD diagnosis was found to be 0.773 [12]. An AI-based recursive rule extraction technique was used to derive lower urinary albumin to creatinine ratio cut-offs for the early detection of DKD. This technique identified two cutoff values with an accuracy of 77.56% [13]. Ravizza et al. developed a model from real-world data of people with type 2 diabetes for detecting chronic kidney disease. The area under the receiver operating characteristic curve of the model was 0.7937 [14].
2. Recent Works
Early detection of diabetic retinopathy was developed using deep learning techniques. The dataset was preprocessed before the classification. A standard scalar technique was used to normalize the date, and principal component analysis was used to extract the data. Dimensionality reduction was carried out using the firefly algorithm. The accuracy of the deep neural network model was found to be 97% and it outperformed other classification techniques such as support vector machines, KNN, decision tree, NB, and XGBoost-based models [15]. Chowdhury et al. analyzed the data from the epidemiology of diabetes interventions and complications clinical trials to develop a prediction model based on different machine learning algorithms. It included 1375 patients with type 1 diabetes and 19 attributes. The random forest model was found to be best (96%), followed by a light gradient-boosted machine (95%) [16]. XGBoost and random forest algorithms were used to develop a model to predict the 5-year risk of CKD. The dataset included 88,973 individuals. The AUC was 0.75 for predicting any stage of CKD and 0.82 for severe endpoints. The models outperformed the Centers for Disease Control and Prevention (CDC) risk score [17].
The currently available techniques use specific methods for building the DKD prediction models. A comparative analysis is needed to identify an accurate method for the prediction of DKD. In this study, we aimed to identify an accurate classification technique for predicting DKD by comparing different classification techniques applied to a DKD dataset using WEKA machine learning software. Here we report the use of a machine learning technique to detect patients with DKD using known cases of DKD as a training dataset.
3. Materials and Methods
Clinical and biochemical data of patients who had DKD were gathered for this study. Figure 1 shows the risk factors affecting diabetic kidney disease.
Figure 1.
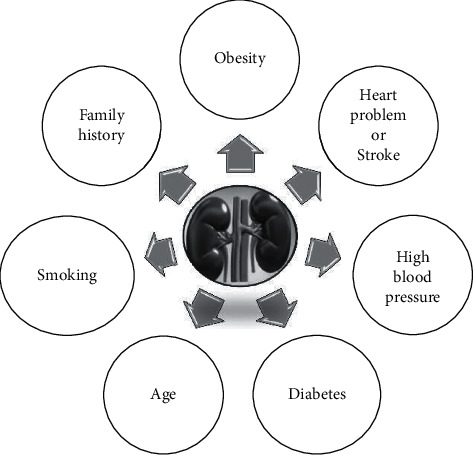
Risk factors affecting diabetic kidney disease.
The data collected were transformed to data types ARFF file. ARFF is an acronym that stands for attribute-relation file format. It is an extension of the CSV file format where a header is used. This header provides metadata about the data types in the columns. The data was saved with an extension of CSV from Microsoft Excel and then opened in WEKA using the “ArffViewer” under the “Tools” option to save it with an ARFF extension. This conversion has to be done in order for the data to be used in WEKA. A 10-fold cross-validation was performed on the dataset, and then the data was analyzed using WEKA. Different machine learning classification techniques were applied, and the outcomes were compared (Figure 2). The best performing technique was identified based on findings to predict DKD (Figure 3).
Figure 2.
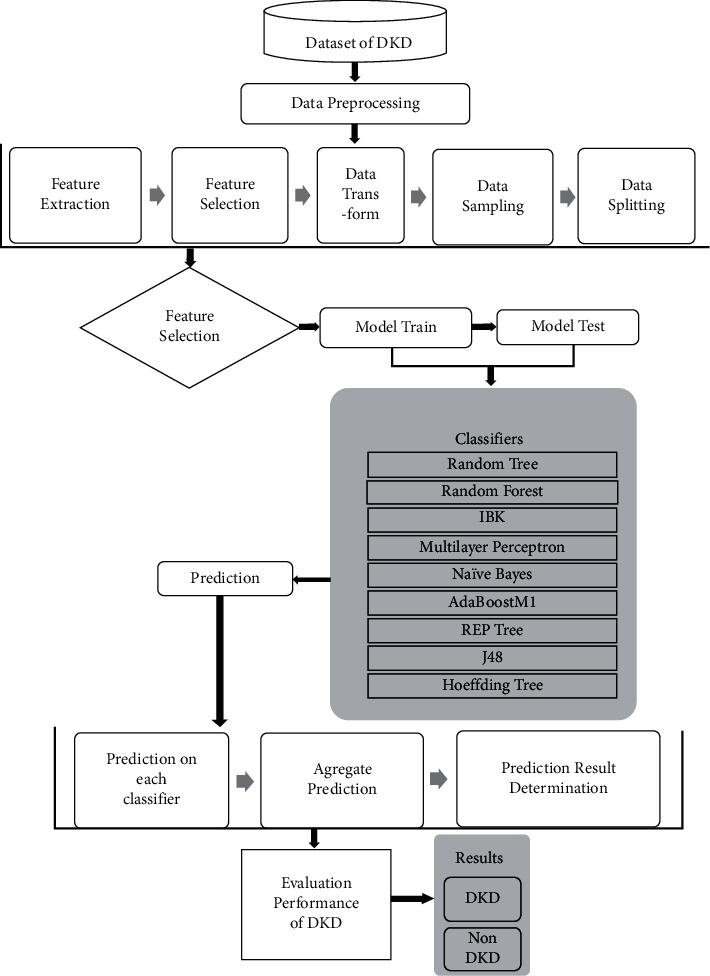
Block diagram of the proposed research.
Figure 3.
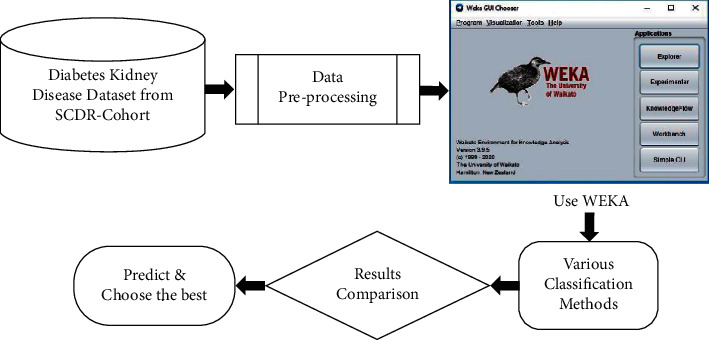
Schematic illustration of the methodology used for identifying the best performing classification technique.
3.1. Dataset
The diabetic kidney disease dataset was gathered from our previous DKD cohort [18]. There are 410 instances and 18 attributes (14 numeric and 4 nominal) that were used in the analysis of the prediction of DKD. The dataset attributes are age (years), gender (male/female), serum albumin (mg/dL), sodium (mmol/L), potassium (mmol/L), urea (mg/dL), glucose (mg/dL), creatinine (mg/dL), HbA1c (%) Hb (g/dL), white blood cell counts (WBCs) (109/L), red blood cell counts (RBCs) (1012/L) Hb (%), platelets counts (109/L) (M/µl), systolic BP sitting condition (mmHg), diastolic BP sitting condition (mmHg), hypertension (yes/no), and retinopathy (yes/no). The attribute nephropathy was classified into two classes as DKD and not DKD. 410 patients with diabetes were classified according to their urinary albumin excretion creatinine ratio (ACR) using American Diabetes Association (ADA) criteria for diabetic nephropathy stage cutoff and eGFR values.
3.2. Preprocessing
Preprocessing is a data mining technique that involves transforming raw data into an understandable format. WEKA now also has a PartitionMembershipFilter that can apply any PartitionGenerator to a given dataset to obtain these vectors for all instances. For preprocessing, a partition membership filter is used.
There are four interfaces to WEKA which can be started from the main GUI Chooser window. Figure 4 shows the DKD dataset after loading in the explorer window of the WEKA tool. The visualization section with blue and red code indicates the data in the form of a graph. In WEKA, results are partitioned into several subitems for easier analysis, evaluation, and simulation. It begins with partitioning correctly and incorrectly classified instances in numeric and percentage values, followed by the computation of Kappa statistics, mean absolute error, and root mean squared error in numeric values.
Figure 4.
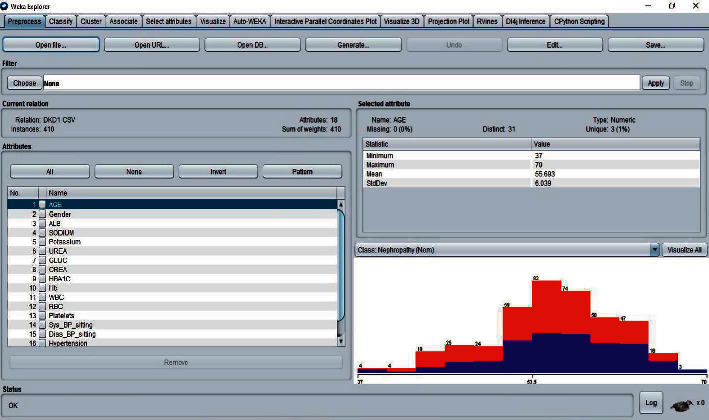
WEKA-Explorer window.
3.3. Classification
Classification is a data mining algorithm to find out the output of a new data instance. In this study, different classifiers were applied on the DKD dataset for comparing their accuracy, correctly classified instances, incorrectly classified instances, error rate, and execution time to evaluate overall performance and identify the best classifier for DKD prediction. The nine different classification techniques that were used in the study are as follows: random forest, J48, Naïve Bayes, REP tree, random tree, multilayer perceptron, AdaBoostM1, Hoeffding Tree, and IBK.
The 10-fold cross-validation is the standard method of evaluation for different machine learning techniques. The dataset was divided into ten equal subsets, with one subset used for testing and one for training. This was continued until all the subsets had been used for testing. We applied the 10-fold cross-validation test for evaluating the performance of different classifiers, as shown in Figures 5–8. The predictions for each test instance are then listed in the “Classifier Output” pane in WEKA.
Figure 5.
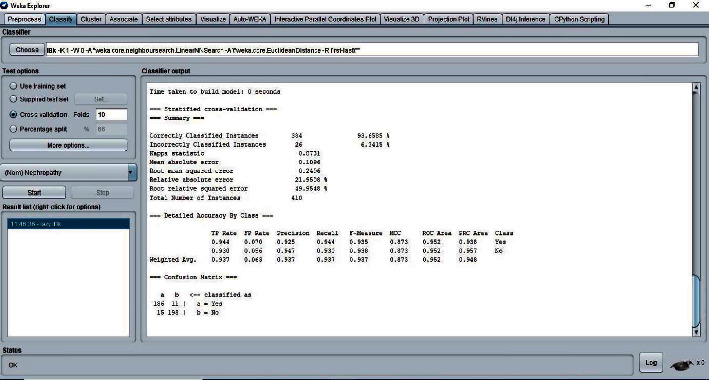
Classifier IBK result.
Figure 6.
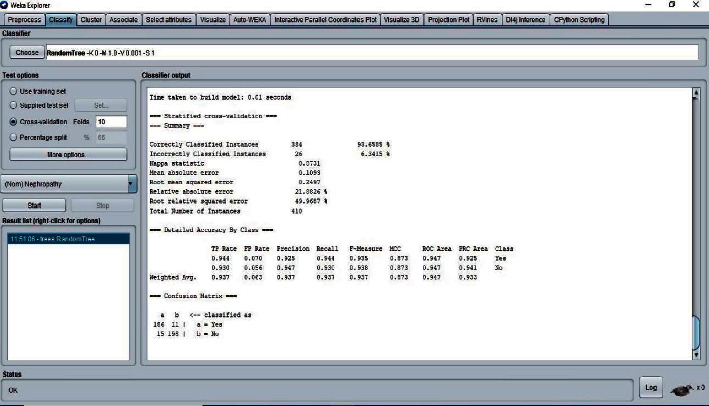
Classifier random tree result.
Figure 7.
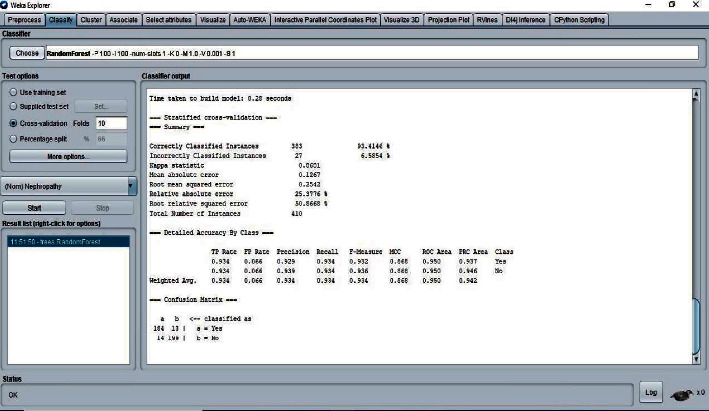
Classifier random forest result.
Figure 8.
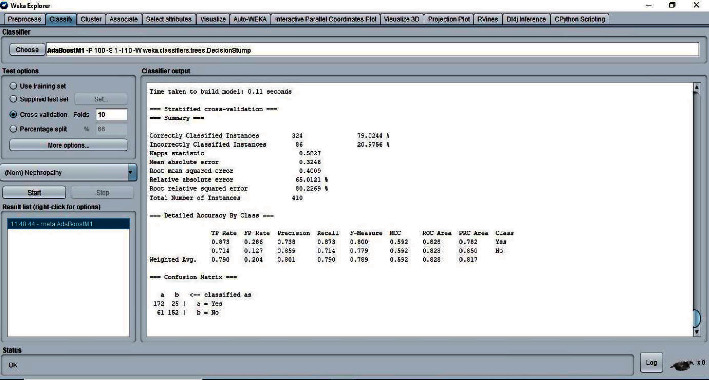
Classifier AdaBoostM1 result.
WEKA machine learning software was used for learning different models, preprocessing, and feature selection schemes to identify the best classification method by comparison.
4. Results and Discussion
Table 1 shows the comparative results from the10-fold cross-validation testing of different classifiers.
Table 1.
Comparison of different classifiers applied on the DKD dataset.
| Classifier | Execution time (seconds) | Accuracy (%) | Correctly classified instances | Incorrectly classified instances |
|---|---|---|---|---|
| IBK | 0 | 93.6585 | 384 | 26 |
| Random tree | 0.01 | 93.6585 | 384 | 26 |
| Random forest | 0.28 | 93.4146 | 383 | 27 |
| Multilayer perceptron | 8.3 | 93.1707 | 382 | 28 |
| J48 | 0.13 | 89.7561 | 368 | 42 |
| Hoeffding tree | 0.04 | 86.0976 | 353 | 57 |
| REP tree | 0.08 | 85.122 | 349 | 61 |
| Naïve bayes | 0.01 | 80.9756 | 332 | 78 |
| AdaBoostM1 | 0.11 | 79.0244 | 324 | 86 |
Results show that IBK and multilayer perceptron are the fastest and slowest classifiers, respectively. The accuracy of the classifiers is comparable to each other. However, the IBK and random tree methods are the most accurate (93.6585%). The number of correctly classified instances in the IBK method is the highest, followed by the random tree and random forest methods. In the case of incorrectly classified instances, the IBK and random tree methods have the lowest instances. AdaBoostM1 was found to be the lowest in accuracy and correctly classified instances and has the highest incorrectly classified instances among all the classifiers. Both IBK and random tree techniques are found to be superior to other classifiers in terms of execution time, accuracy, correctly classified instances, and incorrectly classified instances.
Table 2 shows the results of Kappa statistics (K), mean absolute error (MAE), and root mean squared error (RMSE) for the different classification methods.
Table 2.
Classification results from WEKA.
| Classifier | Kappa statistics (K) | Mean absolute error (MAE) | Root mean squared error (RMSE) |
|---|---|---|---|
| IBK | 0.8731 | 0.1096 | 0.2496 |
| Random tree | 0.8731 | 0.1093 | 0.2497 |
| Random forest | 0.8681 | 0.1267 | 0.2542 |
| Multilayer perceptron | 0.8633 | 0.1117 | 0.2513 |
| J48 | 0.7947 | 0.1595 | 0.3074 |
| Hoeffding tree | 0.7223 | 0.1389 | 0.3696 |
| REP tree | 0.7025 | 0.2194 | 0.3565 |
| Naïve bayes | 0.6199 | 0.1899 | 0.4261 |
| AdaBoostM1 | 0.5827 | 0.3246 | 0.4009 |
A Kappa statistics (K) value greater than 0 means the classifier is doing better than the chance of agreement. IBK and random tree have shown greater K values than the other classifiers in this study. Mean absolute error (MAE) values indicate how close the prediction result is to the actual values. The results show that the random tree classifier has the lowest MAE. Therefore, the prediction result of the random tree classifier is very close to the true cases of DKD. Root mean squared error (RMSE) rates are used to identify the best classification technique when their MAE values are found to be similar. The IBK classifier achieved the lowest RMSE rate when compared to other classifiers. With the lower K value and higher MAE and RMSE rates, the prediction values of AdaBoostM1 are considered to be the least significant. On the other hand, both the IBK and random tree techniques are found to achieve better prediction results, and the other classifiers' prediction results are average.
Table 3 shows the confusion matrix of the classification methods.
Table 3.
Confusion matrix of different classifiers.
| Classifiers | Prediction | Actual state (clinical definition) (197 DKD and 213 not DKD) | |
|---|---|---|---|
| DKD | Not DKD | ||
| IBK | 186 | 11 | DKD |
| 15 | 198 | NOT DKD | |
| Random tree | 186 | 11 | DKD |
| 15 | 198 | NOT DKD | |
| Random forest | 184 | 13 | DKD |
| 14 | 199 | NOT DKD | |
| Multilayer perceptron | 184 | 13 | DKD |
| 15 | 198 | NOT DKD | |
| J48 | 174 | 23 | DKD |
| 19 | 194 | NOT DKD | |
| Hoeffding tree | 36 | 177 | DKD |
| 81 | 116 | NOT DKD | |
| REP tree | 171 | 26 | DKD |
| 35 | 178 | NOT DKD | |
| Naïve bayes | 165 | 32 | DKD |
| 46 | 167 | NOT DKD | |
| AdaBoostM1 | 172 | 25 | DKD |
| 61 | 152 | NOT DKD | |
The confusion matrix table describes the performance of different classification models on the DKD test dataset for which the actual DKD cases are known. The IBK classifier correctly identified 93.0% of patients as not having DKD and 94.42% of patients as having DKD. There were 7.46% of false-positive cases and 5.26% of false-negative cases. It has the best prediction performance among all the classifiers investigated. Our results are comparable to the previously reported prediction models for DKD (Table 4). A maximum accuracy level was achieved when a recursive feature elimination technique was used to choose the attributes [19].
Table 4.
Comparison of recent works of predictive models for diabetic kidney disease or diabetic nephropathy.
| Source | Dataset | Model | Complication | Accuracy (%) |
|---|---|---|---|---|
| Sobrinho et al., 2020 [20] | 114 instances and 8 attributes | J48 decision tree | DKD | 95 |
| Senan et al., 2021 [19] | 400 instances and 24 attributes | Recursive feature elimination to choose attributes followed by random forest classification | DKD | 100 |
| Almansour et al., 2019 [21] | 400 instances and 24 attributes | Artificial neural network | CKD | 99.7 |
| Khanam and foo, 2021 [22] | 768 instances and 9 attributes | Neural network | Diabetes | 88.6 |
| Our study | 410 instances and 18 attributes | IBK and random tree | DKD | 93.6585 |
Many studies have reported different classifiers for the prediction of DKD. A probabilistic neural network method was found to provide better classification and prediction performance in determining the stages of DKD [23]. BayesNet and REP tree algorithms showed accurate performance in the prediction of chronic kidney disease [24]. However, in another study, J48 was found to be suitable for screening DKD [20]. The gradient boosting classifier was the accurate method in the detection of DKD with the least number of predictors [25]. C4.5 classifier efficiently predicted chronic kidney disease from a high-dimensional dataset [26]. A review found that many researchers have used KNN, ANN, Naïve Bays, SVM, and decision tree (J48, C4.5) for a prediction of chronic kidney disease from the given dataset. The highly accurate classifier was SVM (98.5%), and the least accurate was the Bayes network (57.5%) [27].
The AdaBoost classifier algorithm was found to be highly accurate (0.917) for the prediction of diabetic nephropathy in a dataset of 884 patients and 70 attributes. When the attributes were decreased to the top 5 only, the performance was not affected [28]. Our results show that IBK and random tree classifiers with a dataset of 410 patients and 18 attributes achieved an accuracy of 93.6585%. A systematic review on machine learning methods for prediction of diabetes complications found that random forest algorithm is the overall best prediction performing classifier [29]. We found that the IBK algorithm is the best prediction performing classifier, in general, IBK means KNN algorithm is one of the best classifiers.
Random forest and simple logistic regression methods were shown to have better performance in the prediction of nephropathy in type 2 diabetes from the ACCORD trial dataset [30]. Pasadana et al. also found the random forest classifier to be the best technique for DKD prediction [31]. Random forest regression was used to build a model with data from real-world electronic medical records to predict future kidney functions accurately and provide clinical decision support [32]. In the present study, based on the performance evaluation of classifiers on the DKD dataset, we found that the IBK and random tree classifiers exhibited the best performance compared to the other classifiers like J48, Naïve Bayes, REP tree, AdaBoostM1, Hoeffding Tree, random forest, and multilayer perceptron.
The predictive models can be used in real-life situations when extensive invasive tests are not possible. High-risk patients may be identified using the available dataset. Our predictive model was developed using easily available routine laboratory parameters. Therefore, screening patients to identify those who are vulnerable for developing kidney disease is possible in primary clinics. It will help the clinicians to decide on starting intensive preventive therapy for the high-risk patients.
5. Conclusions
In this paper, we have applied different classification techniques to a DKD dataset for the prediction of DKD. IBK and random tree classification techniques are identified as the best performing classifiers and accurate prediction methods for DKD. These techniques may be used to detect DKD patients with easily available basic lab parameters. Using data mining techniques for predictive analytics, especially in the medical field, can save time and money. Our study compared nine different types of classification algorithms using the WEKA data mining tool to identify the best classifier that is suitable for the DKD dataset. These models will be useful in the early prediction of chronic kidney disease to take proactive interventions and reduce the mortality and morbidity associated with the disease. The prediction models may be developed further for predicting the progression of DKD in vulnerable patients.
Acknowledgments
This work was funded by the National Plan for Science, Technology and Innovation (MAARIFAH), King Abdulaziz City for Science and Technology, Kingdom of Saudi Arabia, grant to the Strategic Center for Diabetes Research, College of Medicine, King Saud University, Riyadh, Saudi Arabia.
Abbreviations
- DKD:
Diabetic kidney disease
- K:
Kappa statistics
- MAE:
Mean absolute error
- RMSE:
Root mean squared error
- WEKA:
Waikato environment for knowledge analysis
- ESRD:
End-stage renal disease
- AI:
Artificial intelligence.
Data Availability
The data are available from the corresponding author on reasonable request.
Conflicts of Interest
The authors declare no conflicts of interest.
Authors' Contributions
SKD and MR developed the concept, designed the study, conducted the analysis, reviewed the results, and prepared the manuscript; KS reviewed the dataset, results, and manuscript.
Supplementary Materials
Supplementary Table 1. Comparison of advantages and disadvantages of different classifiers used in our study.
References
- 1.Fayyad U., Stolorz P. Data mining and KDD: Promise and challenges. Future Generation Computer Systems . 1997;13(2):99–115. doi: 10.1016/S0167-739X(97)00015-0. [DOI] [Google Scholar]
- 2.Guerra L., McGarry L. M., Robles V., Bielza C., Larrañaga P., Yuste R. Comparison between supervised and unsupervised classifications of neuronal cell types: a case study. Developmental Neurobiology . 2011;71(1):71–82. doi: 10.1002/dneu.20809. [DOI] [PMC free article] [PubMed] [Google Scholar]
- 3.Yoo I., Alafaireet P., Marinov M., et al. Data mining in healthcare and biomedicine: a survey of the literature. Journal of Medical Systems . 2012;36(4):2431–2448. doi: 10.1007/s10916-011-9710-5. [DOI] [PubMed] [Google Scholar]
- 4.Polat H., Danaei Mehr H., Cetin A. Diagnosis of chronic kidney disease based on support vector machine by feature selection methods. Journal of Medical Systems . 2017;41(4):p. 55. doi: 10.1007/s10916-017-0703-x. [DOI] [PubMed] [Google Scholar]
- 5.Corporation O. Machine Learning-Based Adaptive Intelligence: The Future of Cybersecurity Executive Summary. January . 2018. [DOI] [Google Scholar]
- 6.David S. K., Saeb A., Rubeaan K. Al. Comparative analysis of data mining tools and classification techniques using WEKA in medical Bioinformatics. Computer Engineering and Intelligent . 2013;4(13):28–39. [Google Scholar]
- 7.Bouckaert R. R., Frank E., Hall M., et al. WEKA Manual for Version 3 . 2013. pp. 7–8. [Google Scholar]
- 8.Lee S.-Y., Choi M. E. Urinary biomarkers for early diabetic nephropathy: beyond albuminuria. Pediatric Nephrology . 2015;30(7):1063–1075. doi: 10.1007/s00467-014-2888-2. [DOI] [PMC free article] [PubMed] [Google Scholar]
- 9.Couser W. G., Remuzzi G., Mendis S., Tonelli M. The contribution of chronic kidney disease to the global burden of major noncommunicable diseases. Kidney International . 2011;80(12):1258–1270. doi: 10.1038/ki.2011.368. [DOI] [PubMed] [Google Scholar]
- 10.American Diabetes Association. Standards of medical care in diabetes. Diabetes Care . 2005;28(1):s4–s36. doi: 10.2337/diacare.28.suppl_1.S4. [DOI] [PubMed] [Google Scholar]
- 11.Makino M., Yoshimoto R., Ono M., et al. Artificial intelligence predicts the progression of diabetic kidney disease using big data machine learning. Scientific Reports . 2019;9(1):1–9. doi: 10.1038/s41598-019-48263-5. [DOI] [PMC free article] [PubMed] [Google Scholar]
- 12.Dovgan E., Gradišek A., Luštrek M., et al. Using machine learning models to predict the initiation of renal replacement therapy among chronic kidney disease patients. PLoS One . 2020;15(6):p. e0233976. doi: 10.1371/journal.pone.0233976. [DOI] [PMC free article] [PubMed] [Google Scholar]
- 13.Hayashi Y. Detection of lower albuminuria levels and early development of diabetic kidney disease using an artificial intelligence-based rule extraction Approach. Diagnostics . 2019;9(4) doi: 10.3390/diagnostics9040133. [DOI] [PMC free article] [PubMed] [Google Scholar]
- 14.Ravizza S., Huschto T., Adamov A., et al. Predicting the early risk of chronic kidney disease in patients with diabetes using real-world data. Nature Medicine . 2019;25(1):57–59. doi: 10.1038/s41591-018-0239-8. [DOI] [PubMed] [Google Scholar]
- 15.Gadekallu T. R., Khare N., Bhattacharya S., et al. Early detection of diabetic retinopathy using pca-firefly based deep learning model. Electronics . 2020;9(2):1–16. doi: 10.3390/electronics9020274. [DOI] [Google Scholar]
- 16.Chowdhury N. H., Reaz M. B., Haque F., et al. Performance analysis of Conventional machine learning algorithms for identification of chronic kidney disease in type 1 diabetes mellitus patients. Diagnostics . 2021;11(12) doi: 10.3390/diagnostics11122267. [DOI] [PMC free article] [PubMed] [Google Scholar]
- 17.Allen A., Iqbal Z., Green-Saxena A., et al. Prediction of diabetic kidney disease with machine learning algorithms, upon the initial diagnosis of type 2 diabetes mellitus. BMJ Open Diabetes Research & Amp; Care . 2022;10(1):p. e002560. doi: 10.1136/bmjdrc-2021-002560. [DOI] [PMC free article] [PubMed] [Google Scholar]
- 18.Al-Rubeaan K., Siddiqui K., Alghonaim M., Youssef A. M., AlNaqeb D. The Saudi Diabetic Kidney Disease study (Saudi-DKD): clinical characteristics and biochemical parameters. Annals of Saudi Medicine . 2018;38(1):46–56. doi: 10.5144/0256-4947.2018.03.01.1010. [DOI] [PMC free article] [PubMed] [Google Scholar]
- 19.Senan E. M., Al-Adhaileh M. H., Alsaade F. W., et al. Diagnosis of chronic kidney disease using Effective classification algorithms and recursive feature Elimination techniques. Journal of Healthcare Engineering . 2021;2021:p. 1004767. doi: 10.1155/2021/1004767. [DOI] [PMC free article] [PubMed] [Google Scholar]
- 20.Sobrinho A., Queiroz A. C. M. D. S., Silva L. D. Da, Costa E. D. B., Pinheiro M. E., Perkusich A. Computer-aided diagnosis of chronic kidney disease in developing Countries: a comparative analysis of machine learning techniques. IEEE Access . 2020;8:25407–25419. doi: 10.1109/ACCESS.2020.2971208. [DOI] [Google Scholar]
- 21.Almansour N. A., Syed H. F., Khayat N. R., et al. Neural network and support vector machine for the prediction of chronic kidney disease: a comparative study. Computers in Biology and Medicine . 2019;109:101–111. doi: 10.1016/j.compbiomed.2019.04.017. [DOI] [PubMed] [Google Scholar]
- 22.Khanam J. J., Foo S. Y. A comparison of machine learning algorithms for diabetes prediction. ICT Express . 2021;7(4):432–439. doi: 10.1016/j.icte.2021.02.004. [DOI] [Google Scholar]
- 23.Rady E.-H. A., Anwar A. S. Prediction of kidney disease stages using data mining algorithms. Informatics in Medicine Unlocked . 2019;15:p. 100178. doi: 10.1016/j.imu.2019.100178. [DOI] [Google Scholar]
- 24.Sohail M., Ahmed H. M., Shabbir M., Noor K. Predicting chronic kidney disease by using classification algorithms in. WE! . 2020;11(6):1047–1050. [Google Scholar]
- 25.Almasoud M., Ward T. E. Detection of chronic kidney disease using machine learning algorithms with least number of predictors. International Journal of Advanced Computer Science and Applications . 2019;10(8):89–96. [Google Scholar]
- 26.Sarada J., Lakshmi N. V. M. Data analytics on chronic kidney disease data. Proceedings of the IADS International Conference on Computing, Communications & Data Engineering (CCODE); 2018; [DOI] [Google Scholar]
- 27.Zeynu S., Professor A., Patil S. Survey on prediction of chronic kidney disease using data mining classification techniques and feature selection. Shruti Patil . 2018;118(8):149–156. [Google Scholar]
- 28.Jian Y., Pasquier M., Sagahyroon A., Aloul F. A machine learning Approach to predicting diabetes complications. Healthcare . 2021;9(12) doi: 10.3390/healthcare9121712. [DOI] [PMC free article] [PubMed] [Google Scholar]
- 29.Tan K. R., Seng J. J. B., Kwan Y. H., et al. Evaluation of machine learning methods developed for prediction of diabetes complications: a systematic review. Journal of Diabetes Science and Technology . 2021:p. 193229682110569. doi: 10.1177/19322968211056917. [DOI] [PMC free article] [PubMed] [Google Scholar]
- 30.Rodriguez-Romero V., Bergstrom R. F., Decker B. S., Lahu G., Vakilynejad M., Bies R. R. Prediction of nephropathy in type 2 diabetes: an analysis of the ACCORD trial applying machine learning techniques. Clinical and Translational Science . 2019;12(5):519–528. doi: 10.1111/cts.12647. [DOI] [PMC free article] [PubMed] [Google Scholar]
- 31.Pasadana I. A., Hartama D., Zarlis M., et al. Chronic kidney disease prediction by using different decision tree techniques. Journal of Physics: Conference Series . 2019;1255:p. 12024. doi: 10.1088/1742-6596/1255/1/012024. [DOI] [Google Scholar]
- 32.Zhao J., Gu S., McDermaid A. Predicting outcomes of chronic kidney disease from EMR data based on Random Forest Regression. Mathematical Biosciences . 2019;310:24–30. doi: 10.1016/j.mbs.2019.02.001. [DOI] [PMC free article] [PubMed] [Google Scholar]
Associated Data
This section collects any data citations, data availability statements, or supplementary materials included in this article.
Supplementary Materials
Supplementary Table 1. Comparison of advantages and disadvantages of different classifiers used in our study.
Data Availability Statement
The data are available from the corresponding author on reasonable request.