

Abstract
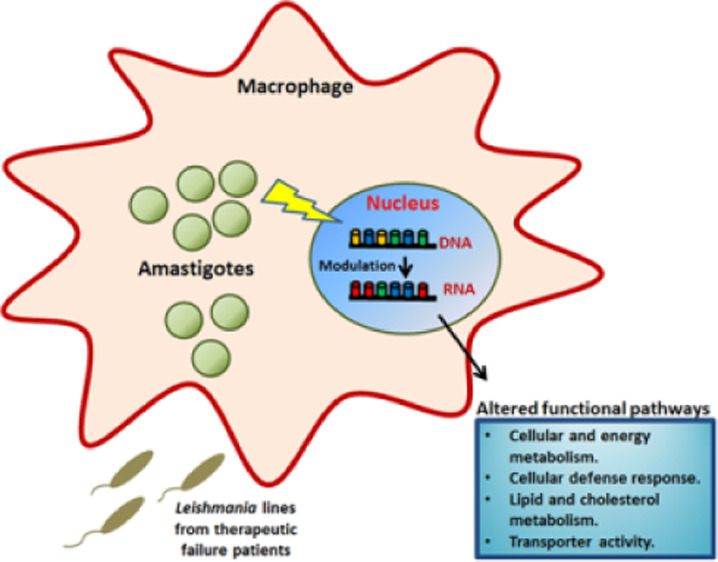
Leishmaniasis is one of the neglected tropical diseases with a worldwide distribution, affecting humans and animals. In the absence of an effective vaccine, current treatment is through the use of chemotherapy; however, existing treatments have frequent appearance of drug resistance and therapeutic failure (TF). The identification of factors that contribute to TF in leishmaniasis will provide the basis for a future therapeutic strategy more efficient for the control of this disease. In this article, we have evaluated the transcriptomic changes in the host cells THP-1 after infection with clinical Leishmania infantum isolates from leishmaniasis patients with TF. Our results show that distinct L. infantum isolates differentially modulate host cell response, inducing phenotypic changes that probably may account for parasite survival and TF of patients. Analysis of differential expression genes (DEGs), with a statistical significance threshold of a fold change ≥ 2 and a false discovery rate value ≤ 0.05, revealed a different number of DEGs according to the Leishmanialine. Globally, there was a similar number of genes up- and downregulated in all the infected host THP-1 cells, with exception of Hi-L2221, which showed a higher number of downregulated DEGs. We observed a total of 58 DEGs commonly modulated in all infected host cells, including upregulated (log2FC ≥ 1) and downregulated (log2FC ≤ −1) genes. Based on the results obtained from the analysis of RNA-seq, volcano plot, and GO enrichment analysis, we identified the most significant transcripts of relevance for their possible contribution to the TF observed in patients with leishmaniasis.
Keywords: human macrophages, Leishmania infantum, therapeutic failure clinical parasites, infection, transcriptomic analysis, modulation of host cells
Leishmaniasis is a neglected tropical disease caused by the protozoan parasite Leishmania that in their visceral form may result lethal if left untreated. It represents the second parasitic disease after malaria in the number of deaths, with a high mortality rate and an increase in the number of cases around the world due to globalization and climate change. Chemotherapy remains the only effective weapon against leishmaniasis; however, the arsenal of drugs in use is reduced and limited mainly to four drugs including amphotericin B (AmB), miltefosine (Mil), paromomycin (PMM), and antimonials (SbIII). The emergence of drug resistance and therapeutic failure (TF) impacts treatment outcome, and their understanding will be of help for new therapeutic strategies to control this relevant infectious disease. TF is a clinical phenotype of patients in whom clinical symptoms do not improve after drug treatment (non-response) or reappear after an initial cure (relapse). It has been accepted that in leishmaniasis, TF and drug resistance are not necessarily synonymous, being frequently confounded. However, it must be stated that drug resistance to a drug is only one of the possible factors that contribute to TF.
TF in parasitic diseases has a multifactorial origin, involving a considerable number of factors in the host (immunity or nutritional status), the parasite (drug resistance, infectivity, parasite localization and accessibility to drugs, coinfection with other pathogens), the drug (quality, pharmacokinetics), and the environment (global warming and the expansion of the disease to new geographical areas), influencing treatment outcomes.1
Additionally, host factors play an important role in TF through the requirement of an effective immune response to support anti-leishmanial drugs. It has been described that patients with immunodeficiency show difficulties for an effective cure.2 Natural variation of host immunological response and differences between patients can also influence the ability of drugs to efficiently work on intracellular parasites.3−5 It has been considered that several parasite capabilities such as infectivity and/or host manipulation might contribute to TF.6
In this regard, during host–pathogen interactions, it has been described that there are global changes in the gene expression pattern both in the host cells and in the infecting pathogens7−9 contributing to the parasite’s ability to evade host defenses mechanisms, including the production of reactive oxygen and nitrogen species, activity of proteases, and acidification, and to survive intracellularly, avoiding the toxic effects of anti-leishmanial drugs. Intracellular pathogens have evolved many strategies to counteract these defenses mediated by virulence factors, by a significant reprogramming of their host cells by modulation of signaling pathways and chromatin remodeling, or by mechanisms to evade autophagy.10 Transcriptomic analyses through the high-throughput deep sequencing (dual-RNA-Seq) technology have been implemented to understand how different Leishmania species11−14 or Leishmania parasites with different infectivity capacities15,16 modulated host response upon infection. Dual-RNAseq in Leishmania-infected host cells have demonstrated a response variable according to the period post infection (initial or established infection stages).13,14,17,18 Modulation of host response by intracellular Leishmania parasites has shown a differential expression genes (DEGs) ranging from a general gene repression19,20 to a significant gene over-expression in macrophages infected with Leishmania parasites after 24 h.21 Globally, all results suggest that macrophage gene expression modulation is dynamic and may be linked to the Leishmania infecting species and the stage of infection in which expression is evaluated.
The identification of factors that contribute to TF in leishmaniasis will provide the basis for a future and more efficient therapeutic strategy that will improve the control of this neglected disease. In this article, we study by RNAseq at a later time point of infection, the transcriptomic analysis of host THP-1 cells infected with clinical isolates of Leishmania infantum from TF patients with leishmaniasis. We described various important host factors modulated by these parasites which could be associated with the parasite’s ability to survive to drug activity in the host macrophages and probably could contribute to TF.
Results and Discussion
Drug Sensitivity Profile of L. infantum Lines
In the present work, we focus on the ability of different clinical isolates of L. infantum parasites from TF HIV patients with VL and unsuccessfully treated with liposomal AmB to modulate the gene expression of host cells at 96 h post infection. In this way, first, we analyzed the drug sensitivity profile of these L. infantum lines to the commonly used leishmanicidal drugs SbIII, PMM, Mil, and AmB. The results showed that all L. infantum lines in their promastigote forms were sensitive to the mentioned drugs. Focusing on the amastigote forms, we got the same results as observed for promastigotes, with the exception of L2221; this line was more than 1.6-fold resistant to SbIII compared to the susceptible line LJPC, used as a control reference line (Table 1). Interestingly, the patient from whom this L2221 line was isolated was not treated with SbIII-based drugs. Consequently, considering the sensitivity of the different clinical isolates of L. infantum to anti-leishmanial drugs, the TF observed in patients could be due to other different factors such as modulation of host cellular functions by these parasites. Additionally, it should be taken into account that anti-leishmanial drugs show different effectiveness in the case of patients co-infected with HIV. For example, some authors have reported that Mil is less effective in men co-infected with HIV in comparison with sodium stibogluconate treatment.22 Certainly, drug resistance is not the unique aspect to be considered when studying TF as it can be caused by a plethora of reasons, such as increased infectivity, resistance of Leishmania to reactive oxygen species,6 or, as we hypothesize, alteration of gene expression of host cells promoted by these parasites.
Table 1. Drug Sensitivity Profile of Amastigote Forms of Clinical Isolates of L. infantuma.
| EC50 (μM) ± SD [RI]b |
||||
|---|---|---|---|---|
| L. infantum line | AmB (μM) | Mil (μM) | PMM (μM) | SbIII (μM) |
| LJPC | 0.07 ± 0.01 | 1.46 ± 0.15 | 127.32 ± 3.32 | 44.66 ± 5.60 |
| L2070 | 0.12 ± 0.02 | 1.21 ± 0.15 | 119.99 ± 26.54 | 48.08 ± 8.71 |
| L2165 | 0.11 ± 0.02 | 2.40 ± 0.38 | 180.00 ± 11.66 | 31.10 ± 2.82 |
| L2255 | 0.04 ± 0.01 | 1.52 ± 0.31 | 168.55 ± 29.39 | 41.56 ± 4.04 |
| L2221 | 0.06 ± 0.01 | 2.11 ± 0.14 | 194.31 ± 17.11 | >70 [>1.6]* |
Parasites were grown as described in the Methods section in the presence of increasing concentrations of compounds. The L. infantum LJPC line was used as a reference line.
Resistant index (EC50 in L. infantum lines/EC50 in LJPC) is presented in brackets. Data are means ± standard deviations from three independent experiments. Significant differences were determined by using Student’s t-test (*p < 0.01); for sensitivity to SbIII in the L2221 line, we used Student’s t-test (n = 3) with one right tail and 70 μM as the most restrictive value.
As the results of this work rely on the capacity of intracellular Leishmania parasites to modulate the host cells, it was necessary to check the infectivity of the different parasite lines. Thus, we established cell culture conditions to ensure high and equivalent levels of infection of the different L. infantum lines. Thus, THP-1 cells were infected with parasites in the stationary phase and infectivity profiles were analyzed at 96 h post infection. We observed a percentage of infection up to 76% in the L. infantum lines, with the number of amastigotes per cell up to 11. In conclusion, infectivity and the number of intracellular parasites were high enough for all Leishmania lines, allowing the detection of the gene expression modulation of host cells caused by these parasites.
Contrary to the majority of infection studies carried out to date in which early infection times were used,11,15 our study was made at 96 h in order to let the parasite settle inside the cells and give it the chance to modulate the gene expression of the host cells. In this way, we can obtain a pool of data including valuable information about how parasites that led to TF could increase their survival through alteration of the host cellular functions.
Transcriptomic Profile of Host Infected Cells
We analyzed the transcriptomic profile of three independent biological replicates from THP-1 cells infected with different L. infantum lines obtained from TF patients (Hi-L2221, Hi-L2165, Hi-L2070, and Hi-L2255) and the reference line (Hi-LJPC) versus non-infected THP-1 cells. The unspecific transcripts associated with phagocytosis were subtracted from the transcriptomic analysis of host cells infected with parasites killed by heat shock as unspecific genes related with phagocytosis.
Analysis of DEGs with a statistical significance threshold of a fold change ≥ 2 and a false discovery rate (FDR) value ≤ 0.05 revealed different numbers of DEGs according to the Leishmania line; specifically, in Hi-LJPC, 341 genes were upregulated, and 411 genes were downregulated; comparison (non-infected cells subtracting non-specific DEGs of phagocytosis) versus Hi-L2221 revealed the highest amount of DEGs with 1044 upregulated genes and 1586 downregulated genes (Figure 1). In contrast, the rest of the comparisons showed a similar number of DEGs between them. Hi-L2070 was the sample with the lowest number of changes in expressed genes with only 132 upregulated genes and 89 downregulated genes, while Hi-L2165 comparison revealed 207 upregulated genes and 202 downregulated genes and Hi-L2255 with 306 and 218, respectively (Figure 1). Globally, there were a similar number of genes up- and downregulated in all the infected host THP-1 cells, with exception of Hi-L2221, which showed 4-fold more downregulated DEGs than the other three infected host cells with TF lines. After Leishmania infection, it has been described that there is a strong regulation of host gene expression, presenting a similar number of DEGs between the different Leishmania lines employed.20,23
Figure 1.

Transcriptome profiles of THP-1 cells infected with different L. infantum lines. Differential gene expression profiles are presented as the numbers of upregulated (black) and downregulated (dark gray) transcripts after comparisons of the different infected cell lines vs non-infected cells (the unspecific phagocytosis background has been subtracted previously). The data are from three independent biological replicates, considering a fold change ≥ 2 and an FDR value ≤ 0.05.
This study agrees with the more recent reports showing similar numbers of genes induced and repressed following infection by clinical isolates of L. infantum lines, with the exception of Hi-L2221.11,14,15 An interesting observation was the high number of DEGs in Hi-L2221 versus the other infected host cells; these results could be due to a need for a strong modulation of the host cells by these parasites, allowing the survival to the stress of the intracellular environment and the escape from the defense of the immune system of patients contributing to the TF.
We generated volcano plots comparing the fold changes in expression (Log2) with the corresponding adjusted p-values (−log10) (Figure 2); the results show the gene expression profile subtracting the statistical non-significant genes of host cells infected with different clinical isolates of L. infantum lines. We indicated the DEGs with the highest Log2 fold change as well as the genes involved in the most relevant functions in the host cells (Figure 2).
Figure 2.

Volcano plots from RNAseq data of THP-1 cells infected with different L. infantum lines. The log2FC is plotted on the x-axis, and the negative log10FDR (adjusted p-value) is plotted on the y-axis. The represented genes have an FDR lower than 0.05. Some relevant DEGs are indicated with an arrow.
To obtain a deeper insight into the biological processes of up- and downregulated DEGs, we performed GO term enrichment analysis. In this work, we focused on DEGs associated with biological process categories mainly related to the ability of the parasite to evade the host cell defense mechanisms. Secondarily, we have studied categories involved in the metabolism, autophagy, transmembrane transport, and the lipid metabolism. According to the above, the significantly enriched routes that belong to the host immune system and present in most of the different lines were associated to processes as “inflammatory response” (305 DEGs in Hi-L2221, 182 DEGs in Hi-L2165, 162 in Hi-L2255, and 151 in Hi-L2070), “myeloid leukocyte mediated immunity” (333 DEGs in Hi-L2221, 215 DEGs in Hi-L2165, and 192 in Hi-L2255), “regulation of cytokine production” (320 DEGs in Hi-L2221, 172 in Hi-L2255, and 131 DEGs in Hi-L2070), “transmembrane receptor protein tyrosine kinase signaling pathway” (320 in Hi-L2221, 175 DEGs in Hi-L2165, 167 Hi-L2255, and 128 in Hi-L2070), and “response to wounding” (222 in Hi-L2221, 61 DEGs in Hi-L2165, 162 Hi-L2255, and 126 in Hi-L2070). In addition, other significantly enriched routes related with the immune system were “regulation of cell activation”, “regulation of immune effector process”, “chemokine production”, “cellular response to drug”, “cellular response to nitrogen compound”, and “leukocyte proliferation” (Figure 3). Finally, routes related with autophagy, solute transport, and the energetic and oxidative metabolism were found significantly enriched in the host cells infected with the different Leishmania lines: “carbohydrate metabolic process”, “regulation of the lipid metabolic process”, “response to oxidative stress”, “macroautophagy”, “ATP metabolic process”, “apoptotic signaling pathway“, “drug catabolic process”, “ion homeostasis”, “steroid metabolic process”, “lipid transport”, “transferrin transport”, “response to nutrient levels”, “regulation of vesicle-mediated transport”, “generation of precursor metabolites and energy”, “metabolic ion transport”, “organic anion transport” and “electron transport chain”, among others (Figure 3).
Figure 3.

GO term enrichment analysis of DEGs including in the category Biological Processes. Enriched GO terms for most relevant DEGs of lines Hi-L2221, Hi-L2165, Hi-L2070 and Hi-L2255. The number of DEGs is expressed in the x-axis and colors represent the significance level (FDR) of the enrichment.
Based on the results obtained from the analysis of RNA-seq information and volcano plot and according to GO enrichment analysis of the DEGs, we identified in THP-1 cells infected with TF clinical Leishmania isolates the most relevant transcripts: ABCA10, ABCG1, ABCG2, ANO5, AQP9, BDH1, BPHL, COL4A1, CYP19A1, DHDH, DYRK3, FBP1, HMOX1, ME3, PDK4, PLCB1, SLC24A3, SMPDL3A, SUCNR1 and TFRC (Table 2); these DEGs could contribute to TF in patients infected with these L. infantum lines.
Table 2. Profile of DEGs Most Relevant for the THP-1 Modulation after Infection with L. infantum Linesa.
| Gene ID | Description | Function | Hi-L | logFC | FDR value |
|---|---|---|---|---|---|
| ABCG1 | ATP binding, cassette,sub-family G, (WHITE), member, 1 | phospholipid efflux | Hi-L2165 | 1.84 | 5.36 × 10–37 |
| Hi-L2070 | 1.01 | 9.49 × 10⁻¹² | |||
| Hi-L2221 | 1.58 | 2.22 × 10⁻²³ | |||
| Hi-L2255 | 1.87 | 2.46 × 10–47 | |||
| COL4A1 | collagen, type, IV, alpha, 1 | cellular response to the nitrogen compound | Hi-L2221 | 3.01 | 3.50 × 10–129 |
| Hi-L2165 | 2.22 | 9.67 × 10–60 | |||
| Hi-L2255 | 2.62 | 3.01 × 10–89 | |||
| Hi-L2070 | 1.71 | 3.26 × 10⁻³⁵ | |||
| HMOX1 | heme, oxygenase, (decycling), 1 | autophagy | Hi-L2165 | 1.08 | 1.20 × 10–50 |
| Hi-L2070 | 1.08 | 3.41 × 10–69 | |||
| Hi-L2221 | 1.56 | 8.32 × 10–104 | |||
| Hi-L2255 | 1.18 | 4.84 × 10–44 | |||
| PLCB1 | phospholipase, C, beta, 1, (phosphoinositide-specific) | regulation of multiorganism process | Hi-L2165 | –1.39 | 0.00394942 |
| Hi-L2070 | –1.33 | 0.00748531 | |||
| Hi-L2221 | –2.73 | 1.31 × 10⁻⁵ | |||
| Hi-L2255 | –2.05 | 6.76 × 10⁻⁵ | |||
| ANO5 | anoctamin 5 | anion transport | Hi-L2165 | 1.76 | 1.03 × 10⁻⁶ |
| Hi-L2221 | 1.29 | 9.77 × 10⁻⁵ | |||
| Hi-L2255 | 1.50 | 8.51 × 10⁻⁵ | |||
| ABCG2 | ATP binding cassette, sub-family G (WHITE), member 2 | cellular detoxification | Hi-L2221 | 2.12 | 8.78 × 10⁻⁹ |
| Hi-L2255 | 1.33 | 0.002619 | |||
| AQP9 | aquaporin, 9 | cellular response to the organonitrogen compound | Hi-L2165 | 1.40 | 0.00030758 |
| Hi-L2221 | 2.43 | 6.95 × 10⁻¹⁴ | |||
| CYP19A1 | cytochrome P450, family 19,sub-family A, polypeptide 1 | drug metabolism, sterol metabolic process, electron transport chain, lipid transport, and inflammatory response | Hi-L2221 | 2.78 | 4.09 × 10–53 |
| Hi-L2255 | 1.67 | 2.10 × 10⁻¹⁷ | |||
| DHDH | dihydrodiol, dehydrogenase, (dimeric) | generation of precursor metabolites and energy and electron transport chain | Hi-L2165 | 2.72 | 9.58 × 10⁻⁵ |
| Hi-L2221 | 3.16 | 4.96 × 10⁻⁶ | |||
| ME3 | malic enzyme 3, NADP(+)-dependent, mitochondrial | pyruvate metabolic process, aerobic respiration, and oxidation–reduction process | Hi-L2165 | 1.20 | 1.60 × 10⁻¹⁸ |
| Hi-L2255 | 1.45 | 7.06 × 10⁻²⁷ | |||
| PDK4 | pyruvate dehydrogenase kinase, isozyme 4 | reactive oxygen species metabolic process and regulation of the lipid biosynthetic process | Hi-L2070 | 1.28 | 3.31 × 10⁻⁷ |
| Hi-L2255 | 1.03 | 9.66 × 10⁻⁵ | |||
| SLC24A3 | solute carrier family 47 (multidrug and toxin extrusion), member 1 | cellular ion homeostasis | Hi-L2070 | –1.50 | 0.02659149 |
| Hi-L2255 | –1.32 | 0.035506 | |||
| SMPDL3A | sphingomyelin phosphodiesterase, acid-like 3A | nucleoside triphosphate metabolic process | Hi-L2221 | 1.28 | 7.46 × 10⁻¹³ |
| Hi-L2255 | 1.27 | 5.98 × 10⁻¹⁶ | |||
| ABCA10 | ATP-binding, cassette, sub-family A, (ABC1), member, 10 | lipid transporter activity | Hi-L2070 | –1.85 | 0.04984293 |
| BPHL | biphenyl hydrolase-like (serine hydrolase) | response to the xenobiotic stimulus | Hi-L2165 | 1.21 | 0.00245215 |
| BDH1 | 3-hydroxybutyrate dehydrogenase, type 1 | drug catabolic process | Hi-L2070 | –1.56 | 3.95 × 10⁻⁹ |
| DYRK3 | dual-specificity, tyrosine-(Y)-phosphorylation, regulated, kinase, 3 | cell cycle G2/M phase transition | Hi-L2221 | 4.49 | 4.05 × 10⁻⁸ |
| FBP1 | fructose-1,6-bisphosphatase 1 | ATP metabolic process | Hi-L2221 | 1.94 | 6.13 × 10⁻³⁰ |
| SUCNR1 | succinate receptor 1 | myeloid cell activation involved in immune response | Hi-L2255 | 1.12 | 4.13 × 10⁻⁷ |
| TFRC | transferrin receptor | cellular response to the drug, positive regulation of apoptotic signaling, viral life cycle, cellular cation homeostasis, and regulation of cell adhesion | Hi-L2255 | 1.04 | 4.42 × 10⁻²⁷ |
GO enrichment analysis and the profiling of DEGs involved in the modulation of THP-1 cells after infection with different L. infantum lines as described in Methods. The analysis was based on log2FC and FDRs. All genes presented in this list are statistically significant with an FDR value ≤ 0.05. Functions assigned correspond with GO sub-categories.
Commonly Host-Modulated Genes by L. infantum Therapeutic Failure Clinical Isolates
In addition to the previous transcriptomic analysis, Venn diagrams were performed in order to group the DEGs shared by the THP-1 cells infected with the four L. infantum lines, excluding the ones present in the host cells infected with reference line Hi-LJPC, uninfected cells, and cells infected with dead parasites as phagocytosis control in order to obtain a reduced and more specific list of DEGs involved in TF. We observed a total of 58 DEGs commonly modulated in Hi-L2221, Hi-L2070, Hi-L2165 and Hi-L2255 lines, including upregulated (log2FC ≥ 1) and downregulated (log2FC ≤ −1) genes (Figure 4). Some functional pathways and their genes of interest were the following: cellular and energy metabolism (ACP5, CTSL, PCLB1), cellular defense response (CCL3, CCR2, COL4A1, HMOX1, PLCB1, SLC24A3, SMPDL3A, TNFRSF25), lipid and cholesterol metabolism and transport (ABCG1, ANO5, FABP5) and transporter activity (ABCG1, SLC1A3, SLC24A3). Afterwards, from the above 58 DEGs commonly modulated in host cells infected with L. infantum lines, we selected four of these genes (ABCG1, ANO5, COL4A1 and HMOX1) as relevant DEGs that could be involved in processes significant for the modulation of host cells in TF patients with leishmaniasis. Analysis of the modulation exerted by each independent line in comparison with the non-infected THP-1 cells revealed 1528 exclusive DEGs in cells infected by the L. infantum L2221 line, 39 DEGs in the case of the L2070 line, 59 DEGs for cells infected by the L. infantum L2165 line, and 69 DEGs in the case of L2255 (Figure 4).
Figure 4.

Venn diagram analysis of DEGs in THP-1 cells in response to infection with L2221, L2070, L2165, and L2255 L. infantum lines. Venn diagram of the total upregulated and downregulated DEGs with Log2FC ≥ 1 and Log2FC ≤ −1, respectively. The number of exclusive and common genes for each comparison are shown.
Analysis of Relevant Genes Selected for Validation
Taking into consideration the RNAseq analysis described in this article, we decided to select the most relevant DEGs for further validation, according to their possible contribution to the TF observed in patients infected with the different Leishmania lines. In this way, we classified them in four categories according to their function (Table 3). The first one grouped the genes ABCG2 and AQP9 involved in protection against xenobiotics and pathogens as well as transport across membranes. ATP-binding cassette transporters such as ABCG2 comprise a large superfamily of transmembrane proteins implicated in drug extrusion across membranes. They play a relevant role in the development of resistance, decreasing the intracellular concentration of drugs.24,25 In fact, the L2221 line showed resistance to SbIII in the amastigote forms. In a similar way, changes in the expression of AQP9 have been associated with drug resistance in malignant cells.26 Additionally, it transports glycerol, urea, and non-charged solutes, which can trigger the alteration of the osmotic permeability. Also, it has been proposed that one of the cellular responses following infection from different microorganisms includes an induction and recruitment of AQPs in order to promote the protection of microorganisms inside the cells.27,28
Table 3. Classification of THP-1 DEGs Selected for qPCR Validationa.
| Category | Gene ID | GO | THP-1 infected lines (log2FC) |
|---|---|---|---|
| Transporter activity, transmembrane movement of substances coupled to ATPase activity, and protection against xenobiotics and pathogens | ABCG2 | GO:1990748 | Hi-L2221 (2.12) |
| GO:0055085 | Hi-L2255 (1.33) | ||
| GO:0042908 | |||
| AQP9 | GO:0006970 | Hi-L2165 (1.40) | |
| GO:0015793 | Hi-L2221 (2.43) | ||
| GO:0015837 | |||
| GO:0046942 | |||
| GO:0007588 | |||
| Lipid and cholesterol metabolism and transport | ABCG1 | GO:0033344 | Hi-L2070 (1.01) |
| GO:0033700 | Hi-L2165 (1.84) | ||
| Hi-L2221 (1.58) | |||
| Hi-L2255 (1.87) | |||
| ANO5 | GO:1902476 | Hi-L2070 (1.49) | |
| GO:0005229 | Hi-L2165 (1.76) | ||
| Hi-L2221 (1.29) | |||
| Hi-L2255 (1.49) | |||
| CYP19A1 | GO:0016125 | Hi-L2221 (2.78) | |
| GO:0006694 | Hi-L2255 (1.67) | ||
| Cellular metabolism | BDH1 | GO:0046951 | Hi-L2070 (−1.56) |
| GO:0046952 | |||
| DHDH | GO:0005975 | Hi-L2165 (2.72) | |
| GO:0022900 | Hi-L2221 (3.15) | ||
| FBP1 | GO:0030388 | Hi-L2221 (1.94) | |
| GO:0005975 | |||
| GO:0006094 | |||
| GO:0035690 | |||
| PDK4 | GO:0006006 | Hi-L2070 (1.27) | |
| GO:0072593 | Hi-L2255 (1.02) | ||
| Cellular defense response and signaling pathway | COL4A1 | GO:0071230 | Hi-L2070 (1.71) |
| GO:0030198 | Hi-L2165 (2.22) | ||
| Hi-L2221 (3.01) | |||
| Hi-L2255 (2.61) | |||
| HMOX1 | GO:0006879 | Hi-L2070 (1.08) | |
| GO:0071243 | Hi-L2165 (1.08) | ||
| Hi-L2221 (1.56) | |||
| Hi-L2255 (1.18) | |||
| SUCNR1 | GO:0002281 | Hi-L2255 (1.11) | |
| GO:0007165 | |||
| GO:0050729 | |||
| GO:0050921 |
The list was prepared with relevant DEGs from the four main functional categories related with modulation of THP-1 cells infected with different clinical isolates of L. infantum. All genes presented in this list are statistical significant with an FDR value ≤ 0.05.
The next group of relevant biological processes was “lipid and cholesterol metabolism and transport”, including the genes ABCG1, ANO5 and CYP19A1. A noticeable function of the ABC transporter ABCG1 is to manage the distribution of sterols from the endoplasmic reticulum.29 Additionally, some authors have exposed the implication of ABCG1 in the regulation of cholesterol efflux and cell autophagy in macrophages during infection of pathogens.30 As for ANO5, it is a calcium-activated chloride channel. Most anoctamins are phospholipid scramblases that facilitate the translocation of phospholipids between the cell membranes altering their physical properties.31 Another selected gene is CYP19A1, which catalyzes several reactions involved in the lipid metabolism and electron transport chain and plays an important role in the metabolism of xenobiotic substances.32
The third category established was “cellular metabolism”, comprising genes with different functions associated with pathogen infection of host cells and defense against drugs. For example, the BDH1 gene plays an important role in the ketone body biosynthetic process and intracellular iron homeostasis. It has been described that endoplasmic reticulum stress and inflammation downregulate the expression of BDH2 in human THP-1 macrophages.33 This appreciation is in accordance with our results since BDH1 is downregulated in host cells infected with the L2070 line. Furthermore, we included in this group DHDH that belongs to the family of dihydrodiol dehydrogenases and is related to the metabolism of xenobiotics and sugars. It is considered by some authors as an anti-oxidation gene associated with drug resistance.34FBP1 is another upregulated gene associated with cellular response to drugs and fructose metabolic processes. It has been hypothesized that FBP1 can cause the dysfunction of natural killer cells during lung cancer progression by weakening their glycolytic metabolism.35
Finally, we have included in the category of cellular metabolism the PDK4 gene, which plays a key role in the regulation of the glucose and fatty acid metabolism. This gene has been established as a marker of enhanced fatty acid oxidation.36 Additionally, it has been described that PDK activity results in the production of several glycolytic intermediates that support pathogen replication through their employment in nucleotide synthesis.37
The last group of relevant biological processes was “cellular defense response and signaling pathway”, comprising COL4A, HMOX1, and SUCNR1 genes. COL4A1 (collagen, type IV, alpha 1) plays a role in the generation of one of the components of type IV collagen, specifically the alpha 1 chain. Thus, it is crucial for the extracellular matrix organization and consequent interaction with nearby cells, allowing differentiation, survival, and establishment of infection.38 In fact, some authors have observed that collagen helps in the invasion and replication of some viruses.39,40 In the same line, it has been reported that expression of the extracellular matrix including laminin and collagens I, III, and IV is upregulated in HIV-1 infection.41 Also included in this category is HMOX1, which, like BDH1, it is involved in cellular iron homeostasis; additionally, it has been reported to be critical against oxidative stress.42 Interesting was that upregulation of HMOX1 promotes persistence of Leishmania infection.43SUCNR1, as well in this category, encodes for a G-protein coupled receptor for succinate. According to some studies, the expression of SUCNR1 is associated with the expression of chemokine and cytokine-related genes, and it is also involved in the infiltration of lymphocytes in ovarian cancer.44
Validation of the DEGs by RT-qPCR
RT-qPCR validation assays were performed on 12 selected genes belonging to different functional categories (ABCG1, ABCG2, ANO5, AQP9, BDH1, COL4A1, CYP19A1, DHDH, FBP1, HMOX1, PDK4 and SUCNR1) from the RNA-seq data in macrophages infected with different TF clinical isolates of L. infantum. To perform the validation, macrophages infected with heat-inactivated parasites and the actin gene ACTB were used as a control and as an internal standard, respectively. The reliability and accuracy of RNA-seq results were validated from the concordance between RNA-Seq and RT-qPCR data in comparative analysis (Figure 5).
Figure 5.

Comparative analysis of the relative expression levels of selected genes determined by RNA-seq (black) and validated by RT-qPCR (dark gray). The bars represent the mean ± SD values of fold-change expression of ABCG1, ABCG2, ANO5, AQP9, BDH1, COL4A1, CYP19A1, DHDH, FBP1, HMOX1, PDK4 and SUCNR1 determined from three independent biological replicates analyzed in triplicate. RT-qPCR expression values of the genes in each line were normalized with the expression of ACTB. The relative expression of each gene was calculated as the fold change between Hi-L2126, Hi-L2221, Hi-L2070, or Hi-L2255 and macrophages infected with heat-inactivated parasites (which was set to 1.0).
Conclusions
In this article, we demonstrate by RNA-Seq that different clinical L. infantum lines from TF patients promoted a different transcriptional response in THP-1 macrophages, which determine distinct behavior of the parasites that probably may account for parasite survival and TF of patients. Among relevant altered functional pathways and genes are the following: cellular and energy metabolism (ACP5, CTSL, PCLB1), cellular defense response (CCL3, CCR2, COL4A1, HMOX1, PLCB1, SLC24A3, SMPDL3A, TNFRSF25), lipid and cholesterol metabolism and transport (ABCG1, ANO5, FABP5) and transporter activity (ABCG1, SLC1A3, SLC24A3). These genes could be considered for a future rational therapeutic strategy for leishmaniasis that could include the combination of canonical anti-leishmanial compounds and host-directed therapy containing molecules interfering with some of these genes/proteins from host cells; this new therapeutic strategy could increase the efficacy of chemotherapy and the life of anti-parasitic drugs and will decrease the TF in patients with leishmaniasis.
Methods
Chemical Compounds
Amphotericin B (AmB), trivalent antimony (SbIII), paromomycin (PMM), Triton X-100, 4′,6-diamidino-2-phenylindole dilactate (DAPI), phorbol 12-myristate 13-acetate (PMA), resazurine, and sodium dodecyl sulfate (SDS) were purchased from Sigma-Aldrich (St. Louis, MO). Miltefosine (Mil) was purchased from Zentaris GmbH (Frankfurt, Germany). l-Glutamine and penicillin/streptomycin were obtained from Gibco. All chemicals were of the highest quality available.
Culture of L. infantum Lines and THP-1 Cells
We used promastigotes of L. infantum lines: (i) JPC-M5 (MCAN/ES/98/LLM-877) (LJPC) as a genomic reference line and (ii) LLM2070, LLM2165, LLM2255, and LLM2221 lines (L2070, L2165, L2255, and L2221), isolated from TF HIV patients with VL and unsuccessfully treated with liposomal AmB (from the WHO Collaborating Center for Leishmaniasis, Instituto de Salud Carlos III; Dr. F. Javier Moreno). All these L. infantum lines were grown at 28 °C in the RPMI 1640-modified medium (Invitrogen) supplemented with 10% hiFBS (Invitrogen), as described.45 Human myelomonocytic cells THP-1 were grown at 37 °C and 5% CO2 in the RPMI-1640 medium supplemented with 10% hiFBS, 2 mM glutamate, 100 U/mL penicillin, and 100 mg/mL streptomycin, as described.46
In Vitro Macrophage Infection
First, THP-1 cells were plated in 25 cm2 flasks at a ratio of 3 × 10⁶ cells or 5 × 10⁵ cells/well in 24-well plates. Then, cells were differentiated to macrophages with 20 ng/mL of PMA treatment for 48 h. Macrophage-differentiated THP-1 cells were infected with different L. infantum promastigotes incubated for 72 h in an acid medium plus 10% hiFBS, optimizing their infection ability, or heat-killed promastigotes (LJPC incubated for 1 h at 65 °C). The macrophage/parasite ratio was 1:10 as described previously.45 After 24 h infection at 35 °C and 5% CO2 in the RPMI 1640 medium plus 5% hiFBS, extracellular parasites were removed by washing three times with PBS (1.2 mM KH2PO4, 8.1 mM Na2HPO4, 130 mM NaCl, 2.6 mM KCl, pH 7) and infected macrophages were maintained in the RPMI 1640 medium plus 10% hiFBS at 37 °C and 5% CO2 for 96 h. Finally, the samples were collected in Qiazol (Qiagen), and total RNA was isolated in the Genomic Unit of GENyO facilities (Granada, Spain). Additionally, to determine the parameters related with infectivity such as the percentage of infection or the number of amastigotes by macrophages and in parallel with the infection assay destined for RNA extraction, macrophages were infected with the same L. infantum lines and treated under the same conditions. Briefly, cells were fixed for 30 min at 4 °C with 2.5% paraformaldehyde in PBS and permeabilized with 0.1% Triton X-100 in PBS for 30 min. Intracellular parasites were nuclear-stained with DAPI (Invitrogen) and detected by fluorescence microscopy. Additionally, we used as controls macrophages that had been allowed to phagocytose heat-killed parasites and uninfected macrophages. In this way, we will identify changes in gene expression that represent a general result of phagocytosis and phagolysosome formation rather than being specific to Leishmania infection. The abbreviations for different infected host cell lines used in this work are the following: (i) Hi-LJPC for THP-1 cells infected with the L. infantum LJPC line, (ii) Hi-L2070 for THP-1 cells infected with the L. infantum LLM-2070 line, (iii) Hi-L2165 for THP-1 cells infected with the L. infantum LLM-2165 line, (iv) Hi-L2255 for THP-1 cells infected with the L. infantum LLM-2255 line, and (v) Hi-L2221 for THP-1 cells infected with the L. infantum LLM-2221 line.
Drug Sensitivity Analysis in Intracellular Amastigotes of L. infantum Lines
Macrophage-differentiated THP-1 cells were plated at a density of 3 × 10⁴ macrophages/well in 96-well plates, infected at a macrophage/parasite ratio of 1:10 with stationary-phase promastigotes of L. infantum isolates, and incubated at 35 °C and 5% CO2 in the RPMI 1640 medium plus 5% hiFBS. 24 h after infection, extracellular parasites were removed by washing three times with PBS buffer. Then, infected macrophages were incubated for 72 h in the RPMI 1640 medium plus 10% hiFBS at 37 °C and 5% CO2 atmosphere, with different concentrations of anti-leishmanial compounds indicated in the text. To determine the susceptibility of L. infantum amastigotes, infected macrophages maintained in 96-well plates were lysed as previously described.47 Finally, the EC50 was determined using the resazurine colorimetric assay.
RNA Isolation and cDNA Library Preparation
RNA samples were extracted using a QIAamp RNA miRNeasy Micro Kit (Qiagen/Qiacube). Three independent biological replicates of the cells infected with different Leishmania lines and controls were collected. Then, samples were treated with a DNase kit and quantified using a Nanodrop One (Thermo Fisher). Quality and quantity checks of RNA samples were performed using a 2100 Bioanalyzer (Agilent Technologies). RNA integrity was evaluated using an Agilent 2100 Bioanalyzer system with an RNA 6000 Nano Lab Chip kit (Agilent Technologies). Poly(A)-enriched cDNA libraries were generated using a TruSeq Stranded mRNA kit (Illumina) and checked for quality and quantity using a 2100 Bioanalyzer and quantitative PCR. All these analyses and sequencing were performed by GENyO facilities (Granada, Spain).
RNA-Seq Data Generation and Pre-processing
The next-generation sequencing run for whole transcriptome sequencing was performed using the paired-end (PE) 2 × 75 bp library on the NextSeq 500 (Illumina, San Diego, CA, USA) platform at GENyO (Granada, Spain) using High Output Kit v2.5 (150 cycles), which generated 14.5 million homogenized reads per sample. Raw data were generated for each of the libraries from the three samples (Table S1). The RNA-seq data are available at NCBI Short Read Archive (SRA) under accession number PRJNA781438.
Data Analysis
For the purpose of analyzing transcriptomic samples, the miARma-Seq pipeline was used.48 This workflow achieves all steps from raw data to the calculation of DEGs. In the first place, the raw data were evaluated with FastQC software to analyze the quality of reads.49 Subsequently, after sample filtering by quality and homogenization of the number of reads per sample using Seqtk software50 (on average 6.8 million), miARma-Seq aligns all sequences using HISAT2,51 resulting in a 80% of properly aligned reads, ranging from 40 to 90% depending on the infection rate. With this aim, we have the protein coding genes from the Homo sapiens Gencode version M26 genome-build: Homo_sapiens. GRCh38 was used as a reference genome.
Differential Expression Analysis
In order to carry out the differential expression analysis, the edgeR package was used.52,53 Low-expressed genes were removed, and the remaining genes were normalized by the trimmed mean of M-values (TMM) method.52 Furthermore, we calculated reads per kilobase per million mapped reads (RPKM) and counts per million (CPM) and log2-counts per million (log-CPM) per gene on each sample.50 In order to determine the replicability of the samples, principal component analysis and hierarchical clustering of normalized samples were used to obtain an overview of the similarity of RNA-sequencing samples.53−55 After that, all samples were analyzed as we do not identify any clear outliers. DEGs comparing the three replicates of TF lines adjusted by control samples were calculated. All genes having an FDR value ≤ 0.05 and a fold change ≥ 2 were marked as DEGs. Log2FC was used to evaluate the significance and the change in expression of a gene respectively between different types of samples.
Enrichment Analysis
The clusterProfiler Bioconductor package56 was used with the aim of identifying differential gene expression effects by carrying out a functional enrichment study. For this purpose, DEGs were compared against all expressed genes in the RNA-seq assay and we obtained GO terms from the Bioconductor H. sapiens database and associated to Entrez gene identifiers in an orgDB R object through the AnnotationForge package to be used with clusterProfiler. Therefore, GO enrichment analysis was calculated for Biological Process.
RT-qPCR Validation
RT-qPCR validation assays were performed using total RNA isolated for a set of selected genes. Reverse transcription was performed using 2 μg of total RNA with a qScript cDNA Synthesis Kit (Quanta Biosciences, Inc.), according to the manufacturer’s instructions. The Primer3 software57 was used to design specific primer pairs, which were utilized to amplify cDNA (Table S2). The efficiency of each primer was determined using standard curves performed with 2-fold serial dilutions of the synthetized cDNA. A CFX96 cycler (BioRad) was used to carry out qPCR analysis, as described previously.58 Data were normalized by actin gene ACTB expression and relative to the control sample (heat-inactivated parasites) using the CFX Manager software with the ΔΔCt method.59,60
Acknowledgments
We thank Dr. F. Javier Moreno from the WHO Collaborating Center for Leishmaniasis, Instituto de Salud Carlos III (ISCIII), for providing the L. infantum lines used in this study. RNA-Seq was carried out at the Genomics core at GENyO (Granada, Spain), whereas all Bioinformatics Analyses were performed at the Instituto de Parasitología y Biomedicina “López-Neyra” (IPBLN-CSIC). This work was supported by Grant RTI2018-097210-B-I00 (F.G.), funded by MCIN/AEI/10.13039/501100011033 and by “ERDF A way of making Europe”.
Supporting Information Available
The Supporting Information is available free of charge at https://pubs.acs.org/doi/10.1021/acsinfecdis.1c00513.
RNA-seq reads of THP-1 cells and primer sequences for RT-qPCR (PDF)
Author Contributions
† A.P-M. and R.G-H. contributed equally to this work.
The authors declare no competing financial interest.
Supplementary Material
References
- Ponte-Sucre A.; Gamarro F.; Dujardin J.-C.; Barrett M. P.; López-Vélez R.; García-Hernández R.; Pountain A. W.; Mwenechanya R.; Papadopoulou B. Drug resistance and treatment failure in leishmaniasis: A 21st century challenge. PLoS Neglected Trop. Dis. 2017, 11, e0006052 10.1371/journal.pntd.0006052. [DOI] [PMC free article] [PubMed] [Google Scholar]
- Alvar J.; Aparicio P.; Aseffa A.; Den Boer M.; Cañavate C.; Dedet J.-P.; Gradoni L.; Ter Horst R.; López-Vélez R.; Moreno J. The relationship between leishmaniasis and AIDS: the second 10 years. Clin. Microbiol. Rev. 2008, 21, 334–359. 10.1128/CMR.00061-07. [DOI] [PMC free article] [PubMed] [Google Scholar]
- Ostyn B.; Hasker E.; Dorlo T. P. C.; Rijal S.; Sundar S.; Dujardin J.-C.; Boelaert M. Failure of miltefosine treatment for visceral leishmaniasis in children and men in South-East Asia. PLoS One 2014, 9, e100220 10.1371/journal.pone.0100220. [DOI] [PMC free article] [PubMed] [Google Scholar]
- Dorlo T. P. C.; Rijal S.; Ostyn B.; de Vries P. J.; Singh R.; Bhattarai N.; Uranw S.; Dujardin J.-C.; Boelaert M.; Beijnen J. H.; Huitema A. D. R. Failure of miltefosine in visceral leishmaniasis is associated with low drug exposure. J. Infect. Dis. 2014, 210, 146–153. 10.1093/infdis/jiu039. [DOI] [PubMed] [Google Scholar]
- Dorlo T. P. C.; Huitema A. D. R.; Beijnen J. H.; de Vries P. J. Optimal dosing of miltefosine in children and adults with visceral leishmaniasis. Antimicrob. Agents Chemother. 2012, 56, 3864–3872. 10.1128/AAC.00292-12. [DOI] [PMC free article] [PubMed] [Google Scholar]
- Vanaerschot M.; Dumetz F.; Roy S.; Ponte-Sucre A.; Arevalo J.; Dujardin J.-C. Treatment failure in leishmaniasis: drug-resistance or another (epi-) phenotype?. Expert Rev. Anti-Infect. Ther. 2014, 12, 937–946. 10.1586/14787210.2014.916614. [DOI] [PubMed] [Google Scholar]
- Gómez M. A.; Navas A.; Márquez R.; Rojas L. J.; Vargas D. A.; Blanco V. M.; Koren R.; Zilberstein D.; Saravia N. G. Leishmania panamensis infection and antimonial drugs modulate expression of macrophage drug transporters and metabolizing enzymes: impact on intracellular parasite survival. J. Antimicrob. Chemother. 2014, 69, 139–149. 10.1093/jac/dkt334. [DOI] [PMC free article] [PubMed] [Google Scholar]
- Mookerjee Basu J.; Mookerjee A.; Banerjee R.; Saha M.; Singh S.; Naskar K.; Tripathy G.; Sinha P. K.; Pandey K.; Sundar S.; Bimal S.; Das P. K.; Choudhuri S. K.; Roy S. Inhibition of ABC transporters abolishes antimony resistance in Leishmania Infection. Antimicrob. Agents Chemother. 2008, 52, 1080–1093. 10.1128/AAC.01196-07. [DOI] [PMC free article] [PubMed] [Google Scholar]
- Carter K. C.; Hutchison S.; Henriquez F. L.; Légaré D.; Ouellette M.; Roberts C. W.; Mullen A. B. Resistance of Leishmania donovani to Sodium Stibogluconate Is Related to the Expression of Host and Parasite γ-Glutamylcysteine Synthetase. Antimicrob. Agents Chemother. 2006, 50, 88–95. 10.1128/AAC.50.1.88-95.2006. [DOI] [PMC free article] [PubMed] [Google Scholar]
- Torraca V.; Masud S.; Spaink H. P.; Meijer A. H. Macrophage-pathogen interactions in infectious diseases: new therapeutic insights from the zebrafish host model. Dis. Models Mech. 2014, 7, 785–797. 10.1242/dmm.015594. [DOI] [PMC free article] [PubMed] [Google Scholar]
- Fernandes M. C.; Dillon L. A. L.; Belew A. T.; Bravo H. C.; Mosser D. M.; El-Sayed N. M. Dual Transcriptome Profiling of Leishmania -Infected Human Macrophages Reveals Distinct Reprogramming Signatures. mBio 2016, 7, e00027-16 10.1128/mBio.00027-16. [DOI] [PMC free article] [PubMed] [Google Scholar]
- Ovalle-Bracho C.; Franco-Muñoz C.; Londoño-Barbosa D.; Restrepo-Montoya D.; Clavijo-Ramírez C. Changes in Macrophage Gene Expression Associated with Leishmania (Viannia) braziliensis Infection. PLoS One 2015, 10, e0128934 10.1371/journal.pone.0128934. [DOI] [PMC free article] [PubMed] [Google Scholar]
- Dogra N.; Warburton C.; McMaster W. R. Leishmania major abrogates gamma interferon-induced gene expression in human macrophages from a global perspective. Infect. Immun. 2007, 75, 3506–3515. 10.1128/IAI.00277-07. [DOI] [PMC free article] [PubMed] [Google Scholar]
- Gregory D. J.; Sladek R.; Olivier M.; Matlashewski G. Comparison of the effects of Leishmania major or Leishmania donovani infection on macrophage gene expression. Infect. Immun. 2008, 76, 1186–1192. 10.1128/IAI.01320-07. [DOI] [PMC free article] [PubMed] [Google Scholar]
- Dillon L. A. L.; Suresh R.; Okrah K.; Corrada Bravo H.; Mosser D. M.; El-Sayed N. M. Simultaneous transcriptional profiling of Leishmania major and its murine macrophage host cell reveals insights into host-pathogen interactions. BMC Genomics 2015, 16, 1108. 10.1186/s12864-015-2237-2. [DOI] [PMC free article] [PubMed] [Google Scholar]
- Shadab M.; Das S.; Banerjee A.; Sinha R.; Asad M.; Kamran M.; Maji M.; Jha B.; Deepthi M.; Kumar M.; Tripathi A.; Kumar B.; Chakrabarti S.; Ali N. RNA-Seq Revealed Expression of Many Novel Genes Associated With Leishmania donovani Persistence and Clearance in the Host Macrophage. Front. Cell. Infect. Microbiol. 2019, 9, 17. 10.3389/fcimb.2019.00017. [DOI] [PMC free article] [PubMed] [Google Scholar]
- Lemaire J.; Mkannez G.; Guerfali F. Z.; Gustin C.; Attia H.; Sghaier R. M.; Dellagi K.; Laouini D.; Renard P.; Renard P. MicroRNA expression profile in human macrophages in response to Leishmania major infection. PLoS Neglected Trop. Dis. 2013, 7, e2478 10.1371/journal.pntd.0002478. [DOI] [PMC free article] [PubMed] [Google Scholar]
- McConville M. J.; Naderer T. Metabolic pathways required for the intracellular survival of Leishmania. Annu. Rev. Microbiol. 2011, 65, 543–561. 10.1146/annurev-micro-090110-102913. [DOI] [PubMed] [Google Scholar]
- Zhang S.; Kim C. C.; Batra S.; McKerrow J. H.; Loke P. Delineation of diverse macrophage activation programs in response to intracellular parasites and cytokines. PLoS Neglected Trop. Dis. 2010, 4, e648 10.1371/journal.pntd.0000648. [DOI] [PMC free article] [PubMed] [Google Scholar]
- Chaussabel D.; Semnani R. T.; McDowell M. A.; Sacks D.; Sher A.; Nutman T. B. Unique gene expression profiles of human macrophages and dendritic cells to phylogenetically distinct parasites. Blood 2003, 102, 672–681. 10.1182/blood-2002-10-3232. [DOI] [PubMed] [Google Scholar]
- Ramírez C.; Díaz-Toro Y.; Tellez J.; Castilho T. M.; Rojas R.; Ettinger N. A.; Tikhonova I.; Alexander N. D.; Valderrama L.; Hager J.; Wilson M. E.; Lin A.; Zhao H.; Saravia N. G.; McMahon-Pratt D. Human macrophage response to L. (Viannia) panamensis: microarray evidence for an early inflammatory response. PLoS Neglected Trop. Dis. 2012, 6, e1866 10.1371/journal.pntd.0001866. [DOI] [PMC free article] [PubMed] [Google Scholar]
- Ritmeijer K.; Dejenie A.; Assefa Y.; Hundie T. B.; Mesure J.; Boots G.; Boer M. d.; Davidson R. N. A comparison of miltefosine and sodium stibogluconate for treatment of visceral leishmaniasis in an Ethiopian population with high prevalence of HIV infection. Clin. Infect. Dis. 2006, 43, 357–364. 10.1086/505217. [DOI] [PubMed] [Google Scholar]
- Rodriguez N. E.; Chang H. K.; Wilson M. E. Novel program of macrophage gene expression induced by phagocytosis of Leishmania chagasi. Infect. Immun. 2004, 72, 2111–2122. 10.1128/IAI.72.4.2111-2122.2004. [DOI] [PMC free article] [PubMed] [Google Scholar]
- Choi Y.; Yu A.-M. ABC transporters in multidrug resistance and pharmacokinetics, and strategies for drug development. Curr. Pharm. Des. 2014, 20, 793–807. 10.2174/138161282005140214165212. [DOI] [PMC free article] [PubMed] [Google Scholar]
- Mo W.; Zhang J. T. Human ABCG2: structure, function, and its role in multidrug resistance. Int. J. Biochem. Mol. Biol. 2012, 3, 1–27. [PMC free article] [PubMed] [Google Scholar]
- Dou R.; Deng Y.; Huang L.; Fu S.; Tan S.; Wang L.; Lian L.; Fang L.; Fan X.; Jin G.; Liu H.; Wang J. Multi-microarray identifies lower AQP9 expression in adjuvant chemotherapy nonresponders with stage III colorectal cancer. Cancer Lett. 2013, 336, 106–113. 10.1016/j.canlet.2013.04.017. [DOI] [PubMed] [Google Scholar]
- Holm A.; Karlsson T.; Vikström E. Pseudomonas aeruginosa lasI/rhlI quorum sensing genes promote phagocytosis and aquaporin 9 redistribution to the leading and trailing regions in macrophages. Front. Microbiol. 2015, 6, 915. 10.3389/fmicb.2015.00915. [DOI] [PMC free article] [PubMed] [Google Scholar]
- Posfai D.; Sylvester K.; Reddy A.; Ganley J. G.; Wirth J.; Cullen Q. E.; Dave T.; Kato N.; Dave S. S.; Derbyshire E. R. Plasmodium parasite exploits host aquaporin-3 during liver stage malaria infection. PLoS Pathog. 2018, 14, e1007057 10.1371/journal.ppat.1007057. [DOI] [PMC free article] [PubMed] [Google Scholar]
- Demina E. P.; Miroshnikova V. V.; Schwarzman A. L. Role of the ABC transporters A1 and G1, key reverse cholesterol transport proteins, in atherosclerosis. Mol. Biol. 2016, 50, 223–230. 10.7868/s002689841602004x. [DOI] [PubMed] [Google Scholar]
- Xu J.; Zhou Y.; Yang Y.; Lv C.; Liu X.; Wang Y. Involvement of ABC-transporters and acyltransferase 1 in intracellular cholesterol-mediated autophagy in bovine alveolar macrophages in response to the Bacillus Calmette-Guerin (BCG) infection. BMC Immunol. 2020, 21, 26. 10.1186/s12865-020-00356-x. [DOI] [PMC free article] [PubMed] [Google Scholar]
- Whitlock J. M.; Hartzell H. C. Anoctamins/TMEM16 Proteins: Chloride Channels Flirting with Lipids and Extracellular Vesicles. Annu. Rev. Physiol. 2017, 79, 119–143. 10.1146/annurev-physiol-022516-034031. [DOI] [PMC free article] [PubMed] [Google Scholar]
- Stavropoulou E.; Pircalabioru G. G.; Bezirtzoglou E. The Role of Cytochromes P450 in Infection. Front. Immunol. 2018, 9, 89. 10.3389/fimmu.2018.00089. [DOI] [PMC free article] [PubMed] [Google Scholar]
- Zughaier S. M.; Stauffer B. B.; McCarty N. A. Inflammation and ER stress downregulate BDH2 expression and dysregulate intracellular iron in macrophages. J. Immunol. Res. 2014, 2014, 140728. 10.1155/2014/140728. [DOI] [PMC free article] [PubMed] [Google Scholar]
- Ueda M.; Hung Y.-C.; Chen J.-T.; Chiou S.-H.; Huang H.-H.; Lin T.-Y.; Terai Y.; Chow K.-C. Infection of human papillomavirus and overexpression of dihydrodiol dehydrogenase in uterine cervical cancer. Gynecol. Oncol. 2006, 102, 173–181. 10.1016/j.ygyno.2005.12.009. [DOI] [PubMed] [Google Scholar]
- Cong J.; Wang X.; Zheng X.; Wang D.; Fu B.; Sun R.; Tian Z.; Wei H. Dysfunction of Natural Killer Cells by FBP1-Induced Inhibition of Glycolysis during Lung Cancer Progression. Cell Metab. 2018, 28, 243–255. 10.1016/j.cmet.2018.06.021. [DOI] [PubMed] [Google Scholar]
- Pettersen I. K. N.; Tusubira D.; Ashrafi H.; Dyrstad S. E.; Hansen L.; Liu X.-Z.; Nilsson L. I. H.; Løvsletten N. G.; Berge K.; Wergedahl H.; Bjørndal B.; Fluge Ø.; Bruland O.; Rustan A. C.; Halberg N.; Røsland G. V.; Berge R. K.; Tronstad K. J. Upregulated PDK4 expression is a sensitive marker of increased fatty acid oxidation. Mitochondrion 2019, 49, 97–110. 10.1016/j.mito.2019.07.009. [DOI] [PubMed] [Google Scholar]
- Jung G.-S.; Jeon J.-H.; Choi Y.-K.; Jang S. Y.; Park S. Y.; Kim S.-W.; Byun J.-K.; Kim M.-K.; Lee S.; Shin E.-C.; Lee I.-K.; Kang Y. N.; Park K.-G. Pyruvate dehydrogenase kinase regulates hepatitis C virus replication. Sci. Rep. 2016, 6, 30846. 10.1038/srep30846. [DOI] [PMC free article] [PubMed] [Google Scholar]
- Singh B.; Fleury C.; Jalalvand F.; Riesbeck K. Human pathogens utilize host extracellular matrix proteins laminin and collagen for adhesion and invasion of the host. FEMS Microbiol. Rev. 2012, 36, 1122–1180. 10.1111/j.1574-6976.2012.00340.x. [DOI] [PubMed] [Google Scholar]
- Chiu W.-L.; Lin C.-L.; Yang M.-H.; Tzou D.-L. M.; Chang W. Vaccinia virus 4c (A26L) protein on intracellular mature virus binds to the extracellular cellular matrix laminin. J. Virol. 2007, 81, 2149–2157. 10.1128/JVI.02302-06. [DOI] [PMC free article] [PubMed] [Google Scholar]
- Guo G.-H.; Tan D.-M.; Zhu P.-A.; Liu F. Hepatitis B virus X protein promotes proliferation and upregulates TGF-beta1 and CTGF in human hepatic stellate cell line, LX-2. Hepatobiliary Pancreatic Dis. Int. 2009, 8, 59–64. [PubMed] [Google Scholar]
- McArthur C. P.; Wang Y.; Heruth D.; Gustafson S. Amplification of extracellular matrix and oncogenes in tat-transfected human salivary gland cell lines with expression of laminin, fibronectin, collagens I, III, IV, c-myc and p53. Arch. Oral Biol. 2001, 46, 545–555. 10.1016/s0003-9969(01)00014-0. [DOI] [PubMed] [Google Scholar]
- El Fadili K.; Imbeault M.; Messier N.; Roy G.; Gourbal B.; Bergeron M.; Tremblay M. J.; Légaré D.; Ouellette M. Modulation of Gene Expression in Human Macrophages Treated with the Anti- Leishmania Pentavalent Antimonial Drug Sodium Stibogluconate. Antimicrob. Agents Chemother. 2008, 52, 526–533. 10.1128/AAC.01183-07. [DOI] [PMC free article] [PubMed] [Google Scholar]
- Saha S.; Basu M.; Guin S.; Gupta P.; Mitterstiller A.-M.; Weiss G.; Jana K.; Ukil A. Leishmania donovani Exploits Macrophage Heme Oxygenase-1 To Neutralize Oxidative Burst and TLR Signaling-Dependent Host Defense. J. Immunol. 2019, 202, 827–840. 10.4049/jimmunol.1800958. [DOI] [PubMed] [Google Scholar]
- Zhang J.; Zhang Q.; Yang Y.; Wang Q. Association Between Succinate Receptor SUCNR1 Expression and Immune Infiltrates in Ovarian Cancer. Front. Mol. Biosci. 2020, 7, 150. 10.3389/fmolb.2020.00150. [DOI] [PMC free article] [PubMed] [Google Scholar]
- Manzano J. I.; Konstantinović J.; Scaccabarozzi D.; Perea A.; Pavić A.; Cavicchini L.; Basilico N.; Gamarro F.; Šolaja B. A. 4-Aminoquinoline-based compounds as antileishmanial agents that inhibit the energy metabolism of Leishmania. Eur. J. Med. Chem. 2019, 180, 28–40. 10.1016/j.ejmech.2019.07.010. [DOI] [PubMed] [Google Scholar]
- Arsène S.; Gómez-Pérez V.; Escarcena R.; Abengózar M. Á.; García-Hernández R.; Nácher-Vázquez M.; San Feliciano A.; Gamarro F.; Rivas L.; Olmo E. D. Imidazo[2,1-a]isoindole scaffold as an uncharted structure active on Leishmania donovani. Eur. J. Med. Chem. 2019, 182, 111568. 10.1016/j.ejmech.2019.111568. [DOI] [PubMed] [Google Scholar]
- Koutsoni O.; Karampetsou K.; Dotsika E. In vitro Screening of Antileishmanial Activity of Natural Product Compounds: Determination of IC50, CC50 and SI Values. Bio-Protoc. 2019, 9, e3410 10.21769/BioProtoc.3410. [DOI] [PMC free article] [PubMed] [Google Scholar]
- Andrés-León E.; Núñez-Torres R.; Rojas A. M. miARma-Seq: a comprehensive tool for miRNA, mRNA and circRNA analysis. Sci. Rep. 2016, 6, 25749. 10.1038/srep25749. [DOI] [PMC free article] [PubMed] [Google Scholar]
- Andrews S. F.; Wilson P. C. The anergic B cell. Blood 2010, 115, 4976–4978. 10.1182/blood-2010-03-276352. [DOI] [PubMed] [Google Scholar]
- Li H.Seqtk: A Fast and Lightweight Tool for Processing FASTA or FASTQ Sequences; MIT, Git Hub, 2013. [Google Scholar]
- Kim D.; Langmead B.; Salzberg S. L. HISAT: a fast spliced aligner with low memory requirements. Nat. Methods 2015, 12, 357–360. 10.1038/nmeth.3317. [DOI] [PMC free article] [PubMed] [Google Scholar]
- Nikolayeva O.; Robinson M. D. edgeR for differential RNA-seq and ChIP-seq analysis: an application to stem cell biology. Methods Mol. Biol. 2014, 1150, 45–79. 10.1007/978-1-4939-0512-6_3. [DOI] [PubMed] [Google Scholar]
- Ritchie M. E.; Phipson B.; Wu D.; Hu Y.; Law C. W.; Shi W.; Smyth G. K. limma powers differential expression analyses for RNA-sequencing and microarray studies. Nucleic Acids Res. 2015, 43, e47 10.1093/nar/gkv007. [DOI] [PMC free article] [PubMed] [Google Scholar]
- Robinson M. D.; Oshlack A. A scaling normalization method for differential expression analysis of RNA-seq data. Genome Biol. 2010, 11, R25. 10.1186/gb-2010-11-3-r25. [DOI] [PMC free article] [PubMed] [Google Scholar]
- Reeb P. D.; Bramardi S. J.; Steibel J. P. Assessing Dissimilarity Measures for Sample-Based Hierarchical Clustering of RNA Sequencing Data Using Plasmode Datasets. PLoS One 2015, 10, e0132310 10.1371/journal.pone.0132310. [DOI] [PMC free article] [PubMed] [Google Scholar]
- Yu G.; Wang L.-G.; Han Y.; He Q.-Y. clusterProfiler: an R package for comparing biological themes among gene clusters. OMICS: J. Integr. Biol. 2012, 16, 284–287. 10.1089/omi.2011.0118. [DOI] [PMC free article] [PubMed] [Google Scholar]
- Untergasser A.; Nijveen H.; Rao X.; Bisseling T.; Geurts R.; Leunissen J. A. M. Primer3Plus, an enhanced web interface to Primer3. Nucleic Acids Res. 2007, 35, W71–W74. Web Server issue 10.1093/nar/gkm306. [DOI] [PMC free article] [PubMed] [Google Scholar]
- Rastrojo A.; García-Hernández R.; Vargas P.; Camacho E.; Corvo L.; Imamura H.; Dujardin J.-C.; Castanys S.; Aguado B.; Gamarro F.; Requena J. M. Genomic and transcriptomic alterations in Leishmania donovani lines experimentally resistant to antileishmanial drugs. Int. J. Parasitol. 2018, 8, 246–264. 10.1016/j.ijpddr.2018.04.002. [DOI] [PMC free article] [PubMed] [Google Scholar]
- Livak K. J.; Schmittgen T. D. Analysis of Relative Gene Expression Data Using Real-Time Quantitative PCR and the 2−ΔΔCT Method. Methods 2001, 25, 402–408. 10.1006/meth.2001.1262. [DOI] [PubMed] [Google Scholar]
- Pfaffl M. W. A new mathematical model for relative quantification in real-time RT-PCR. Nucleic Acids Res. 2001, 29, 45e. 10.1093/nar/29.9.e45. [DOI] [PMC free article] [PubMed] [Google Scholar]
Associated Data
This section collects any data citations, data availability statements, or supplementary materials included in this article.