

Abstract
Asthma has a striking temporal character, in which time-of-day, patient age, and season each influence disease activity. The extent to which rhythms in asthma activity reflect exposure to specific disease triggers remains unclear. In this study, we examined how virus mitigation strategies enacted during the COVID-19 pandemic (“lockdown measures”) affected rhythms in asthma clinical activity in children. To this end, we retrospectively analyzed asthma clinical presentations in children <18 years old to our regional academic medical center, comparing 4 years of medical records prior to COVID-19 lockdown measures to the 12 months immediately after the institution of such measures. We correlated these data to positive viral test results, febrile seizures, and allergic clinical surrogates (allergic reaction visits, and ED antihistamine prescriptions, respectively) over the same timeframe. In the 12 months following the institution of COVID-19 lockdown, positivity rates for common respiratory viruses dropped by 70.2% and ED visits for asthma among children dropped by 62% compared to pre-COVID years. Lockdown suppressed seasonal variation in positive viral tests and asthma ED visits, while diurnal rhythms in asthma visits was unchanged. Asthma seasonality correlated most strongly with rhinovirus positivity both before and after the institution of COVID lockdown measures. Altogether, our data supports a causal role for viruses in driving seasonal variability in asthma exacerbations in children.
Keywords: asthma, COVID-19, viruses, seasonality, biological rhythms
INTRODUCTION
Asthma is a chronic airway disease characterized by reversible airway obstruction, inflammation, and hyper-responsiveness. Disease activity is exacerbated by exposure to inhaled triggers that include allergens, non-specific irritants like cold air, and infectious agents that are most commonly viruses (Yunginger et al., 1992; Holgate et al., 2015; Mims, 2015). One striking feature of asthma is that the disease has a temporal structure, in which time of day, patient age, and season each affect clinical activity. Asthma seasonality is especially evident in children, where the rate of asthma exacerbations predictably increases during the fall and spring and then falls to a nadir in the summer (Silverman et al., 2003; Wisniewski et al., 2016; Won et al., 2016). Asthma seasonality is incompletely understood but is clinically important since it informs clinical decision making and resource allocation. The prevailing theory is that asthma seasonality reflects yearly rhythms in the abundance of asthma triggers (Yunginger et al., 1992; Fleming et al., 2000; Silverman et al., 2003; Fisman, 2012; Wisniewski et al., 2016; Won et al., 2016). However, it is unclear which kinds of asthma triggers drive seasonality since the prevalence of all the cardinal trigger types (allergens, viruses, and cooler air) coincide across much of the year. An ideal experiment to investigate causation would be to mitigate a specific trigger type and then observe how this intervention affects temporal patterns of asthma exacerbations. Recently, such an experiment inadvertently occurred as part of the societal response to COVID-19.
COVID-19 is a pandemic respiratory illness caused by the novel coronavirus SARS-CoV-2. Originally identified in Wuhan, China in 2019, COVID-19 reached the U.S. in February 2020 (Holshue et al., 2020). In the immediate months that followed, U.S. states adopted a variety of “lockdown” measures to slow the spread of COVID-19. These measures included social distancing, face mask requirements, school closures, travel restrictions, and the shutdown of many non-essential businesses (Moreland et al., 2020). While lockdown measures were designed to limit the transmission of SARS-CoV-2, evidence suggests they also reduced the societal burden of common respiratory viruses that can trigger asthma exacerbations (Edwards, 2020). Taking advantage of this “natural experiment”, we examined how the COVID-19 lockdown impacted the seasonality of pediatric asthma exacerbations.
MATERIALS AND METHODS
Setting and Study Design.
We conducted a retrospective, population-based study of asthma clinical presentations to St. Louis Children’s Hospital in Missouri, United States from March 2016 to March 2021. Data were extracted from the electronic medical record (EMR) and included daily rates of Emergency Department (ED) visits, hospitalizations, and pediatric intensive care unit (PICU) admissions for asthma exacerbations. To correlate asthma presentations with allergic burden, we extracted daily numbers of ED visits for allergic reactions and daily antihistamine prescriptions by ED physicians. To correlate asthma presentations with viral burden, we extracted positive virologic results per week obtained via routine care. The standard practice at our institution is to obtain multiplex viral testing on any pediatric patient presenting to the ED with respiratory symptoms or fever, and this diagnostic approach has not changed during the COVID-19 pandemic. As an additional comparison, we extracted daily ED visits for febrile convulsion, a disease strongly associated with viral infection in children (Francis et al., 2016). Our primary goal was to examine seasonal variations in collected clinical and virologic data before and after the COVID-19 lockdown, which officially began in St. Louis on March 23, 2020 (St Louis). Our secondary goal was to examine the degree of covariance across the calendar year between asthma, virus burden, and allergic burden before and after lockdown. This study was approved by the Washington University School of Medicine Human Research Protection Office.
Data Collection.
We collected de-identified EMR data from children 0–18 years old who visited the Washington University St. Louis Children’s Hospital Emergency Department (ED) or who were hospitalized with a chief diagnosis of asthma from March 14, 2016 to March 29, 2021. As correlates of allergy clinical activity in the ED, we extracted daily rates of ED presentation for allergic reactions and ED prescriptions for antihistamines. We further extracted data on aeroallergen counts for our region (outdoor pollen and mold) published by the St. Louis County Pollen and Mold Center (available at https://pollenandmold.stlouisco.com/). As a clinical correlate of viral burden in young children, we examined ED presentations of febrile seizures over the same time period. Data fields collected included ICD9/10 codes (Table S1), date of encounter, time of encounter, and age of patient at encounter. To examine respiratory viral burden, we obtained weekly tallies of virus identifications by the St. Louis Children’s Hospital Microbiology Laboratory from March 2016 to March 2021. See Table S2 for a list of virologic assays. All EMR data fitting the a priori defined ICD9/10 codes were included in the analysis.
Season Definitions.
We defined the span of seasons as: Fall, September 22 – December 21; Winter, December 22 – March 20; Spring, March 21 – June 20; and Summer: June 21 – September 21. Since lockdown measures officially began on March 23, 2020 in our region(St Louis), the beginning of lockdown measures roughly coincided with the beginning of spring in that year. Since the 12-month observation window available to us after COVID-lockdown ran from March to March, we defined each preceding 12 month period before lockdown as a “year” for the purpose of comparison.
Statistics and Time Series Analysis.
We performed all statistical analyses using SPSS version 27 and R version 3.2.1. Data used for analyses included 12,678 ED visits for asthma, 2,554 hospitalizations for asthma, 1,413 ED visits for allergic reaction, 1,416 ED visits for febrile seizures and 13,005 antihistamine prescriptions by ED physicians.
For detecting biological rhythms, we employed two independent statistical approaches. In the first approach we employed JTK-CYCLE, a non-parametric algorithm popularized for circadian time series analysis(Hughes et al., 2010). Code for JTK cycle is available at dhttps://openwetware.org/wiki/HughesLab:JTK_Cycle. In addition to determining statistical significance, JTK-CYCLE returns best fit rhythm parameters for periodicity, phase and amplitude. For all analyses using JTK-CYCLE, we employed data tallied weekly. For detecting seasonal rhythms, we programmed JTK-CYCLE to evaluate period durations over a deliberately broad interval of 4–56 weeks to bias against statistically forcing a seasonal fit to the data. In a similar vein, we set JTK cycle to evaluate period durations from 10–24 hours to detect diurnal rhythms.
For an independent statistical approach, we constructed an additive generalized linear regression model similar to Friger et al. that allowed us to examine seasonal, weekly, and daily variations as well as the robustness of periodicity (Friger et al., 2009). Briefly, composition of the time series was the sum of the three components: trend, periodicity and ‘white noise’. We modeled the trend of time series, Yt, by polynomial regression, and the trend, Tr (Yt) as:
where t is a time variable, and α represents a constant for each rhythm in the analysis. To represent the periodic component of the time series, we employed a cosinor regression model, which is a pair of sine and cosine functions representing different cycles in a form known as a Fourier series:
where k is a number of considered cycles, t is a time variable (in days), and ωi denotes frequency of the periodic oscillation with period Ti days: ωi = 2π/Ti (I = 1, 2, 3…k). Our strategy was to test the significance of the following a priori hypothesized cycles: year, half-year, season, month, lunar month, week, and daily (diurnal). The time series was represented as:
where ϵt is ‘white noise’. We performed this time series approach using Generalized Linear Model regressions (negative binomial model) from the Gaussian and/or Poisson families. The lowest p-value returned by cosinor regression for the sine and cosine components of the above equation was taken to represent statistical significance. To correlate between weekly emergency department visits and weekly positive viral results, we used a non-parametric Spearman correlation. We considered p-values less than 0.05 as statistically significant.
RESULTS
COVID lockdown suppressed common respiratory viruses.
The intended purpose of COVID-19 lockdown measures was to limit the transmission of SARS-CoV-2. To determine how these measures impacted common respiratory viral infection in children, we analyzed viral positivity rates from clinical samples collected at our medical center in the year following lockdown and compared them to rates before lockdown. In the 4 years prior to lockdown, the overall viral positivity rate at our institution was 188.8±125.1/week (mean ± SE) and displayed a significant seasonal pattern (Figs. 1A, B; Tables 1 and S3). For all viral species assayed as part of routine care at our institution we detected significant annual or semiannual periodicity in positive tests (Fig. S1 and Table S3). In the year following the institution of COVID lockdown measures, viral positivity rates fell to 56.2 ± 36.5/week (mean ± SE), representing a 70.2% decline compared to pre-lockdown years (Figs. 1A, B, and Table 1). Lockdown blunted seasonal rhythms in aggregate viral positivity and specifically ablated the expected winter peaks in influenza, respiratory syncytial virus (RSV), parainfluenza, conventional coronaviruses, and metapneumovirus positive tests (Figs. 1B and S1; Table S3). In contrast, positivity rates for RV and adenovirus fell abruptly immediately following lockdown and then recovered, albeit to a lesser extent than pre-COVID years (Fig. S1A, E). An indirect clinical correlate of viral burden in pediatric populations is childhood febrile seizures, which are typically triggered by infection (Francis et al., 2016). ED presentations for febrile seizures declined from 6.1 ± 3.3/week before COVID lockdown to 1.3 ± 1.2/week after lockdown (mean ± SE), representing a 78.7% decline (Table 1). Additionally, seasonal rhythms in ED visits for febrile seizures were lost in the year after COVID lockdown (Fig. 1C). In contrast to viruses and viral clinical correlates, seasonal variation in pollen and mold levels that can trigger asthma exacerbations was similar before and after lockdown (Fig. 1D). Altogether, COVID-19 lockdown strongly suppressed respiratory viral positivity at our institution and reduced a known complication of viral infection among pediatric patients. Importantly, COVID lockdown also eliminated the expected seasonal patterns in respiratory virus detection.
Figure 1: COIVD-19 lockdown measures suppressed common respiratory viruses in children.
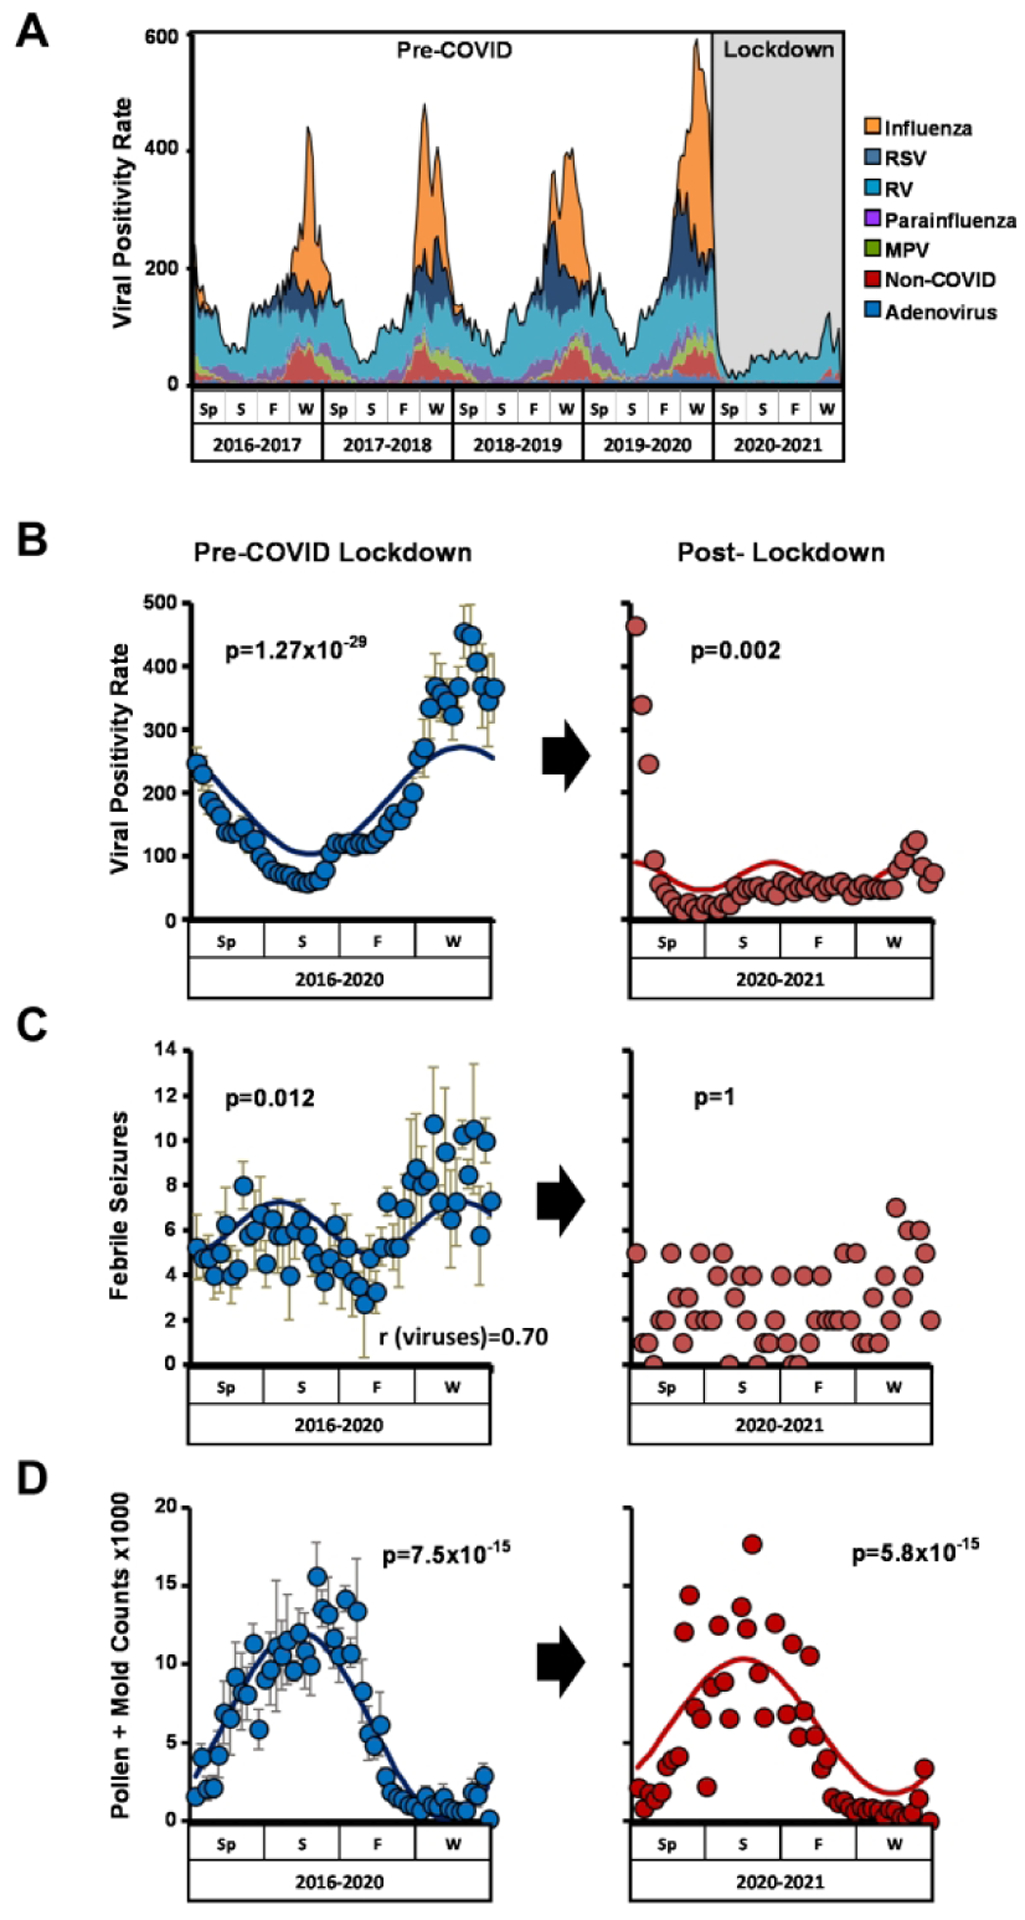
(A) Number of positive viral tests/wk. from Spring 2016 to Spring 2021. (B, C, D) Seasonality of viral positivity rates (B), ED presentations for febrile seizures (C), and aeroallergen (pollen and mold) counts (D) pre- and post-COVID lockdown. Left panels, average rates pre-lockdown from Spring 2016 through Spring 2020 (blue circles, mean ± SE). Right panels, rates post-lockdown from Spring 2020-Spring 2021. JTK Cycle generated p values for seasonality are depicted. Correlation between febrile seizures and viral positivity pre-lockdown is shown in panel (B). Sp= Spring; S=Summer; F=Fall; W=Winter
Table 1:
Weekly rate of positive virologic tests and clinical outcomes
| Virus/Clinical outcome | Pre COVID-19 lockdown | Post COVID-19 lockdown | P |
|---|---|---|---|
| Adenovirus | 8.2±5.1 7 (0–28) |
7±4.4 6 (1–19) |
0.13 |
| Conventional Coronavirus | 14.4±17.8 5 (0–68) |
3.5±6.4 1 (0–33) |
<0.001 |
| Human metapneumovirus | 8.7±9 5 (0–36) |
0.7±3.5 0 (0–24) |
<0.001 |
| Parainfluenza viruses | 14.6±8.3 14 (0–41) |
0.7±1.3 0 (0–5) |
<0.001 |
| Rhino-enterovirus | 71±23.5 68 (28–128) |
41.9±21.4 41.5 (8–104) |
<0.001 |
| Influenza A | 30.1±56.3 2 (0–233) |
0.9±4.8 0 (0–34) |
<0.001 |
| Influenza B | 15.2±35.2 0 (0–206) |
0.3±0.6 0 (0–3) |
<0.001 |
| Total Influenza viruses | 45.3±80.4 2 (0–362) |
1.2±5.2 0 (0–37) |
<0.001 |
| Respiratory Syncytial Virus (RSV) | 26.6±35.7 11 (0–166) |
1.1±2.6 0 (0–16) |
<0.001 |
| Any virus | 188.8±125.1 142 (38–592) |
56.2±36.5 51 (11–246) |
<0.001 |
| ED visits for asthma | 55.2±25 53 (11–153) |
21±7.7 20 (3–41) |
<0.001 |
| Hospital admissions for asthma | 11.3±6.7 10 (0–31) |
3.7±2.4 3 (0–10) |
<0.001 |
| PICU admissions for asthma | 3.9±2.8 3 (0–16) |
0.7±1.4 0 (0–7) |
<0.001 |
| ED visits for allergic reactions | 5.8±5.3 5 (0–36) |
3.6±1.9 4 (0–8) |
0.001 |
| Antihistamine precribed by ED physician | 54±15.4 54 (22–82) |
32.2±11.4 30 (9–61) |
<0.001 |
| ED visits for febrile convulsion | 6.1±3.3 6 (0–18) |
1.3±1.2 2 (0–7) |
<0.001 |
(Mean ± SE, Median and range)
COVID lockdown suppressed asthma seasonality.
In the 4 years prior to lockdown, we detected statistically significant seasonal rhythms in pediatric ED presentations for asthma, regular hospital bed admissions for asthma, and severe asthma requiring admission to the pediatric ICU (Figs. 2A–C; Table S4). With the implementation of COVID lockdown, rates of asthma healthcare utilization dropped sharply, with a 62% decline in asthma ED visits, a 63% decline in hospital admissions, and an 82.1% reduction in PICU admissions during the first 12 months (Table 1). In parallel, seasonal rhythms in asthma presentation were lost in all 3 hospital destinations (Figs. 2A–C). These results were reproducible using independent statistical approaches (by JTK- CYCLE and generalized linear regression, see Methods and Fig. 3). To examine chronological age as a factor in our findings, we stratified our population as either <6 years old, 6–12 years old, or 12–18 years old. In the pre-lockdown period, asthma seasonality was statistically significant in all age groups although the rhythm was more robust in young children compared to adolescents as in previous reports (Figs. 3 and S2)(Silverman et al., 2003; Cohen et al., 2014). After lockdown, asthma seasonality was suppressed in all age brackets.
Figure 2: COVID lockdown suppressed asthma seasonality.

Weekly rates of pediatric asthma ED visits (A), regular hospital admissions (B), PICU admissions (C), and percentage of ED visits resulting in hospital admission (D). Left panels, average rates pre-lockdown from Spring 2016-Spring 2020 (blue circles, mean ± SE). Right panels, rates post-lockdown from Spring 2020-Spring 2021. JTK Cycle generated p values and best fit curves for seasonality are depicted where appropriate. Sp= Spring; S=Summer; F=Fall; W=Winter.
Figure 3: Seasonal rhythm analysis using generalized linear modeling (GLM).

Line graphs depicting incidence rate ratios (IRR) for different clinical events (median ± 95% confidence intervals). In this visualization, statistically significant yearly periodicity (p<0.05, after adjustment for day of the week and calendar season) is signified when the confidence intervals do not cross 1 (dashed vertical line). Blue symbols, averaged Pre-COVID lockdown data from March 2016-March 2020. Red symbols, post-lockdown data collected from March 2020-March 2021. See Methods for a description of our use of GLM for time series analysis.
We considered whether the observed loss of asthma seasonality during lockdown could be due to patient avoidance of EDs. To this end, we examined the proportion of ED presentations for asthma resulting in hospital admission, an indirect reflection of acuity in our study population. We reasoned that if ED avoidance was a significant factor in our data, patients with mild exacerbations would not seek ED care during lockdown and the proportion of hospitalized patients to total ED encounters should rise compared to pre-lockdown levels. However, this metric of asthma acuity remained essentially unchanged (21% ± 12 pre-lockdown vs. 17% ± 10 post-lockdown, p=0.08), and there was no seasonal variation in this variable at any point (Fig. 2D). We concluded that ED avoidance is unlikely to explain the loss of asthma seasonality after COVID lockdown.
Preserved correlation between asthma exacerbations and rhinovirus (RV) seasonality during COVID lockdown.
We asked how COVID lockdown affected previously observed correlations between viral prevalence and asthma exacerbations in children (Kuitunen et al., 2020; Redlberger-Fritz et al., 2021; Sanz-Munoz et al., 2021). In the 4 years prior to lockdown, ED presentations, general hospital admissions, and PICU admissions for asthma correlated most strongly with positivity for rhinoviruses (Tables 2–4). Interestingly, the correlation between RV positivity and asthma ED visits and general hospitalizations remained significant in the year following lockdown despite the loss of seasonality in both events (Tables 2 and 3). In the case of PICU admissions, the correlation between this outcome and RV broke down post-lockdown but it was replaced by a significant correlation to other viruses (Table 4). In contrast, asthma seasonality correlated poorly to pollen counts (Tables 2–4). Interestingly, asthma ED visits did not correlate with rates of COVID-19 positive tests during lockdown (Table 2). These data implicate RV as a specific driver of seasonal variation in asthma exacerbations in children.
Table 2:
Correlation between respiratory viruses, allergic markers and asthma activity (weekly rate of ED visits for asthma)
| Virus | Pre-COVID-19 lockdown | Post-COVID-19 lockdown | ||
|---|---|---|---|---|
| Spearman Correlation Coefficient (R) | P | Spearman Correlation Coefficient (R) | P | |
| Total viral burden | 0.22 | 0.002 | 0.37 | 0.007 |
| Rhinovirus | 0.44 | <0.001 | 0.47 | <0.001 |
| Parainfluenza viruses | 0.11 | 0.11 | −0.12 | 0.39 |
| Human-Meta-Pneumo-virus | 0.1 | 0.17 | −0.2 | 0.16 |
| Respiratory Syncytial Virus (RSV) | 0.08 | 0.27 | −0.33 | 0.02 |
| Total Influenza viruses | 0.11 | 0.12 | −0.24 | 0.09 |
| Coronavirus* | 0.12 | 0.08 | −0.21 | 0.13 |
| Adenovirus | −0.07 | 0.32 | 0.09 | 0.51 |
| SARS-CoV-2 | −0.16 | 0.25 | ||
| Antihistamine prescriptions by ED physicians | −0.06 | 0.36 | 0.24 | 0.08 |
| ED visits for allergic reaction | 0.43 | <0.001 | 0.28 | 0.05 |
| Pollen count | −0.13 | 0.06 | 0.08 | 0.56 |
Table 4:
Correlation between respiratory viruses, allergic markers, and asthma activity (weekly rate of PICU admissions for asthma)
| Virus | Pre-COVID-19 lockdown | Post-COVID-19 lockdown | ||
|---|---|---|---|---|
| Spearman Correlation Coefficient (R) | P | Spearman Correlation Coefficient (R) | P | |
| Total viral burden | 0.02 | 0.79 | −0.06 | 0.69 |
| Rhinovirus | 0.24 | <0.001 | −0.17 | 0.22 |
| Parainfluenza viruses | −0.02 | 0.79 | 0.23 | 0.1 |
| Human-Meta-Pneumo-virus | 0.09 | 0.21 | 0.46 | <0.001 |
| Respiratory Syncytial Virus (RSV) | −0.09 | 0.21 | 0.42 | 0.002 |
| Total Influenza viruses | 0.01 | 0.86 | 0.34 | 0.01 |
| Coronavirus* | −0.37 | 0.6 | 0.29 | 0.03 |
| Adenovirus | 0.001 | 0.99 | 0.14 | 0.31 |
| SARS-CoV-2 | −0.08 | 0.59 | ||
| Antihistamine prescriptions by ED physicians | −0.05 | 0.46 | −0.27 | 0.05 |
| ED visits for allergic reaction | 0.12 | 0.07 | −0.11 | 0.44 |
| Pollen count | 0.06 | 0.36 | −0.18 | 0.21 |
Table 3:
Correlation between respiratory viruses, allergic markers and asthma activity (weekly rate of ED general admissions for asthma)
| Virus | Pre-COVID-19 lockdown | Post-COVID-19 lockdown | ||
|---|---|---|---|---|
| Spearman Correlation Coefficient (R) | P | Spearman Correlation Coefficient (R) | P | |
| Total viral burden | 0.17 | 0.01 | 0.33 | 0.02 |
| Rhinovirus | 0.41 | <0.001 | 0.42 | 0.002 |
| Parainfluenza viruses | −0.05 | 0.44 | 0.004 | 0.98 |
| Human-Meta-Pneumo-virus | 0.11 | 0.11 | −0.36 | 0.01 |
| Respiratory Syncytial Virus (RSV) | 0.11 | 0.1 | −0.39 | 0.004 |
| Total Influenza viruses | 0.06 | 0.37 | −0.18 | 0.2 |
| Coronavirus* | 0.12 | 0.09 | −0.23 | 0.11 |
| Adenovirus | −0.12 | 0.08 | 0.04 | 0.8 |
| SARS-CoV-2 | 0.4 | 0.003 | ||
| Antihistamine prescriptions by ED physicians | 0.08 | 0.27 | 0.24 | 0.08 |
| ED visits for allergic reaction | 0.09 | 0.19 | 0.06 | 0.69 |
| Pollen count | −0.05 | 0.43 | −0.11 | 0.45 |
Effect of lockdown on diurnal and weekly asthma rhythms.
In addition to seasonality, asthma patients exhibit diurnal rhythms in symptoms and in healthcare utilization (Durrington et al., 2018; Wilkinson et al., 2019). We therefore asked whether COVID lockdown measures impacted diurnal rhythms in asthma ED visits. In the 4 years prior to lockdown, we observed a daily rhythm in the hour of ED presentations for asthma with the acrophase occurring at 21:00 (Fig. 4A). Superimposed on the daily rhythm were two local peaks positioned after 07:00 and 19:00, likely reflecting transient case backloads as these are shift-change times in our ED. Interestingly, the diurnal pattern in asthma ED visits remained unchanged after COVID-19 lockdown (Fig. 4A, B). Thus, COVID lockdown measures had a targeted effect on the temporal structure of asthma, impacting seasonality but not diurnal variation. In addition to diurnal rhythms, generalized linear modeling detected a weekly periodicity to asthma ED visits, where asthma presentations peaked on Monday and declined throughout the week (Fig. 4C and Table S5). This weekly component to asthma periodicity was lost after lockdown, perhaps reflecting disrupted school and workday schedules during the first year of COVID-19 (Fig. 4C, D, and Table S5).
Figure 4: Preserved diurnal but not weekly rhythms in ED asthma visits during COVID lockdown.

(A) Frequency of asthma visits binned by hour of ED presentation. Blue circles, pre-COVID lockdown data from 2016–2020 (mean ± SE). Red lines, ED asthma visits in the 12 months post-lockdown. Adjusted p values generated by JTK cycle are depicted. Pearson’s correlation coefficient between pre– and post-COVID data is displayed within each graph. (B) Heat map depicting the Pearson’s correlation matrix for diurnal rhythms in asthma ED visits. Each year represents a 12 month spring-spring interval. (C) Frequency of asthma visits binned by day-of-week of ED presentation. Blue circles, pre-COVID lockdown data from 2016–2020 (mean ± SE). Red lines, ED asthma visits in the 12 months post-lockdown. Significance by One-Way ANOVA is depicted (see also Table S5). (D) Heat map depicting the Pearson’s correlation matrix for weekly rhythms in asthma ED visits. Each year represents a 12 month spring-spring interval.
Effect of lockdown on ED correlates of allergy seasonality.
In the pre-lockdown period, weekly rates of ED antihistamine prescriptions exhibited a low amplitude seasonal rhythm that was significant by both JTK-CYCLE and generalized linear regression analysis (3 and S3). A less robust rhythm in ED visits for allergic reactions was also noted pre-lockdown in that it was statistically significant by only 1 analytical approach (JTK cycle, Figs. 3 and S3). Interestingly, age stratification suggested that seasonal variation for both allergic markers was confined to 0–6 year-old patients (Fig. 3). Post-lockdown, seasonal rhythms in both antihistamine prescriptions and ED visits for allergic reactions were disrupted. However, these allergy surrogates correlated poorly with ED asthma visits (Table 2). We concluded that the disruption in asthma seasonality during lockdown was unlikely to be explained by changes to allergen exposures.
DISCUSSION
Here, we examined how COVID-19 lockdown measures impacted cardinal temporal characteristics of asthma that are especially apparent in children. We show that lockdown suppressed seasonal rhythms in asthma healthcare utilization in parallel with the suppression of common respiratory viral triggers of asthma exacerbations. The temporal impact of lockdown was specific as it did not significantly disrupt diurnal variation in ED asthma presentations, which is thought to reflect intrinsic circadian rhythms in airway caliber and leukocyte trafficking (Nosal et al., 2020; Scheer et al., 2021). Importantly, the significant correlation we observed between RV and asthma exacerbations continued through COVID-19 lockdown despite the loss of seasonal rhythms in both outcomes. Collectively, our data support the idea that viruses and especially RV drive the seasonal character of asthma exacerbations. Our results showing categorical drops in asthma activity and common respiratory viral burden after lockdown are consistent with several recent reports (Taquechel et al., 2020; Sheehan et al., 2021; Simoneau et al., 2021). However, our report is the first examine the effect of lockdown on asthma biological timing.
Asthma seasonality is a well-known phenomenon that some authors have theorized to be driven by respiratory viruses based on correlative data (Yunginger et al., 1992; Fleming et al., 2000; Silverman et al., 2003; Fisman, 2012; Wisniewski et al., 2016; Won et al., 2016), especially rhinoviruses (Gern and Busse, 1999; Kelly and Busse, 2008; Edwards et al., 2017). However, the mechanism responsible for this phenomenon has been a matter of debate because asthma has multiple trigger types that overlap across the year (Fisman, 2012). Moreover, allergens and respiratory viruses converge on similar “type 2” inflammatory pathways within the asthmatic airway, making it difficult to discern the specific cause of an asthma flare based on physical criteria alone. Because COVID lockdown represented an intervention that successfully limited respiratory virus transmission in the community but did not directly affect other trigger types, our data clarifies and lends mechanistic support to the argument for virally driven asthma seasonality. While we did detect seasonal variation in two correlates of allergic healthcare utilization in the pre-lockdown era, these rhythms were not robust in our data and did not correlate temporally to asthma visits. Interestingly, seasonal rhythms in allergic markers were primarily a phenomenon of young children (0–6 years old). One explanation for this is that some ED presentations classified as allergic in nature may in fact be virally mediated since post-viral rashes are common in early childhood. This would explain why virus mitigation measures like lockdown would affect rhythms in generic markers of “allergy”.
As illustrated in our data and those of other reports (Fleming et al., 2000; Sears, 2008), asthma seasonality is not constant throughout childhood but declines as children approach physical maturity. If, as our data suggests, RV is a major driver of asthma seasonality why does this rhythm subside with age when RVs are ubiquitous and able to infect patients of all ages? It is tempting to speculate that host responses to respiratory viruses might change as children age and, as a result, viral triggers may become less efficient at eliciting asthma exacerbations. If true, such a phenomenon would likely be most visible in children with non-atopic asthma since underlying atopy appears to increase susceptibility to respiratory viral infection (Lynch et al., 2016; Mehraj et al., 2016; Ravanetti et al., 2019). In fact, epidemiological studies indicate that atopy negatively predicts asthma remission in children (van den Toorn et al., 2001; De Marco et al., 2002; Vonk et al., 2004; Carpaij et al., 2017; Carpaij et al., 2019). Recently, we found that the traditional age gradient in pediatric asthma exacerbations was suppressed during COVID lockdown (Hazan et al., 2022). More research is needed to examine how age affects host-responses to respiratory viruses, and how this regulates the expression of asthma biological rhythms.
There are some limitations to our study, including its single center, retrospective design. However, our findings of reduced asthma clinical activity and respiratory virus burden after lockdown are consistent with reports originating from other centers (Kuitunen et al., 2020; Taquechel et al., 2020; Redlberger-Fritz et al., 2021; Sanz-Munoz et al., 2021; Simoneau et al., 2021). Our study focuses on ED presentations that are reflective of acute asthma exacerbations, and outpatient asthma activity including patient adherence is beyond the scope of our data. However, recent reports indicate that outpatient encounters for asthma and steroid prescriptions declined during COVID lockdown while self-reported symptom control improved (Rensing et al., 2001; Ferraro et al., 2021; Salciccioli et al., 2021; Shah et al., 2021; Kouis et al., 2022). Therefore, it is unlikely that the loss of seasonality we observed in ED visits for asthma reflects a shifting of clinical activity to an alternative setting. In our analysis of seasonality, we employed unadjusted positive virus tests and clinical encounters since these were used in past studies and represent simple, concrete measurements (Silverman et al., 2003; Wisniewski et al., 2016; Won et al., 2016). These measures do not account for changes in clinical volume that might have occurred during COVID lockdown, but national-level data on viral positivity show that adjusting for clinical volume has little impact on the detection of seasonality (Olsen et al., 2021). Our data assigns asthma clinical activity based on ED physician or admitting physician coding but does not include past medical history or documentation of a prior asthma diagnosis by objective testing. Nevertheless, the seasonal trends in asthma activity in our data prior to COVID-19 mirror previous reports (Fleming et al., 2000; Cohen et al., 2014). Our data cannot by itself distinguish between the avoidance of EDs in the wake of COVID-19 leading to decreased presentations, and a decline in visits due to improved asthma control. However, the fact that the overall acuity of asthma ED visits did not change after lockdown (as reflected by the hospitalization-to-ED visit ratio, Fig. 2D) argues against healthcare avoidance. Finally, it is possible that lockdown led some children to spend less time outdoors, which conceivably could reduce exposure aeroallergens like tree pollen. However, major allergic triggers of asthma like cockroach and dust-mite antigens, as well as potent airway irritants like passive cigarette smoke are more prevalent indoors (Han et al., 2009). Children confined to the home would thus be expected to have increased rather than decreased rates of exacerbations. We conclude that a change in outdoor aeroallergen exposure is unlikely to explain the blunting of asthma exacerbations or seasonal variation we observed during COVID-19 lockdown.
In conclusion, our study of rhythms in asthma healthcare utilization during COVID lockdown supports a causal role for viruses in asthma seasonality. Going forward, additional mechanistic insight will be possible by monitoring asthma clinical activity as lockdown measures are relaxed and common respiratory viruses reassert themselves. Future research will be needed to take advantage of this next natural experiment in asthma pathogenesis
Supplementary Material
ACKNOWLEDGEMENTS
We thank Robyn Puro, Steven Brody, Jeffrey Atkinson, and Gregg Storch for their editorial input. This work was funded by NIH R01 HL135846 and R01 HL152968.
Footnotes
CONFLICT OF INTEREST STATEMENT
The authors have declared that no conflict of interest exists.
This article has an online data supplement.
REFERENCES
- Carpaij OA, Burgess JK, Kerstjens HAM, Nawijn MC, and van den Berge M (2019) A review on the pathophysiology of asthma remission. Pharmacol Ther 201:8–24. [DOI] [PubMed] [Google Scholar]
- Carpaij OA, Nieuwenhuis MAE, Koppelman GH, van den Berge M, Postma DS, and Vonk JM (2017) Childhood factors associated with complete and clinical asthma remission at 25 and 49 years. The European respiratory journal 49. [DOI] [PubMed] [Google Scholar]
- Cohen HA, Blau H, Hoshen M, Batat E, and Balicer RD (2014) Seasonality of asthma: a retrospective population study. Pediatrics 133:e923–932. [DOI] [PubMed] [Google Scholar]
- De Marco R, Locatelli F, Cerveri I, Bugiani M, Marinoni A, Giammanco G, and Italian Study on Asthma in Young Adults study g (2002) Incidence and remission of asthma: a retrospective study on the natural history of asthma in Italy. The Journal of allergy and clinical immunology 110:228–235. [DOI] [PubMed] [Google Scholar]
- Durrington HJ, Gioan-Tavernier GO, Maidstone RJ, Krakowiak K, Loudon ASI, Blaikley JF, Fowler SJ, Singh D, Simpson A, and Ray DW (2018) Time of Day Affects Eosinophil Biomarkers in Asthma: Implications for Diagnosis and Treatment. Am J Respir Crit Care Med 198:1578–1581. [DOI] [PMC free article] [PubMed] [Google Scholar]
- Edwards KM (2020) The Impact of Social Distancing for SARS-CoV-2 on Respiratory Syncytial Virus and Influenza Burden. Clin Infect Dis. [DOI] [PMC free article] [PubMed] [Google Scholar]
- Edwards MR, Strong K, Cameron A, Walton RP, Jackson DJ, and Johnston SL (2017) Viral infections in allergy and immunology: How allergic inflammation influences viral infections and illness. The Journal of allergy and clinical immunology 140:909–920. [DOI] [PMC free article] [PubMed] [Google Scholar]
- Ferraro VA, Zamunaro A, Spaggiari S, Di Riso D, Zanconato S, and Carraro S (2021) Pediatric asthma control during the COVID-19 pandemic. Immun Inflamm Dis 9:561–568. [DOI] [PMC free article] [PubMed] [Google Scholar]
- Fisman D (2012) Seasonality of viral infections: mechanisms and unknowns. Clin Microbiol Infect 18:946–954. [DOI] [PubMed] [Google Scholar]
- Fleming DM, Cross KW, Sunderland R, and Ross AM (2000) Comparison of the seasonal patterns of asthma identified in general practitioner episodes, hospital admissions, and deaths. Thorax 55:662–665. [DOI] [PMC free article] [PubMed] [Google Scholar]
- Francis JR, Richmond P, Robins C, Lindsay K, Levy A, Effler PV, Borland M, and Blyth CC (2016) An observational study of febrile seizures: the importance of viral infection and immunization. BMC Pediatr 16:202. [DOI] [PMC free article] [PubMed] [Google Scholar]
- Friger M, Shoham-Vardi I, and Abu-Saad K (2009) Trends and seasonality in birth frequency: a comparison of Muslim and Jewish populations in southern Israel: daily time series analysis of 200 009 births, 1988–2005. Hum Reprod 24:1492–1500. [DOI] [PubMed] [Google Scholar]
- Gern JE, and Busse WW (1999) Association of rhinovirus infections with asthma. Clin Microbiol Rev 12:9–18. [DOI] [PMC free article] [PubMed] [Google Scholar]
- Han YY, Lee YL, and Guo YL (2009) Indoor environmental risk factors and seasonal variation of childhood asthma. Pediatric allergy and immunology : official publication of the European Society of Pediatric Allergy and Immunology 20:748–756. [DOI] [PubMed] [Google Scholar]
- Hazan G, Eubanks A, Gierasch C, Atkinson J, Fox C, Hernandez-Leyva A, Rosen A, Kau A, Agapov E, Alexander-Brett J, Steinberg D, Kelley D, White M, Byers D, Wu K, Keeler S, Zhang Y, Koenitzer J, Holtzman M, and Haspel J (2022) Age-Dependent Reduction in Asthmatic Pathology through Reprogramming of Postviral Inflammatory Responses. Journal of Immunology 208:1–16. [DOI] [PMC free article] [PubMed] [Google Scholar]
- Holgate ST, Wenzel S, Postma DS, Weiss ST, Renz H, and Sly PD (2015) Asthma. Nat Rev Dis Primers 1:15025. [DOI] [PMC free article] [PubMed] [Google Scholar]
- Holshue ML, DeBolt C, Lindquist S, Lofy KH, Wiesman J, Bruce H, Spitters C, Ericson K, Wilkerson S, Tural A, Diaz G, Cohn A, Fox L, Patel A, Gerber SI, Kim L, Tong S, Lu X, Lindstrom S, Pallansch MA, Weldon WC, Biggs HM, Uyeki TM, Pillai SK, and Washington State -nCo VCIT (2020) First Case of 2019 Novel Coronavirus in the United States. The New England journal of medicine 382:929–936. [DOI] [PMC free article] [PubMed] [Google Scholar]
- Hughes ME, Hogenesch JB, and Kornacker K (2010) JTK_CYCLE: an efficient nonparametric algorithm for detecting rhythmic components in genome-scale data sets. Journal of biological rhythms 25:372–380. [DOI] [PMC free article] [PubMed] [Google Scholar]
- Kelly JT, and Busse WW (2008) Host immune responses to rhinovirus: mechanisms in asthma. The Journal of allergy and clinical immunology 122:671–682. [DOI] [PMC free article] [PubMed] [Google Scholar]
- Kouis P, Michaelidou E, Kinni P, Michanikou A, Anagnostopoulou P, Dimitriou H, Karanicolas K, Matthaiou AM, Achilleos S, Papatheodorou SI, Koutrakis P, Middleton N, Galanakis E, and Yiallouros PK (2022) Pediatric asthma symptom control during lockdown for the COVID-19 pandemic in Spring 2020: A prospective community-based study in Cyprus and Greece. Pediatric pulmonology 57:386–394. [DOI] [PubMed] [Google Scholar]
- Kuitunen I, Artama M, Makela L, Backman K, Heiskanen-Kosma T, and Renko M (2020) Effect of Social Distancing Due to the COVID-19 Pandemic on the Incidence of Viral Respiratory Tract Infections in Children in Finland During Early 2020. Pediatr Infect Dis J 39:e423–e427. [DOI] [PubMed] [Google Scholar]
- Lynch JP, Werder RB, Simpson J, Loh Z, Zhang V, Haque A, Spann K, Sly PD, Mazzone SB, Upham JW, and Phipps S (2016) Aeroallergen-induced IL-33 predisposes to respiratory virus-induced asthma by dampening antiviral immunity. The Journal of allergy and clinical immunology 138:1326–1337. [DOI] [PubMed] [Google Scholar]
- Mehraj V, Ponte R, and Routy JP (2016) The Dynamic Role of the IL-33/ST2 Axis in Chronic Viral-infections: Alarming and Adjuvanting the Immune Response. EBioMedicine 9:37–44. [DOI] [PMC free article] [PubMed] [Google Scholar]
- Mims JW (2015) Asthma: definitions and pathophysiology. Int Forum Allergy Rhinol 5 Suppl 1:S2–6. [DOI] [PubMed] [Google Scholar]
- Moreland A, Herlihy C, Tynan MA, Sunshine G, McCord RF, Hilton C, Poovey J, Werner AK, Jones CD, Fulmer EB, Gundlapalli AV, Strosnider H, Potvien A, Garcia MC, Honeycutt S, Baldwin G, Program CDCPHL, and Cdc Covid-19 Response Team MPAU (2020) Timing of State and Territorial COVID-19 Stay-at-Home Orders and Changes in Population Movement - United States, March 1-May 31, 2020. MMWR Morb Mortal Wkly Rep 69:1198–1203. [DOI] [PMC free article] [PubMed] [Google Scholar]
- Nosal C, Ehlers A, and Haspel JA (2020) Why Lungs Keep Time: Circadian Rhythms and Lung Immunity. Annu Rev Physiol 82:391–412. [DOI] [PMC free article] [PubMed] [Google Scholar]
- Olsen SJ, Winn AK, Budd AP, Prill MM, Steel J, Midgley CM, Kniss K, Burns ER, Rowe A, Foust A, Jasso G, Merced-Morales A, Davis CT, Jang JE, Jones CD, Daly P, Gubareva L, Barnes J, Kondor R, Sessions W, Wentworth DE, Garg S, Havers FP, Fry AM, Hall AJ, Brammer L, and Silk BJ (2021) Changes in Influenza and Other Respiratory Virus Activity During the COVID-19 Pandemic — United States, 2020–2021. MMWR Morb Mortal Wkly Rep 70:1013–1101. [DOI] [PMC free article] [PubMed] [Google Scholar]
- Ravanetti L, Dijkhuis A, Dekker T, Sabogal Pineros YS, Ravi A, Dierdorp BS, Erjefält JS, Mori M, Pavlidis S, Adcock IM, Rao NL, and Lutter R (2019) IL-33 drives influenza-induced asthma exacerbations by halting innate and adaptive antiviral immunity. The Journal of allergy and clinical immunology 143:1355–1370.e1316. [DOI] [PubMed] [Google Scholar]
- Redlberger-Fritz M, Kundi M, Aberle SW, and Puchhammer-Stockl E (2021) Significant impact of nationwide SARS-CoV-2 lockdown measures on the circulation of other respiratory virus infections in Austria. J Clin Virol 137:104795. [DOI] [PMC free article] [PubMed] [Google Scholar]
- Rensing L, Meyer-Grahle U, and Ruoff P (2001) Biological timing and the clock metaphor: oscillatory and hourglass mechanisms. Chronobiology international 18:329–369. [DOI] [PubMed] [Google Scholar]
- Salciccioli JD, She L, Tulchinsky A, Rockhold F, Cardet JC, and Israel E (2021) Effect of COVID-19 on asthma exacerbation. J Allergy Clin Immunol Pract 9:2896–2899.e2891. [DOI] [PMC free article] [PubMed] [Google Scholar]
- Sanz-Munoz I, Tamames-Gomez S, Castrodeza-Sanz J, Eiros-Bouza JM, and de Lejarazu-Leonardo RO (2021) Social Distancing, Lockdown and the Wide Use of Mask; A Magic Solution or a Double-Edged Sword for Respiratory Viruses Epidemiology? Vaccines (Basel) 9. [DOI] [PMC free article] [PubMed] [Google Scholar]
- Scheer F, Hilton MF, Evoniuk HL, Shiels SA, Malhotra A, Sugarbaker R, Ayers RT, Israel E, Massaro AF, and Shea SA (2021) The endogenous circadian system worsens asthma at night independent of sleep and other daily behavioral or environmental cycles. Proceedings of the National Academy of Sciences of the United States of America 118. [DOI] [PMC free article] [PubMed] [Google Scholar]
- Sears MR (2008) Epidemiology of asthma exacerbations. The Journal of allergy and clinical immunology 122:662–668. [DOI] [PubMed] [Google Scholar]
- Shah SA, Quint JK, Nwaru BI, and Sheikh A (2021) Impact of COVID-19 national lockdown on asthma exacerbations: interrupted time-series analysis of English primary care data. Thorax 76:860–866. [DOI] [PMC free article] [PubMed] [Google Scholar]
- Sheehan WJ, Patel SJ, Margolis RHF, Fox ER, Shelef DQ, Kachroo N, Pillai D, and Teach SJ (2021) Pediatric asthma exacerbations during the COVID-19 pandemic: Absence of the typical fall seasonal spike in Washington, DC. J Allergy Clin Immunol Pract 9:2073–2076. [DOI] [PMC free article] [PubMed] [Google Scholar]
- Silverman RA, Stevenson L, and Hastings HM (2003) Age-related seasonal patterns of emergency department visits for acute asthma in an urban environment. Annals of emergency medicine 42:577–586. [DOI] [PubMed] [Google Scholar]
- Simoneau T, Greco KF, Hammond A, Nelson K, and Gaffin JM (2021) Impact of the COVID-19 Pandemic on Pediatric Emergency Department Use for Asthma. Annals of the American Thoracic Society 18:717–719. [DOI] [PMC free article] [PubMed] [Google Scholar]
- St Louis M, Government COVID-19 Emergency Orders.
- Taquechel K, Diwadkar AR, Sayed S, Dudley JW, Grundmeier RW, Kenyon CC, Henrickson SE, Himes BE, and Hill DA (2020) Pediatric Asthma Health Care Utilization, Viral Testing, and Air Pollution Changes During the COVID-19 Pandemic. J Allergy Clin Immunol Pract 8:3378–3387.e3311. [DOI] [PMC free article] [PubMed] [Google Scholar]
- van den Toorn LM, Overbeek SE, de Jongste JC, Leman K, Hoogsteden HC, and Prins JB (2001) Airway inflammation is present during clinical remission of atopic asthma. American journal of respiratory and critical care medicine 164:2107–2113. [DOI] [PubMed] [Google Scholar]
- Vonk JM, Postma DS, Boezen HM, Grol MH, Schouten JP, Koeter GH, and Gerritsen J (2004) Childhood factors associated with asthma remission after 30 year follow up. Thorax 59:925–929. [DOI] [PMC free article] [PubMed] [Google Scholar]
- Wilkinson M, Maidstone R, Loudon A, Blaikley J, White IR, Singh D, Ray DW, Goodacre R, Fowler SJ, and Durrington HJ (2019) Circadian rhythm of exhaled biomarkers in health and asthma. The European respiratory journal 54. [DOI] [PMC free article] [PubMed] [Google Scholar]
- Wisniewski JA, McLaughlin AP, Stenger PJ, Patrie J, Brown MA, El-Dahr JM, Platts-Mills TA, Byrd NJ, and Heymann PW (2016) A comparison of seasonal trends in asthma exacerbations among children from geographic regions with different climates. Allergy Asthma Proc 37:475–481. [DOI] [PMC free article] [PubMed] [Google Scholar]
- Won YK, Hwang TH, Roh EJ, and Chung EH (2016) Seasonal Patterns of Asthma in Children and Adolescents Presenting at Emergency Departments in Korea. Allergy Asthma Immunol Res 8:223–229. [DOI] [PMC free article] [PubMed] [Google Scholar]
- Yunginger JW, Reed CE, O’Connell EJ, Melton LJ 3rd, O’Fallon WM, and Silverstein MD (1992) A community-based study of the epidemiology of asthma. Incidence rates, 1964–1983. The American review of respiratory disease 146:888–894. [DOI] [PubMed] [Google Scholar]
Associated Data
This section collects any data citations, data availability statements, or supplementary materials included in this article.