

SUMMARY
Abnormal nuclear morphology is a hallmark of malignant cells widely used in cancer diagnosis. Pelger-Huët anomaly (PHA) is a common abnormality of neutrophil nuclear morphology of unknown molecular etiology in myeloid neoplasms (MN). We show that loss of nuclear lamin B1 (LMNB1) encoded on chromosome 5q, frequently deleted in MN, induces defects in nuclear morphology and human hematopoietic stem cell (HSC) function associated with malignancy. LMNB1 deficiency alters genome organization inducing in vitro and in vivo expansion of HSCs, myeloid-biased differentiation with impaired lymphoid commitment, and genome instability due to defective DNA damage repair. Nuclear dysmorphology of neutrophils in MN patients is associated with 5q deletions spanning the LMNB1 locus, and lamin B1 loss is both necessary and sufficient to cause PHA in normal and 5q deleted neutrophils. LMNB1 loss thus causes acquired PHA and links abnormal nuclear morphology with HSC and progenitor cell fate determination via genome organization.
Keywords: Hematopoietic stem and progenitor cells, nuclear morphology, myeloid neoplasms, nuclear lamins, lineage determination, 3D genome, neutrophils, genome instability, 5q deletions
Graphical Abstract

eTOC Blurb
Abnormal nuclear morphology is a hallmark of cancerous cells. Here, Reilly et al. demonstrate that deletion of lamin B1, common in myeloid malignancies, causes acquired Pelger-Huet nuclear anomaly and links aberrant nuclear morphology with HSC fate determination via 3D genome organization.
INTRODUCTION
Hematopoiesis is driven by rare hematopoietic stem cells (HSCs) (Doulatov et al., 2012; Orkin and Zon, 2008). Acquisition of mutations and gene loss or gain due to recurrent cytogenetic abnormalities in HSCs drives progression to myeloid malignancies, including myelodysplastic syndromes (MDS) and acute myeloid leukemias (AML) (Bowman et al., 2018; Sperling et al., 2016). Malignant transformation induces clonal expansion, myeloid-biased differentiation, loss of genome integrity, and other alterations of HSC and progenitor cell (HSPC) function (Bowman et al., 2018; Sperling et al., 2016). Another common consequence of this progression is morphologic dysplasia, a deviation in the appearance of the cells under the microscope from normal (Fischer, 2020). The initial suspicion and primary diagnosis of myeloid malignancies even in the era of genomic medicine, remains centered on the appearance of hematopoietic cells (Arber et al., 2016). Pelger-Huët cells, morphologically abnormal neutrophils with bilobed or unilobed nuclei and coarse clumping of the nuclear chromatin, are a common morphologic change indicative of myeloid neoplasia (Cunningham et al., 2009). However, the etiology of Pelger-Huët and other nuclear anomalies and their relationship to alterations of HSC function in malignant hematopoiesis are unclear.
Lamins are structural proteins that maintain normal morphology of the nuclear envelope and are often dysregulated in cancers (Dechat et al., 2008; Schreiber and Kennedy, 2013). Lamins organize chromatin into perinuclear compartments (termed lamin-associated domains) and regulate diverse biological processes, including gene expression and DNA repair (Karoutas and Akhtar, 2021; van Steensel and Belmont, 2017). The genetic disorders of lamins termed laminopathies and changes in lamin expression have been linked with nuclear morphology and stem cell function in diverse organ systems (Bin Imtiaz et al., 2021; Dechat et al., 2008; Shah et al., 2021). The inherited form of Pelger-Huët anomaly (PHA) is caused by mutations in LBR, which encodes lamin B receptor (Best et al., 2003; Hoffmann et al., 2002). Heterozygous LBR mutations cause a bilobed “dumbbell-shape” nucleus, while homozygous mutations cause a unilobed nucleus (Hoffmann et al., 2002). Acquired PHA or pseudo-PHA is a dysplastic change seen in myeloid malignancies, often in high risk MDS and AML with TP53 mutations (Merlat et al., 1999; Soenen et al., 1998). Notably, somatic mutations in LBR are not described in MDS or AML. The genetic basis of pseudo-PHA and the role of lamins in HSC function and myeloid malignancies are not understood.
The main interaction partner of lamin B receptor, lamin B1/LMNB1, is encoded on the long arm of chromosome 5 (5q) - the most common chromosomal deletion in MDS and AML (Haase et al., 2007). Deletion of 5q (del5q) is sometimes found as an isolated abnormality in MDS associated with good prognosis (Ebert, 2009), but it also occurs in MDS and AML patients with complex cytogenetics who have poor risk and mutations in TP53 (Rucker et al., 2012). While most 5q deletions are large, del5q MDS patients with favorable prognosis have a distinct common deleted region which encodes RPS14, mir-146, CSNK1A, among other key genes (Ebert, 2009; Ebert et al., 2008; Kronke et al., 2015). In contrast, patients with high-risk disease have 5q deletions that center on 5q31 and in most cases also involve the adjacent 5q23.2 region encoding LMNB1 (Ebert, 2009; Horrigan et al., 2000; Lai et al., 2001). LMNB1 knockout mice die shortly after birth and display widespread aneuploidy (Chen et al., 2019; Kim et al., 2011; Vergnes et al., 2004). LMNB1 loss leads to genome instability by impairing nuclear envelope integrity and DNA damage repair (Butin-Israeli et al., 2015; Shimi et al., 2008). LMNB1 levels are decreased in a subset of lung, gut, and colon cancers, and chronic lymphocytic leukemias, often associated with poor prognosis (Broers et al., 1993; Jia et al., 2019; Klymenko et al., 2018; Moss et al., 1999). However, the role of lamin B1 in hematopoiesis and myeloid malignancies has not been investigated.
The frequent gene deletion of LMNB1 in 5q-deleted MDS and AML led us to hypothesize that LMNB1 loss drives both nuclear dysmorphology and functional HSC defects in malignant transformation. Here, we identify LMNB1 as the genetic cause of acquired Pelger-Huët anomaly, and show that LMNB1 loss alters local and global 3D genome organization to induce alterations in human HSC self-renewal, fate determination, and genome stability. LMNB1 deletion thus links aberrant nuclear morphology with dysfunctional hematopoiesis.
RESULTS
Lamin B1 loss promotes self-renewal and myeloid-biased differentiation
The role of lamin B1 in normal hematopoiesis or myeloid malignancies has not been studied. We first defined changes in LMNB1 expression in myeloid malignancies compared to normal HSPCs. LMNB1 mRNA expression was decreased in AML cells (n=442, BeatAML cohort) by 66% compared to normal CD34+ HSPCs and by 46% compared to normal bone marrow mononuclear cells (p<0.0001) (Fig. 1A). LMNB1 mRNA expression was similarly decreased in The Cancer Genome Atlas (TCGA) AML cohort (n = 173) by 52% compared to peripheral blood cells from normal individuals (n = 337) (Fig. S1A). All of the TCGA del5q AML patients (n = 14) had deletions of the LMNB1 locus at 5q23.2 (Fig. S1B), and LMNB1 mRNA expression was decreased 42% in del5q AMLs compared to AMLs without del5q (n = 152) (Fig. S1C). Additionally, karyotype analysis of our institutional cohort of 239 del5q AML patients showed that 83% had deletions of the LMNB1 locus (Fig. S1D,E). AML patients with reduced LMNB1 expression irrespective of del5q status had lower overall survival in the TCGA cohort, with a trend in the BeatAML cohort (Fig. S1F,G). LMNB1 expression is thus decreased in malignant compared to normal hematopoietic cells, and as a consequence of 5q deletions which commonly involve the LMNB1 locus.
Figure 1. Lamin B1 loss promotes self-renewal and myeloid-biased differentiation in vitro.
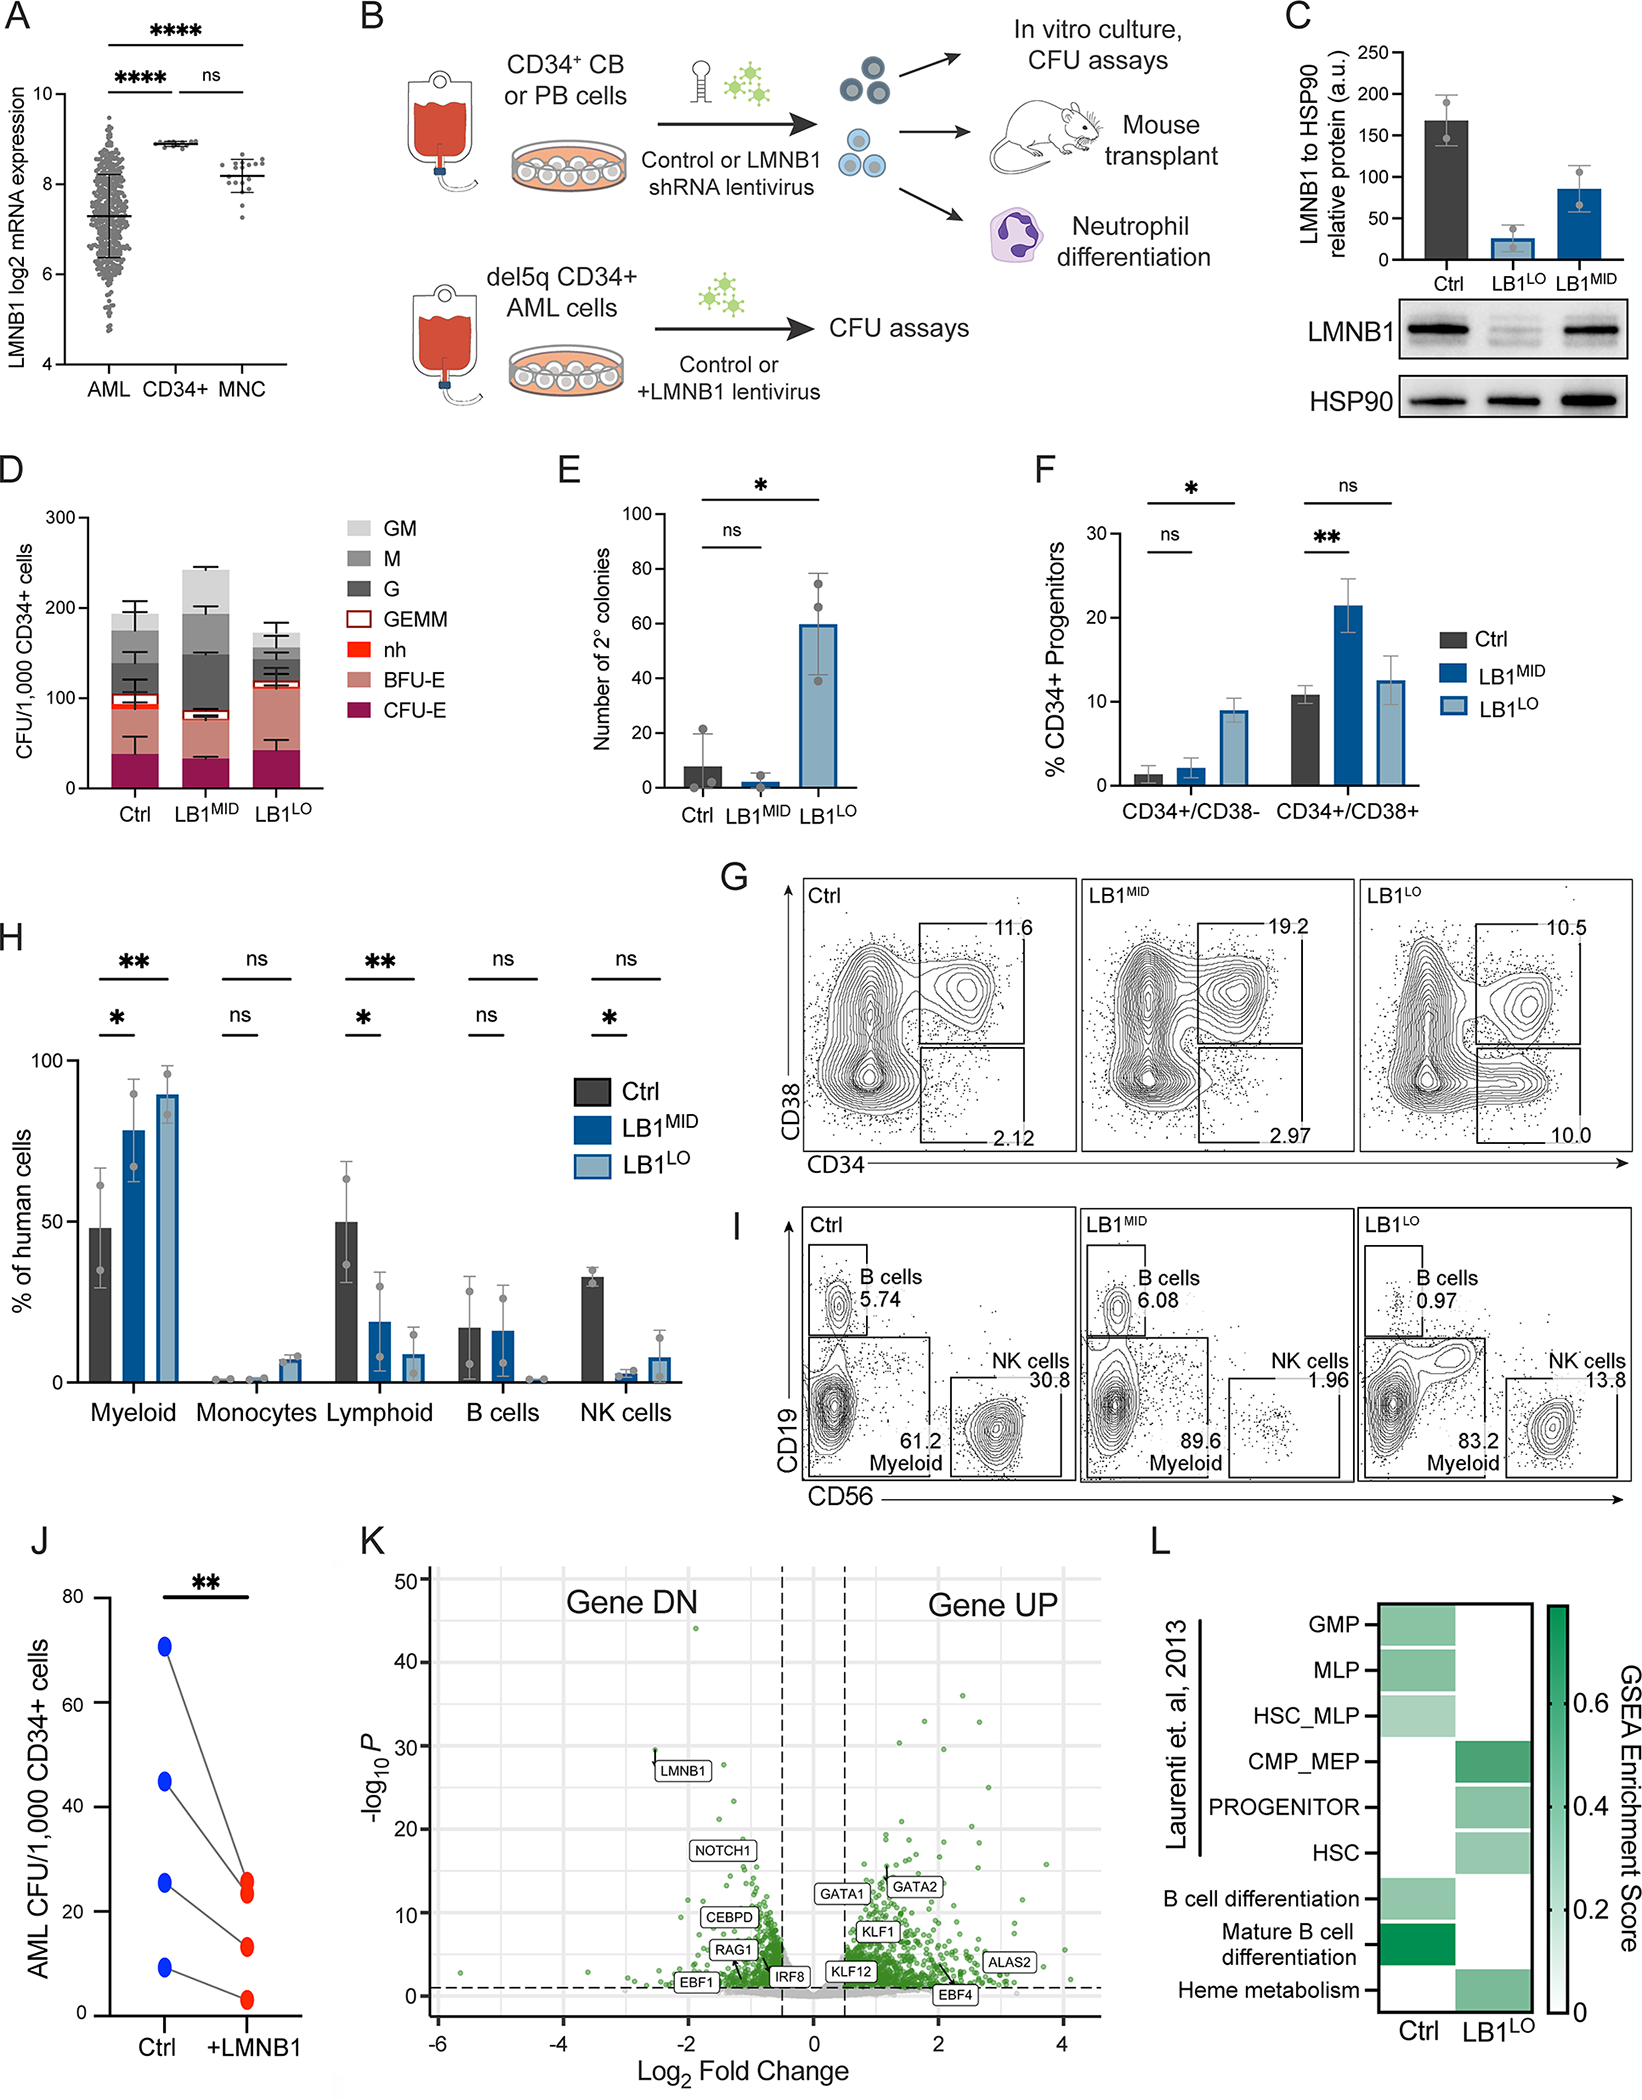
A. LMNB1 mRNA expression (log2 RPKM) in the BeatAML cohort of AML patient samples compared to CD34+ HSPCs or bone marrow mononuclear cells (MNC) from matching healthy controls; n=442 AML samples, 13 CD34+ samples, 19 MNC samples; ****p<0.0001, one-way ANOVA, mean ± SD. B. Schematic of experimental workflow for LMNB1 knockdown in CB or PB CD34+ cells, and LMNB1 ORF expression in del5q CD34+ AML cells. C. Lamin B1 protein expression in PB HSPCs transduced with shRNAs targeting LMNB1 (LB1MID or LB1LO) relative to HSP90 control. Mean ± SD of 2 experiments. D. Colony-forming potential of control, LB1MID or LB1LO CB HSPCs per 1000 CD34+ cells. BFU/CFU-E=erythroid, G=granulocyte, M=macrophage, GEMM=mixed lineage, nh=erythroid not hemoglobinized. Mean ± SD of n=6 and n=2 experiments for LB1LO and LB1MID respectively; groups not statistically different, 2-way ANOVA. E. Number of secondary CFU colonies per 1000 primary CB HSPCs. Mean ± SD of 2–3 experiments, *p=0.011, one-way ANOVA. F,G. Frequency of CD34+ cells after 11 days of culture of control, LB1MID, or LB1LO CB HSPCs. CD34+CD38− = HSCs and multipotent progenitors, CD34+CD38+ = committed progenitors. Quantitation (F) and representative flow plots (G) showing mean ± SD of n=2 experiments, *p=0.016 for LB1LO in CD34+CD38− fraction and **p=0.0034 for LB1MID in CD38+CD38+ fraction, 2-way ANOVA. H,I. Frequency of myeloid cells (CD11b+), or lymphoid NK cells (CD56+) or B cells (CD19+), after 4 weeks of MS-5 stromal co-culture of 500 control, LB1MID, or LB1LO CB HSPCs. Quantitation (H) and representative flow plots (I) showing mean ± SD of n=2 experiments, *p<0.035, **p<0.005 for all comparisons, 2-way ANOVA. J. Colony-forming potential of primary del5q AML cells per 1000 CD34+ cells transduced with control or LMNB1 ORF (+LMNB1) lentivirus. n = 4 AML patient samples, ratio paired t-test, **p=0.0053. K. Volcano plot of differentially expressed genes (DEGs; log2 fold change > 0.5 (UP) or < −0.5 (DN), p<0.01) in control or LB1LO CB HSPCs. L. Enrichment score of human HSC and progenitor gene signatures from (Laurenti et al., 2013) and Hallmark gene sets in GSEA analysis of control versus LB1LO CB HSPCs, FDR q < 0.05 for all. See also Figure S1 and Figure S2.
To probe the effects of decreased LMNB1 expression on hematopoiesis, we first performed lentiviral shRNA knockdown in normal umbilical cord blood (CB) and adult mobilized peripheral blood (PB) CD34+ HSPCs. To model the effects of different gene dosages observed in AML patients, we used two independent LMNB1 shRNAs (shLMNB1) with ~75% knockdown resulting in low LMNB1 transcript and protein expression (termed LB1LO), and ~50% knockdown with intermediate LMNB1 expression (termed LB1MID), as well as a validated control shRNA targeting luciferase (Fig. 1B,C; Fig. S1H). We first measured the clonogenic potential of LMNB1-depleted CB and PB HSPCs in methylcellulose colony-forming assays. LB1LO and LB1MID HSPCs had similar clonogenic potential to controls, and the output of myeloid (CFU-G/M/GM), erythroid (BFU/CFU-E), and mixed lineage (CFU-GEMM) colonies (Fig. 1D; Fig. S1I). However, LB1LO CB and PB HSPCs gained secondary serial replating potential indicative of increased self-renewal (Fig. 1E; Fig. S1J). Consistent with increased self-renewal capacity, LMNB1 knockdown expanded CD34+ HSPCs in liquid culture (Fig. 1F,G; Fig. S1K,L). High level of LMNB1 knockdown expanded the more immature CD34+CD38− fraction (9.0% LB1LO vs 1.4% control), while lower knockdown preferentially expanded CD34+CD38+ progenitors (21.5% LB1MID vs 10.9% control) (Fig. 1F,G; Fig. S1K,L). Although loss of lamin B1 reduces proliferation and induces senescence in several cell types (Shimi et al., 2008), we did not observe changes in cell cycle kinetics (Fig. S2A), senescence-associated β-galactosidase staining (Fig. S2B), or expression of CDKN1A and CDKN2A in CB LB1LO or LB1MID cultures (Fig. S2C). These data show that lamin B1-depleted human CB and adult PB HSPCs have similar myelo-erythroid differentiation potential, but augmented self-renewal capacity.
Since human lymphoid cells do not arise without stromal support, we next cultured CB HSPCs for 4 weeks on MS-5 mouse stromal cells which support the development of human myeloid, B, and NK cells (Yoshikawa et al., 1999). LMNB1 knockdown significantly curtailed lymphoid differentiation (50% control vs less than 20% shLMNB1), while expanding myeloid cells (48% control vs over 78% shLMNB1) (Fig. 1H,I). Both LB1LO and LB1MID HSPCs gave rise to fewer CD56+ NK cells, while LB1LO HSPCs gave rise to fewer NK and CD19+ B cells and expanded CD14+ monocytes/macrophages (Fig. 1H,I; Fig. S2D). Lamin B1-depleted cells proliferated extensively throughout the 4 weeks of co-culture, with no evidence of replicative senescence (Fig. S2E). Taken together, these data suggest that LMNB1 loss promotes HSPC expansion and myeloid lineage bias while curtailing lymphopoiesis, characteristic of malignant transformation. To test the role of LMNB1 loss in malignant transformation, we expressed LMNB1 in primary del5q AML cells, which have a low level of LMNB1 expression (Fig. S1C). LMNB1 overexpression reduced clonogenic potential of del5q CD34+ cells from 4 AML patients (p=0.0053) in colony-forming assays (Fig. 1J). These data suggest that lamin B1 loss maintains leukemic cell growth and self-renewal, consistent with the broad downregulation of LMNB1 in AML (Fig. 1A).
Next, we sought to probe the transcriptional changes that promote self-renewal and myeloid bias induced by lamin B1 loss. Gene set enrichment analysis (GSEA) showed upregulation of HSC-specific and myelo-erythroid progenitor gene signatures in LB1LO HSPCs (Fig. 1K,L). This was accompanied by a suppression of the multi-lymphoid progenitor (MLP) gene signature and reduced expression of NOTCH1 and EBF1, key regulators of B and T cell specification (Fig. 1K,L; Fig. S2F). In contrast, expression of genes important for myeloid and erythroid lineages such as KLF1, GATA1, and GATA2 was upregulated (Fig. 1K,L). Since only high LMNB1 knockdown augmented self-renewal potential, we next compared expression changes in LB1LO vs. LB1MID HSPCs from an independent pool of CB donors. Despite significant overlap, LB1LO HSPCs had more profound changes in gene expression compared to LB1MID HSPCs (Fig. S2G). Notably, LB1LO but not LB1MID HSPCs had a significant enrichment of HSC-specific gene signatures (Fig. S2H) and individual HSC genes, such as EGR3, MEIS1, and SOX8 were induced only in LB1LO HSPCs (Fig. S2I). These data show dose-dependent regulation of lineage-specification and HSC programs by lamin B1 in human HSPCs.
Lamin B1 loss promotes myeloid-biased hematopoietic cell fate in vivo
To test the effect of lamin B1 loss on HSC function and differentiation in vivo, we transplanted LB1LO CB CD34+ HSPCs into immunodeficient NOD-SCIDγcnull (NSG) mice and measured human engraftment in the bone marrow after 14 weeks. Normal human HSC engraftment in NSG mice is lymphoid-biased and consists of ~80% B cells. LMNB1 knockdown HSPCs exhibited lower overall engraftment (5.6% LB1LO vs 26.6% control) (Fig. 2A), with marked reduction in CD19+ B cells and an expansion of CD33+ myeloid cells (Fig. 2B,C). The loss of B cell output correlated with reduced CD34+CD38+CD10+ B/NK-lineage progenitors and CD34+CD19+ pro-B cells, and an increase in myeloid-committed progenitors (Fig. 2D,E). LMNB1 knockdown cells migrated normally from the injected femur to contralateral marrow (Fig. S3A). Despite the lower overall engraftment, mice transplanted with LMNB1-depleted CB HSPCs showed an expanded immature CD34+CD38− compartment, including CD90+CD45RA− HSCs, CD90CD45RA− MPPs, and CD90−CD45RA+ MLP/LMPPs (Fig. 2D,E). These data suggest that loss of lamin B1 both in vitro and in vivo expands phenotypic HSCs, while promoting myeloid-biased differentiation and impairing lymphopoiesis.
Figure 2. Lamin B1 loss promotes myeloid-biased hematopoiesis in vivo.
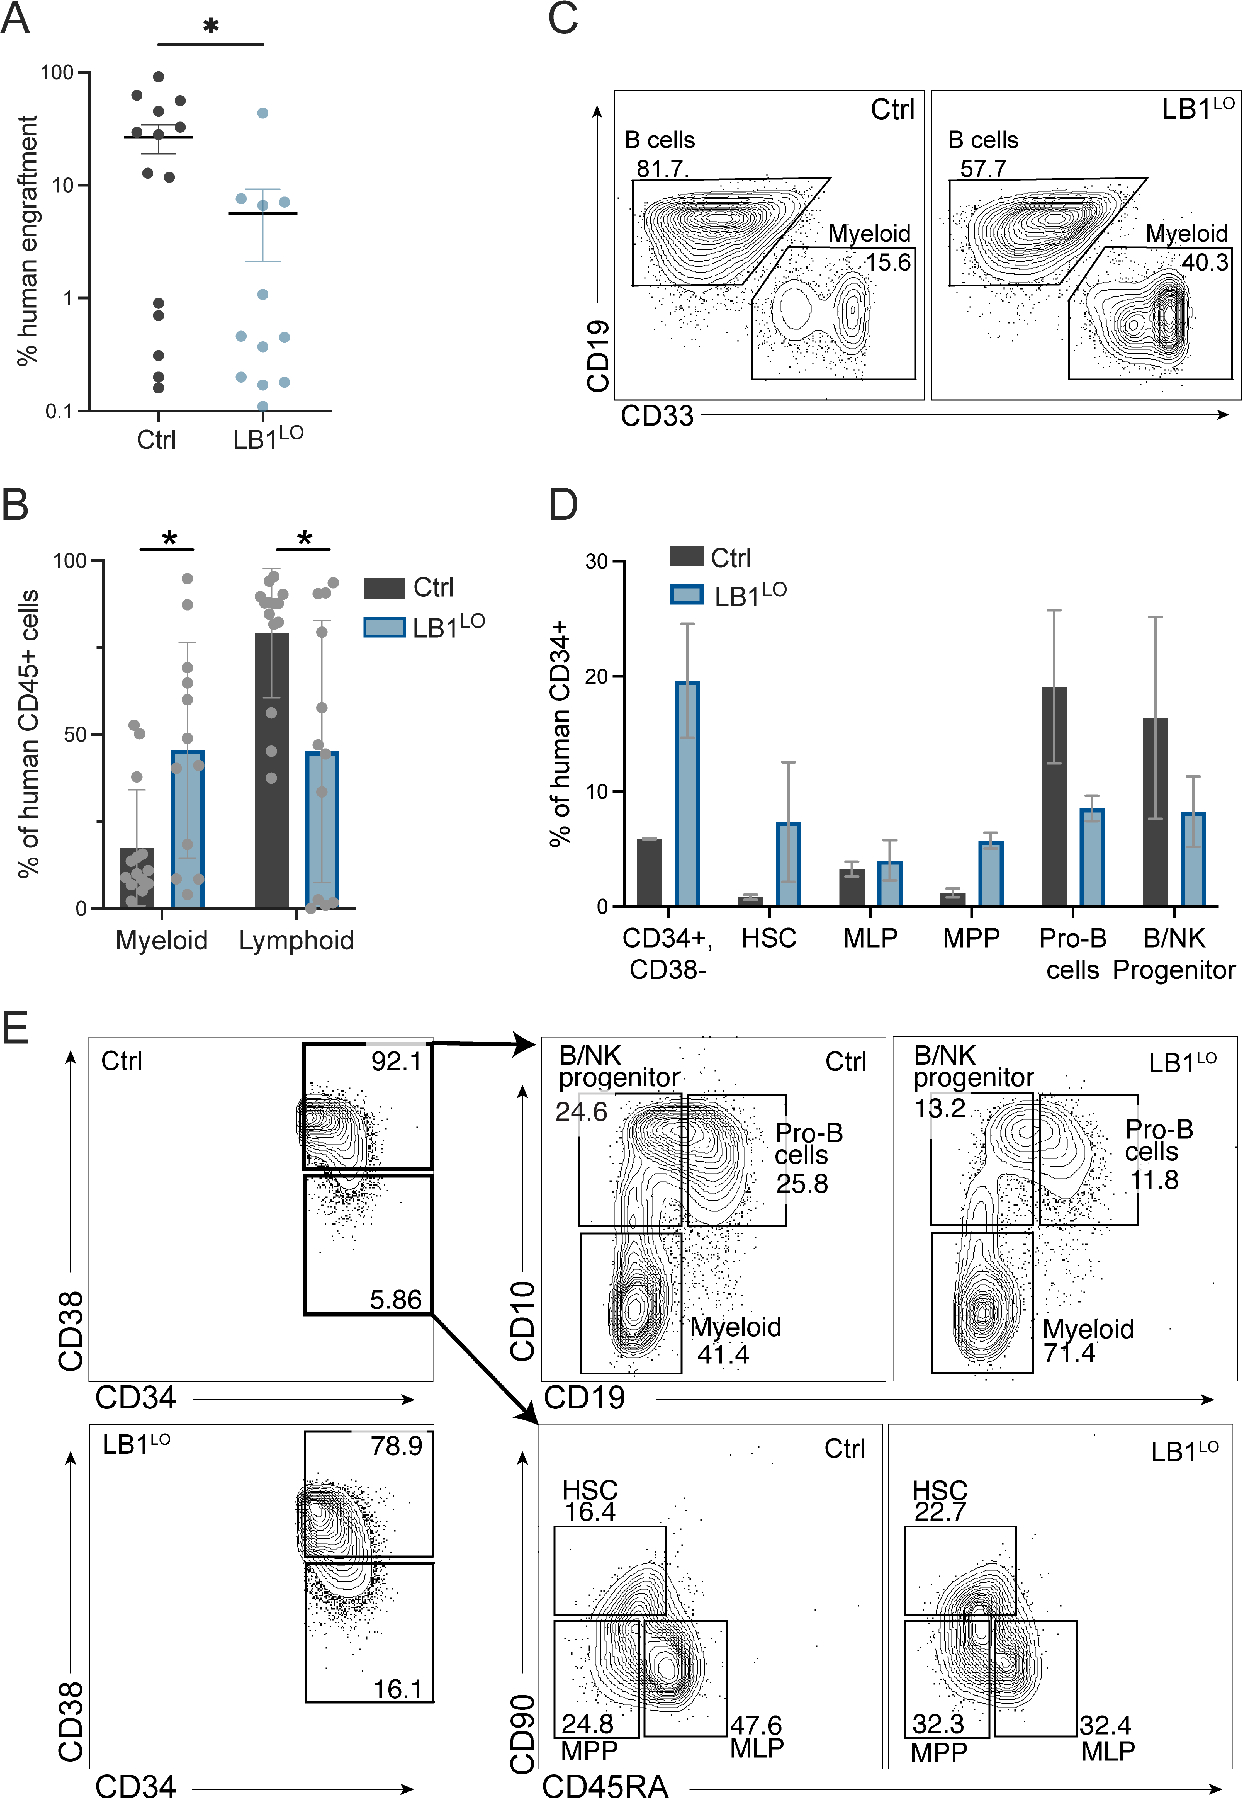
A. Engraftment of control or LB1LO CB HSPCs transplanted into NSG mice. Mice were transplanted for 14 weeks and human cell engraftment was determined as % human CD45+ transduced cells of total bone marrow cells. Mean ± SEM of 2 independent experiments, n=14 mice for control, n=12 mice for LB1LO; *p=0.023, Welch’s t-test. B,C. Frequency of CD33+ myeloid cells and CD19+ B cells as % of human CD45+ cell engraftment. Quantitation (B) and representative flow plots (C) showing mean ± SD of n=2 independent experiments, n=14 mice for control, n=12 mice for LB1LO; *p<0.025 for both groups, Welch’s t-test. D,E. Frequency of human HSPC populations as % of human CD34+ cells 14 weeks post transplant. Mean ± SD of 2 independent experiments, each condition consists of cells pooled from 5 mice of equivalent engraftment. Quantitation (D) and flow cytometric gating strategy (E) as described in (Doulatov et al., 2010).
To better understand how lamin B1 regulates HSC differentiation in vivo, we performed single-cell RNAseq of control and LB1LO CD34+ HSPCs post-transplant. Clustering and pseudotime analysis in Monocle 3 showed myeloid-lymphoid bifurcation from the central cluster expressing HSC markers EVI1 and THY1 (Fig. 3A; Fig. S3B,C). The myeloid trajectory was marked by activation of CEBPA and monocyte (e.g. CSF1R) or neutrophil (e.g. ELANE) lineage markers, and a distinct cluster of GATA1 erythroid precursors; the lymphoid trajectory was marked by induction of EBF1 and B cell markers (e.g. CD19) (Fig. 3B). When examining the trajectory of each cell in our dataset, we observed that the LMNB1-deficient cells were underrepresented in lymphoid trajectory and overrepresented in the myeloid trajectory (Fig. 3A). To validate our clusters, we next annotated progenitors in an unbiased fashion using the SingleR cell annotation package (Aran et al., 2019) using the Atlas of Blood Cells (Xie et al., 2020) data as reference. This analysis identified a central HSC cluster with myeloid (GMP, MDP) and lymphoid (CLP, NKP, pro-B) development proceeding through MLP/LMPP intermediates (Fig. 3C). As expected, lymphoid commitment was predominant for control HSCs. By contrast, LMNB1 deficiency led to a dramatic shift to myelo-erythroid-biased commitment and impaired lymphoid differentiation. Consistent with the immunophenotype data, LMNB1-deficient HSCs and MLP/LMPPs were expanded, with the lymphoid block at the downstream B-NK progenitor stage (Fig. 3D; Fig. S3D). Consistent with the in vitro data, we did not observe changes in cell cycle or senescence gene signatures in vivo (Fig. S3E,F). MLP/LMPPs are a key branchpoint between myeloid and lymphoid lineages (Doulatov et al., 2010; Goardon et al., 2011). Single LMNB1-deficient HSCs and MLP/LMPPs had significant changes in gene expression (HSCs 127 genes, LMPPs 1050 genes, q < 0.05) (Fig. S3G), including increased expression of myeloid-specifying transcription factors IRF8, CEBPA, CEBPD, SPI1 and RUNX1, and reduced expression of lymphoid transcription factors EBF1, NOTCH1, and early lymphoid genes e.g. CD79A (Fig. 3E). Taken together, both the in vitro and in vivo data suggest that lamin B1 is required for hematopoietic fate determination, while its loss drives HSC expansion, preferential induction of myeloid and suppression of lymphoid transcription factors, and myeloid-biased hematopoiesis.
Figure 3. Single cell analysis of human HSC differentiation in vivo.
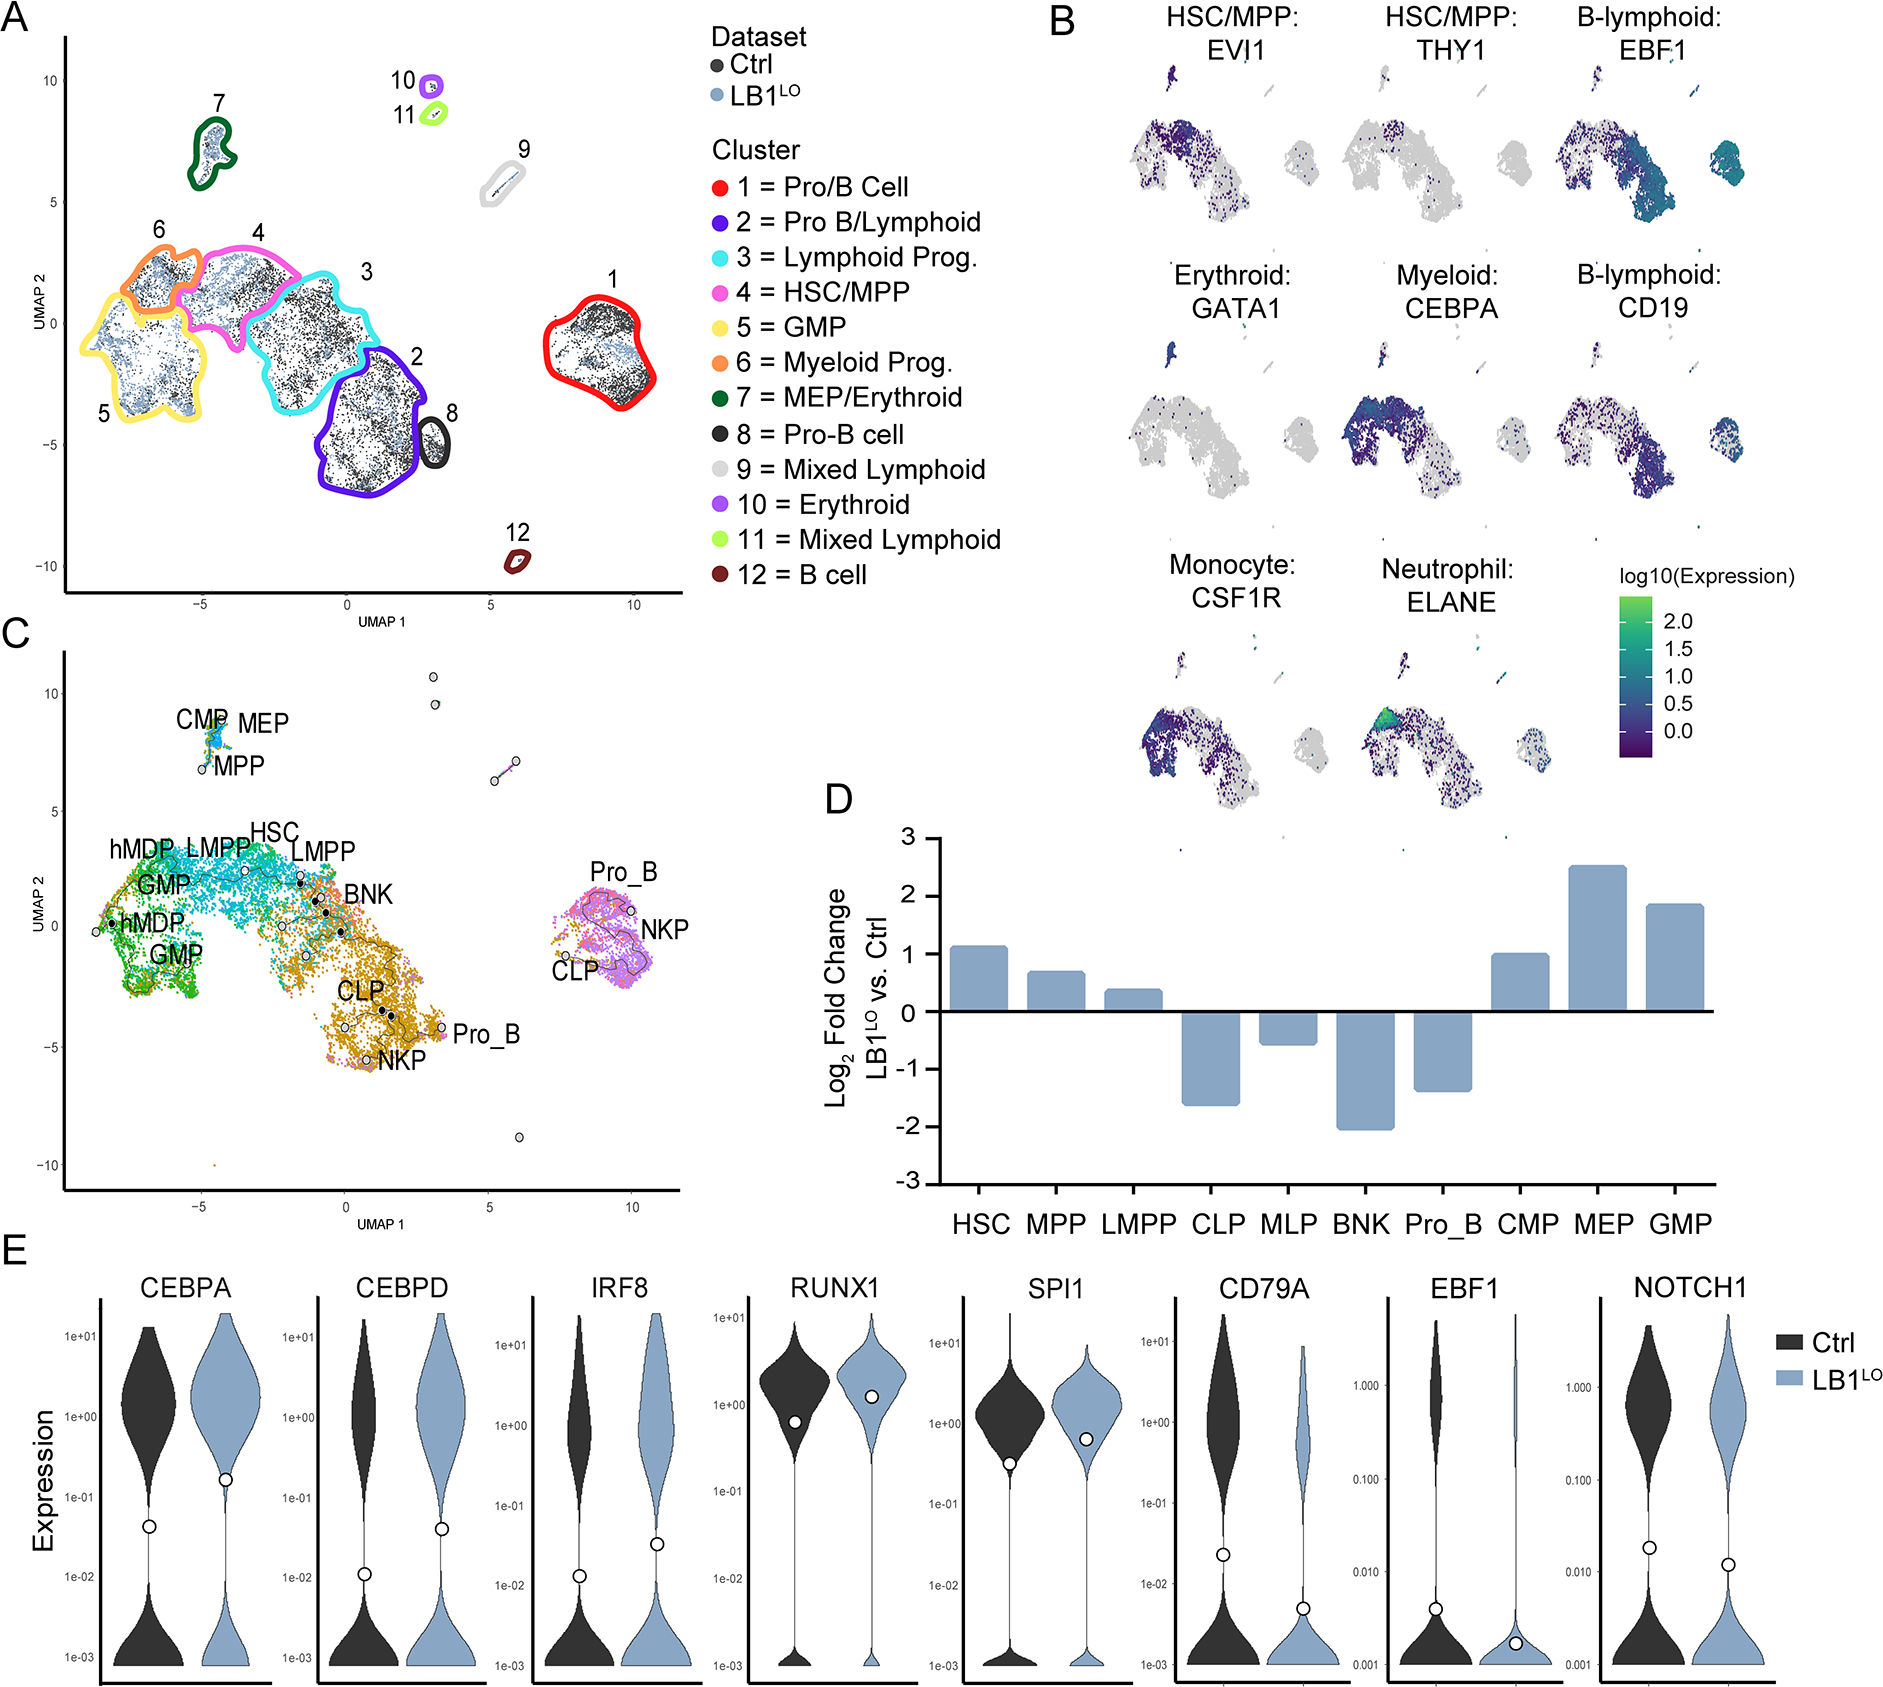
A. Combined UMAP of human control and LB1LO CD34+ HSPCs engrafted in NSG mice after filtering and clustering (resolution = 6 × 10⁻⁴) using the Monocle 3 R package. Cells are colored by dataset of origin (control=dark grey, LB1LO=light blue) and clusters (outlined) were manually annotated based on expression of known lineage markers. B. Relative expression (log10) of key hematopoietic lineage markers on the combined UMAP; yellow = highest level of expression (2.5), violet = lowest level (0), and grey = no detected transcripts. C. UMAP of assigned predicted cell type identity based on transcriptional comparison of the combined dataset to the Atlas of human Blood Cells dataset using the SingleR package. Inferred pseudotime trajectory determined by Monocle 3 is overlaid on the plot. D. Relative frequencies (log2 fold change) of HSCs and progenitors in LB1LO vs control HSPCs based on unbiased SingleR analysis. E. Violin plots of expression of myeloid and lymphoid lineage determination factors in single control or LB1LO LMPPs predicted by SingleR. Median expression shown as white dot. See also Figure S3.
Lamin B1 loss impairs DNA damage repair in MDS-derived cells
The 5q23.2 region encoding LMNB1 is recurrently deleted in high-risk MDS/AML with mutations in TP53 (Rucker et al., 2012). To study the role of lamin B1 in 5q-deleted MDS, we reprogrammed an MDS patient with TP53 mutation and complex karyotype (>3 chromosomal aberrations) including del5q (Hsu et al., 2019), and derived two iPSC lines: TP53+/R209fs (TP53) alone or TP53+/R209fs with an isolated del5q spanning 5q22–5q31.1 encoding LMNB1 (TP53;del5q) (Fig. 4A). The 5q22–5q31.1 region is often deleted in high-risk disease but largely excludes the common deleted region in MDS patients with favorable prognosis (Ebert, 2009). We can also infer that in this patient, TP53 mutation followed by del5q were the early events that preceded progression to complex karyotype. We differentiated iPSCs and established CD34+ hematopoietic progenitor cell (HPC) lines using 5 transcription factors (see Methods) (Fig. 4A). LMNB1 protein level in TP53+/R209fs lines was comparable to HPCs established from iPSCs of normal individuals and was reduced by 80% in TP53;del5q cells (Fig. 4B,C; Fig. S4A). Lamin B1 was also reduced in the nuclear envelope of TP53;del5q cells (Fig. S4B). Lentiviral overexpression restored normal levels of LMNB1 in TP53;del5q cells (Fig. 4C). Some TP53;del5q cells also exhibited irregularities in nuclear morphology, including a partial disruption of lamina and nuclear “blebs” (Fig. S4C), as previously observed in Lmnb1-knockout fibroblasts (Chen et al., 2019).
Figure 4. Lamin B1 loss impairs DNA damage repair in MDS-derived cells.
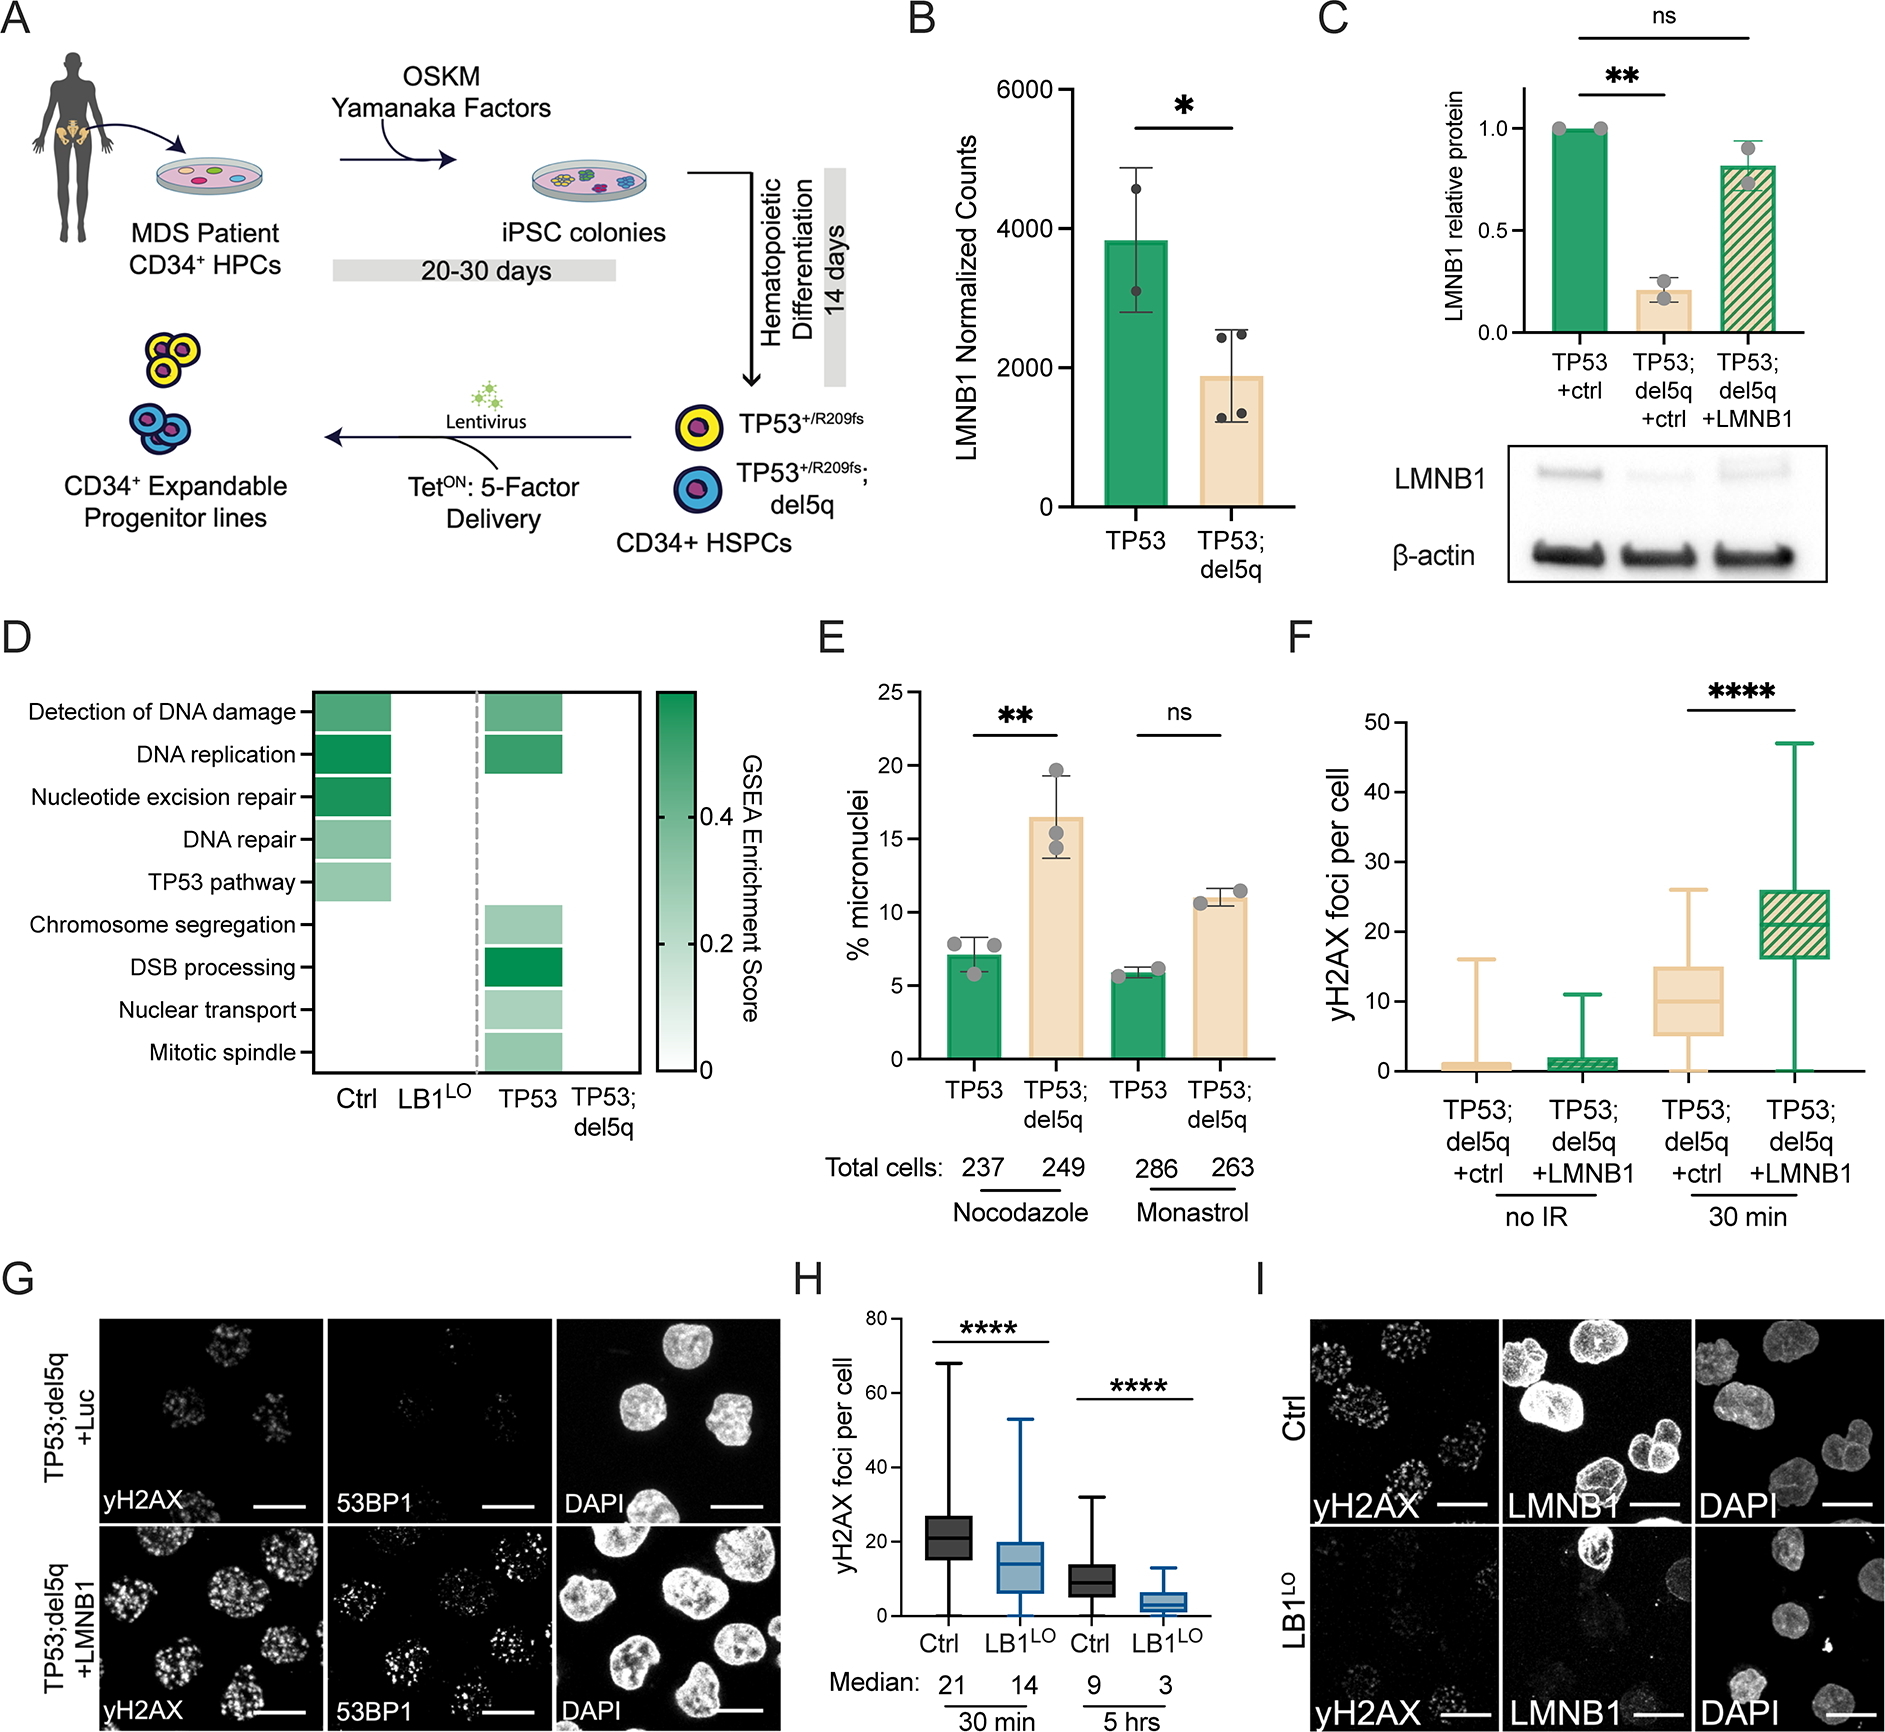
A. Schematic of iPSC reprogramming of MDS patient CD34+ HSPCs and derivation of TP53+/R209fs (TP53) and TP53+/R209fs;del5q (TP53;del5q) iPSC-MDS HPCs. B. LMNB1 mRNA expression in MDS HPCs, mean ± SD of 2 replicates TP53+/R209fs (TP53), and 4 replicates TP53;del5q, *p<0.04, t-test. C. Lamin B1 protein expression in TP53+/R209fs (TP53) and TP53;del5q MDS HPCs, transduced with control (+ctrl) or LMNB1 ORF (+LMNB1) lentiviruses; mean ± SD of 2 replicates, **p=0.0034. D. Enrichment score of DNA damage-related gene sets in GSEA analysis of TP53+/R209fs (TP53) vs. TP53;del5q MDS HPCs and control vs LB1LO CB HSPCs, FDR q < 0.05 for all comparisons. E. Frequency of micronuclei in TP53+/R209fs (TP53) and TP53;del5q HPCs after monastrol or nocodazole treatment. Mean ± SD of 2–3 experiments, >230 cells per condition, nocodazole **p<0.001, Welch’s t-test, ns = not statistically significant. F,G. Number of γ-H2AX and 53BP1 foci before (no IR) and 30 minutes post-irradiation in TP53;del5q MDS HPCs expressing control or LMNB1 ORF (+LMNB1). Quantitation of γ-H2AX foci (F) and representative images (G). Boxplot showing median and quartiles of n=2 combined experiments, >300 cells per condition, p<0.0001, Mann-Whitney test. Scale bar = 10 μm. H, I. Number of γ-H2AX foci 30 minutes and 5 hours post irradiation in control or LB1LO CB HSPCs. Quantitation (H) and representative staining of γ-H2AX and nuclear lamin B1 levels (I). Boxplot showing median and quartiles of n=3 combined experiments, >300 cells per condition, ****p<0.0001, Mann-Whitney test. Scale bar = 10 μm. See also Figure S4.
We first probed the transcriptional changes induced by the high-risk 5q deletion in MDS HPCs. Genome instability caused by defects in DNA repair or chromosome segregation is a hallmark of complex karyotype malignancies (Jeggo et al., 2016; Thompson et al., 2010). TP53;del5q cells had reduced expression of genes involved in chromosome segregation and DNA damage repair compared to TP53+/R209fs, some of which were also downregulated in LMNB1-depleted CB HSPCs (Fig. 4D). Consistent with this, our previous study showed decreased induction of double strand break (DSB) repair foci marked by phosphorylated H2AX (γ-H2AX) in TP53;del5q progenitors (Hsu et al., 2019). We also monitored micronuclei formation as a marker of chromosome instability (Fenech, 2007) following induction of mitotic stress with nocodazole or monastrol (Cimini et al., 2001; Janssen et al., 2011). TP53;del5q progenitors had a higher frequency of micronuclei than TP53+/R209fs cells after nocodazole or monastrol treatment (Fig. 4E). Micronuclei formation has been shown to occur in other LMNB1-deficient cells (Butin-Israeli et al., 2015; Hatch et al., 2013; Shimi et al., 2008; Vargas et al., 2012) and can facilitate complex chromosomal rearrangements (Liu et al., 2018; Zhang et al., 2015). Deletion of the high-risk 5q22–5q31.1 region thus dysregulates multiple pathways that maintain genome integrity.
Loss of lamin B1 causes defective DNA damage repair, including DSB repair (Butin-Israeli et al., 2015; Shimi et al., 2008). To test if reduced marking of DSBs by γ-H2AX in TP53;del5q MDS cells was lamin B1-dependent, we rescued LMNB1 expression in TP53;del5q HPCs by lentiviral overexpression. LMNB1 overexpression resulted in a significant increase in γ-H2AX and 53BP1 foci, a downstream marker of DSB, shortly (30 minutes) after irradiation (Fig. 4F,G; Fig. S4D). To test if LMNB1 deletion was sufficient to compromise γ-H2AX foci formation, we used LMNB1-depleted CB HSPCs. Similarly to TP53;del5q MDS-derived cells, LB1LO CB HSPCs had reduced expression of genes involved in detection of DNA repair (Fig. 4D), and formed fewer γ-H2AX foci 30 minutes after irradiation (Fig. 4H,I). The expression of H2AFX, TP53BP1, and ATM were not changed in the CB- or MDS HPCs (Fig. S4E). Moreover, the rate of resolution of the DSB foci in LB1LO CB HSPCs was similar to controls (Fig. S4F). These data suggest that lamin B1 loss reduces γ-H2AX signaling at DSB sites. To identify if reduced induction of γ-H2AX leads to unrepaired DSBs, we performed a neutral COMET assay. We detected persistent DSBs 16 hours post-irradiation in TP53;del5q cells, which were decreased by LMNB1 overexpression (Fig. S4G). Taken together, our data suggest that loss of lamin B1 in MDS and AML results in poor induction of γ-H2AX foci at DSB sites leading to ineffective DSB repair, which over time can lead to complex chromosomal aberrations.
Lamin B1 loss alters 3D chromatin organization
Lamin B1 binds to and maintains chromatin in proximity to the nuclear envelope (Guelen et al., 2008; Reddy et al., 2008). To understand if lamin B1 loss alters 3D chromatin conformation to induce gene expression changes that dysregulate differentiation and DNA repair, we performed in situ Hi-C in CB and MDS-iPSC HSPCs. Higher-order chromatin is spatially organized into 3D genome features at different scales, including transcriptionally active A and inactive B compartments, topologically associated domains (TADs) and chromatin loops anchored by CTCF (Dixon et al., 2012; Kloetgen et al., 2019; Lieberman-Aiden et al., 2009; Nora et al., 2012; Rao et al., 2014). We observed few large-scale changes in LB1LO CB HSPCs, including A/B compartment (Fig. 5A,B) and long-range interactions (Fig. 5C). Only 1.2% of compartments shifted from A to B and 3.2% from B to A in LMNB1-depleted CB and MDS del5q HSPCs (Fig. 5B). Similarly, we did not observe significant global changes in insulation scores at TAD boundaries (Fig. S5A).
Figure 5. Lamin B1 loss alters 3D chromatin organization.
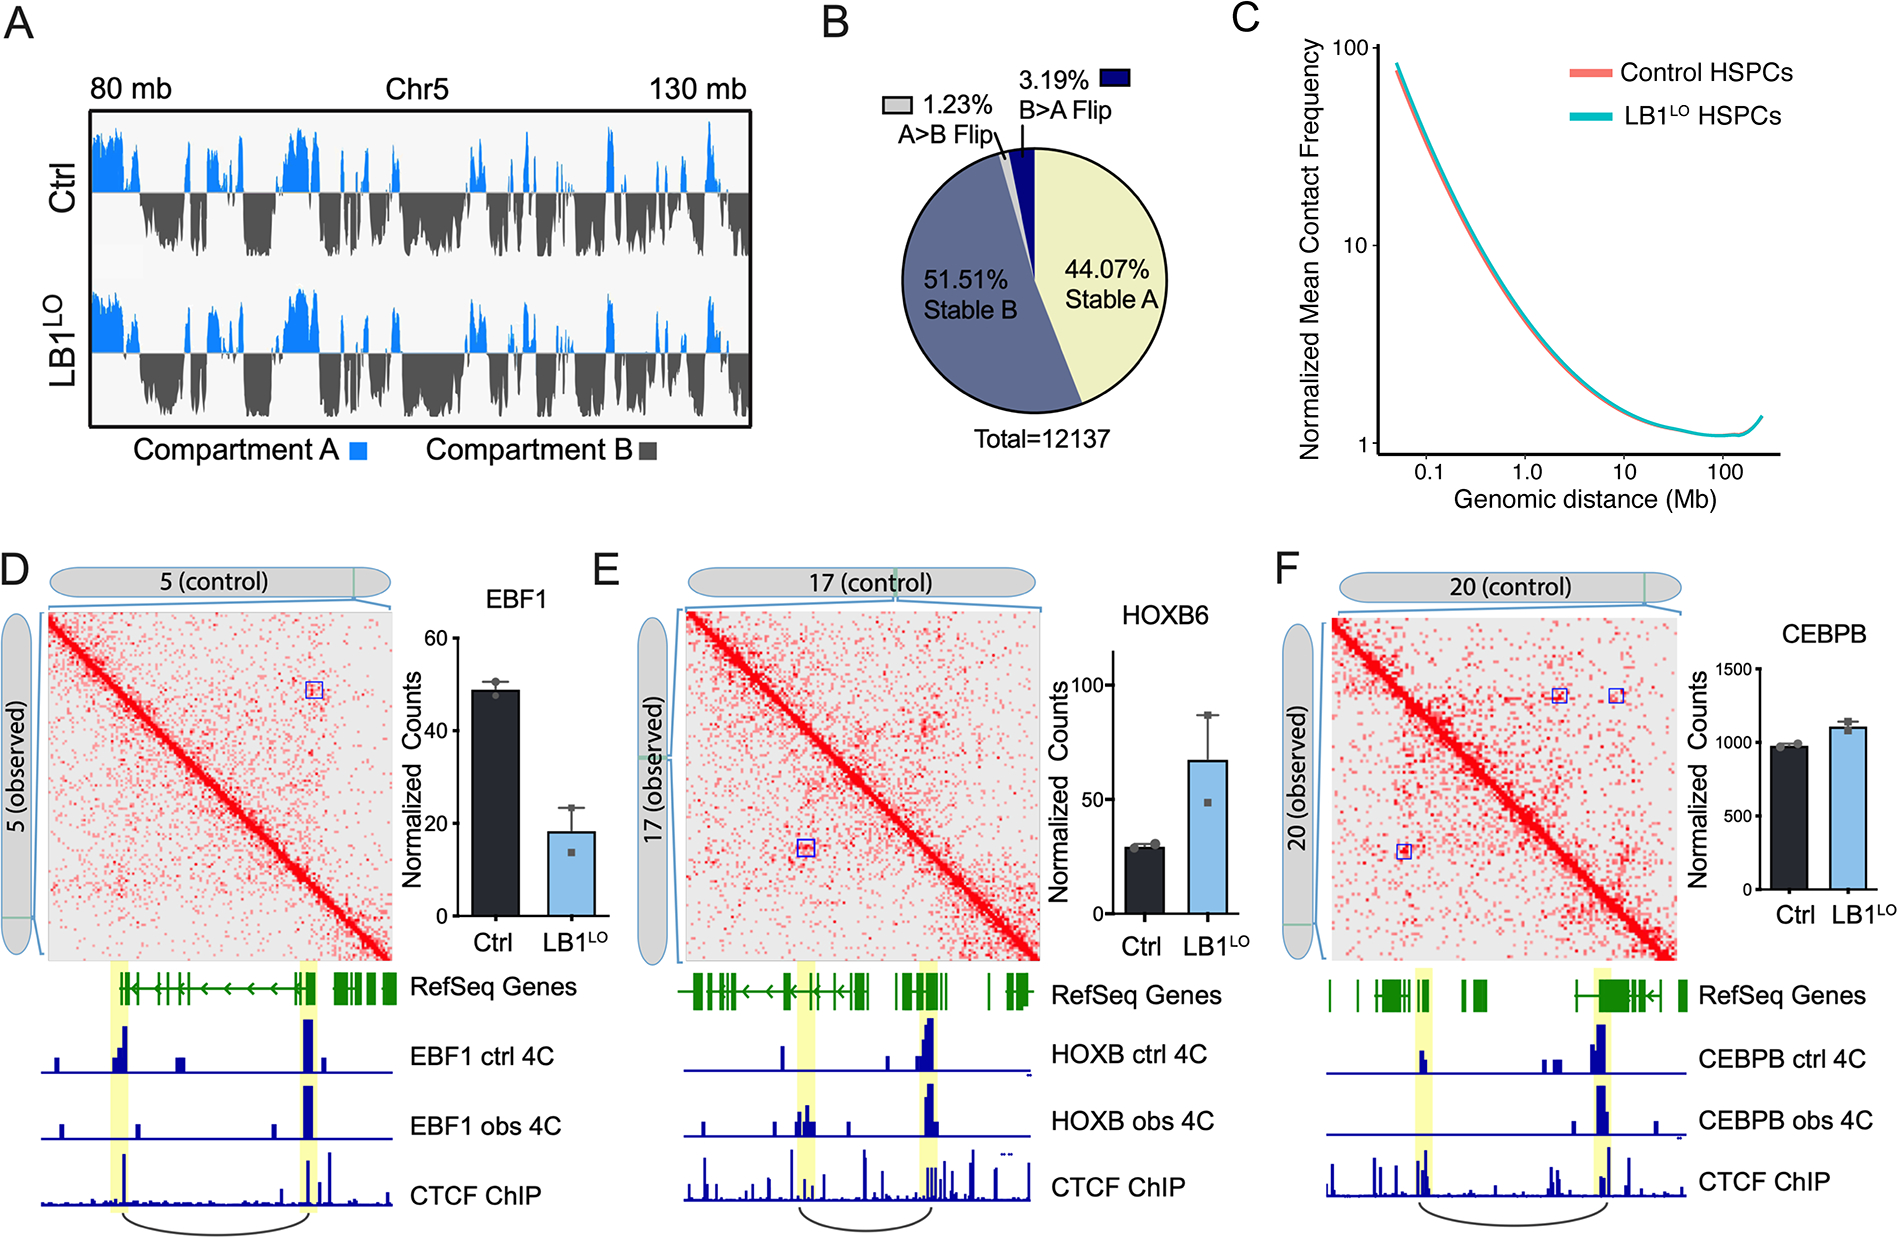
A. A and B compartment scores in control or LB1LO CB HSPCs over a representative genomic region (chromosome 5: 80–130 Mb). Blue denotes positive signal in PC1 (A compartment), grey is negative signal in PC2 (B compartment). Data from 2 combined replicates. B. Proportion of genomic regions switching between A and B compartments, or regions that did not switch compartments, in control compared to LB1LO CB HSPCs. Data from 2 combined replicates. C. Line of best fit of the mean whole genome Hi-C contact frequencies (normalized for depth) over genomic distance for control and LB1LO CB HSPCs; 100 kb resolution. D-F. Contact matrices of control or LB1LO CB HSPCs at EBF1 (D), HOXB (E), and CEBPB (F) loci. Control: control contacts in the top right triangle; observed: LB1LO contacts in the bottom left triangle. Significant loops called by HOMER are denoted with a blue square. mRNA expression is displayed on the right, mean ± SD of 2 replicates. Virtual 4C tracks generated from original Hi-C matrix signal denote the interaction signal at promoter and enhancer regions. CTCF ChIP-seq track from CD34+ cord blood HSPCs denotes regions of CTCF binding and loop anchors. See also Figure S5.
We next analyzed chromatin loops in CB and MDS HSPCs using HOMER and overlapped them with CTCF loop boundaries in CD34+ cells (Zhang et al., 2020). We detected changes in short-range loops (0.1–1 Mb, median 0.25 Mb) across the genome (Fig. S5B) involving both loop loss and gain in LMNB1-depleted cells. Loop alterations, commonly loop loss, were significantly associated with transcriptional changes induced by lamin B1 loss (Fig. S5C). Many of the loop anchor loci were promoter-enhancer interactions at key transcription factor loci, including EBF1, HOXB, and CEBPB, and often correlated with changes in gene expression (Fig. 5D–F; Fig. S5D). EBF1 is a key transcription factor that controls B cell lineage fate (Nechanitzky et al., 2013). The EBF1 loop, corresponding to a known enhancer-promoter interaction in the Genehancer dataset (Fishilevich et al., 2017), was detected in the control but not in the LB1LO CB or MDS del5q progenitors, corresponding to the loss of EBF1 expression in vitro and in vivo (Fig. 5D; Fig. S5E). By contrast, a new putative enhancer-promoter loop was gained in the HOXB locus important for HSC self-renewal (Chen et al., 2016; Fischbach et al., 2005) corresponding to increased expression of HOXB cluster genes, e.g. HOXB2 and HOXB6, in LMNB1-depleted cells (Fig. 5E). Lastly, we observed the loss of one of two distinct enhancer-promoter loops in the CEBPB locus important for neutrophil differentiation, although CEBPB expression was unchanged (Fig. 5F). Taken together, these data suggest that lamin B1 loss can regulate gene expression by re-organization of chromatin loops.
LMNB1 deletion causes pseudo Pelger-Huët anomaly in MDS/AML
Since lamin B1 is anchored to the nuclear membrane by lamin B receptor (Schreiber and Kennedy, 2013), encoded by the LBR gene mutated in inherited PHA, we hypothesized that 5q/LMNB1 deletion causes pseudo-PHA in MDS and AML. To test this hypothesis, we first analyzed neutrophil nuclear morphology in peripheral blood smears of MDS patients with the 5q/LMNB1 deletion (“cases”) and compared them to control MDS patients without 5q/LMNB1 deletion, verified by chromosomal genomic array testing. Cases included patients with an LMNB1 deletion occurring with either an isolated del5q or del5q as part of a complex karyotype; controls included isolated del5q without LMNB1 deletion or complex karyotype without del5q (Table S1). Since PHA includes both bi-lobed “pelgeroid” and monolobed neutrophils depending on severity, we quantitated both types of aberrant morphology. MDS patients with the 5q/LMNB1 deletion had a significantly higher proportion of aberrant neutrophils (quantitated using a “pathology score”) compared to controls (1.15 ± 0.15 cases vs 0.36 ± 0.20 controls, p=0.008) (Fig. 6A). Over 80% of MDS patients with the 5q/LMNB1 deletion had pelgeroid, monolobed, or both pelgeroid and monolobed neutrophils (21 of 26 patients), compared to 3 of 11 controls (p = 0.0028) (Fig. 6B). These findings suggest that pseudo-PHA in myeloid malignancies is strongly associated with 5q deletions involving 5q23.2/LMNB1 locus.
Figure 6. Lamin B1 deletion causes pseudo-Pelger-Huët anomaly in MDS/AML.
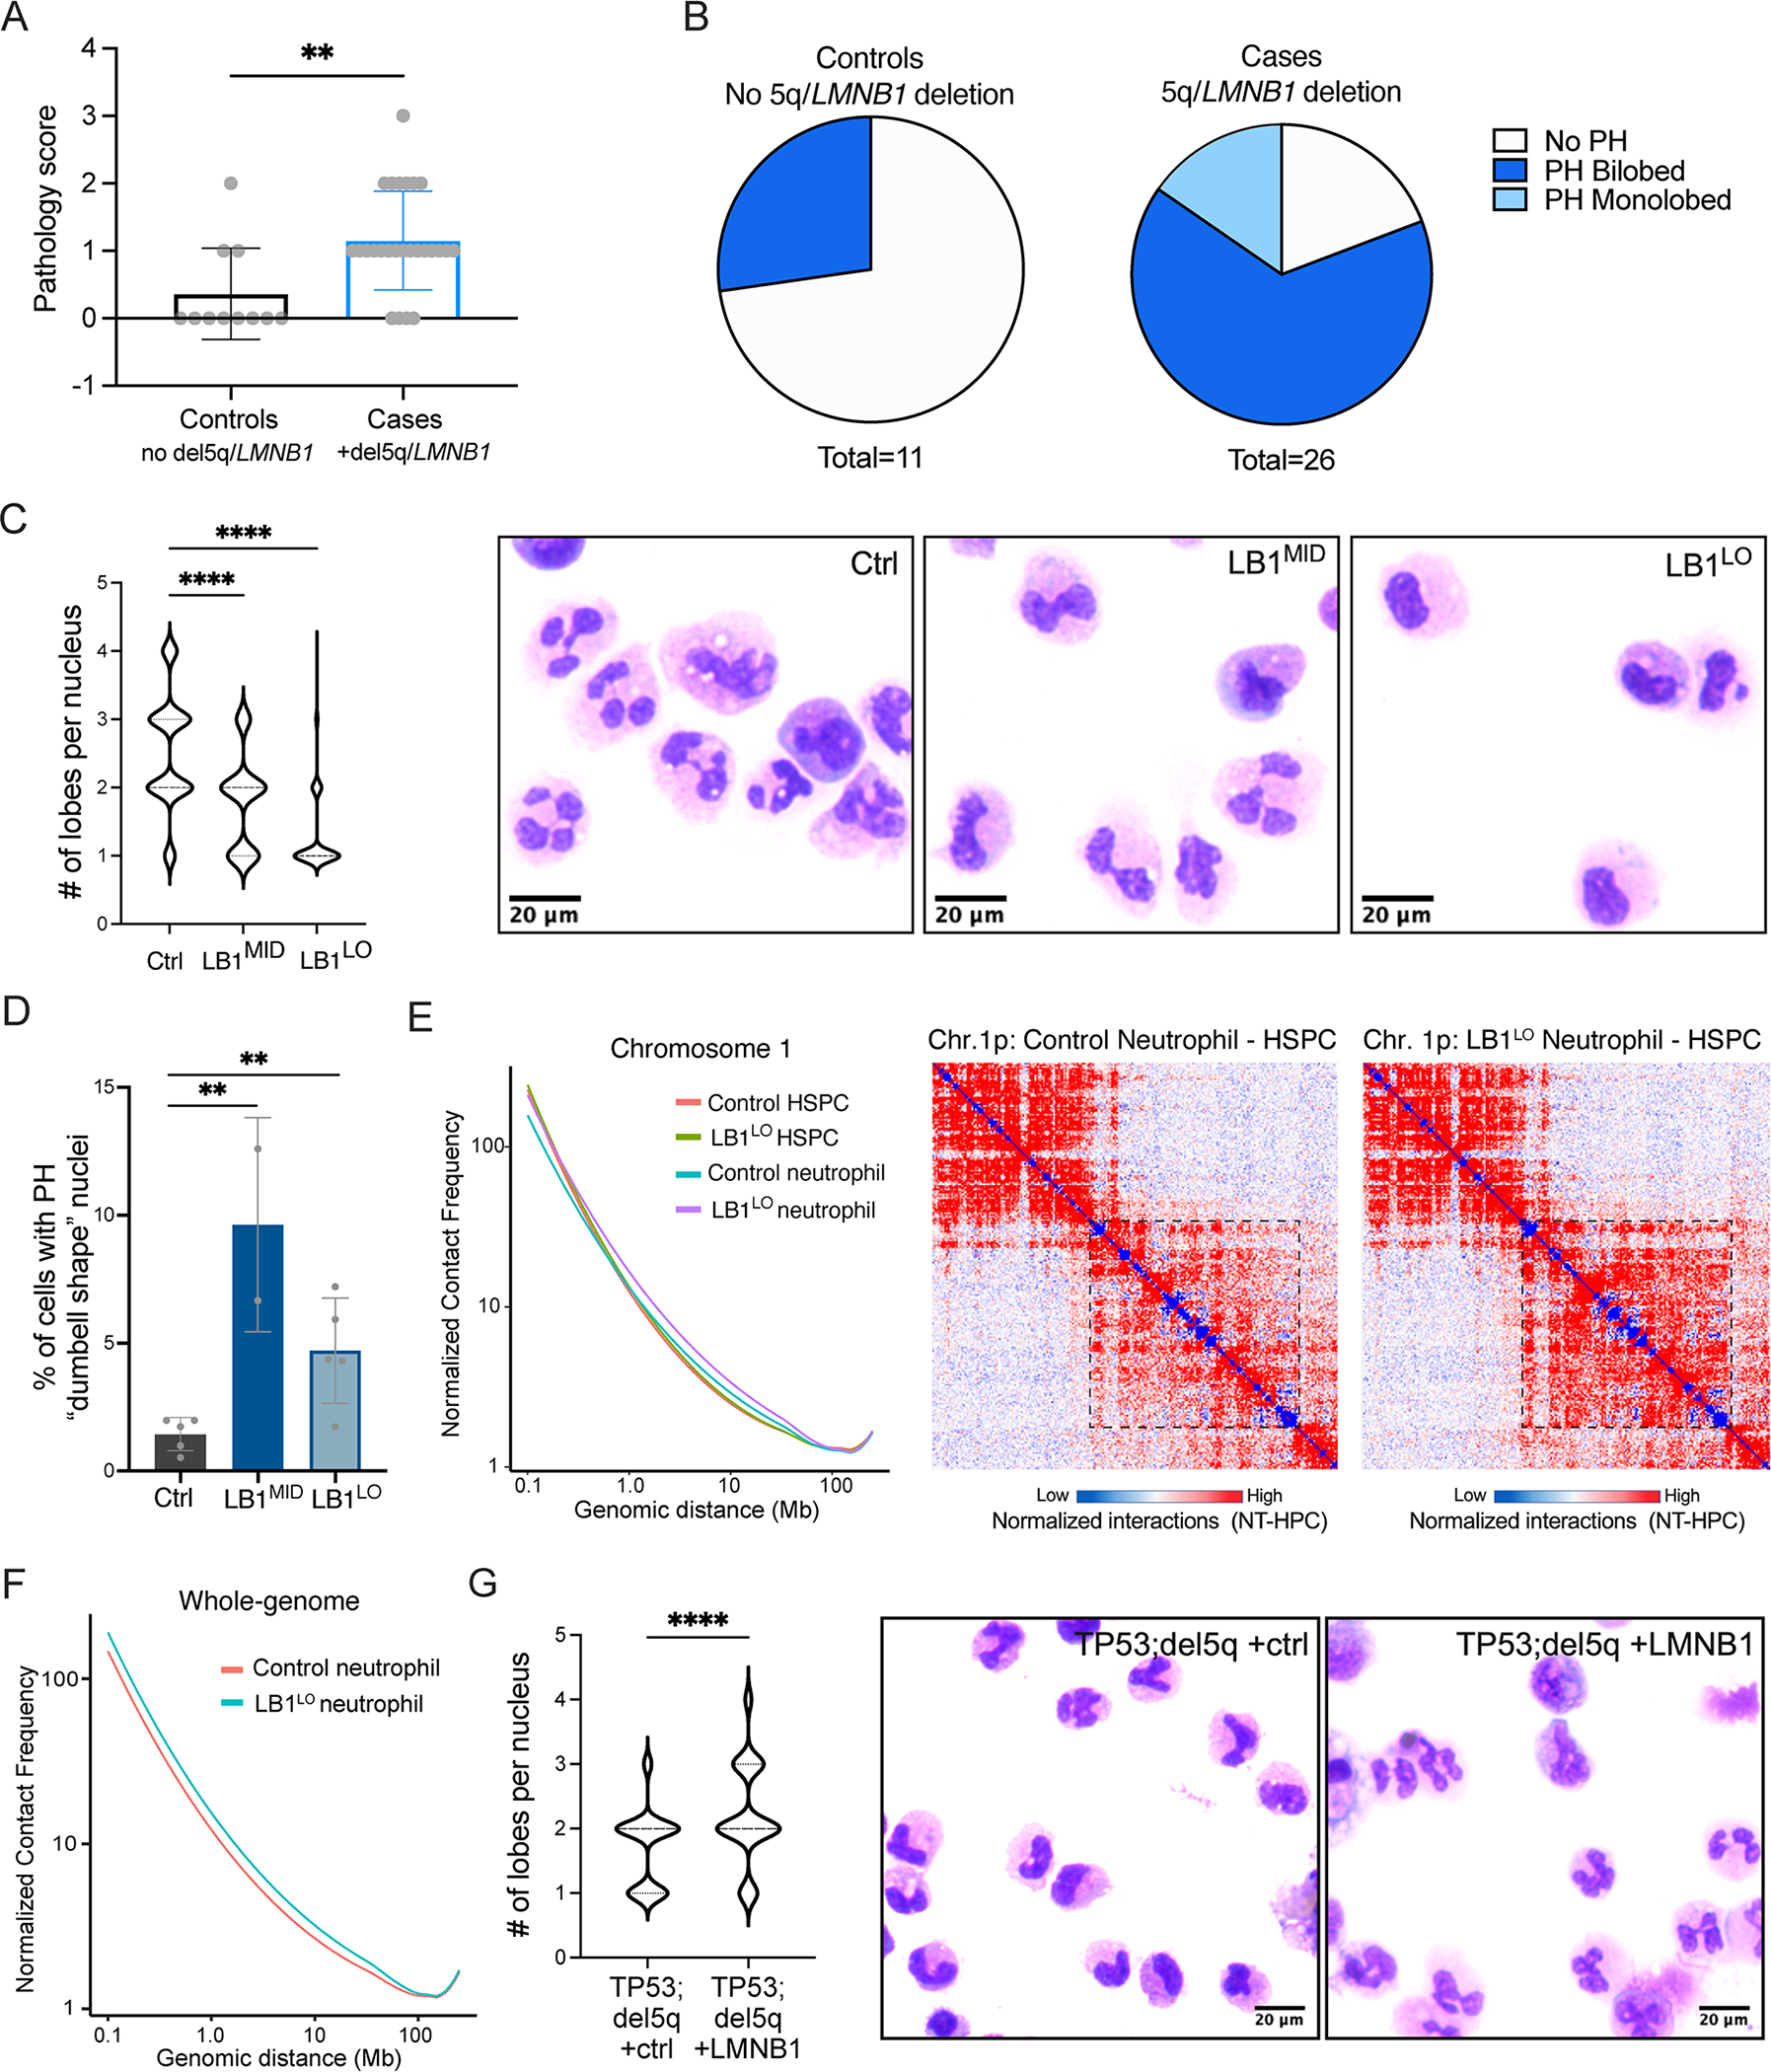
A. Score of abnormal neutrophil nuclear morphology in MDS patient cases (5q/LMNB1 deletion) or controls (MDS without 5q/LMNB1 deletion). Pathology score was calculated based on % of bi-lobed or monolobed PHA neutrophils as follows: 0 (not detected), 1 (1–9%), 2 (10–25%), 3 (>25%). Welch’s approximate t-test, **p=0.008, mean ± SD. B. Proportion of MDS cases (5q/LMNB1 deletion) or controls (no 5q/LMNB1 deletion) with abnormal bi-lobed or monolobed PHA neutrophils. Fisher’s exact test p=0.0028. C. Number of nuclear lobes in neutrophils derived from control, LB1MID, or LB1LO CB HSPCs. Quantitation (left) and representative May-Grunwald-Giemsa staining of neutrophils (right). ANOVA Kruskal-Wallis test, n=5 experiments for LB1LO, n=2 experiments for LB1MID, ****p<0.0001. D. Frequency of neutrophils exhibiting the classical bi-lobed “dumbbell shape” Pelger-Huet nuclear morphology derived from control, LB1MID, or LB1LO CB HSPCs. Mean ± SD of 2–5 experiments, **p<0.01 for both LB1MID and LB1LO, t-test. E,F. Line of best fit of the mean chromosome 1 (E) or whole genome (F) Hi-C contact frequencies (normalized for depth) over genomic distance for control and LB1LO CB HSPCs and neutrophils; 100 kb resolution. Right: contact heatmap of a representative genomic region (chr. 1p) at 500 kb resolution; color indicates difference in contacts between neutrophils and HSPCs. The box indicates a region of increased long-range interactions in LB1LO compared to control neutrophils. G. Number of nuclear lobes in neutrophils derived from TP53;del5q MDS HPCs overexpressing control or LMNB1 ORF. Quantitation (left) and representative May-Grunwald-Giemsa staining neutrophils (right). Mann-Whitney test, 2 experiments, ****p<0.0001. See also Figure S6.
To determine if LMNB1 is the 5q-deleted gene that causes pseudo-PHA, we differentiated LB1LO and LB1MID CB HSPCs into CD66b+ neutrophils (Fig. S6A). LMNB1 knockdown decreased neutrophil differentiation efficiency with a concomitant increase in expansion (Fig. S6B,C), consistent with the overall myeloid expansion. LBR nuclear staining was not affected by LMNB1 knockdown (Fig. S6D). We isolated CD66b+ neutrophils and quantified the nuclear morphology by histological Giemsa staining. Most control neutrophils had multi-lobed nuclear morphology, including cells with 2, 3, and 4 lobes (mean = 2.5 lobes). Strikingly, LB1LO HSPCs predominantly gave rise to monolobed neutrophils (mean = 1.3 lobes; p<0.0001), while LB1MID HSPCs had an intermediate phenotype (mean = 1.8 lobes; p<0.0001) compared to control (Fig. 6C; Fig. S6E). There was a significant increase in the percentage of “dumbbell-shaped” pelgeroid neutrophils in LMNB1 knockdown cells, which were almost never observed in control neutrophils (1.4%) (Fig. 6D). Consistent with the LBR gene dosage in inherited PHA, LB1MID HSPCs corresponding to heterozygous gene dosage generated more bi-lobed pelgeroid neutrophils (9.6%) compared to LB1LO HSPCs (4.7%), which more closely resemble homozygous loss of LBR (Fig. 6D). These data suggest that lamin B1 is essential for proper neutrophil nuclear segmentation and LMNB1 loss causes a dosage-dependent Pelger-Huët phenotype.
Neutrophil nuclear morphology is closely linked with global changes in 3D genome organization (Zhu et al., 2017). To determine if lamin B1 regulates the neutrophil 3D genome, we generated Hi-C maps of control and LB1LO neutrophils. Consistent with previous reports (Zhu et al., 2017), control neutrophils had decreased short-range (0.1–1 Mb) and increased long-range (>5 Mb) intrachromosomal interactions compared to HSPCs, indicative of global chromatin contraction (Fig. 6E,F). LB1LO HSPCs had altered loops, but few global changes in chromatin organization (Fig. 5C). By contrast, LB1LO neutrophils had markedly increased frequency of long-range interactions compared to LB1LO HSPCs or control neutrophils, indicating stronger chromatin compaction (Fig. 6E,F), consistent with the classical findings of coarse chromatin clumping and dense heterochromatin in PHA neutrophils (Hoffmann et al., 2007). These data show that PHA nuclear morphology induced by lamin B1 loss is associated with abnormal 3D chromatin organization during neutrophil differentiation.
To determine if lamin B1 is sufficient to rescue pseudo-PHA in del5q MDS/AML, we differentiated TP53;del5q iPSC-MDS HPCs to CD66b+ neutrophils. Consistent with the heterozygous reduction of lamin B1 gene dosage, neutrophils derived from the TP53;del5q progenitors displayed an intermediate pelgeroid phenotype (mean = 1.7 lobes per nucleus), similar to the LB1MID CB HSPCs (Fig. 6G). Overexpression of LMNB1 in TP53;del5q cells was sufficient to promote nuclear segmentation and rescue the pelgeroid phenotype (mean = 2.1 lobes per nucleus; p<0.0001) (Fig. 6G). Taken together, these data demonstrate that loss of lamin B1 alters neutrophil genome organization and causes Pelger-Huët anomaly in myeloid malignancies.
DISCUSSION
Here, we show that loss of the nuclear lamina gene LMNB1, encoded in the recurrently deleted 5q region in myeloid neoplasms, causes both morphological and functional hematopoietic abnormalities. Lamins mediate a diverse range of biological processes, including regulation of nuclear morphology, gene expression, genome organization, and DNA repair (Karoutas and Akhtar, 2021; Schreiber and Kennedy, 2013; Shin et al., 2013; van Steensel and Belmont, 2017). Genetic disorders of lamins are known as laminopathies; germline mutations in LMNA encoding lamins A and C cause a range of inherited disorders, notably the Hutchinson-Gilford progeria syndrome (De Sandre-Giovannoli et al., 2003; Eriksson et al., 2003). LMNB1 duplication causes adult-onset autosomal dominant leukodystrophy (Padiath et al., 2006), and LMNB1 mutations have been identified in familial microcephaly (Cristofoli et al., 2020). LMNB1 expression is decreased in myeloid malignancies, consistent with the findings in many cancers (Broers et al., 1993; Jia et al., 2019; Klymenko et al., 2018; Moss et al., 1999), and can be reduced due to recurrent somatic deletions of 5q23.2, often found in adverse-risk MDS and AML. We discover that this reduction of lamin B1 expression has widespread consequences in normal and malignant hematopoiesis, including myeloid-biased lineage fate, genome instability, and pseudo Pelger-Huët anomaly. Reduced lamin B1 expression alters both local and global 3D genome organization, resulting in mis-expression of lineage-specifying transcription factors and myeloid-biased hematopoiesis, a hallmark of normal aging and premalignant transformation. Consistent with the role of lamin B1 in maintaining genome integrity (Butin-Israeli et al., 2015; Vergnes et al., 2004), we show that LMNB1 deletion impairs marking of DNA double-strand breaks with γ-H2AX and DNA repair, which may facilitate chromosomal rearrangements. Lastly, we demonstrate that somatic deletion of LMNB1 profoundly alters nuclear morphology of neutrophils that phenocopies inherited LBR mutations found in PHA (Best et al., 2003; Hoffmann et al., 2002). Deletions of 5q involving LMNB1 are strongly associated with pseudo-PHA in MDS patients, and loss of LMNB1 dysregulates neutrophil 3D genome organization and is both necessary and sufficient to cause Pelger-Huët neutrophils. Taken together, our findings show that somatic loss of nuclear lamin B1 links abnormal nuclear morphology and chromatin organization with functional alterations of HSPC fate and genome instability.
Fate determination in HSPCs is orchestrated by the dynamic interplay of master transcription factors, epigenetic regulators, and 3D genome organization, and subverted by leukemic mutations during malignant transformation (Doulatov et al., 2012; Kloetgen et al., 2019; Orkin and Zon, 2008; Sperling et al., 2016). Lamin B1 regulates gene expression by retaining heterochromatin in the proximity to the nuclear envelope (Guelen et al., 2008; Reddy et al., 2008). However, some lamin B1 localizes to euchromatin and regulates local chromatin interactions and gene expression (Pascual-Reguant et al., 2018). We find that depletion of lamin B1 regulates 3D genome organization at the level of chromatin loops in HSPCs and large-scale intrachromosomal interactions in neutrophils. Local remodeling in HSPCs often involves enhancer-promoter loops of transcription factor loci, such as EBF1, HOXB, CEBPB. This correlates with downregulation of the lymphoid expression program, upregulation of myeloid-specific and self-renewal genes, and concordant alterations in HSC output both in vitro and in vivo. At the single cell level, lamin B1 was essential for balanced lineage output of human LMPP/MLPs, which give rise to all lymphoid cells but retain myeloid potential (Doulatov et al., 2010; Goardon et al., 2011). Interestingly, altered genome organization with HSC expansion, myeloid bias and impaired lymphopoiesis, have also been reported in human and mouse models of loss of cohesin subunits STAG2, RAD21, and SMC1A, mutated in MDS/AML (Mazumdar et al., 2015; Mullenders et al., 2015; Ochi et al., 2020; Viny et al., 2019). Altogether, we provide evidence for a mechanism whereby disruptions in chromatin organization in 5q/LMNB1 deleted cells alter gene expression of lineage and self-renewal regulators leading to myeloid-biased lineage fate.
Deletion of 5q or monosomy 5 is nearly universally found in MDS and AML with complex karyotype (MDS/AML-CK), including 80% of TP53-mutant cases (Grimwade et al., 2010; Hosono et al., 2017; Kulasekararaj et al., 2013). 5q deletions in high-risk disease center on 5q31 and in most cases also involve the adjacent 5q23.2 encoding LMNB1 (Ebert, 2009; Horrigan et al., 2000; Lai et al., 2001). We show that loss of LMNB1 is associated with inferior outcomes in AML patients, and is required for the maintenance of malignant phenotype in primary del5q AML cells. Genome and chromosome instability in MDS and AML-CK is driven by mutations in TP53 and other DNA damage factors, including PPM1D, which gain selective advantage following chemotherapy (Hsu et al., 2018; Wong et al., 2018; Wong et al., 2015). Lamin B1 is essential for nuclear envelope integrity, and deletion of LMNB1 in cell lines and mice leads to defects in DNA repair and aneuploidy (Butin-Israeli et al., 2015; Vergnes et al., 2004). To study the role of lamin B1 in a genetically accurate model of MDS, we generated TP53-mutant del5q iPSC-HSPCs from an MDS-CK patient. LMNB1 deletion or loss caused inefficient DNA double strand break repair and poor induction of γ-H2AX and 53BP1 foci after irradiation. γ-H2AX is rapidly phosphorylated around double strand breaks leading to foci formation. Interestingly, γ-H2AX spreading at double strand breaks is established through proximity of chromatin contacts and regulated by cohesin (Arnould et al., 2021; Collins et al., 2020), suggesting that changes in chromatin organization can impact DNA damage repair. Loss of 5q/LMNB1 thus dysregulates DNA repair and genome integrity and may cooperate with TP53 mutations in accelerating acquisition of chromosomal rearrangements.
Nuclear lamins are intermediate filament proteins that maintain normal nuclear architecture (Fischer, 2020; Shin et al., 2013). Abnormal nuclear morphology in myeloid malignancies often manifests in the neutrophil lineage, which undergo complex remodeling from round to multilobed nuclei during differentiation. Nuclear lobation is closely linked with large-scale changes in 3D genome organization, including contraction of heterochromatin at the nuclear periphery (Zhu et al., 2017). Inherited PHA is a benign disorder of neutrophil morphology caused by LBR mutations, while acquired PHA is commonly found in MDS and AML and has been associated with 17p anomalies and TP53 mutations (Merlat et al., 1999; Soenen et al., 1998). Interestingly, almost every patient with 17p anomalies in these studies also had 5q deletions (Merlat et al., 1999; Soenen et al., 1998). We show that Pelger-Huët morphology in MDS patients is strongly associated with 5q deletions spanning LMNB1. Pelger-Huët neutrophils are also observed after treatment with certain drugs (Wang et al., 2011) and infections, likely explaining why abnormal neutrophils are found in some patients without del5q. Loss of LMNB1 is sufficient to induce Pelger-Huët morphology in primary human neutrophils, and the severity of the phenotype is dependent on LMNB1 dosage, analogous to homozygous or heterozygous LBR mutations in inherited PHA (Hoffmann et al., 2002). Finally, we show that del5q iPSC-derived neutrophils show Pelger-Huët morphology, which can be rescued by overexpression of LMNB1. PHA neutrophils are described by coarse chromatin clumping (Hoffmann et al., 2007). Consistent with this, we find that lamin B1-deficient neutrophils undergo increased chromatin compaction during differentiation, which we speculate may be causally linked with altered nuclear morphology. The mechanisms by which lamin B1 regulates nuclear morphology likely involve complex interactions between nuclear lamins, chromatin configuration, gene expression, and the cytoskeleton (Stephens et al., 2019). Our findings demonstrate that LMNB1 is the causative gene underlying acquired PHA in myeloid malignancies. Moreover, pseudo-PHA is a potential biomarker of the LMNB1 gene dosage, and may have a clinical prognostic significance.
Abnormal nuclear morphology and chromatin organization are common in cancers, although it is not clear whether these are the cause or consequence of malignant transformation. We demonstrate that abnormal nuclear morphology is causally linked with myeloid-biased fate determination and loss of genome integrity, via reduced LMNB1 gene dosage. As LMNB1 loss is frequent in MDS/AML and other cancers (Broers et al., 1993; Jia et al., 2019; Klymenko et al., 2018; Moss et al., 1999) our findings help explain why nuclear dysmorphology is pervasive in myeloid malignancies and possibly across cancers.
Limitations of the Study
Our study implicates nuclear lamin B1 as a master regulator of HSPC cell fate specification, genome integrity, and nuclear morphology, whose loss in 5q-deleted cells causes phenotypes associated with myeloid malignancy, including myeloid bias and PHA. These findings suggest that lamin B1 is a tumor suppressor gene in MDS/AML. Follow up studies are needed to test if lamin B1 loss cooperates with TP53 mutations in promoting genome instability and progression to AML-CK. We show that lamin B1 loss alters 3D chromatin organization at both local and global levels, and we propose that these are causally linked with fate specification and nuclear morphology. Future studies are needed to determine which enhancer-promoter loops, e.g. EBF1, are linked with changes in HSPC fate downstream of lamin B1 loss. In addition, we need to better understand how global chromatin re-organization is linked with nuclear morphology changes in neutrophils and other cell types.
STAR METHODS
RESOURCE AVAILABILITY
Lead contact.
Further information and requests for resources and reagents should be directed to and will be fulfilled by the lead contact, Sergei Doulatov (doulatov@uw.edu).
Materials availability.
iPSC-derived hematopoietic cell lines generated as part of this study can be requested from the lead contact using a standard Materials Transfer Agreement (MTA).
Data and code availability.
The raw and processed RNA-seq, single cell RNA-seq, and Hi-C data files generated as part of this study have been deposited to the Gene Expression Omnibus (accession number GSE174533) and are publicly available as of the date of publication. RNA-seq data for iPSC-MDS HPCs is available from Gene Expression Omnibus (accession number GSE129851). This paper does not report original code. Any additional information required to reanalyze the data reported in this paper is available from the lead contact upon request.
EXPERIMENTAL MODEL AND SUBJECT DETAILS
Normal human hematopoietic cells.
Umbilical cord blood was obtained from Bloodworks Northwest following guidelines approved by the institutional review board at the University of Washington. Mobilized peripheral blood CD34+ cells were purchased from the Fred Hutchinson Cancer Center Co-Operative Center for Excellence in Hematology (CCEH) core. Samples were collected from both male and female recipients. All reported experiments were replicated with 2 or more independent donors.
MDS and AML patient samples.
For iPSC reprogramming, bone marrow cells were obtained from a female MDS patient according to the institutional guidelines approved by the University of Washington. AML samples were purchased from the Fred Hutchinson Cancer Center CCEH core. Written informed consent was obtained from all participants.
MS-5 stromal cells.
MS-5 stroma was a gift from Dr. Katsuhiko Itoh, Japan. MS-5 cells were cultured in H5100 media (StemCell Technologies).
Immunodeficient mice.
NOD/LtSz−scidIL2Rgnull (NSG) mice were purchased from Jackson Labs, bred and housed at the University of Washington animal care facility. Animal experiments were performed in accordance to institutional guidelines approved by UW animal care committee. To ensure consistency, only female mice between 8 and 14 weeks of age were used for transplantation experiments.
METHOD DETAILS
Isolation of human cord blood HSPCs.
Human umbilical cord blood mononuclear cells were collected by centrifugation with Ficoll-Paque Plus (GE), followed by red cell lysis with ammonium chloride (StemCell Technologies) and viably cryopreserved in 10% DMSO, 40% FBS. CD34+ cells were extracted using the Miltenyi CD34 Microbead kit according to manufacturer’s instructions.
Cord blood gene transfer.
Cryopreserved CD34+ HSPCs were thawed following the Lonza Poietics protocol (www.lonza.com) and cultured for 4 hours in X-VIVO 10 media (Lonza) + 1% BSA, 1 mM L-glutamine, penicillin/streptomycin, 100 ng/ml SCF, 100 ng/ml FLT3, 50 ng/ml TPO, and 20 ng/ml IL-6 (Peprotech). Lentiviral transduction was carried out on Retronectin-coated (Takara) non-tissue culture treated 96-well plates in complete X-VIVO 10 media at MOI = 50 and a total volume of 150 μl. Virus was concentrated onto cells by centrifuging the plate at 2500 rpm for 30 min at RT. After 24 hours, cells were washed in PBS and cultured in X-VIVO with cytokines for another 48 hours. CD34+/GFP+ cells were sorted on the BD Aria III flow sorter and subsequently cultured in StemSpan SFEM (StemCell Technologies) plus 100 ng/ml SCF, 100 ng/ml FLT3, 50 ng/ml TPO, 50 ng/ml IL-6, and 20 ng/ml IL-3.
MDS iPSC reprogramming.
Bone marrow cells were obtained from MDS patients according to the institutional guidelines approved by the University of Washington. iPSC reprogramming, differentiation, and MDS HPC cell line generation was performed as described previously (Hsu et al., 2019). iPSC-MDS HPCs were cultured in StemSpan SFEM (StemCell Technologies) plus 50 ng/mL SCF, 50 ng/ml FLT3, 50 ng/ml TPO, 50 ng/ml IL-6, 10 ng/ml IL-3 (Peprotech), and doxycycline (2 μg/ml) (Sigma). Cells were maintained at 1×10⁶ cells/ml and medium changed every 3 to 4 days.
Lentivirus and shRNA plasmids.
HOXA9, ERG, RORA, SOX4, and MYB 5F lentiviral vectors are available from Addgene. LMNB1 overexpression vector was obtained from Sigma (Sigma Mission TRC3, GFP cat. #ORFGFP; LMNB1 cat. # TRCN0000467310). Experiments were independently performed with the pSMAL lentiviral vector (gift from Peter van Galen, Harvard University). LMNB1 ORF was obtained as the donor plasmid (Genecopoeia, cat. #GC-I3724) and cloned into pSMAL vector using Gateway LR clonase (ThermoFisher, cat. #11791020).
shRNA lentiviral plasmids:
Oligos were cloned in the TRC cloning vector pLKO.1 (Addgene, plasmid #10878) following the pLKO.1 TRC cloning vector protocol (Addgene).
shRNA sense oligonucleotide sequences used are as follows:
Control Luciferase #1: 5’- ACGCTGAGTACTTCGAAATGT
Control Luciferase #2: 5’- CTTACGCTGAGTACTTCGA
LMNB1 75% knockdown: 5’- GCATGAGAATTGAGAGCCTTT (Sigma, TRCN0000029271)
LMNB1 50% knockdown: 5’- CCCAGATCAAGCTTCGAGAAT (Sigma, TRCN0000029273)
Lentiviral particles were produced by transfecting 293T-17 cells (ATCC) with the lentiviral plasmids and 3rd-generation packaging plasmids. Virus was harvested 24 hours after transfection and concentrated by ultracentrifugation at 23,000 rpm for 2 hrs. Viruses were titered by serial dilution on 293T cells.
MS-5 cultures.
MS-5 stroma (gift from Dr. Katsuhiko Itoh, Japan) were seeded in 24-well plates coated with 0.2% gelatin at 5×10⁴ cells/well in H5100 media (StemCell Technologies) plus SCF 100 ng/ml, IL-7 20 ng/ml, TPO 50 ng/ml, and IL-2 10 ng/ml. After 24 hrs, 500 CD34+ HSPCs were seeded onto MS-5 monolayers. MS-5 cultures were maintained for 4 wks with weekly ½ media changes. Wells were resuspended by physical dissociation, filtered through a Nytex membrane, stained with: CD33-PE (clone WM53), CD19-BV605 (clone SJ25C1), CD11b-APC (clone ICRF44), CD56-APCR700 (clone NCAM16.2), and analyzed by flow cytometry (all BD Biosciences).
Colony assays.
CB HSPCs were seeded at 1000 cells per 3 ml MethoCult (H3434; StemCell Technologies), plus 10 ng/mL FLT3, 10 ng/mL IL-6, and 50 ng/mL TPO. iPSC-MDS HPCs cells were plated at 1–2×10⁴ cells per 3 ml MethoCult. Mixture was distributed into two 35 mm dishes and maintained in a humidified chamber for 14 days.
Senescence and cell cycle analysis.
Cultured HSPCs were stained for senescent cells using the β-galactosidase staining kit (Cell Signaling Technology) at pH 6.0 according to manufacturer’s protocol. Slides were placed in a humidity chamber sealed with parafilm and incubated overnight at 37 °C in a dry incubator. Slides were then imaged on EVOS Cell Imaging System (ThermoFisher Scientific) and at least 100 cells were counted for each condition. For cell cycle, cultured HSPCs were incubated with 10 μM EdU for 3 hours. Cells were then harvested and fixed (BD Cytofix) 15 min RT, permeabilized with BD Perm/Wash buffer for 15 mins, followed by EdU detection following Click-iT EdU cell proliferation kit protocol (ThermoFisher cat. 0023 C10340), and DNA detection with DAPI acquired in linear mode.
Flow cytometry.
Cell immunostaining was performed with up to 1×10⁶ cells in a total volume of 100 μl of buffer (PBS + 2% FBS) with antibodies diluted 1:50, for 20 minutes in the dark at room temperature. Acquisition was performed on the BD LSRII cytometer.
Neutrophil differentiation.
CB CD34+ cells were cultured in IMDM (ThermoFisher, cat. # 12440-053) + 20% FBS (Sigma, cat. # F0926) and 100 ng/mL G-CSF (Peprotech) for 12 days. Media was changed every 3–4 days. iPSC-MDS HPCs were cultured without doxycycline for 4 days in StemSpan SFEM + 50 ng/mL SCF, 50 ng/mL FLT3, 50 ng/mL TPO, 50 ng/mL IL-6, and 10 ng/mL IL-3. Cells were then transferred to IMDM + 20% FBS (Sigma) and 100 ng/mL G-CSF (Peprotech) for 6 days, with one media change at day 3. At the end of differentiation, neutrophils were labeled with CD66b-PE (BD, cat. # 561650) by incubating with the antibody for 10 min at RT, and neutrophils purified using the MACS CD66b+ selection column following kit protocol (Miltenyi, cat. # 130–048-801). Neutrophils were spun onto microscope slides (VWR, cat. # 48311–601) and stained with May-Grunwald and Giemsa stains.
Histological staining.
Cells were fixed and adhered to slides by cytospinning. Slides were immersed in May-Grunwald stain (Sigma, cat. # MG500) for 2 minutes. Slides were then transferred and immersed in Giemsa stain (Sigma, cat. # R03055) for 12 minutes, followed by two 30 second washes in water. The slides were air dried at room temperature and mounted.
Mouse transplantation.
NOD/LtSz−scidIL2Rgnull (NSG) (Jackson Labs) mice were bred and housed at the University of Washington animal care facility. Animal experiments were performed in accordance to institutional guidelines approved by UW animal care committee. Intra-femoral transplants were performed as previously described (Notta et al., 2011). Briefly, 8 – 14 week old mice were irradiated at 275 rads 24 hrs before transplant. To ensure consistency, only female mice were used. Prior to transplantation, mice were temporarily sedated with isoflurane. A 27g needle was used to drill the right femur (injected femur), and 20–30,000 CB CD34+ cells were transplanted in a 25 μl volume using a 29.5g insulin needle.
Human cell engraftment.
Mice were sacrificed after 14 weeks, and injected femur, and uninjected femur and tibiae were collected. Single cell suspension was prepared using standard flushing and cell dissociation techniques in 1 ml of IMDM. From that suspension, 100 μl of injected femur, 50 μl uninjected marrow (~1×10⁶ cells) were stained in a total volume of 200 μl staining buffer. Samples were not lysed with red blood cell lysis buffer as not to lyse human erythrocytes. Samples were stained with the 1:75 dilution the following antibodies: SytoxGreen live-dead stain (Thermo), CD33-PE (WM53; BD), CD45-APC (P67.6; BD), CD235a (11E4B-7–6; Coulter), CD19-BV605 (SJ25C1; BD), CD3-BV786 (SK7; BD), and CD66b-BV421 (G10F5; BD). All antibodies were confirmed as human-specific. Uninjected mouse marrow was used as a control for non-specific staining; CB mononuclear cells were used as a positive control. Compensation was performed using automated compensation with anti-mouse Igk and negative beads (BD Biosciences).
In vivo human HSPC analysis.
Transplanted human cord blood cells were harvested from mice 14 weeks post transplant. Cells harvested from 5 mice with equivalent engraftment for each condition were pooled and CD34+ cells isolated using the MACS selection column (Miltenyi, cat. #130–046-702). Cells were then stained with antibodies against human CD34-PE (581; BD), CD45RA-APC (HI100; BD), CD38-PC7 (HB7; BD), CD19-BV605 (SJ25C1; BD), CD10-BV786 (HI10a; BD), CD90-Biotin (5E10; BD) and analyzed on a BD FACS Aria III sorter.
AML LMNB1 expression analysis.
Publicly available data from the BeatAML cohort was obtained from the Vizome portal (www.vizome.org). Data from TCGA LAML cohort study was obtained from cBioPortal (www.cbioportal.org). Data from normal cells profiled by GTEX was extracted from the UCSC Xena (http://xena.ucsc.edu/). Transcript abundance was batch corrected to adjust for platform differences, and normalized RSEM data was used for analysis. TCGA somatic copy-number data were generated on Affymetrix SNP 6.0 arrays.
AML patient 5q deletion analysis.
AML patients treated at the Seattle Cancer Care Alliance and the University of Washington Medical Center were identified as having a del5q abnormality by karyotype (n=239). To identify the approximate regions of loss on chromosome 5 using the karyotyped cytoband estimates, the CytoConverter (Wang and LaFramboise, 2019) tool was used to convert the karyotypes to genomic coordinates. The bedtools package (Quinlan and Hall, 2010) intersect function was used to find patient deletions that span the LMNB1 locus (n=199). To estimate the most commonly deleted region on chromosome 5, the bedtools genomcov function was used to generate a histogram plot of chromosome 5 using unique, clonally distinct hemizygous deletions found in patients (n=214).
MDS patient neutrophil analysis.
MDS patients treated at the Seattle Cancer Care Alliance and the University of Washington Medical Center were matched by the IPSS score and grouped into cases or controls based on the clinical evaluation of the 5q23.2/LMNB1 deletion by both karyotype and array (CGAT) in >50% of the cells. Diagnostic patient peripheral blood smears were independently evaluated in a blinded fashion for the presence of either pelgeroid (bi-lobed) or monolobated neutrophils. The following scale was used: 0 (none), 1 (1–9% of the neutrophils), 2 (10–25% of the neutrophils), 3 (>25% of the neutrophils). The review was independently performed at the beginning for consensus (first 11 patients) by two expert hematopathologists.
Immunofluorescent staining.
Cells were harvested and fixed with Cytofix (BD, cat. # 554656) on ice for 30 min. Cells were washed with PBS then resuspended in a small volume and transferred to slides (VWR, cat. # 48311–601) coated with 0.5 mg/mL poly-D-lysine (Sigma, cat. #A-003-E). Cells are left to adhere to slides for at least 1 hour at room temperature in a humidity chamber. Excess PBS is gently tapped off the slide, and the cells are immersed in blocking buffer (5% normal goat serum in 0.1% TritonX PBS (PBS-T)) for 30 minutes at RT. The cells are then incubated with primary antibodies against LMNB1 (Abcam, ab16048; or ThermoFisher, 66095–1-iG), LBR (Abcam, ab32535), yH2AX (ThermoFisher, PA5–28778), and 53BP1 (CST, 2675) added to blocking buffer for 1 hour at RT, followed by 3 washes in PBS-T. Cells are then incubated with secondary antibodies (Alexafluor) for 45 minutes at RT, followed by 3 PBS washes. Slides are then mounted with Vectashield Antifade mounting medium with DAPI (Fisher, cat. # NC9524612). Slides were imaged on a Leica SP8X confocal microscope with a 63x oil immersion objective. Image stacks were analyzed using Fiji/ImageJ software.
Micronuclei assay.
CB or MDS HPCs (not synchronized) were cultured with 10 μM EdU (ThermoFisher, cat. # C10640) for 4 hours to label cycling cells. Cells were washed and culture media was replaced with media treated with DMSO vehicle (Santa Cruz Biotech, cat. # SC-358801), 100 μM monastrol (Sigma, cat. # M8515) or 300 nM nocodazole (Sigma, cat. # 487929-M) for 3 hours. Drugs were then washed off and cells were released from the mitotic block for 12 hours, after which they were fixed and immunostained. Only nuclei positive for EdU were scored in the analysis.
Image analysis.
To quantitate γH2AX and 53BP1 foci, nuclei were selected based on DAPI, excluding cells undergoing apoptosis based on nuclear morphology. The image analysis workflow was as follows: Z project stack, subtract background (rolling 5 pixel radius), adjust brightness/contrast, threshold to make binary, watershed, and analyze particles 0.1–4 um2 per DAPI-selected ROI. To quantitate LMNB1 levels in the nuclear envelope: MDS HPCs were immunostained for LMNB1 (Abcam, ab16048) and imaged. Analysis was conducted using Image J software. Two representative cells were analyzed by using the line tool to draw a diagonal line across the cell and generate the fluorescence pixel intensity as a function of distance along the line. The average fluorescence intensity per cell was then quantified for >35 cells of each genotype.
Irradiation and neutral COMET assay.
Cells were irradiated at a dose of 400 rads (4Gy) and cultured in complete media for desired duration. At desired time points after irradiation, cells were harvested and processed using the Trevigen neutral COMET assay kit following the kit protocol (Trevigen, MD, cat. # 4250–050-K). Cells were mixed with low melting point agarose and pipetted onto pre-coated slides and placed at 4°C until solidified. Then slides were placed in pre-chilled lysis solution overnight at 4°C. Following lysis, slides underwent gel electrophoresis in 1x Neutral Electrophoresis Buffer at 17 V for 45 min. The slides were then immersed in DNA Precipitation Solution for 30 min at RT, followed by immersion in 70% Ethanol for 30 minutes at RT. Dried slides were then stained with SYBR Green (Fisher, cat. # S7563), rinsed briefly in water, and dried at 37°C. Slides were visualized with the EVOS Cell Imaging System (ThermoFisher Scientific). Images were taken with the EVOS 10x objective and quantified for comets flagged by the OpenComet software as “normal”. Some abnormal comets were manually excluded.
Single cell RNA sequencing.
Transplanted human CB cells were harvested from mice 14 weeks post-transplant. Cells harvested from 5 mice with equivalent engraftment for each condition were pooled and CD34+ cells isolated using the MACS selection column (Miltenyi, cat. #130–046-702). Cells were then stained with the CD34-PE antibody (BD, cat. #555822) and CD34+ cells were further purified by flow sorting on a BD FACS Aria III sorter. Single cell sequencing was performed using the 10X Chromium Next GEM Single Cell 3’ Reagents kit v.3.1 on a Chromium Controller.
Single cell RNA sequencing analysis.
After alignment to hg38 using the 10X genomics Cell Ranger count tool, cells with < 10 percent mitochondrial UMI reads > 50,000 and < 100 UMI reads were filtered from both datasets. The Monocle3 R package (Cao et al., 2019) was used to perform dimensional reduction, UMAP generation, clustering (resolution = 6e-4, seed = 42), and trajectory analysis. For comparison of the dataset to the Atlas of human Blood Cells (ABC) (Xie et al., 2020), the SingleR (Aran et al., 2019) reference-based scRNAseq annotation tool was used based on the annotated immunophenotypes in the ABC reference. Differential gene expression analysis was performed for each indicated cell type using regression analysis based on the dataset of origin, with a q-value (Benjamini/Hochberg) < 0.05. Cell cycle status was determined using Seurat (Stuart et al., 2019).
Bulk RNA sequencing.
Human CB HSPCs were transduced with lentiviral vectors and expanded for 6 days in StemSpan SFEM (StemCell Technologies) with 50 ng/mL SCF, 50 ng/mL FLT3, 50 ng/mL TPO, 50 ng/mL IL-6, and 10 ng/mL IL-3 (Peprotech). CD34+ cells were purified using a MACS column (Miltenyi, cat. #130–046-702), and 2×10⁵ cells for each condition resuspended in Trizol (ThermoFisher, cat. #15596026). Library preparation and sequencing was performed at Genewiz using the standard pipeline. Samples were processed on the Illumina HiSeq platform in the 2×150bp configuration with 20–30 million reads per sample. Reads were aligned to hg38 using STAR and counted with the Subreads package (Dobin et al., 2013; Liao et al., 2013). Differential gene expression was determined using the DESeq2 package (Love et al., 2014). Gene set enrichment analysis (GSEA) was performed on the Gene Ontology datasets in the Broad MSigDB (https://www.broadinstitute.org/msigdb). Datasets with FDR < 0.05 were considered significantly enriched. Metascape (Zhou et al., 2019) was also used to generate GO terms from significantly downregulated genes.
Hi-C data processing.
Hi-C data were processed using Juicer (Durand et al., 2016) with the default parameters. For each of the 12 libraries, the .fastq files from two runs were merged, followed by merging of biological duplicates. Adapter trimming (adapter sequence: 5’GGTGAGGCTGAGGGATC3’) was performed by cutadapt and reads shorter than 20bp after adapter removal were discarded. Reads were mapped to reference human genome assembly hg38 using BWA. PCR duplicates or reads with mapping quality score (MAPQ) <30 were removed. Then the valid read pairs were binned and counted in matrices of 5kb, 10kb, 25kb, 50kb, 100kb, and 250kb resolution. KR normalization was used to correct bias and generate balanced Hi-C interaction matrices for subsequent analyses. Contact matrices and virtual 4C tracks by pileup of 5kb bins were generated using Juicebox (Robinson et al., 2018). For contact frequency length plots, intrachromosomal contacts were called using the juicer_tools dump command at the stated bp resolution with KR normalization. The mean frequency was calculated for each increment length and a line of best fit drawn using the loess function in R.
A/B compartment calling.
A/B compartments calling were performed per chromosome from KR normalized intra-chromosomal Hi-C matrix at 100kb resolution. First, O/E (observed/expected) matrix was calculated. Then we transformed the O/E matrix into a z-score matrix, which was then converted to a Pearson correlation matrix. PCA (principal component analysis) was performed on the correlation matrix and the first eigenvector (PC1) of the PCA was used to identify A/B compartments. For each chromosome, the assigning of eigenvector sign orientation (positive or negative) to correct A/B compartments was done by counting gene density such that A compartment was more gene-rich than B compartment.
TAD calling.
We used both insulation score and directionality index (DI) to call TADs (topologically associating domains). Insulation score analysis was performed as previously reported (Crane et al., 2015). Hi-C interaction matrices at 10kb resolution were used. As for parameters, insulation delta span (-ids) was set to 250kb, and insulationSquareSize (-is) was set to 100kb. Other parameters were the same as the original paper. We also calculated directionality index (DI) as previously reported (Dixon et al., 2012) to identify TADs. The directionality index is calculated as the degree of upstream or downstream bias. Similar to the insulation score, Hi-C interaction matrices at 10kb resolution were used and the window size of upstream/downstream patterns is set to 1Mb. Then we used a hidden Markov model (HMM) to determine the directionality bias and TADs from the calculated directionality index. The mean insulation score at TAD boundaries was generated using deepTools (Ramírez et al., 2016).
Loop calling.
HOMER (Heinz et al., 2010) was used to identify chromatin loops from Hi-C data. Briefly, loops are identified as significant interactions as two regions interact at a high frequency with one another. Hi-C interaction matrices at 10kb resolution were used. Overlapping window size (-window) was set to 25kb and maximum interaction distance (-maxDist) was set to 5Mb. GREAT was used to associate the two closest genes with loops (McLean et al., 2010).
QUANTIFICATION AND STATISTICAL ANALYSIS
Statistical analysis was performed with GraphPad Prism software. Data are shown as the mean with standard deviation from the mean unless noted. Statistical test used for each experiment is indicated in the figure legend. For all analyses, p < 0.05 was considered statistically significant. Investigators were not blinded to the different groups.
Supplementary Material
Key resources table.
| REAGENT or RESOURCE | SOURCE | IDENTIFIER |
|---|---|---|
| Antibodies | ||
| CD33-PE; clone WM53 | BD | cat#: 555450 |
| CD19-BV605; clone SJ25C1 | BD | cat#: 562654 |
| CD11b-APC; clone ICRF44 | BD | cat#: 561015 |
| CD56-APCR700; clone NCAM16.2 | BD | cat#: 565140 |
| CD66b-PE; clone G10F5 | BD | cat#: 561650 |
| CD66b-BV421; clone G10F5 | BD | cat#: 562940 |
| CD45-APC; clone HI30 | BD | cat#: 555485 |
| CD235a-PECy7; clone 11E4B-7-6 | Coulter | cat#: A71564 |
| CD3-BV786; clone SK7 | BD | cat#: 563800 |
| CD34-PE; clone 581 | BD | cat#: 555822 |
| CD45RA-APC; clone HI100 | BD | cat#: 550855 |
| CD38-PECy7; clone HB7 | BD | cat#: 335790 |
| CD10-BV786; clone HI10a | BD | cat#: 564960 |
| CD90-Biotin; clone 5E10 | BD | cat#: 555594 |
| Anti-LMNB1 | Abcam | cat#: ab16048 |
| Anti-LBR | Abcam | cat#: ab32535 |
| Anti-yH2AX | ThermoFisher | cat#: PA5-28778 |
| Anti-53BP1 | Cell Signaling | cat#: 2675 |
| Bacterial and virus strains | ||
| Stbl3 competent cells | ThermoFisher | cat#: C737303 |
| Biological samples | ||
| Human umbilical cord blood | Bloodworks Northwest | https://www.bloodworksnw.org/ |
| Human mobilized peripheral blood Primary AML samples | Fred Hutch CCEH core | https://www.fredhutch.org/en/research/divisions/clinical-research-division/research/co-operative-center-for-excellence-in-hematology/hematopoietic-cell-procurement-and-resource-development.html |
| Chemicals, peptides, and recombinant proteins | ||
| Ficoll-Paque Plus | GE | cat#:17-1440-02/6 |
| Retronectin | Takara | cat#: T100A |
| Recombinant human cytokines | Peprotech | https://www.peprotech.com/gb/ |
| Recombinant human BMP-4 | R&D Systems | cat#: 314-BP-050 |
| Recombinant human IL-7 | R&D Systems | cat#: 207-IL-010 |
| Doxycycline | Sigma | cat#: D9891-10G |
| SytoxGreen live-dead stain | ThermoFisher | cat#: S34860 |
| poly-D-lysine | Sigma | cat#: A-003-E |
| Vectashield Antifade | Vector labs | cat#: H-1200 |
| EdU | ThermoFisher | cat#: C10640 |
| DMSO | Santa Cruz | cat#: 487929-M |
| Monastrol | Sigma | cat#: M8515 |
| Nocodazole | Sigma | cat#: 487929-M |
| Trizol | ThermoFisher | cat#: 15596026 |
| Critical commercial assays | ||
| CD34 Microbead kit | Miltenyi | cat#: 130-046-702 |
| MethoCult | Stem Cell Technologies | cat#: H3434 |
| Gateway LR clonase | ThermoFisher | cat#: 11791020 |
| Anti-PE microbead kit | Miltenyi | cat#: 130-048-801 |
| May-Grunwald stain | Sigma | cat#: MG500 |
| Giemsa stain | Sigma | cat#: R03055 |
| anti-mouse Igk beads | BD | cat#: 552843 |
| Cytofix | BD | cat#: 554656 |
| Trevigen neutral COMET | Trevigen | cat#: 4250-050-K |
| Chromium Next GEM Single Cell 3’ Reagents kit v.3.1 | 10X technologies | cat#: PN-1000123 |
| Deposited data | ||
| BeatAML patient dataset | Tyner et al. 2018 | www.vizome.org |
| TCGA LAML patient dataset | TCGA | www.cbioportal.org |
| GTEX dataset | GTEX | http://xena.ucsc.edu/ |
| Atlas of human Blood Cells | Xie et al., 2020 | http://scrna.sklehabc.com/ |
| The raw and processed RNA-seq, single cell RNA-seq, and Hi-C data generated in this study | This paper | GSE174533 |
| Gene expression data for iPSC-MDS HPCs | Hsu et al. 2019 | GSE129851 |
| Experimental models: Cell lines | ||
| TP53+/− and TP53+/−/del5q iPSC lines | This paper | - |
| 293T-17 cells | ATCC | cat#: CRL-11268 |
| MS-5 stromal cells | Dr. Katsuhiko Itoh | - |
| Experimental models: Organisms/strains | ||
| NOD/LtSz−scidIL2Rgnull (NSG) mice | Jackson labs | cat#: 005557 |
| NOD.Cg-Prkdcscid Il2rgtm1Wjl Tg(CMV-IL3,CSF2,KITLG)1Eav/MloySzJ | Jackson labs | cat#: 013062 |
| Oligonucleotides | ||
| Control Luciferase shRNA #1, 5’ACGCTGAGTACTTCGAAATGT | IDT Technologies | Custom order |
| Control Luciferase shRNA #2: 5’CTTACGCTGAGTACTTCGA | IDT Technologies | Custom order |
| LMNB1 75% knockdown shRNA: 5’-GCATGAGAATTGAGAGCCTTT | Sigma TRC | TRCN0000029271 |
| LMNB1 50% knockdown shRNA: 5’-CCCAGATCAAGCTTCGAGAAT | Sigma TRC | TRCN0000029273 |
| qPCR primer LMNB1 Fwd 5’-AAGAACCAGAACTCGTGGGG | This paper | N/A |
| qPCR primer LMNB1 Rev 5’-CAACCTCCTCTCCCTGAGAAT | This paper | N/A |
| qPCR primer GAPDH Fwd 5’-TCCTGCACCACCAACTGCTTA | This paper | N/A |
| qPCR primer GAPDH Rev 5’-TCTTCTGGGTGGCAGTGATGG | This paper | N/A |
| Recombinant DNA | ||
| HOAX9, ERG, RORA, SOX4, MYB (5F) plasmids | Addgene | https://www.addgene.org/George_Daley/ |
| LMNB1 lentiviral overexpression plasmid | Sigma | TRCN0000467310 |
| pSMAL lentiviral vector | Dr. Peter van Galen | Addgene |
| LMNB1 gateway ORF | Genecopoeia | cat#: GC-I3724 |
| pLKO.1 shRNA empty vector | Addgene | cat#: 10878 |
| pLKO.1 shRNA vectors for LMNB1 knockdown | This paper | - |
| Lentiviral packaging plasmids | Addgene | https://www.addgene.org/Didier_Trono/ |
| Software and algorithms | ||
| FlowJo | BD Biosciences | https://www.flowjo.com/ |
| Fiji/ImageJ | Schindelin et al. 2012 | https://imagej.nih.gov/ij/ |
| GraphPad Prism | GraphPad | https://www.graphpad.com/ |
| OpenComet software | Gyori et al., 2014 | cometbio.org |
| Cell Ranger | 10X genomics | https://support.10xgenomics.com/single-cell-gene-expression/software/pipelines/latest/what-is-cell-ranger |
| Monocle3 | Cao et al., 2019 | https://cole-trapnell-lab.github.io/monocle3/ |
| SingleR | Aran et al., 2019 | https://bioconductor.org/packages/release/bioc/html/SingleR.html |
| DESeq2 | Love et al., 2014 | https://bioconductor.org/packages/release/bioc/html/DESeq2.html |
| GSEA | Subramanian et al., 2005 | https://www.broadinstitute.org/msigdb |
| Samtools | Li et al., 2009 | http://samtools.sourceforge.net/ |
| STAR | Dobin et al., 2013 | https://github.com/alexdobin/STAR |
| Subread | Liao et al., 2013 | http://subread.sourceforge.net/ |
| CytoConverter | Wang and LaFramboise, 2019 | https://jxw773.shinyapps.io/Cytogenetic__software/ |
| bedtools | Quinlan and Hall, 2010 | https://bedtools.readthedocs.io/en/latest/ |
| Metascape | Zhou et al., 2019 | https://metascape.org |
| Juicer | Durand et al., 2016 | https://github.com/aidenlab/juicer |
| Juicebox | Robinson et al., 2018 | https://github.com/aidenlab/Juicebox |
| deepTools | Ramírez et al., 2016 | https://deeptools.readthedocs.io/en/develop/ |
| HOMER | Heinz et al., 2010 | http://homer.ucsd.edu/homer/ |
| Other | ||
| X-VIVO 10 media | Lonza | cat#: 04-380Q |
| StemSpan SFEM media | StemCell Technologies | cat#: 9650 |
| H5100 media | StemCell Technologies | cat#: 05150 |
Highlights.
Lamin B1 (LMNB1) gene is commonly deleted in myeloid malignancies.
Loss of lamin B1 promotes self renewal and myeloid-biased hematopoiesis.
Loss of lamin B1 causes acquired Pelger-Huet neutrophil nuclear anomaly.
Loss of lamin B1 alters 3D genome organization in HSPCs and neutrophils.
ACKNOWLEDGEMENTS
The authors acknowledge the life and legacy of Elihu H. Estey, deceased on 8 October 2021, a brilliant clinician, scientist, and mentor. The authors would like to thank the Doulatov lab, E. Laurenti and Laurenti lab (University of Cambridge, UK) and R.L. Levine and Levine lab (Memorial Sloan Kettering Cancer Center) for discussion; Xiaoping Wu (Pathology Flow Core) and Nathaniel Peters (Keck Imaging Center) for technical assistance. S.D. is supported by the NIH/NHLBI (R01 HL151651), NIH New Innovator Award (DP2 HL147126), NIH/NHLBI (R21 HL139864), EvansMDS Discovery Research Grant, Wayne D. Kuni and Joan E. Kuni Foundation Discovery Grant, and American Society of Hematology Scholar Award. A.R. is supported by the T32 Hematology training grant (T32 HL007093). J.L.A. is supported by the NIH/NHLBI (R01 HL031823). This research was supported in part by the NIH/NCI (Cancer Center Grant P30 CA015704) and Seattle Translational Tumor Research (STTR) grant.
Footnotes
DECLARATIONS OF INTEREST
The authors declare no competing financial interests.
Publisher's Disclaimer: This is a PDF file of an unedited manuscript that has been accepted for publication. As a service to our customers we are providing this early version of the manuscript. The manuscript will undergo copyediting, typesetting, and review of the resulting proof before it is published in its final form. Please note that during the production process errors may be discovered which could affect the content, and all legal disclaimers that apply to the journal pertain.
REFERENCES
- Aran D, Looney AP, Liu L, Wu E, Fong V, Hsu A, Chak S, Naikawadi RP, Wolters PJ, Abate AR, et al. (2019). Reference-based analysis of lung single-cell sequencing reveals a transitional profibrotic macrophage. Nature Immunology 20, 163–172. 10.1038/s41590-018-0276-y. [DOI] [PMC free article] [PubMed] [Google Scholar]
- Arber DA, Orazi A, Hasserjian R, Thiele J, Borowitz MJ, Le Beau MM, Bloomfield CD, Cazzola M, and Vardiman JW (2016). The 2016 revision to the World Health Organization classification of myeloid neoplasms and acute leukemia. Blood 127, 2391–2405. 10.1182/blood-2016-03-643544. [DOI] [PubMed] [Google Scholar]
- Arnould C, Rocher V, Finoux A-L, Clouaire T, Li K, Zhou F, Caron P, Mangeot PE, Ricci EP, Mourad R, et al. (2021). Loop extrusion as a mechanism for formation of DNA damage repair foci. Nature 590, 660–665. 10.1038/s41586-021-03193-z. [DOI] [PMC free article] [PubMed] [Google Scholar]
- Best S, Salvati F, Kallo J, Garner C, Height S, Thein SL, and Rees DC (2003). Lamin B-receptor mutations in Pelger-Huet anomaly. Br J Haematol 123, 542–544. 10.1046/j.1365-2141.2003.04621.x. [DOI] [PubMed] [Google Scholar]
- Bin Imtiaz MK, Jaeger BN, Bottes S, Machado RAC, Vidmar M, Moore DL, and Jessberger S (2021). Declining lamin B1 expression mediates age-dependent decreases of hippocampal stem cell activity. Cell Stem Cell 28, 967–977.e968. 10.1016/j.stem.2021.01.015. [DOI] [PubMed] [Google Scholar]
- Bowman RL, Busque L, and Levine RL (2018). Clonal Hematopoiesis and Evolution to Hematopoietic Malignancies. Cell Stem Cell 22, 157–170. 10.1016/j.stem.2018.01.011 [DOI] [PMC free article] [PubMed] [Google Scholar]
- Broers JLV, Raymond Y, Rot MK, Kuijpers H, Wagenaar SS, and Ramaekers FCS (1993). Nuclear A-type lamins are differentially expressed in human lung cancer subtypes. American Journal of Pathology 143, 211–220. 10.1016/0169-5002(91)91427-d. [DOI] [PMC free article] [PubMed] [Google Scholar]
- Butin-Israeli V, Adam SA, Jain N, Otte GL, Neems D, Wiesmüller L, Berger SL, and Goldman RD (2015). Role of lamin b1 in chromatin instability. Mol Cell Biol 35, 884–898. 10.1128/MCB.01145-14. [DOI] [PMC free article] [PubMed] [Google Scholar]
- Cao J, Spielmann M, Qiu X, Huang X, Ibrahim DM, Hill AJ, Zhang F, Mundlos S, Christiansen L, Steemers FJ, et al. (2019). The single-cell transcriptional landscape of mammalian organogenesis. Nature 566, 496–502. 10.1038/s41586-019-0969-x. [DOI] [PMC free article] [PubMed] [Google Scholar]
- Chen JY, Miyanishi M, Wang SK, Yamazaki S, Sinha R, Kao KS, Seita J, Sahoo D, Nakauchi H, and Weissman IL (2016). Hoxb5 marks long-term haematopoietic stem cells and reveals a homogenous perivascular niche. Nature 530, 223–227. 10.1038/nature16943. [DOI] [PMC free article] [PubMed] [Google Scholar]
- Chen NY, Yang Y, Weston TA, Belling JN, Heizer P, Tu Y, Kim P, Edillo L, Jonas SJ, Weiss PS, et al. (2019). An absence of lamin B1 in migrating neurons causes nuclear membrane ruptures and cell death. Proceedings of the National Academy of Sciences of the United States of America 116, 25870–25879. 10.1073/pnas.1917225116. [DOI] [PMC free article] [PubMed] [Google Scholar]
- Cimini D, Howell B, Maddox P, Khodjakov A, Degrassi F, and Salmon ED (2001). Merotelic kinetochore orientation is a major mechanism of aneuploidy in mitotic mammalian tissue cells. Journal of Cell Biology 152, 517–527. 10.1083/jcb.153.3.517. [DOI] [PMC free article] [PubMed] [Google Scholar]
- Collins PL, Purman C, Porter SI, Nganga V, Saini A, Hayer KE, Gurewitz GL, Sleckman BP, Bednarski JJ, Bassing CH, and Oltz EM (2020). DNA double-strand breaks induce H2Ax phosphorylation domains in a contact-dependent manner. Nature Communications 11. 10.1038/s41467-020-16926-x. [DOI] [PMC free article] [PubMed] [Google Scholar]
- Crane E, Bian Q, McCord RP, Lajoie BR, Wheeler BS, Ralston EJ, Uzawa S, Dekker J, and Meyer BJ (2015). Condensin-driven remodelling of X chromosome topology during dosage compensation. Nature 523, 240–244. 10.1038/nature14450. [DOI] [PMC free article] [PubMed] [Google Scholar]
- Cristofoli F, Moss T, Moore HW, Devriendt K, Flanagan-Steet H, May M, Jones J, Roelens F, Fons C, Fernandez A, et al. (2020). De Novo Variants in LMNB1 Cause Pronounced Syndromic Microcephaly and Disruption of Nuclear Envelope Integrity. American Journal of Human Genetics 107, 753–762. 10.1016/j.ajhg.2020.08.015. [DOI] [PMC free article] [PubMed] [Google Scholar]
- Cunningham JM, Patnaik MM, Hammerschmidt DE, and Vercellotti GM (2009). Historical perspective and clinical implications of the Pelger-Huet cell. American Journal of Hematology 84, 116–119. 10.1002/ajh.21320. [DOI] [PubMed] [Google Scholar]
- De Sandre-Giovannoli A, Bernard R, Cau P, Navarro C, Amiel J, Boccaccio I, Lyonnet S, Stewart CL, Munnich A, Le Merrer M, and Lévy N (2003). Lamin a truncation in Hutchinson-Gilford progeria. Science 300, 2055. 10.1126/science.1084125. [DOI] [PubMed] [Google Scholar]
- Dechat T, Pfleghaar K, Sengupta K, Shimi T, Shumaker DK, Solimando L, and Goldman RD (2008). Nuclear lamins: major factors in the structural organization and function of the nucleus and chromatin. Genes Dev 22, 832–853. 10.1101/gad.1652708. [DOI] [PMC free article] [PubMed] [Google Scholar]
- Dixon JR, Selvaraj S, Yue F, Kim A, Li Y, Shen Y, Hu M, Liu JS, and Ren B (2012). Topological domains in mammalian genomes identified by analysis of chromatin interactions. Nature 485, 376–380. 10.1038/nature11082. [DOI] [PMC free article] [PubMed] [Google Scholar]
- Dobin A, Davis CA, Schlesinger F, Drenkow J, Zaleski C, Jha S, Batut P, Chaisson M, and Gingeras TR (2013). STAR: ultrafast universal RNA-seq aligner. Bioinformatics 29, 15–21. 10.1093/bioinformatics/bts635. [DOI] [PMC free article] [PubMed] [Google Scholar]
- Doulatov S, Notta F, Eppert K, Nguyen LT, Ohashi PS, and Dick JE (2010). Revised map of the human progenitor hierarchy shows the origin of macrophages and dendritic cells in early lymphoid development. Nat Immunol 11, 585–593. 10.1038/ni.1889. [DOI] [PubMed] [Google Scholar]
- Doulatov S, Notta F, Laurenti E, and Dick JE (2012). Hematopoiesis: a human perspective. Cell Stem Cell 10, 120–136. 10.1016/j.stem.2012.01.006. [DOI] [PubMed] [Google Scholar]
- Durand NC, Shamim MS, Machol I, Rao SS, Huntley MH, Lander ES, and Aiden EL (2016). Juicer Provides a One-Click System for Analyzing Loop-Resolution Hi-C Experiments. Cell Syst 3, 95–98. 10.1016/j.cels.2016.07.002. [DOI] [PMC free article] [PubMed] [Google Scholar]
- Ebert BL (2009). Deletion 5q in myelodysplastic syndrome: a paradigm for the study of hemizygous deletions in cancer. Leukemia 23, 1252–1256. 10.1038/leu.2009.53. [DOI] [PubMed] [Google Scholar]
- Ebert BL, Pretz J, Bosco J, Chang CY, Tamayo P, Galili N, Raza A, Root DE, Attar E, Ellis SR, and Golub TR (2008). Identification of RPS14 as a 5q- syndrome gene by RNA interference screen. Nature 451, 335–339. 10.1038/nature06494. [DOI] [PMC free article] [PubMed] [Google Scholar]
- Eriksson M, Brown WT, Gordon LB, Glynn MW, Singer J, Scott L, Erdos MR, Robbins CM, Moses TY, Berglund P, et al. (2003). Recurrent de novo point mutations in lamin A cause Hutchinson-Gilford progeria syndrome. Nature 423, 293–298. 10.1038/nature01629. [DOI] [PMC free article] [PubMed] [Google Scholar]
- Fenech M (2007). Cytokinesis-block micronucleus cytome assay. Nature Protocols 2, 1084–1104. 10.1038/nprot.2007.77. [DOI] [PubMed] [Google Scholar]
- Fischbach NA, Rozenfeld S, Shen W, Fong S, Chrobak D, Ginzinger D, Kogan SC, Radhakrishnan A, Le Beau MM, Largman C, and Lawrence HJ (2005). HOXB6 overexpression in murine bone marrow immortalizes a myelomonocytic precursor in vitro and causes hematopoietic stem cell expansion and acute myeloid leukemia in vivo. Blood 105, 1456–1466. 10.1182/blood-2004-04-1583. [DOI] [PubMed] [Google Scholar]
- Fischer EG (2020). Nuclear Morphology and the Biology of Cancer Cells. Acta Cytol 64, 511–519. 10.1159/000508780. [DOI] [PubMed] [Google Scholar]
- Fishilevich S, Nudel R, Rappaport N, Hadar R, Plaschkes I, Iny Stein T, Rosen N, Kohn A, Twik M, Safran M, et al. (2017). GeneHancer: genome-wide integration of enhancers and target genes in GeneCards. Database (Oxford) 2017. 10.1093/database/bax028. [DOI] [PMC free article] [PubMed] [Google Scholar]
- Goardon N, Marchi E, Atzberger A, Quek L, Schuh A, Soneji S, Woll P, Mead A, Alford KA, Rout R, et al. (2011). Coexistence of LMPP-like and GMP-like leukemia stem cells in acute myeloid leukemia. Cancer Cell 19, 138–152. 10.1016/j.ccr.2010.12.012. [DOI] [PubMed] [Google Scholar]
- Grimwade D, Hills RK, Moorman AV, Walker H, Chatters S, Goldstone AH, Wheatley K, Harrison CJ, Burnett AK, and National Cancer Research Institute Adult Leukaemia Working, G. (2010). Refinement of cytogenetic classification in acute myeloid leukemia: determination of prognostic significance of rare recurring chromosomal abnormalities among 5876 younger adult patients treated in the United Kingdom Medical Research Council trials. Blood 116, 354–365. 10.1182/blood-2009-11-254441. [DOI] [PubMed] [Google Scholar]
- Guelen L, Pagie L, Brasset E, Meuleman W, Faza MB, Talhout W, Eussen BH, de Klein A, Wessels L, de Laat W, and van Steensel B (2008). Domain organization of human chromosomes revealed by mapping of nuclear lamina interactions. Nature 453, 948951. 10.1038/nature06947. [DOI] [PubMed] [Google Scholar]
- Gyori BM, Venkatachalam G, Thiagarajan PS, Hsu D, and Clement MV (2014). OpenComet: an automated tool for comet assay image analysis. Redox Biol 2, 457–465. 10.1016/j.redox.2013.12.020. [DOI] [PMC free article] [PubMed] [Google Scholar]
- Haase D, Germing U, Schanz J, Pfeilstöcker M, Nösslinger T, Hildebrandt B, Kundgen A, Lübbert M, Kunzmann R, Giagounidis AA, et al. (2007). New insights into the prognostic impact of the karyotype in MDS and correlation with subtypes: evidence from a core dataset of 2124 patients. Blood 110, 4385–4395. 10.1182/blood-2007-03-082404. [DOI] [PubMed] [Google Scholar]
- Hatch EM, Fischer AH, Deerinck TJ, and Hetzer MW (2013). Catastrophic nuclear envelope collapse in cancer cell micronuclei. Cell 154, 47–60. 10.1016/j.cell.2013.06.007. [DOI] [PMC free article] [PubMed] [Google Scholar]
- Heinz S, Benner C, Spann N, Bertolino E, Lin YC, Laslo P, Cheng JX, Murre C, Singh H, and Glass CK (2010). Simple combinations of lineage-determining transcription factors prime cis-regulatory elements required for macrophage and B cell identities. Mol Cell 38, 576–589. 10.1016/j.molcel.2010.05.004. [DOI] [PMC free article] [PubMed] [Google Scholar]
- Hernandez-Segura A, de Jong TV, Melov S, Guryev V, Campisi J, and Demaria M (2017). Unmasking Transcriptional Heterogeneity in Senescent Cells. Curr Biol 27, 2652–2660.e2654. 10.1016/j.cub.2017.07.033. [DOI] [PMC free article] [PubMed] [Google Scholar]
- Hoffmann K, Dreger CK, Olins AL, Olins DE, Shultz LD, Lucke B, Karl H, Kaps R, Muller D, Vaya A, et al. (2002). Mutations in the gene encoding the lamin B receptor produce an altered nuclear morphology in granulocytes (Pelger-Huet anomaly). Nat Genet 31, 410–414. 10.1038/ng925. [DOI] [PubMed] [Google Scholar]
- Hoffmann K, Sperling K, Olins AL, and Olins DE (2007). The granulocyte nucleus and lamin B receptor: avoiding the ovoid. Chromosoma 116, 227–235. 10.1007/s00412-007-00948. [DOI] [PubMed] [Google Scholar]
- Horrigan SK, Arbieva ZH, Xie HY, Kravarusic J, Fulton NC, Naik H, Le TT, and Westbrook CA (2000). Delineation of a minimal interval and identification of 9 candidates for a tumor suppressor gene in malignant myeloid disorders on 5q31. Blood 95, 2372–2377. 10.1182/blood.v95.7.2372. [DOI] [PubMed] [Google Scholar]
- Hosono N, Makishima H, Mahfouz R, Przychodzen B, Yoshida K, Jerez A, LaFramboise T, Polprasert C, Clemente MJ, Shiraishi Y, et al. (2017). Recurrent genetic defects on chromosome 5q in myeloid neoplasms. Oncotarget 8, 6483–6495. 10.18632/oncotarget.14130. [DOI] [PMC free article] [PubMed] [Google Scholar]
- Hsu J, Reilly A, Hayes BJ, Clough CA, Konnick EQ, Torok-Storb B, Gulsuner S, Wu D, Becker PS, Keel SB, et al. (2019). Reprogramming identifies functionally distinct stages of clonal evolution in myelodysplastic syndromes. Blood. 10.1182/blood.2018884338. [DOI] [PMC free article] [PubMed] [Google Scholar]
- Hsu JI, Dayaram T, Tovy A, De Braekeleer E, Jeong M, Wang F, Zhang J, Heffernan TP, Gera S, Kovacs JJ, et al. (2018). PPM1D Mutations Drive Clonal Hematopoiesis in Response to Cytotoxic Chemotherapy. Cell Stem Cell 23, 700–713.e706. 10.1016/j.stem.2018.10.004. [DOI] [PMC free article] [PubMed] [Google Scholar]
- Janssen A, van der Burg M, Szuhai K, Kops GJ, and Medema RH (2011). Chromosome segregation errors as a cause of DNA damage and structural chromosome aberrations. Science 333, 1895–1898. 10.1126/science.1210214. [DOI] [PubMed] [Google Scholar]
- Jeggo PA, Pearl LH, and Carr AM (2016). DNA repair, genome stability and cancer: a historical perspective. Nat Rev Cancer 16, 35–42. 10.1038/nrc.2015.4. [DOI] [PubMed] [Google Scholar]
- Jia Y, Vong JSL, Asafova A, Garvalov BK, Caputo L, Cordero J, Singh A, Boettger T, Günther S, Fink L, et al. (2019). Lamin B1 loss promotes lung cancer development and metastasis by epigenetic derepression of RET. Journal of Experimental Medicine 216, 1377–1395. 10.1084/jem.20181394. [DOI] [PMC free article] [PubMed] [Google Scholar]
- Karoutas A, and Akhtar A (2021). Functional mechanisms and abnormalities of the nuclear lamina. Nat Cell Biol 23, 116–126. 10.1038/s41556-020-00630-5. [DOI] [PubMed] [Google Scholar]
- Kim Y, Sharov AA, McDole K, Cheng M, Hao H, Fan CM, Gaiano N, Ko MSH, and Zheng Y (2011). Mouse B-Type Lamins Are Required for Proper Organogenesis But Not by Embryonic Stem Cells. Science 334, 1706–1710. 10.1126/science.1211222. [DOI] [PMC free article] [PubMed] [Google Scholar]
- Kloetgen A, Thandapani P, Tsirigos A, and Aifantis I (2019). 3D Chromosomal Landscapes in Hematopoiesis and Immunity. Trends Immunol 40, 809–824. 10.1016/j.it.2019.07.003. [DOI] [PMC free article] [PubMed] [Google Scholar]
- Klymenko T, Bloehdorn J, Bahlo J, Robrecht S, Akylzhanova G, Cox K, Estenfelder S, Wang J, Edelmann J, Strefford JC, et al. (2018). Lamin B1 regulates somatic mutations and progression of B-cell malignancies. Leukemia 32, 364–375. 10.1038/leu.2017.255. [DOI] [PMC free article] [PubMed] [Google Scholar]
- Kronke J, Fink EC, Hollenbach PW, MacBeth KJ, Hurst SN, Udeshi ND, Chamberlain PP, Mani DR, Man HW, Gandhi AK, et al. (2015). Lenalidomide induces ubiquitination and degradation of CK1alpha in del(5q) MDS. Nature 523, 183–188. 10.1038/nature14610. [DOI] [PMC free article] [PubMed] [Google Scholar]
- Kulasekararaj AG, Smith AE, Mian SA, Mohamedali AM, Krishnamurthy P, Lea NC, Gaken J, Pennaneach C, Ireland R, Czepulkowski B, et al. (2013). TP53 mutations in myelodysplastic syndrome are strongly correlated with aberrations of chromosome 5, and correlate with adverse prognosis. Br J Haematol 160, 660–672. 10.1111/bjh.12203. [DOI] [PubMed] [Google Scholar]
- Lai F, Godley LA, Joslin J, Fernald AA, Liu J, Espinosa R, Zhao N, Pamintuan L, Till BG, Larson RA, et al. (2001). Transcript map and comparative analysis of the 1.5-Mb commonly deleted segment of human 5q31 in malignant myeloid diseases with a del(5q). Genomics 71, 235–245. 10.1006/geno.2000.6414. [DOI] [PubMed] [Google Scholar]
- Laurenti E, Doulatov S, Zandi S, Plumb I, Chen J, April C, Fan JB, and Dick JE (2013). The transcriptional architecture of early human hematopoiesis identifies multilevel control of lymphoid commitment. Nat Immunol. 10.1038/ni.2615. [DOI] [PMC free article] [PubMed] [Google Scholar]
- Liao Y, Smyth GK, and Shi W (2013). The Subread aligner: fast, accurate and scalable read mapping by seed-and-vote. Nucleic Acids Res 41, e108. 10.1093/nar/gkt214. [DOI] [PMC free article] [PubMed] [Google Scholar]
- Lieberman-Aiden E, van Berkum NL, Williams L, Imakaev M, Ragoczy T, Telling A, Amit I, Lajoie BR, Sabo PJ, Dorschner MO, et al. (2009). Comprehensive Mapping of Long-Range Interactions Reveals Folding Principles of the Human Genome. Science 326, 289–293. 10.1126/science.1181369. [DOI] [PMC free article] [PubMed] [Google Scholar]
- Liu S, Kwon M, Mannino M, Yang N, Renda F, Khodjakov A, and Pellman D (2018). Nuclear envelope assembly defects link mitotic errors to chromothripsis. Nature 561, 551–555. 10.1038/s41586-018-0534-z. [DOI] [PMC free article] [PubMed] [Google Scholar]
- Love MI, Huber W, and Anders S (2014). Moderated estimation of fold change and dispersion for RNA-seq data with DESeq2. Genome Biol 15, 550. 10.1186/s13059-014-0550-8. [DOI] [PMC free article] [PubMed] [Google Scholar]
- Mazumdar C, Shen Y, Xavy S, Zhao F, Reinisch A, Li R, Corces MR, Flynn RA, Buenrostro JD, Chan SM, et al. (2015). Leukemia-Associated Cohesin Mutants Dominantly Enforce Stem Cell Programs and Impair Human Hematopoietic Progenitor Differentiation. Cell Stem Cell 17, 675–688. 10.1016/j.stem.2015.09.017. [DOI] [PMC free article] [PubMed] [Google Scholar]
- McLean CY, Bristor D, Hiller M, Clarke SL, Schaar BT, Lowe CB, Wenger AM, and Bejerano G (2010). GREAT improves functional interpretation of cis-regulatory regions. Nat Biotechnol 28, 495–501. 10.1038/nbt.1630. [DOI] [PMC free article] [PubMed] [Google Scholar]
- Merlat A, Lai JL, Sterkers Y, Demory JL, Bauters F, Preudhomme C, and Fenaux P (1999). Therapy-related myelodysplastic syndrome and acute myeloid leukemia with 17p deletion. A report on 25 cases. Leukemia 13, 250–257. 10.1038/sj.leu.2401298. [DOI] [PubMed] [Google Scholar]
- Moss SF, Krivosheyev V, De Souza A, Chin K, Gaetz HP, Chaudhary N, Worman HJ, and Holt PR (1999). Decreased and aberrant nuclear lamin expression in gastrointestinal tract neoplasms. Gut 45, 723–729. 10.1136/gut.45.5.723. [DOI] [PMC free article] [PubMed] [Google Scholar]
- Mullenders J, Aranda-Orgilles B, Lhoumaud P, Keller M, Pae J, Wang K, Kayembe C, Rocha PP, Raviram R, Gong Y, et al. (2015). Cohesin loss alters adult hematopoietic stem cell homeostasis, leading to myeloproliferative neoplasms. J Exp Med 212, 1833–1850. 10.1084/jem.20151323. [DOI] [PMC free article] [PubMed] [Google Scholar]
- Nechanitzky R, Akbas D, Scherer S, Györy I, Hoyler T, Ramamoorthy S, Diefenbach A, and Grosschedl R (2013). Transcription factor EBF1 is essential for the maintenance of B cell identity and prevention of alternative fates in committed cells. Nat Immunol 14, 867–875. 10.1038/ni.2641. [DOI] [PubMed] [Google Scholar]
- Nora EP, Lajoie BR, Schulz EG, Giorgetti L, Okamoto I, Servant N, Piolot T, van Berkum NL, Meisig J, Sedat J, et al. (2012). Spatial partitioning of the regulatory landscape of the X-inactivation centre. Nature 485, 381–385. 10.1038/nature11049. [DOI] [PMC free article] [PubMed] [Google Scholar]
- Notta F, Doulatov S, Laurenti E, Poeppl A, Jurisica I, and Dick JE (2011). Isolation of single human hematopoietic stem cells capable of long-term multilineage engraftment. Science 333, 218–221. 10.1126/science.1201219. [DOI] [PubMed] [Google Scholar]
- Ochi Y, Kon A, Sakata T, Nakagawa MM, Nakazawa N, Kakuta M, Kataoka K, Koseki H, Nakayama M, Morishita D, et al. (2020). Combined Cohesin-RUNX1 Deficiency Synergistically Perturbs Chromatin Looping and Causes Myelodysplastic Syndromes. Cancer Discov 10, 836–853. 10.1158/2159-8290.CD-19-0982. [DOI] [PMC free article] [PubMed] [Google Scholar]
- Orkin SH, and Zon LI (2008). Hematopoiesis: an evolving paradigm for stem cell biology. Cell 132, 631–644. 10.1016/j.cell.2008.01.025. [DOI] [PMC free article] [PubMed] [Google Scholar]
- Padiath QS, Saigoh K, Schiffmann R, Asahara H, Yamada T, Koeppen A, Hogan K, Ptáček LJ, and Fu YH (2006). Lamin B1 duplications cause autosomal dominant leukodystrophy. Nature Genetics 38, 1114–1123. 10.1038/ng1872. [DOI] [PubMed] [Google Scholar]
- Pascual-Reguant L, Blanco E, Galan S, Le Dily F, Cuartero Y, Serra-Bardenys G, Di Carlo V, Iturbide A, Cebrià-Costa JP, Nonell L, et al. (2018). Lamin B1 mapping reveals the existence of dynamic and functional euchromatin lamin B1 domains. Nat Commun 9, 3420. 10.1038/s41467-018-05912-z. [DOI] [PMC free article] [PubMed] [Google Scholar]
- Quinlan AR, and Hall IM (2010). BEDTools: a flexible suite of utilities for comparing genomic features. Bioinformatics 26, 841–842. 10.1093/bioinformatics/btq033. [DOI] [PMC free article] [PubMed] [Google Scholar]
- Ramírez F, Ryan DP, Grüning B, Bhardwaj V, Kilpert F, Richter AS, Heyne S, Dündar F, and Manke T (2016). deepTools2: a next generation web server for deepsequencing data analysis. Nucleic Acids Res 44, W160–165. 10.1093/nar/gkw257. [DOI] [PMC free article] [PubMed] [Google Scholar]
- Rao SSP, Huntley MH, Durand NC, Stamenova EK, Bochkov ID, Robinson JT, Sanborn AL, Machol I, Omer AD, Lander ES, and Aiden EL (2014). A 3D map of the human genome at kilobase resolution reveals principles of chromatin looping. Cell 159, 1665–1680. 10.1016/j.cell.2014.11.021. [DOI] [PMC free article] [PubMed] [Google Scholar]
- Reddy KL, Zullo JM, Bertolino E, and Singh H (2008). Transcriptional repression mediated by repositioning of genes to the nuclear lamina. Nature 452, 243–247. 10.1038/nature06727. [DOI] [PubMed] [Google Scholar]
- Robinson JT, Turner D, Durand NC, Thorvaldsdóttir H, Mesirov JP, and Aiden EL (2018). Juicebox.js Provides a Cloud-Based Visualization System for Hi-C Data. Cell Syst 6, 256–258.e251. 10.1016/j.cels.2018.01.001. [DOI] [PMC free article] [PubMed] [Google Scholar]
- Rucker FG, Schlenk RF, Bullinger L, Kayser S, Teleanu V, Kett H, Habdank M, Kugler CM, Holzmann K, Gaidzik VI, et al. (2012). TP53 alterations in acute myeloid leukemia with complex karyotype correlate with specific copy number alterations, monosomal karyotype, and dismal outcome. Blood 119, 2114–2121. 10.1182/blood-2011-08-375758. [DOI] [PubMed] [Google Scholar]
- Schreiber KH, and Kennedy BK (2013). When lamins go bad: nuclear structure and disease. Cell 152, 1365–1375. 10.1016/j.cell.2013.02.015. [DOI] [PMC free article] [PubMed] [Google Scholar]
- Shah PP, Lv W, Rhoades JH, Poleshko A, Abbey D, Caporizzo MA, Linares-Saldana R, Heffler JG, Sayed N, Thomas D, et al. (2021). Pathogenic LMNA variants disrupt cardiac lamina-chromatin interactions and de-repress alternative fate genes. Cell Stem Cell 28, 938–954.e939. 10.1016/j.stem.2020.12.016. [DOI] [PMC free article] [PubMed] [Google Scholar]
- Shimi T, Pfleghaar K, Kojima S, Pack CG, Solovei I, Goldman AE, Adam SA, Shumaker DK, Kinjo M, Cremer T, and Goldman RD (2008). The A- and B-type nuclear lamin networks: microdomains involved in chromatin organization and transcription. Genes Dev 22, 3409–3421. 10.1101/gad.1735208. [DOI] [PMC free article] [PubMed] [Google Scholar]
- Shin JW, Spinler KR, Swift J, Chasis JA, Mohandas N, and Discher DE (2013). Lamins regulate cell trafficking and lineage maturation of adult human hematopoietic cells. Proc Natl Acad Sci U S A 110, 18892–18897. 10.1073/pnas.1304996110. [DOI] [PMC free article] [PubMed] [Google Scholar]
- Soenen V, Preudhomme C, Roumier C, Daudignon A, Laï JL, and Fenaux P (1998). 17p Deletion in acute myeloid leukemia and myelodysplastic syndrome. Analysis of breakpoints and deleted segments by fluorescence in situ. Blood 91, 1008–1015. [PubMed] [Google Scholar]
- Sperling AS, Gibson CJ, and Ebert BL (2016). The genetics of myelodysplastic syndrome: from clonal haematopoiesis to secondary leukaemia. Nat Rev Cancer. 10.1038/nrc.2016.112. [DOI] [PMC free article] [PubMed] [Google Scholar]
- Stephens AD, Banigan EJ, and Marko JF (2019). Chromatin’s physical properties shape the nucleus and its functions. Curr Opin Cell Biol 58, 76–84. 10.1016/j.ceb.2019.02.006. [DOI] [PMC free article] [PubMed] [Google Scholar]
- Stuart T, Butler A, Hoffman P, Hafemeister C, Papalexi E, Mauck WM, Hao Y, Stoeckius M, Smibert P, and Satija R (2019). Comprehensive Integration of Single-Cell Data. Cell 177, 1888–1902.e1821. 10.1016/j.cell.2019.05.031. [DOI] [PMC free article] [PubMed] [Google Scholar]
- Thompson SL, Bakhoum SF, and Compton DA (2010). Mechanisms of chromosomal instability. Curr Biol 20, R285–295. 10.1016/j.cub.2010.01.034. [DOI] [PMC free article] [PubMed] [Google Scholar]
- van Steensel B, and Belmont AS (2017). Lamina-Associated Domains: Links with Chromosome Architecture, Heterochromatin, and Gene Repression. Cell 169, 780–791. 10.1016/j.cell.2017.04.022. [DOI] [PMC free article] [PubMed] [Google Scholar]
- Vargas JD, Hatch EM, Anderson DJ, and Hetzer MW (2012). Transient nuclear envelope rupturing during interphase in human cancer cells. Nucleus 3, 88–100. 10.4161/nucl.18954. [DOI] [PMC free article] [PubMed] [Google Scholar]
- Vergnes L, Péterfy M, Bergo MO, Young SG, and Reue K (2004). Lamin B1 is required for mouse development and nuclear integrity. Proceedings of the National Academy of Sciences of the United States of America 101, 10428–10433. 10.1073/pnas.0401424101. [DOI] [PMC free article] [PubMed] [Google Scholar]
- Viny AD, Bowman RL, Liu Y, Lavallée VP, Eisman SE, Xiao W, Durham BH, Navitski A, Park J, Braunstein S, et al. (2019). Cohesin Members Stag1 and Stag2 Display Distinct Roles in Chromatin Accessibility and Topological Control of HSC Self-Renewal and Differentiation. Cell Stem Cell 25, 682–696.e688. 10.1016/j.stem.2019.08.003. [DOI] [PMC free article] [PubMed] [Google Scholar]
- Wang E, Boswell E, Siddiqi I, Lu CM, Sebastian S, Rehder C, and Huang Q (2011). Pseudo-Pelger-Huët anomaly induced by medications. American Journal of Clinical Pathology 135, 291–303. 10.1309/AJCPVFY95MAOBKRS. [DOI] [PubMed] [Google Scholar]
- Wang J, and LaFramboise T (2019). CytoConverter: a web-based tool to convert karyotypes to genomic coordinates. BMC Bioinformatics 20, 467. 10.1186/s12859-019-3062-4. [DOI] [PMC free article] [PubMed] [Google Scholar]
- Wong TN, Miller CA, Jotte MRM, Bagegni N, Baty JD, Schmidt AP, Cashen AF, Duncavage EJ, Helton NM, Fiala M, et al. (2018). Cellular stressors contribute to the expansion of hematopoietic clones of varying leukemic potential. Nat Commun 9, 455. 10.1038/s41467-018-02858-0. [DOI] [PMC free article] [PubMed] [Google Scholar]
- Wong TN, Ramsingh G, Young AL, Miller CA, Touma W, Welch JS, Lamprecht TL, Shen D, Hundal J, Fulton RS, et al. (2015). Role of TP53 mutations in the origin and evolution of therapy-related acute myeloid leukaemia. Nature 518, 552–555. 10.1038/nature13968. [DOI] [PMC free article] [PubMed] [Google Scholar]
- Xie X, Liu M, Zhang Y, Wang B, Zhu C, Wang C, Li Q, Huo Y, Guo J, Xu C, et al. (2020). Single-cell transcriptomic landscape of human blood cells. National Science Review. 10.1093/nsr/nwaa180. [DOI] [PMC free article] [PubMed] [Google Scholar]
- Yoshikawa Y, Ikebuchi K, Ohkawara JI, Hirayama F, Yamaguchi M, Sato N, Mori KJ, Kasai M, and Sekiguchi S (1999). A clonal culture assay for human cord blood lymphohematopoietic progenitors. Human Immunology 60, 75–82. 10.1016/S0198-8859(98)00094-9. [DOI] [PubMed] [Google Scholar]
- Zhang CZ, Spektor A, Cornils H, Francis JM, Jackson EK, Liu S, Meyerson M, and Pellman D (2015). Chromothripsis from DNA damage in micronuclei. Nature 522, 179–184. 10.1038/nature14493. [DOI] [PMC free article] [PubMed] [Google Scholar]
- Zhang X, Jeong M, Huang X, Wang XQ, Wang X, Zhou W, Shamim MS, Gore H, Himadewi P, Liu Y, et al. (2020). Large DNA Methylation Nadirs Anchor Chromatin Loops Maintaining Hematopoietic Stem Cell Identity. Mol Cell 78, 506–521.e506. 10.1016/j.molcel.2020.04.018. [DOI] [PMC free article] [PubMed] [Google Scholar]
- Zhou Y, Zhou B, Pache L, Chang M, Khodabakhshi AH, Tanaseichuk O, Benner C, and Chanda SK (2019). Metascape provides a biologist-oriented resource for the analysis of systems-level datasets. Nat Commun 10, 1523. 10.1038/s41467-019-09234-6. [DOI] [PMC free article] [PubMed] [Google Scholar]
- Zhu Y, Gong K, Denholtz M, Chandra V, Kamps MP, Alber F, and Murre C (2017). Comprehensive characterization of neutrophil genome topology. Genes Dev 31, 141–153. 10.1101/gad.293910.116. [DOI] [PMC free article] [PubMed] [Google Scholar]
Associated Data
This section collects any data citations, data availability statements, or supplementary materials included in this article.
Supplementary Materials
Data Availability Statement
The raw and processed RNA-seq, single cell RNA-seq, and Hi-C data files generated as part of this study have been deposited to the Gene Expression Omnibus (accession number GSE174533) and are publicly available as of the date of publication. RNA-seq data for iPSC-MDS HPCs is available from Gene Expression Omnibus (accession number GSE129851). This paper does not report original code. Any additional information required to reanalyze the data reported in this paper is available from the lead contact upon request.