

Abstract
Background:
Explainable artificial intelligence (AI) can be integrated within standard clinical software to facilitate the acceptance of the diagnostic findings during clinical interpretation.
Objectives:
We sought to develop and evaluate a novel, general-purpose, explainable deep learning model (CAD-DL) for the detection of obstructive CAD following SPECT myocardial perfusion imaging (MPI).
Methods:
MPI in 3,578 patients from nine centers with suspected CAD and invasive coronary angiography within a 6-month interval were studied. The CAD-DL computes the probability of obstructive CAD from stress myocardial perfusion, wall motion, and wall thickening maps, as well as left ventricular volumes, age, and sex. Myocardial regions contributing to the CAD-DL prediction, are highlighted to explain the findings to the physician. A clinical prototype was integrated with a standard clinical workstation. Diagnostic performance by CAD-DL was compared to automated quantitative total perfusion deficit (TPD) and reader diagnosis.
Results:
In total, 2,247 patients (63%) had obstructive CAD. In 10-fold repeated testing, the area under the receiver operating characteristic curve (AUC) [95% confidence interval] was higher by CAD-DL (0.83[0.82–0.85]) than stress TPD (0.78[0.77–0.80]) or reader diagnosis (0.71[0.69–0.72]) (p<0.0001 for both). In external testing, the AUC in 555 patients was higher by CAD-DL (0.80[0.76–0.84]) than stress TPD (0.73[0.69–0.77]) or reader diagnosis (0.65[0.61–0.69]) (p<0.001). Our model can be integrated within standard clinical software and generates results rapidly (<12 seconds on a standard clinical workstation) and therefore could readily be incorporated into a typical clinical workflow.
Conclusion:
The deep-learning model significantly surpasses the diagnostic accuracy of standard quantitative analysis and clinical visual reading for MPI. Explainable artificial intelligence can be integrated within standard clinical software to facilitate acceptance of AI diagnosis of CAD following MPI.
Keywords: deep learning, SPECT, diagnostic accuracy, artificial intelligence
Condensed Abstract
A novel, general-purpose deep learning model, was developed in a large, diverse multicenter population to diagnose obstructive coronary artery disease using data from myocardial perfusion studies. Methods to explain the model’s prediction were developed, and the model was integrated within a clinical imaging workstation. The model demonstrated better diagnostic performance than expert visual and quantitative perfusion assessments. The explainability provided by the system may help overcome potential barriers to clinical implementation of artificial intelligence approaches and has the potential for wide applicability to many aspects of clinical cardiology.
INTRODUCTION
Coronary artery disease (CAD) is a major cause of death in the United States (1) making accurate diagnosis clinically important. Previously, we demonstrated the prediction of obstructive CAD with an artificial intelligence (AI) model utilizing quantified myocardial perfusion imaging (MPI) polar maps (two-dimensional displays of radiotracer activity in the left ventricle)(2,3). However, the previous approach did not allow visualization of the findings, presenting CAD probability to the physician only numerically in a “black-box” fashion. Additionally, the previous approach relied on camera-specific normal limits and proprietary quantification algorithms, did not utilize gated images, and was tested only for solid-state camera systems.
In this study, we present a novel deep learning model, CAD-DL for prediction of obstructive CAD from MPI using myocardial perfusion, wall motion, wall thickening polar maps, as well as sex, age, and left ventricular volumes obtained automatically from images. CAD-DL also incorporates mechanisms to highlight the myocardial regions which contribute to the prediction, providing an explanation of the findings to physicians. Explainable AI is critical to overcoming the “black-box” perception of AI (4), which is a significant barrier to clinical implementation for MPI and other potential applications in cardiology such as electrocardiography (5).
We evaluate the diagnostic performance of CAD-DL compared to visual and quantitative perfusion assessments in the largest population to date with invasive coronary angiography results who underwent MPI with either solid-state or conventional system and in additional populations with a low prevalence of CAD. We also demonstrate the implementation of a clinical prototype, which integrates these novel methods within standard clinical interpretation software.
MATERIALS AND METHODS
Study Population, Imaging and Stress Protocols
The study included a diverse, multicenter population with suspected but not known CAD before MPI and correlating angiography results within 6 months of MPI. To maximize generalizability, we considered only gated and ungated stress MPI images, which are routinely acquired in most nuclear cardiology laboratories, including stress-only protocols.
The study included 99mTc-sestamibi/tetrofosmin solid-state MPI data (from 2,059 patients collected in the context of the NIH-sponsored REgistry of Fast Myocardial Perfusion Imaging with NExt generation SPECT (REFINE SPECT) (6). Additionally, the study included 1,519 patients scanned with a conventional dual detector camera system between 2001 and 2015. For each patient, a standard 99mTc-sestamibi single-isotope or rest Tl-201/stress-99mTc-sestamibi dual-isotope SPECT MPI protocol was used as previously described (7).
The detailed description of systems and protocols by the sites is shown in Supplemental Tables 1 and 2. Patients underwent either symptom-limited, Bruce protocol exercise stress or pharmacologic stress, with radiotracer injection at peak exercise or during maximal hyperemia, respectively.
The study protocol complied with the Declaration of Helsinki and was approved by the institutional review boards at each participating institution. The overall study was approved by the institutional review board at Cedars-Sinai Medical Center.
Invasive Coronary Angiography
All coronary angiograms were visually interpreted by an on-site cardiologist. Stenosis ≥ 50% in the left main artery, or ≥70% in the left anterior descending artery (LAD), left circumflex artery (LCx), or right coronary artery (RCA), was considered significant and used as the gold standard for obstructive CAD. For per-vessel analyses, left main stenosis was attributed to both LAD and LCx vessels.
Visual Perfusion Assessment
MPI was visually assessed during clinical reporting by experienced board-certified nuclear cardiologists at each site, with knowledge of all available data, including stress and rest perfusion imaging, gated functional data, and clinical information. All quantitative perfusion and functional results during stress and rest obtained with site-specific quantification software were utilized for the clinical report and final reader diagnosis. In most patients, the visual assessment was also performed by summed stress scores (SSS) and summed rest scores (SRS), using the 17-segment American Heart Association model (9). In patients in whom segmental scores were not performed during clinical reporting, reader diagnosis in the four categories was used.
Automated Image Quantification
Quality control for the image datasets was performed by experienced core laboratory technologists without knowledge of the clinical data. Automatically generated myocardial contours by Quantitative Perfusion SPECT (QPS) software (Cedars-Sinai Medical Center, Los Angeles, CA) were evaluated. When necessary, contours were adjusted to correspond to the myocardium. Myocardial contour correction was performed in 12% of the stress static data and 8% of the stress gated data. Stress and rest images in the supine positions were analyzed as previously described (10) using total perfusion deficit (TPD)(11). Global TPD was used for per-patient analysis, and per-vessel TPD was used for the per-vessel analysis.
Deep Learning Model Architecture
The deep learning model CAD-DL was trained using the myocardial perfusion, wall motion, wall thickening polar maps (12), and the following numerical variables: age, sex, and left ventricular end-systolic and diastolic left ventricular volumes (Central Illustration), which were obtained automatically from image data. CAD-DL was implemented using Python 3.7.3 and Tensorflow 1.14. Further details about data pre-processing and model architecture and a glossary of AI terms are provided in Supplemental Table 3. A deep learning model incorporating quantified data of myocardial perfusion, wall motion, and wall thickening was also built for comparison. Additionally, to understand which input data in CAD-DL are most important, models utilizing the subsets of data were evaluated (Supplemental Material and Supplemental Table 4).
Central Illustration. Clinical Deployment of Explainable Artificial Intelligence.
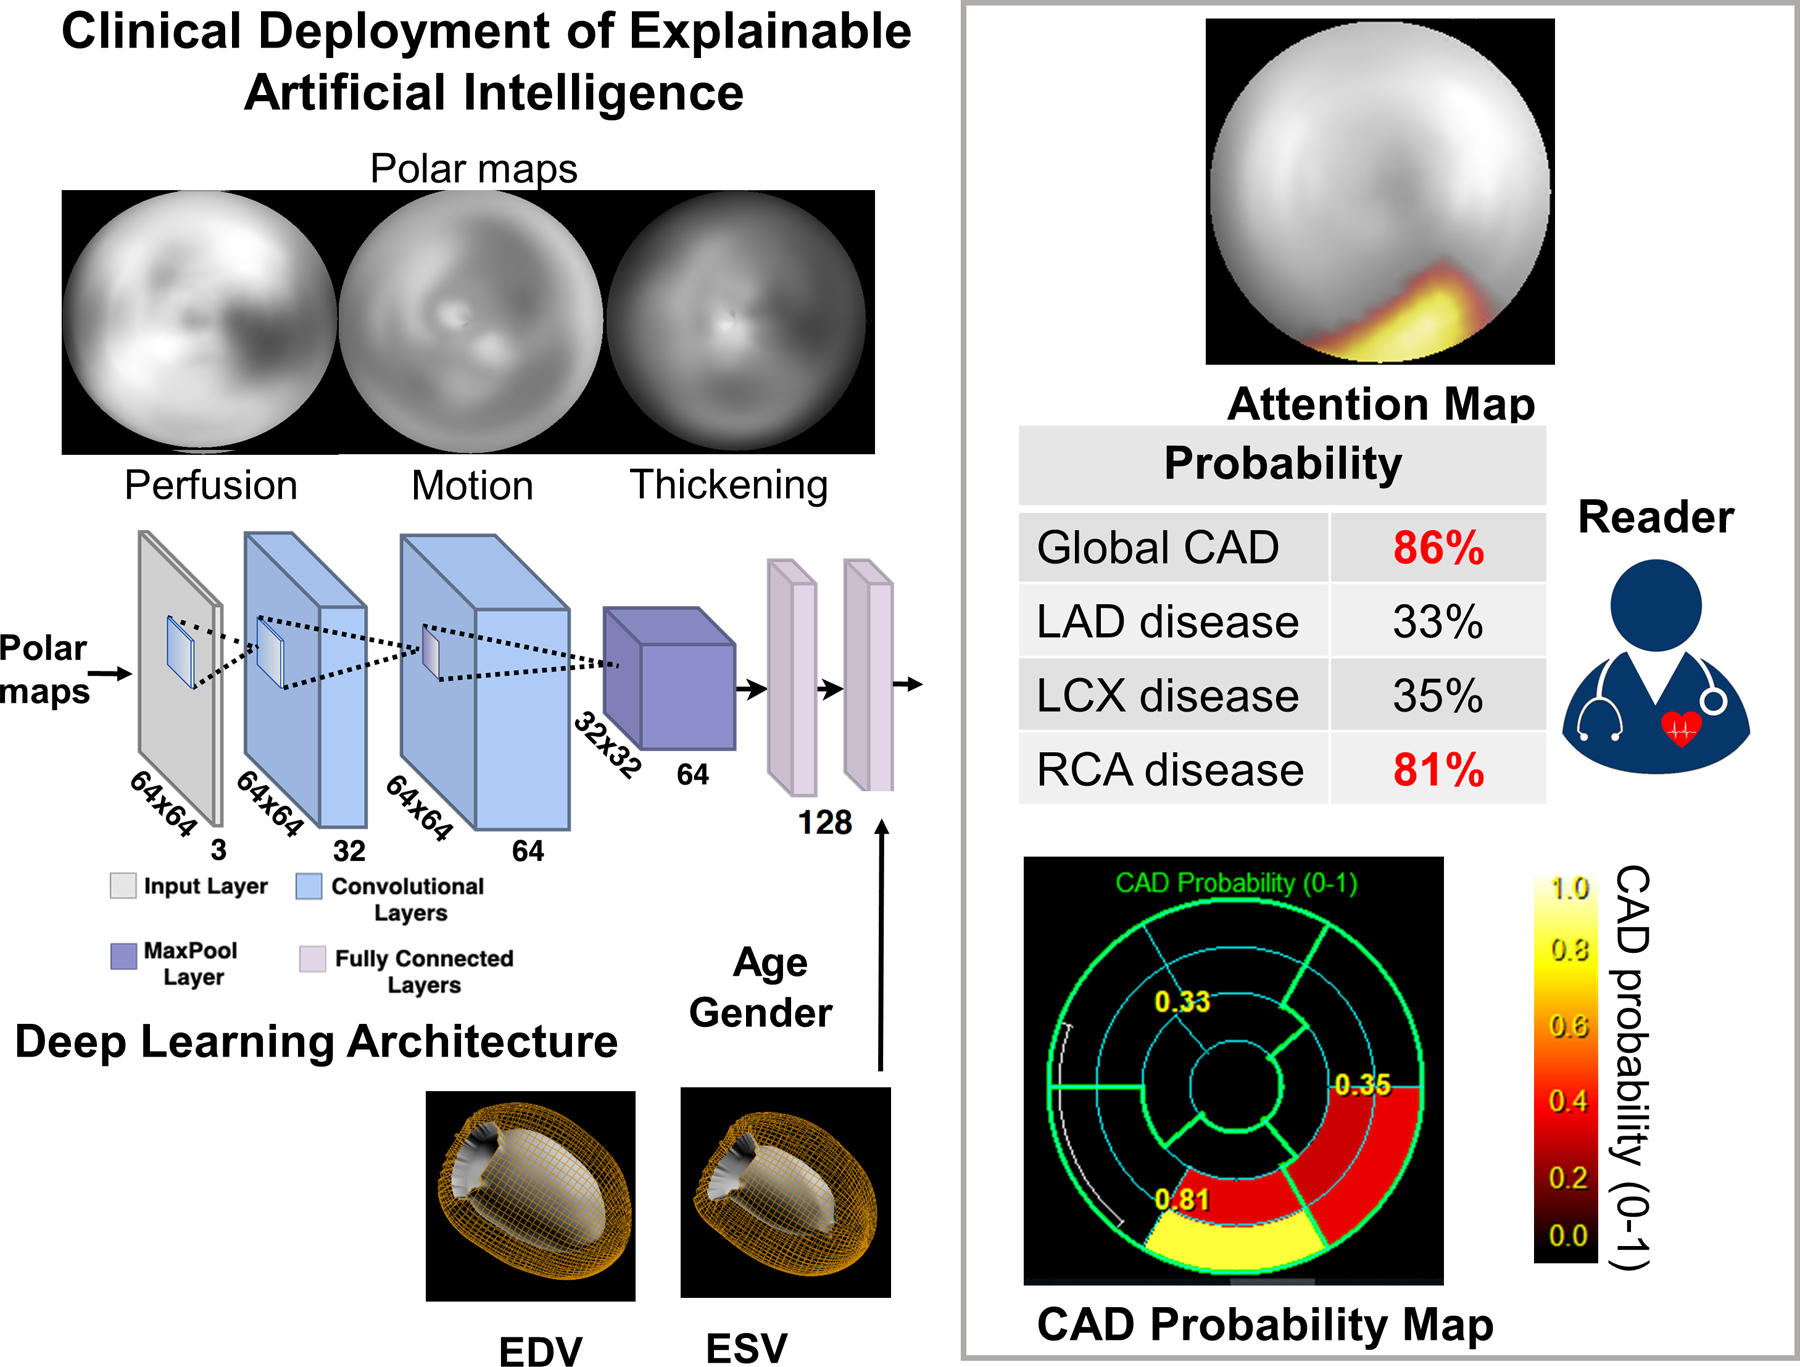
The raw myocardial perfusion, wall motion, and thickening images are input to the deep learning model “CAD-DL”. Sex, age, and cardiac volumes are added to final fully connected layer, which is used to estimate the per-patient and per-vessel probability. The attention maps highlight the regions and segments contributing most to the per-vessel prediction. CAD=coronary artery disease, EDV=end-diastolic volume, ESV=end-systolic volume, LAD=left anterior descending artery, LCx=left circumflex artery, RCA=right coronary artery
Clinical Deployment of CAD Attention and Probability Maps
CAD-DL incorporates novel attention maps, using an approach referred to as Gradient-weighted Class Activation Mapping (13), highlighting for the physician the left ventricular regions, which contributed to the prediction. This allows physicians to ensure the model findings are clinically relevant (14). Using these attention maps, each segment from the standard 17-segment American Heart Association model (14) can be assigned to 5 categories to generate the segmental CAD probability map. The CAD probability map marks the degree to which the segments contribute the CAD-DL prediction to give further insight for the reader (Central Illustration). Per-patient (global CAD) and per-vessel CAD-DL predictions are computed as continuous values (0–1 scale). The clinical prototype of CAD-DL, with attention and probability maps, was integrated within standard clinical nuclear cardiology software (QPS/QGS Cedars-Sinai Medical Center, Los Angeles, CA). To validate the diagnostic accuracy of CAD-DL, 10-fold repeated testing (3,578 patients for training and testing), external testing (3,023 patients for training and 555 patients for testing), and additional validation in two cohorts were separately performed using the same deep learning architecture. Additionally, SPECT image and attention maps were retrospectively reviewed in a subset where the CAD-DL outperformed expert readers. The correlation between attention maps and quantitative perfusion defect was also tested.
Repeated 10-fold testing
The model was evaluated using 10-fold repeated testing (Supplemental Figure 1). The dataset of 3,578 patients was randomly split into 10 exclusive parts or “folds”. An equal proportion (63%) of patients with CAD were maintained in each of the folds. Each training set comprised 9 folds (90% of the total dataset), and the remaining fold (10% of the full dataset) was held-out for testing and is never seen during training or validation of the model. Each fold of the training data was further divided in 5 folds to utilize 80% of the data for training and the remaining 20% for model tuning and validation. Testing was performed in the 10% held-out data, which was not used in any way during model training. The process was performed 10 times with separate and non-overlapping data acting as the held-out testing dataset. The repeated testing predictions for all 3,578 patients were subsequently concatenated. The 10-fold repeated testing approach maximizes the data available for training while ensuring testing is only performed on unseen data and reduces variance in estimates caused by arbitrarily splitting the dataset once (15). Further details are provided in the supplement.
External Testing
While 10-fold repeated testing is a robust method for training and testing DL models on unseen data, test patients have similar characteristics to those used for training. To test the expected performance of CAD-DL on unseen data from new centers (with distinct population characteristics), 555 patients were held out from two sites (which used solid-state camera systems and conventional camera systems). The model developed for external testing was trained with the same methodology as during internal testing using data from the other 7 sites (n=3,023 patients) (Supplemental Figure 2). After training this 7-site model in 3,023 patients, external testing was performed in 555 patients from the remaining 2 sites. Therefore, the generalizability of CAD-DL to new data was determined by evaluating patients, with scans obtained on both solid-state and conventional cameras from unseen sites that were not used for CAD-DL training (16).
Additional Validation in Two Cohorts
To address the limitation of high CAD prevalence in training and external validation datasets inherent to this form of retrospective data with angiogram reference standard, two further cohorts with low prevalence of CAD were tested with the model trained on the 7 sites (n=3,023) (model used for external testing procedure). First, 699 patients with low-likelihood of CAD undergoing exercise stress 99mTc-sestamibi conventional SPECT-MPI at two sites were obtained (7). The low-likelihood of CAD was defined as having an adequate treadmill stress test, and the post-test likelihood of CAD using the Diamond and Forrester criteria was less than 5% (7). Second, 256 patients with suspected but not known CAD undergoing 99mTc-tetrofosmin CZT-SPECT and coronary CT angiogram (CCTA) on the same day (8) were selected.
Statistical Analysis
Categorical variables are presented as frequencies and continuous variables as mean ± SD or median and interquartile ranges. Variables were compared using a Pearson’s χ2 statistic for categorical variables and a Wilcoxon rank-sum test for continuous variables. The diagnostic performance of visual perfusion assessment, stress TPD, and CAD-DL was evaluated using the analysis and pairwise comparisons of the areas under the receiver operating characteristic curve (AUC) according to DeLong et al.(17). For stress TPD and CAD-DL, the diagnostic cutoff values were set to show the same specificities of “abnormal” reader diagnosis or SSS≥4 threshold (18) to compare the diagnostic performance to a commonly used diagnostic threshold. We focused on the potential improvements in sensitivity to highlight the ability of CAD-DL to reduce false-negative interpretations while maintaining current specificity. In the low-likelihood population, the normalcy rate was computed as a frequency of the patients who have normal CAD-DL, TPD, or visual diagnosis based on the threshold established in the main cohort. In the population undergoing CCTA and SPECT, the diagnostic performance of CAD-DL was compared to stress TPD. Stenosis ≥50% in the left main artery or ≥70% in other main arteries on CCTA was considered significant.
A two-tailed P-value <0.05 was considered statistically significant. R studio version 1.3.959 (RStudio, Boston, MA) or Stata version 14 (Stata Corp, College Station, TX) was used for all analyses.
RESULTS
Clinical Characteristics and Angiographic Characteristics
Patient characteristics are shown in Table 1. Angiographic characteristics are shown in Table 2. In total, 3,875 vessels (36%) and 2,247 patients (63%) had obstructive CAD.
Table 1.
Patient Characteristics of the Overall Population, Left-in and Left-out Groups for External Testing
| Total (n=3,578) |
Left in for training (n=3,023) |
Left out for external testing (n=555) | P-value | |
|---|---|---|---|---|
| Age, years | 65 [57, 73] | 65 [57, 73] | 65 [57, 73] | 0.74 |
| Female | 1,320 (37%) | 1,146 (38%) | 174 (31%) | 0.003 |
| BMI, kg/m 2 | 28 [25,32] | 28 [25,32] | 29 [25,32] | 0.21 |
| BMI ≥30kg/m 2 | 1,300 (36%) | 1,086 (36%) | 214 (39%) | 0.19 |
| Hypertension | 2,378 (66%) | 1,973 (65%) | 405 (73%) | <0.001 |
| Diabetes | 998 (28%) | 822 (27%) | 176 (32%) | 0.03 |
| Dyslipidemia | 2,102 (59%) | 1,748 (58%) | 354 (64%) | 0.009 |
| Smoking | 727 (20%) | 634 (21%) | 93 (17%) | 0.023 |
| Pharmacologic stress | 2,198 (61%) | 1,853 (61%) | 345 (62%) | 0.70 |
Categorical value is expressed as n (%). Continuous values are expressed as median [interquartile range]. p values showing significant differences are shown in bold. BMI = body mass index
Table 2.
Angiographic Characteristics
| Total (n=3,578) |
Left in for training (n=3,023) |
Left out for external testing (n=555) | P-value | |
|---|---|---|---|---|
| Any disease | 2,247 (63%) | 1,918 (63%) | 329 (59%) | 0.06 |
| 1-vessel disease | 1,053 (29%) | 905 (30%) | 148 (27%) | 0.12 |
| 2-vessel disease | 717 (20%) | 609 (20%) | 108 (19%) | 0.71 |
| 3-vessel disease | 491(14%) | 418 (14%) | 73 (13%) | 0.67 |
| Left main disease | 232 (5%) | 141 (7%) | 50 (3%) | <0.001 |
| LAD disease | 1,567 (44%) | 952 (46%) | 615 (40%) | 0.001 |
| LCx disease | 1,087 (30%) | 685 (33%) | 402 (26%) | <0.001 |
| RCA disease | 1,221 (34%) | 685 (33%) | 536 (35%) | 0.21 |
Value is expressed as n (%). P values showing significant differences are shown in bold.
LAD = left anterior descending artery, LCx = left circumflex coronary artery, RCA = right coronary artery
Diagnostic Performance of CAD-DL with Repeated 10-fold Testing
The per-patient AUC by CAD-DL was higher than that of stress TPD and reader diagnosis (Figure 1a). The per-vessel AUC by CAD-DL was higher than stress TPD (Figure 1a, Supplemental Figure 3). Additionally, the AUC by per-vessel CAD-DL was higher than per-vessel stress TPD in LAD, LCX, and RCA (Supplemental Table 5). Individual AUC for each of the 10 folds is provided in Supplemental Figure 4. The sensitivity of abnormal reader diagnosis was 78.2%, and specificity was 61.0% (Figure 1b). The diagnostic thresholds were set as 4.3% for stress TPD and 0.45 for per-patient CAD-DL to match the specificity of “abnormal” reader diagnosis. With these thresholds, the sensitivity was higher by CAD-DL compared to stress TPD or reader diagnosis (Figure 1b).
Figure 1. Diagnostic Performance of “CAD-DL” from Repeated 10-fold Testing in the Overall Population.
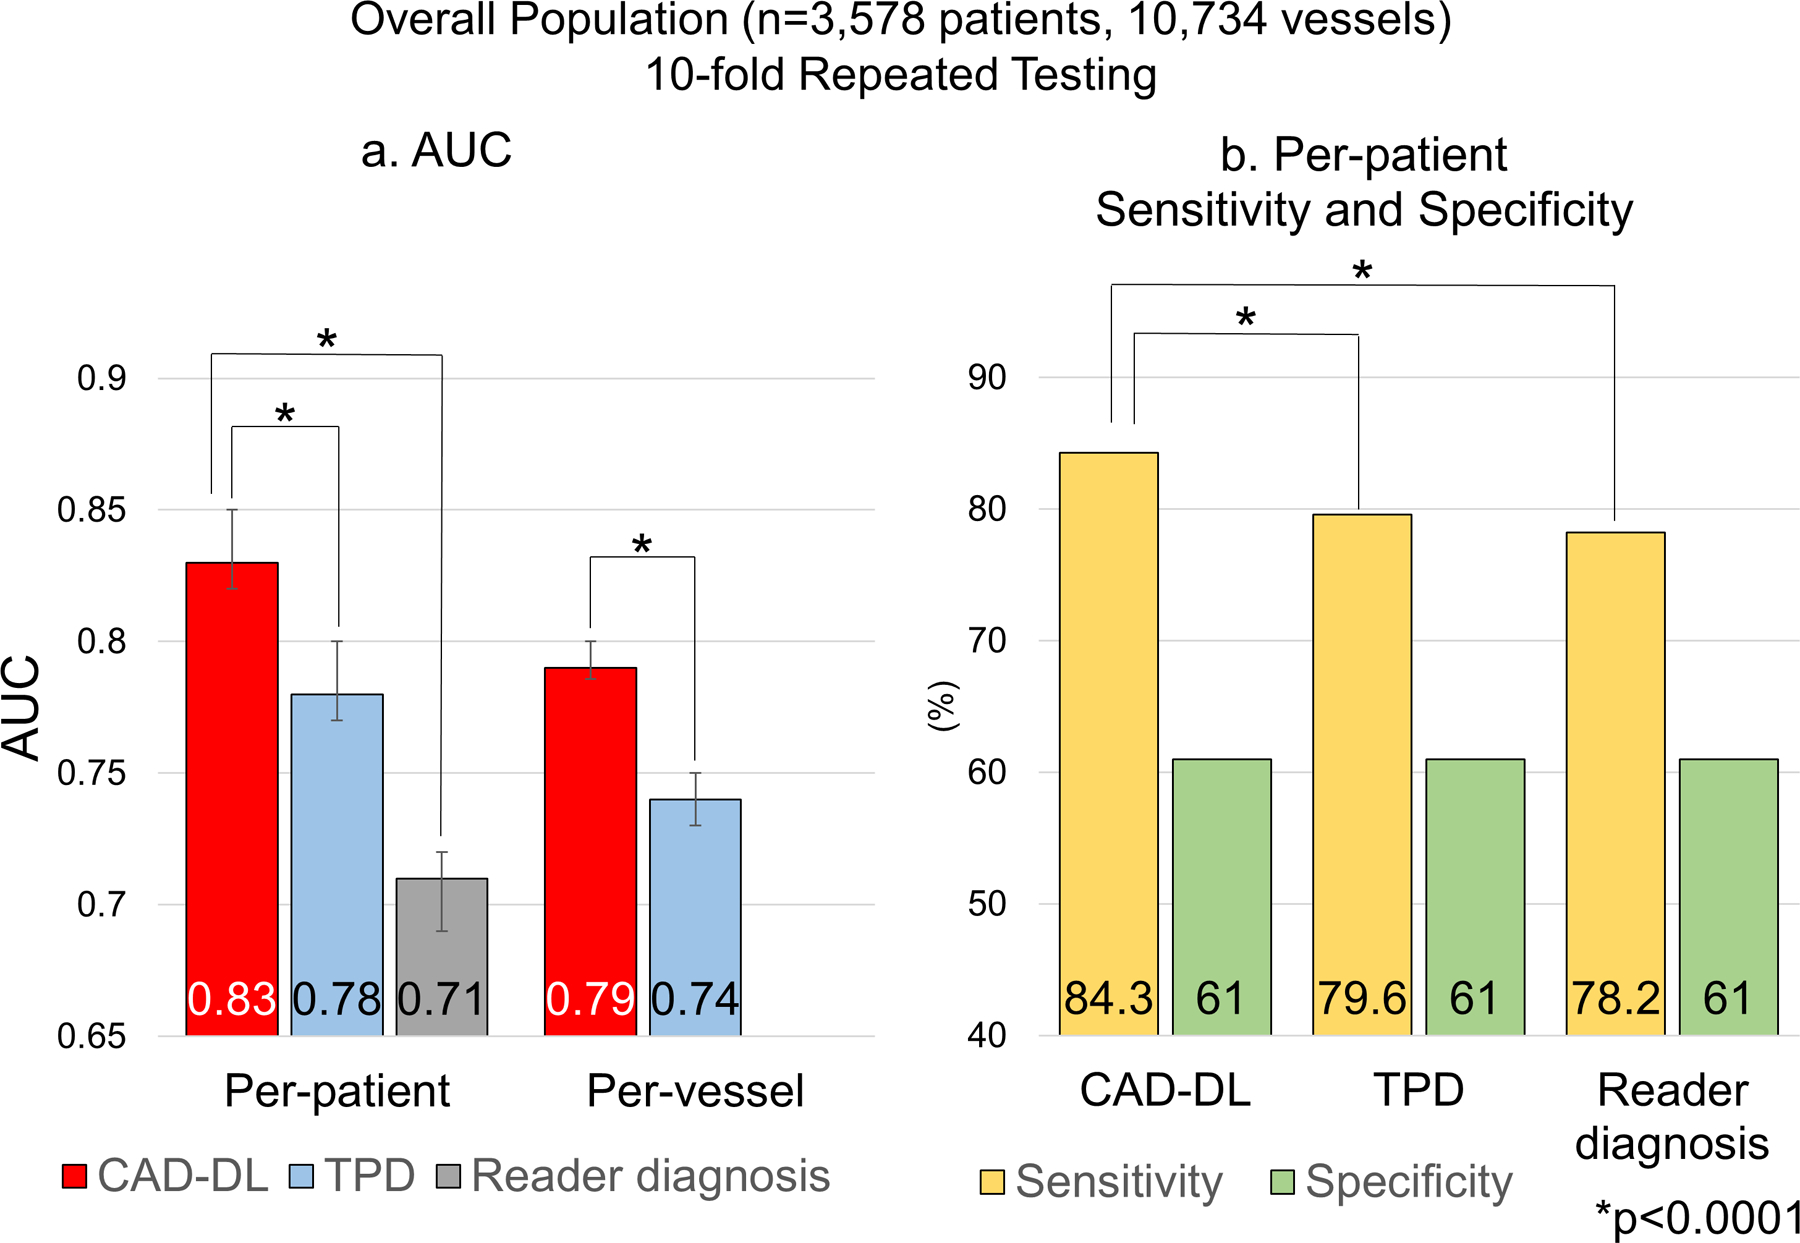
a. Per-patient and per-vessel AUC.
b. Per-patient sensitivity.
AUC=area under the receiver operating characteristic curve, TPD=total perfusion deficit
For the patients whose SSS were provided (n=2,884 patients), the per-patient AUC by CAD-DL was higher compared to SSS or stress TPD (Figure 2a) while there was no difference between SSS and stress TPD (Figure 2a). The sensitivity and specificity of SSS≥4 was 82.3% and 60.0% (Figure 2b). The sensitivity was higher by CAD-DL(85.6%) compared to stress TPD or SSS (Figure 2b). There was no difference in sensitivity between stress TPD and SSS (p=0.18). Further results are shown in Supplemental Material and Supplemental Table 6.
Figure 2. Diagnostic Performance of CAD-DL in the Population with SSS.
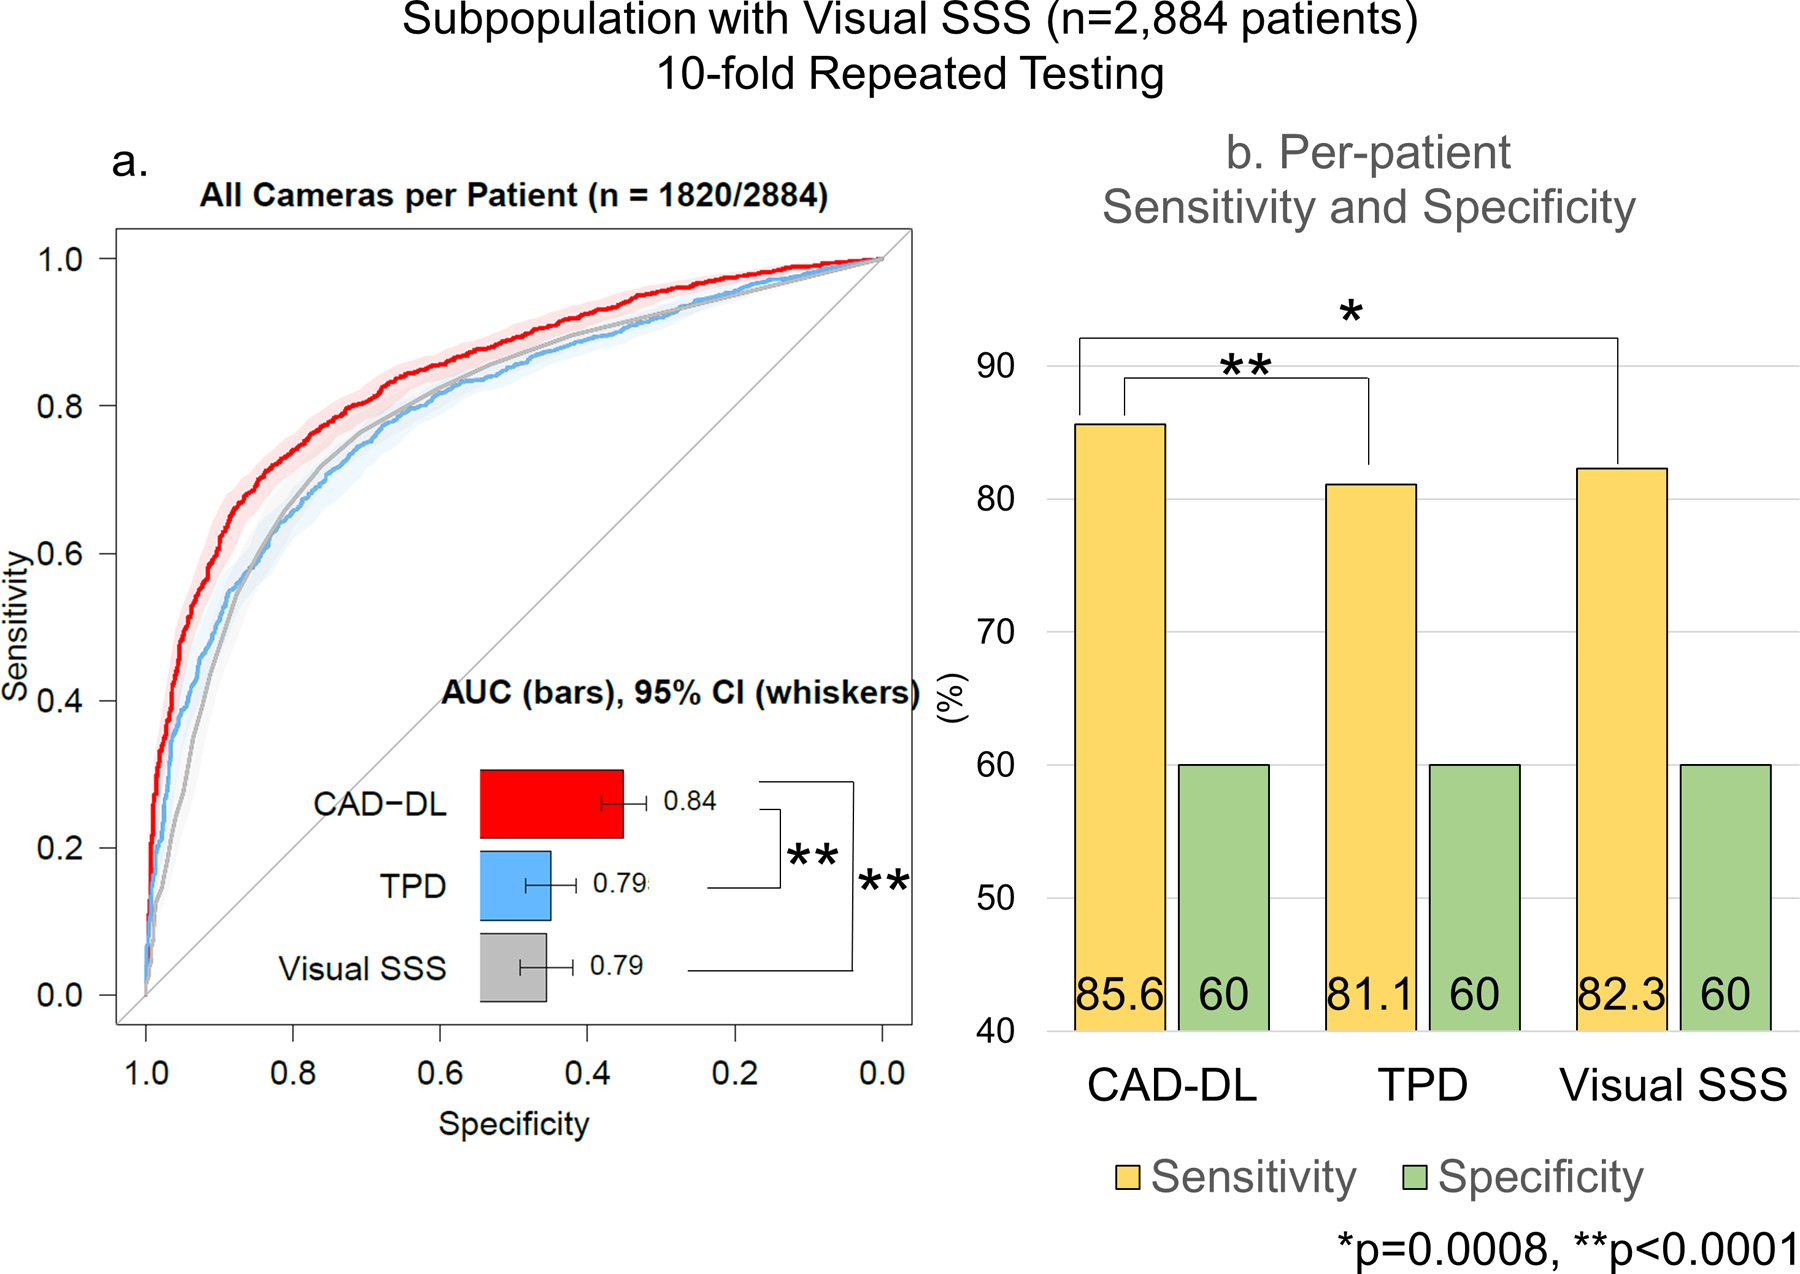
a. Per-patient AUC.
The shaded area represents 95%CI.
b. Per-patient Sensitivity and Specificity
AUC=area under the receiver operating characteristics, CI=confidence interval, SSS=summed stress score, TPD=total perfusion deficit.
The AUC of CAD-DL was higher than stress TPD in both subgroups of patients imaged with solid-state cameras and conventional cameras. (Supplemental Figure 5a). Similarly, by the per-vessel analyses of LAD, LCx, and RCA, CAD-DL demonstrated higher AUC than per-vessel stress TPD (Supplemental Figure 5b). In a subset of 711 patients who underwent dual-isotope (Stress Tc-99m and rest Tl-201 studies) conventional SPECT MPI, the per-patient AUC of CAD-DL(0.85[0.82–0.88]) was higher compared to stress TPD (0.82[0.79–0.85], p=0.0093) and comparable to SSS (0.84[0.81–0.87], p=0.35). The addition of the polar maps with quantitative information, as previously proposed (2,3) did not improve CAD-DL performance (Supplemental Figure 6).
Diagnostic Performance of CAD-DL with External Testing
In the set of external testing of 555 patients, 581 vessels (35%) in 329 patients (59%) had obstructive CAD. The per-patient AUC by CAD-DL (0.80[0.76–0.84]) was higher compared to stress TPD(0.73[0.69–0.77]) or reader diagnosis(0.65[0.61–0.69])(Figure 3). The per-vessel AUC by CAD-DL (0.78[0.76–0.80]) was also higher compared to stress TPD (0.71[0.69–0.74]) (Figure 3).
Figure 3. Diagnostic Performance of CAD-DL from External Testing.
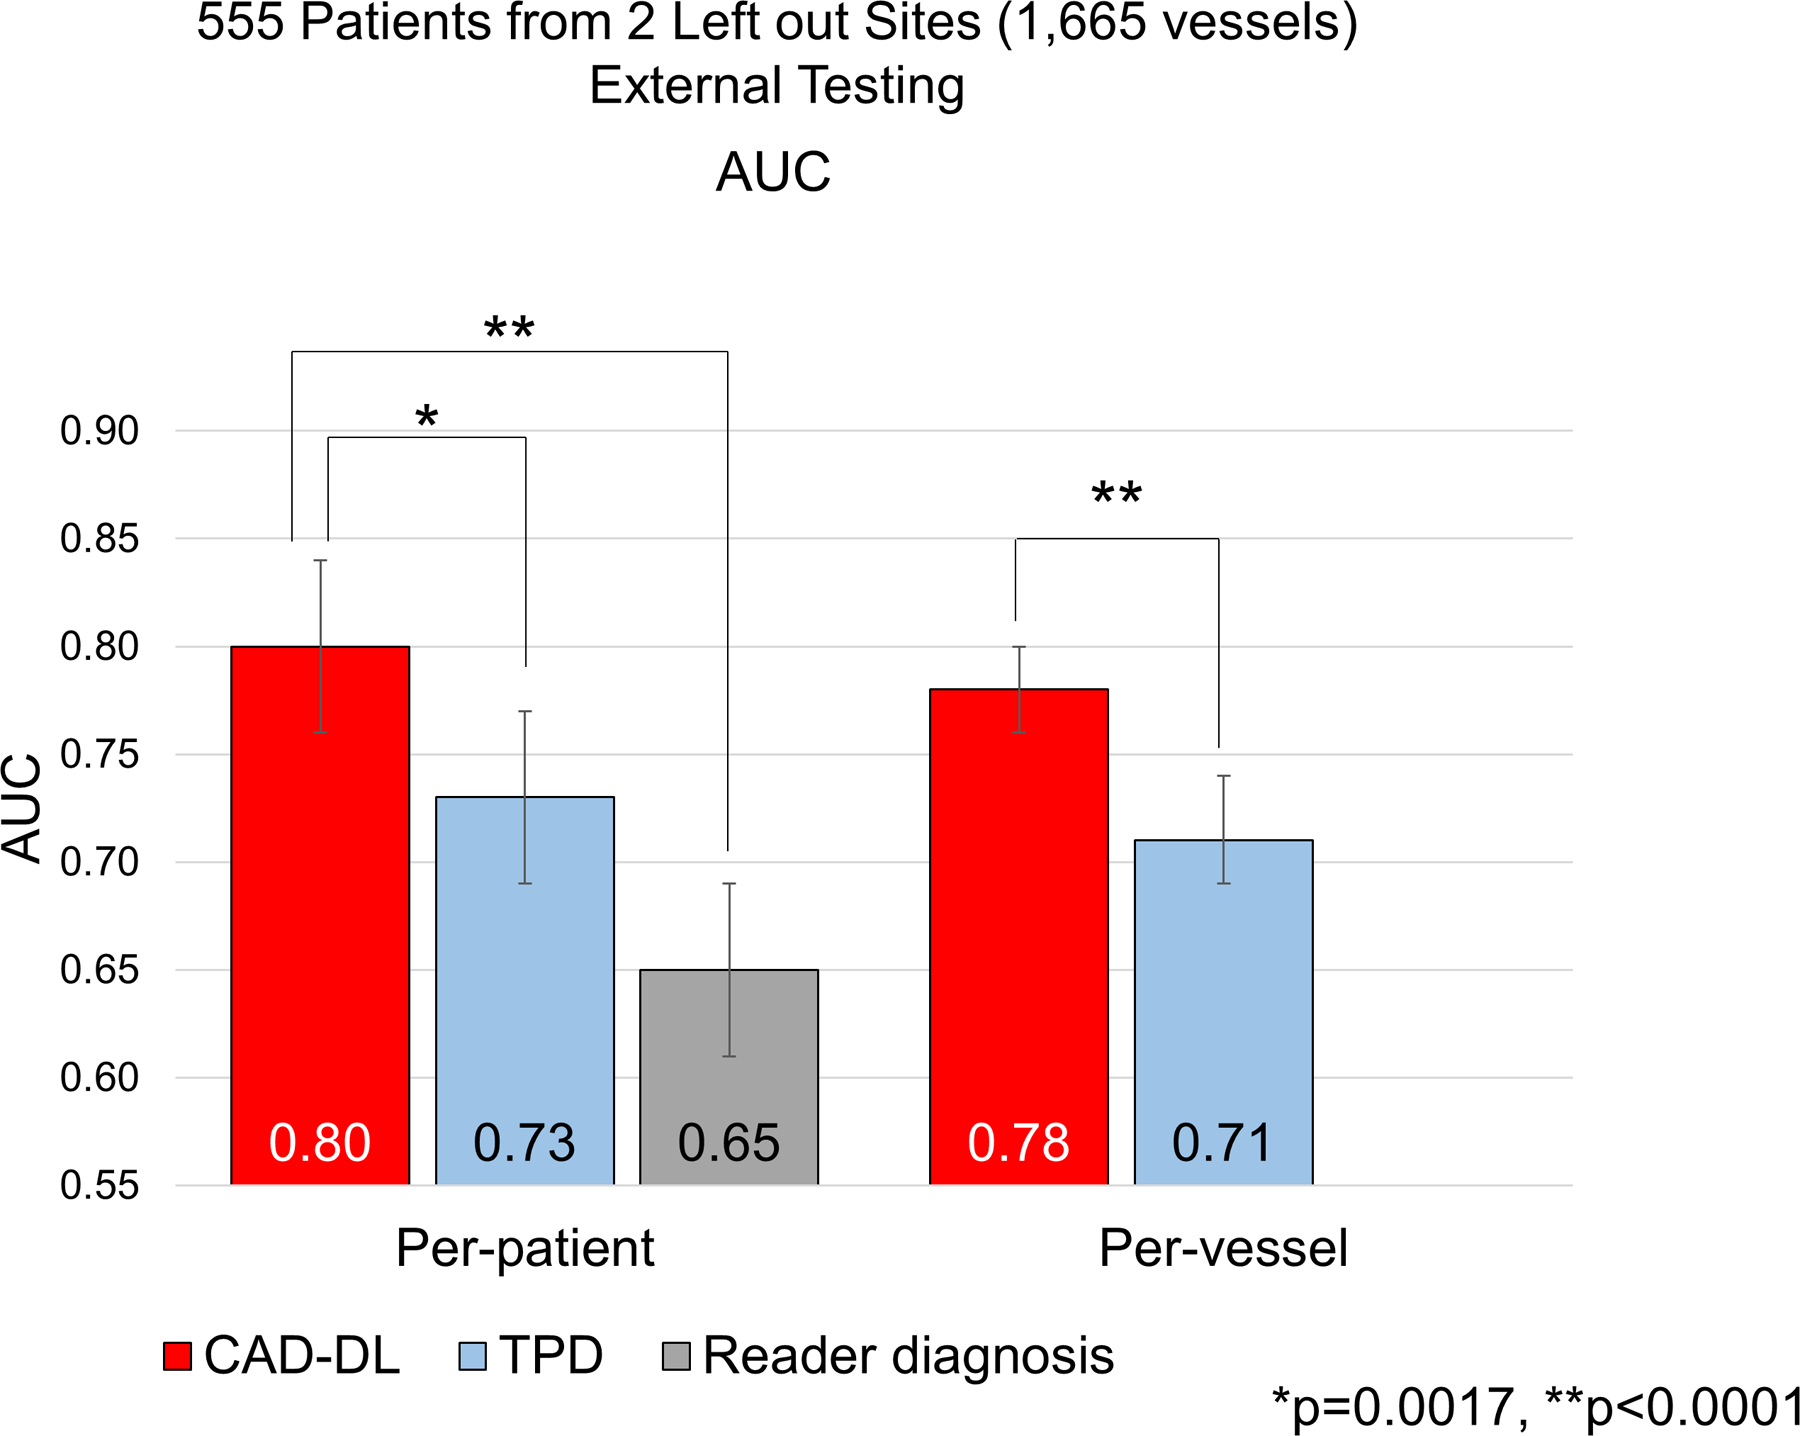
The per-patient and per-vessel AUC for the detection of CAD are shown. (red bars: deep learning model “CAD-DL”, light blue bars: TPD, gray bar: reader diagnosis.)
AUC=area under the receiver operating characteristic curve, TPD=total perfusion deficit.
Additional Validation in Cohorts with Low Prevalence of CAD
The normalcy rate by CAD-DL (88%) in low-likelihood population was higher than TPD (82%) or visual diagnosis (79%) (p<0.0001 for both). In the population undergoing SPECT and CCTA, the prevalence of obstructive CAD observed in CCTA was 12%. The per-patient AUC [95%CI] for CAD-DL was 0.75 [0.65–0.85] and for TPD 0.67 [0.56–0.78], (p=0.14). The per-vessel AUC [95%CI] of CAD-DL (0.75 [0.67–0.83]) was higher compared to stress TPD (0.64 [0.55–0.74], p=0.01).
Clinical Deployment of CAD-DL
On a standard CPU clinical workstation, the CAD-DL module took less than 12 seconds to provide all the results, including CAD attention and probability maps. Examples are shown in Figure 4. The user interface of the prototype clinical software is shown in Supplemental Figure 7.
Figure 4. Case example of solid-state SPECT-MPI.
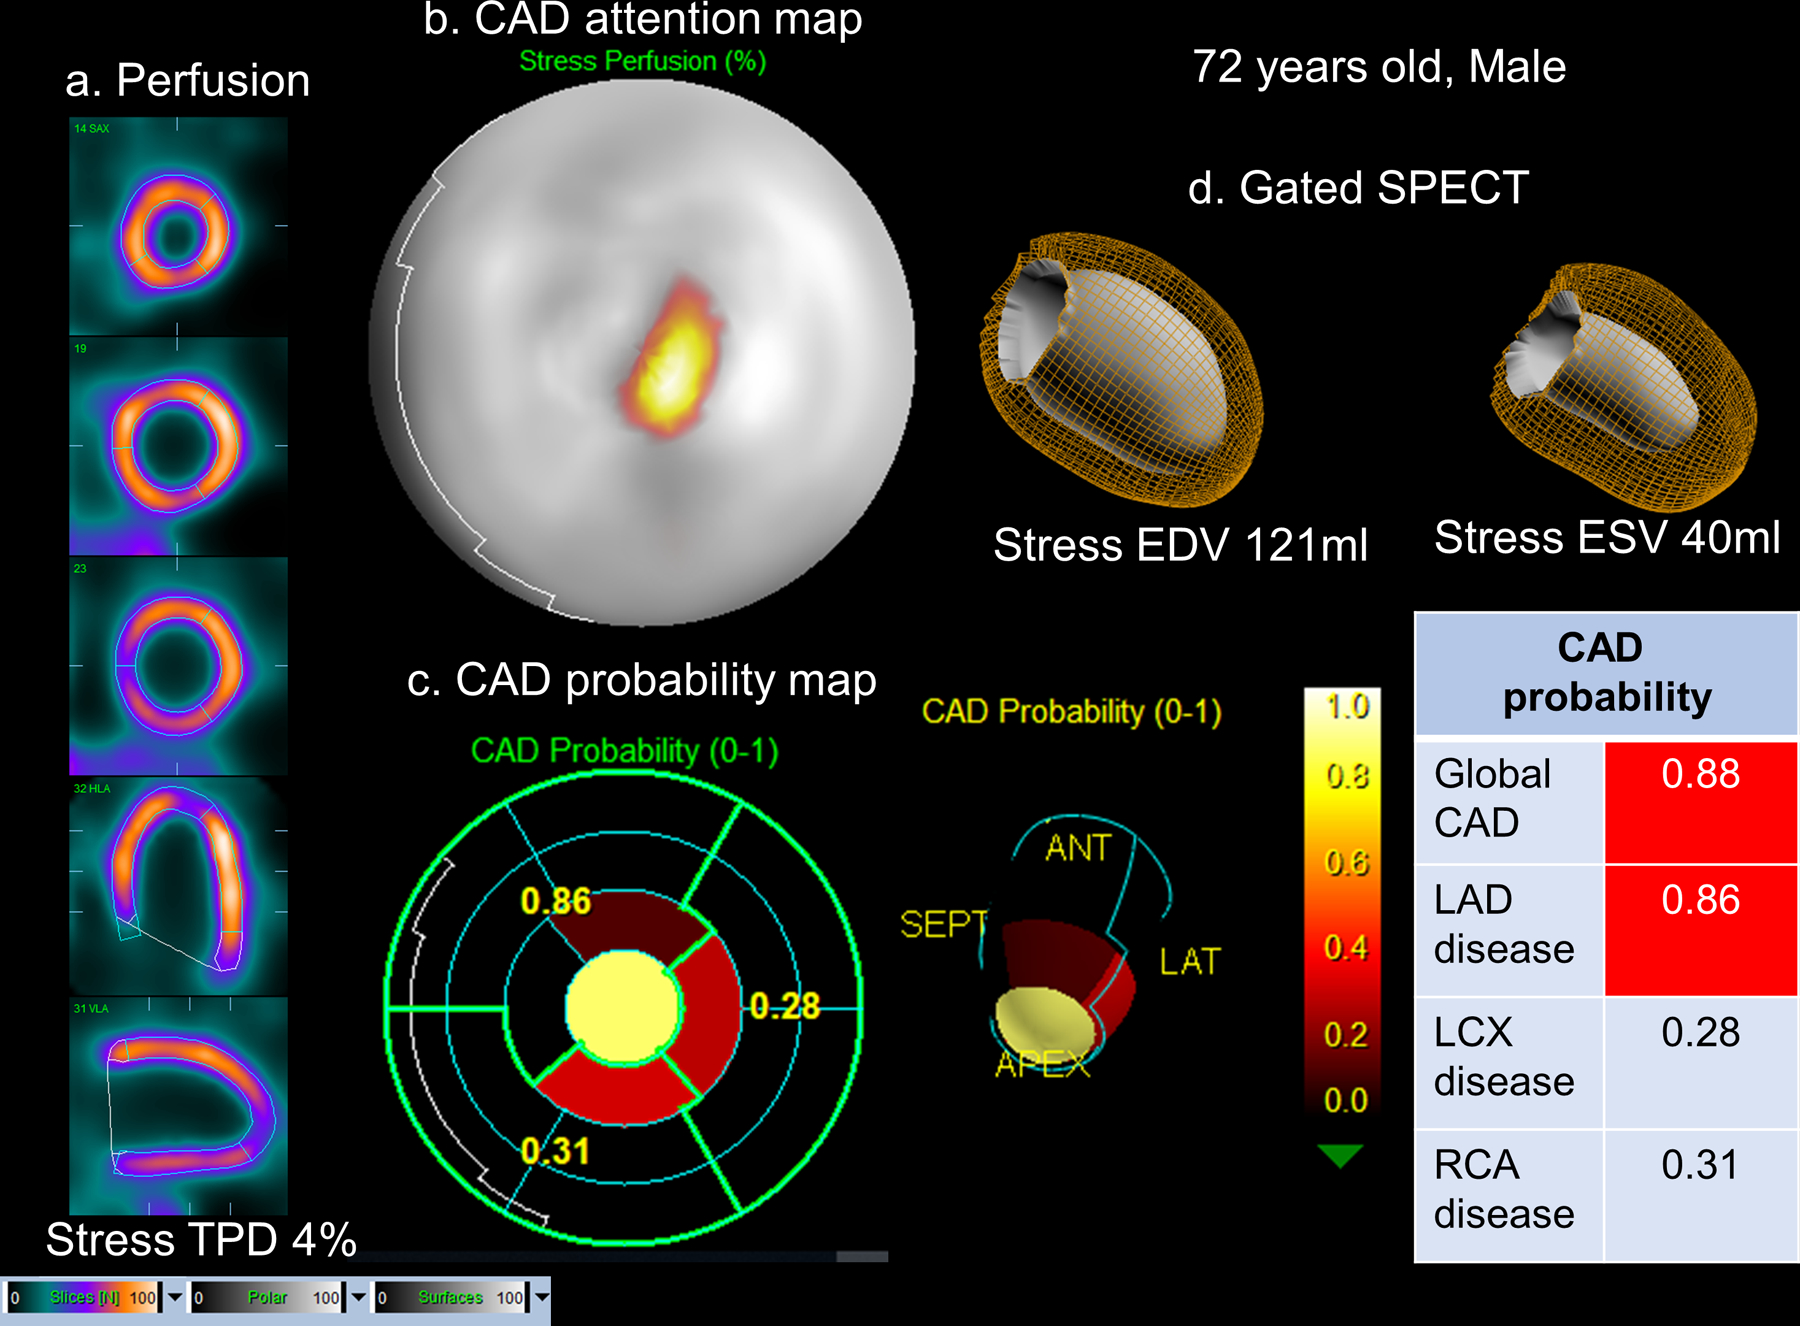
72-year old male with an 85% stenosis in the proximal left anterior descending artery (LAD) artery on coronary angiography. a.Stress images, visual assessment was interpreted as equivocal (SSS=2). b.CAD attention map highlighting the image regions contributing to CAD prediction overlaid onto perfusion polar map. c.CAD probability map showed a high probability of CAD and specifically LAD disease with the distal anterior and apical segments contributing to the prediction. d.Left ventricular volumes from gated SPECT. CAD=coronary artery disease, TPD=total perfusion deficit
SPECT Image and Attention Maps of CAD-DL
Out of all 3,578 patients, 163 patients with single-vessel disease who were read as normal by the initial experts and had CAD-DL≥0.45 were selected. Among them, 90 patients had LAD disease, 26 patients had LCX disease and 47 patients had RCA disease. The frequency of having attention in more than half of the territorial polar map in RCA (77%) was significantly higher than LAD (49%) or LCX territories (23%) (p for both<0.001). Additionally, from the above 163 patients, 30 patients with LAD (n=10), LCx (n=10), or RCA disease (n=10) were randomly picked and reevaluated by two expert readers. Among them, 17 patients (60%) had small-sized mild perfusion defects and 8 patients (27%) had moderate-sized, moderate to severe perfusion defects. Interestingly, 80% of patients with LAD disease had small-sized mild perfusion defects (mostly in the apex or distal anterior wall) while 40% of patients with RCA disease had moderate-sized moderate perfusion defects (mostly in the basal, mid, and distal inferior segments). The attention map highlighted 44% of the mild perfusion deficits and 100% of the moderate perfusion deficits. Wall motion and thickening abnormalities in the diseased territories were observed in 13% of patients including 3 patients with LAD disease, and 1 patient with LCX disease. All of the 4 patients had attention in the diseased territory.
We further analyzed whether the area of attention in the polar maps correlates with the area which has any quantitative perfusion defect in the maps in all 3,578 patients. There were significant correlations in whole coronary, LAD, LCX, and RCA territories (Table 3, p for all <0.001). In the territorial analysis, Pearson coefficients in LAD and LCX territories were higher than RCA territory (Table 3).
Table 3.
Correlation in Area within the Polar Maps between Attention and Quantitative Perfusion Defects (n=3,578)
| Pearson’s R | p | |
|---|---|---|
| All coronary territories (n=3,578) | 0.82 | <0.001 |
| LAD (n=3,578) | 0.83 | <0.001 |
| LCX (n=3,578) | 0.82 | <0.001 |
| RCA (n=3,578) | 0.72 | <0.001 |
LAD= left anterior descending artery, LCX= left circumflex coronary artery, RCA=right coronary artery
DISCUSSION
In this study, we described a clinical application of an AI system with explainable predictions tested in the largest to-date, multicenter population with invasive coronary angiography correlation in a multicenter and multi-system setting. The novel, general-purpose CAD-DL model, demonstrated significantly higher per-patient AUC compared to expert visual assessments performed during clinical reading as well as compared to “state-of-the-art” quantitative assessment. With matched specificity, the sensitivity of CAD-DL was significantly higher than visual and quantitative perfusion assessments. The per-vessel diagnostic performance of CAD-DL was higher compared to the quantitative analysis. Importantly, we developed a clinical prototype that can be integrated with standard clinical software and includes two easily understood features, CAD attention and probability maps which can explain AI-derived predictions to clinicians. Explainability could facilitate the acceptance of AI diagnosis of CAD following MPI, which is performed for more than 6 million patients annually in the United States (19).
The most novel aspect of our study is the generation of two complementary methods to explain predictions to facilitate clinical implementation (20–22). Often the “black-box” nature of AI is considered a significant barrier for use in clinical decision making. We utilized the technique to visualize the rationale for CAD-DL predictions, overlaying a highlighted region onto a perfusion image to generate the “CAD attention map”. Information from the CAD attention map was used to identify corresponding segments and categorize the probability of obstructive CAD and displayed as a “CAD probability map”. By highlighting portions of the image leading to the model’s prediction, explainable AI allows the physician to assess the relationship between the CAD-DL prediction and the clinical images. This would likely increase the confidence of physicians to use CAD-DL as an expert second-reader. Explainable AI is critical to overcoming the perception of AI as a “black box” (4,23) and could be provided to patients to increase acceptance of these implementations (24).
While we applied this approach to MPI, it could potentially be applied to many other aspects of clinical cardiology (6,27). For example, Ko et al. recently demonstrated that a deep-learning algorithm could identify patients with hypertrophic cardiomyopathy from 12-lead electrocardiography (5). Explainable AI could potentially be integrated with this approach to highlight areas of the electrocardiogram leading to an increased likelihood of hypertrophic cardiomyopathy, allowing physicians to identify potential abnormalities and assess their clinical significance. Similarly, it could be used to highlight myocardial features of functionally significant coronary stenosis on coronary computed tomography (25) or myocardial scar on cardiovascular magnetic resonance imaging (26). All of these potential applications of explainable AI could help improve the clinical translation of these methods, leading to improved patient care (5,27,28).
We took another step by developing a prototype to demonstrate the practicality of the clinical deployment of these methods. Our model can be integrated within standard clinical software and can generate results rapidly (<12 seconds on a standard clinical workstation) and therefore should not impact a typical clinical workflow. Since the model uses only limited clinical information available from the image header, this prediction was generated without an additional physician effort. This is significant for practical deployment since the manual entry of clinical variables is prone to error (29) and may preclude incorporation into a clinical workflow (30). We have previously demonstrated the ability to combine clinical and imaging variables with machine learning to improve outcome prediction (31–33). While these models were developed with automatically collected imaging variables, they also included manually collected clinical variables. CAD-DL approach described here does not include manually collected clinical information which simplifies clinical implementation.
An additional novel aspect was that the CAD-DL model was developed using raw myocardial perfusion, wall motion, and wall thickening polar maps. The image information was combined automatically with data available from the image header (age and sex) and cardiac volumes, which can be quantified with any nuclear cardiology software. Disease diagnosis was not improved by adding quantified perfusion data to the model (Supplemental Figure 6). Thus, the new approach is not dependent on normal limit databases or specific MPI software. The performance of CAD-DL was similar in patients imaged with new generation solid-state and conventional camera systems suggesting that it could be considered “general purpose”, and the results are broadly generalizable. While we highlighted the potential of CAD-DL to improve sensitivity, different thresholds could be established to provide a different trade-off between sensitivity and specificity based on clinical needs.
Interestingly, CAD-DL also demonstrated better diagnostic performance compared to expert visual interpretation, even though the physician diagnosis was made with all SPECT data and clinical information. Deep learning is known to extract latent information from data, which is not obvious to the human reader and thus can assist the reader and point out the contributing regions of interest. Nevertheless, the CAD-DL model is designed to present and explain predictions to aid physician interpretation; therefore, it should not be seen as a “threat” to physician interpretation, thus avoiding potential regulatory approval issues (21). While CAD-DL already demonstrates higher diagnostic accuracy than expert physician interpretation, a hybrid model with physician interpretation informed by CAD-DL has not yet been evaluated. This approach could potentially yield further gains in diagnostic accuracy, improving subsequent patient management and outcomes. The current study has only compared the diagnostic accuracy of an autonomous deep learning method to visual and quantitative assessments. Further studies may be needed to evaluate to what extent deep learning improves the diagnostic accuracy of visual interpretation.
Study Limitations
There is selection bias inherent in using a population of patients who underwent both MPI and coronary angiography, likely resulting in an overestimation of sensitivity and underestimation of specificity; however, we also demonstrated improved performance in populations with low prevalence of CAD. CAD-DL was trained to identify anatomically significant stenosis. Future studies, with comprehensive information regarding fractional flow reserve or coronary flow reserve, would be required to confirm the ability of CAD-DL to identify hemodynamically significant stenoses. While prospective validation was not performed, CAD-DL was tested using both repeated 10-fold testing and external testing on unseen data. These approaches conservatively estimate the performance when applied to a new patient population with potentially different patient characteristics. CAD-DL requires polar maps, which may vary between software vendors due to different heart segmentation methods and polar map representations. However, using the polar map format resolves variabilities in raw SPECT data between sites, camera types, tracers, and patients which otherwise may have been identified by deep learning as important features and representation of multiple types of nuclear cardiology data such as static 3D images and gated 3D images in a compact and uniform format. AI methods to integrate clinical, stress, and imaging variables can further improve disease diagnosis and future studies should investigate combined deep-learning and machine-learning models to allow direct image interpretation with integration of clinical and stress information. However, clinical adoption of these methods has been hindered in part due to the additional infrastructure or time needed to collect these variables. Therefore, a major benefit of direct image interpretation with CAD-DL is that predictions can be generated automatically from image data alone, without additional effort, in parallel with clinical MPI interpretation software.
CONCLUSION
This deep-learning model significantly surpasses the diagnostic accuracy of standard quantitative analysis and clinical visual reporting for MPI. Explainable artificial intelligence can be integrated within standard clinical software to facilitate acceptance of AI diagnosis of CAD following MPI and has many other potential applications in cardiology.
Supplementary Material
Clinical Perspectives.
Competency in Medical Knowledge
Clinical Competencies
Our prototype software could be implemented during routine clinical care, automatically providing predictions and explaining them with CAD attention and probability maps.
Translational Outlook
Explainable AI could be applied to many other aspects of clinical cardiology. Future prospective studies may assess if explainable AI leads to further improvement in clinical interpretation, and subsequently improved patient management and clinical outcomes.
ACKNOWLEDGMENT
We would like to thank all the individuals involved in the collection, processing, and analysis of data in this multicenter registry.
CONFLICTS OF INTEREST DISCLOSURE STATEMENT
This research was supported in part by grant R01HL089765 from the National Heart, Lung, and Blood Institute/National Institutes of Health (NHLBI/NIH) (PI: Piotr Slomka). The content is solely the responsibility of the authors and does not necessarily represent the official views of the National Institutes of Health.
Drs. Berman and Slomka and Mr. Kavanagh participate in software royalties for QPS software at Cedars-Sinai Medical Center. Dr. Slomka has received research grant support from Siemens Medical Systems and Amazon Web Services. Drs. Berman, Dorbala, Einstein, and Edward Miller have served as consultants for GE Healthcare. Dr. Einstein has served as a consultant to W. L. Gore & Associates. Dr. Dorbala has served as a consultant to Bracco Diagnostics; her institution has received grant support from Astellas. Dr. Di Carli has received research grant support from Spectrum Dynamics and consulting honoraria from Sanofi and GE Healthcare. Dr. Ruddy has received research grant support from GE Healthcare and Advanced Accelerator Applications. Dr. Einstein’s institution has received research support from GE Healthcare, Philips Healthcare, Toshiba America Medical Systems, Roche Medical Systems, and W. L. Gore & Associates. The remaining authors have nothing to disclose.
Abbreviations
- AI
artificial intelligence
- AUC
area under the ROC curve
- CAD
coronary artery disease
- LAD
left anterior descending coronary artery
- LCx
left circumflex coronary artery
- MPI
myocardial perfusion imaging
- RCA
right coronary artery
- SPECT
single-photon emission computed tomography
- SSS
summed stress score
- TPD
total perfusion deficit
REFERENCES
- 1.Collaborators GCoD. Global, regional, and national age-sex specific mortality for 264 causes of death, 1980–2016: a systematic analysis for the Global Burden of Disease Study 2016. Lancet 2017;390:1151–1210. [DOI] [PMC free article] [PubMed] [Google Scholar]
- 2.Betancur J, Commandeur F, Motlagh M et al. Deep Learning for Prediction of Obstructive Disease From Fast Myocardial Perfusion SPECT: A Multicenter Study. JACC Cardiovasc Imaging 2018;11:1654–1663. [DOI] [PMC free article] [PubMed] [Google Scholar]
- 3.Betancur JA, Hu LH, Commandeur F et al. Deep Learning Analysis of Upright-Supine High-Efficiency SPECT Myocardial Perfusion Imaging for Prediction of Obstructive Coronary Artery Disease: A Multicenter Study. J Nucl Med 2018. [DOI] [PMC free article] [PubMed]
- 4.Engel TR. Diagnosis of Hypertrophic Cardiomyopathy: Who Is in Charge Here-The Physician or the Computer? J Am Coll Cardiol 2020;75:734–735. [DOI] [PubMed] [Google Scholar]
- 5.Ko WY, Siontis KC, Attia ZI et al. Detection of Hypertrophic Cardiomyopathy Using a Convolutional Neural Network-Enabled Electrocardiogram. J Am Coll Cardiol 2020;75:722–733. [DOI] [PubMed] [Google Scholar]
- 6.Slomka PJ, Betancur J, Liang JX et al. Rationale and design of the REgistry of Fast Myocardial Perfusion Imaging with NExt generation SPECT (REFINE SPECT). J Nucl Cardiol 2018. [DOI] [PMC free article] [PubMed]
- 7.Arsanjani R, Xu Y, Hayes SW et al. Comparison of fully automated computer analysis and visual scoring for detection of coronary artery disease from myocardial perfusion SPECT in a large population. J Nucl Med 2013;54:221–8. [DOI] [PMC free article] [PubMed] [Google Scholar]
- 8.Betancur J, Rubeaux M, Fuchs TA et al. Automatic Valve Plane Localization in Myocardial Perfusion SPECT/CT by Machine Learning: Anatomic and Clinical Validation. J Nucl Med 2017;58:961–967. [DOI] [PMC free article] [PubMed] [Google Scholar]
- 9.Otaki Y, Betancur J, Sharir T et al. 5-Year Prognostic Value of Quantitative Versus Visual MPI in Subtle Perfusion Defects: Results From REFINE SPECT. JACC Cardiovasc Imaging 2019. [DOI] [PMC free article] [PubMed]
- 10.Nakazato R, Tamarappoo BK, Kang X et al. Quantitative upright-supine high-speed SPECT myocardial perfusion imaging for detection of coronary artery disease: correlation with invasive coronary angiography. J Nucl Med 2010;51:1724–31. [DOI] [PMC free article] [PubMed] [Google Scholar]
- 11.Slomka PJ, Nishina H, Berman DS et al. Automated quantification of myocardial perfusion SPECT using simplified normal limits. J Nucl Cardiol 2005;12:66–77. [DOI] [PubMed] [Google Scholar]
- 12.Slomka PJ, Berman DS, Xu Y et al. Fully automated wall motion and thickening scoring system for myocardial perfusion SPECT: method development and validation in large population. Journal of nuclear cardiology : official publication of the American Society of Nuclear Cardiology 2012;19:291–302. [DOI] [PMC free article] [PubMed] [Google Scholar]
- 13.Selvaraju RR, Cogswell M, Das A, Vedantam R, Parikh D, Batra D. Grad-CAM: Visual Explanations from Deep Networks via Gradient-Based Localization. 2017 IEEE International Conference on Computer Vision (ICCV), 2017:618–626.
- 14.Dorbala S, Ananthasubramaniam K, Armstrong IS et al. Single Photon Emission Computed Tomography (SPECT) Myocardial Perfusion Imaging Guidelines: Instrumentation, Acquisition, Processing, and Interpretation. Journal of nuclear cardiology : official publication of the American Society of Nuclear Cardiology 2018;25:1784–1846. [DOI] [PubMed] [Google Scholar]
- 15.Molinaro AM, Simon R, Pfeiffer RM. Prediction error estimation: a comparison of resampling methods. Bioinformatics 2005;21:3301–7. [DOI] [PubMed] [Google Scholar]
- 16.Bleeker SE, Moll HA, Steyerberg EW et al. External validation is necessary in prediction research: a clinical example. J Clin Epidemiol 2003;56:826–32. [DOI] [PubMed] [Google Scholar]
- 17.DeLong ER, DeLong DM, Clarke-Pearson DL. Comparing the areas under two or more correlated receiver operating characteristic curves: a nonparametric approach. Biometrics 1988;44:837–45. [PubMed] [Google Scholar]
- 18.Cerqueira MD, Weissman NJ, Dilsizian V et al. Standardized myocardial segmentation and nomenclature for tomographic imaging of the heart. A statement for healthcare professionals from the Cardiac Imaging Committee of the Council on Clinical Cardiology of the American Heart Association. Int J Cardiovasc Imaging 2002;18:539–42. [PubMed] [Google Scholar]
- 19.IMV. Nuclear Medicine Market Outlook Report 2018 2019.
- 20.Krittanawong C, Johnson KW, Rosenson RS et al. Deep learning for cardiovascular medicine: a practical primer. Eur Heart J 2019;40:2058–2073. [DOI] [PMC free article] [PubMed] [Google Scholar]
- 21.Dey D, Slomka PJ, Leeson P et al. Artificial Intelligence in Cardiovascular Imaging: JACC State-of-the-Art Review. J Am Coll Cardiol 2019;73:1317–1335. [DOI] [PMC free article] [PubMed] [Google Scholar]
- 22.Johnson KW, Torres Soto J, Glicksberg BS et al. Artificial Intelligence in Cardiology. J Am Coll Cardiol 2018;71:2668–2679. [DOI] [PubMed] [Google Scholar]
- 23.Fellous JM, Sapiro G, Rossi A, Mayberg H, Ferrante M. Explainable Artificial Intelligence for Neuroscience: Behavioral Neurostimulation. Frontiers in Neuroscience 2019;13. [DOI] [PMC free article] [PubMed]
- 24.Longoni C, Bonezzi A, Morewedge CK. Resistance to Medical Artificial Intelligence. Journal of Consumer Research 2019;46:629–650. [Google Scholar]
- 25.Zreik M, Lessmann N, van Hamersvelt RW et al. Deep learning analysis of the myocardium in coronary CT angiography for identification of patients with functionally significant coronary artery stenosis. Med Image Anal 2018;44:72–85. [DOI] [PubMed] [Google Scholar]
- 26.Fahmy AS, Rausch J, Neisius U et al. Automated Cardiac MR Scar Quantification in Hypertrophic Cardiomyopathy Using Deep Convolutional Neural Networks. JACC: Cardiovascular Imaging 2018;11:1917. [DOI] [PMC free article] [PubMed] [Google Scholar]
- 27.Ribeiro AH, Ribeiro MH, Paixão GMM et al. Automatic diagnosis of the 12-lead ECG using a deep neural network. Nature Communications 2020;11:1760. [DOI] [PMC free article] [PubMed] [Google Scholar]
- 28.Lu MT, Ivanov A, Mayrhofer T, Hosny A, Aerts H, Hoffmann U. Deep Learning to Assess Long-term Mortality From Chest Radiographs. JAMA Netw Open 2019;2:e197416. [DOI] [PMC free article] [PubMed] [Google Scholar]
- 29.Mays JA, Mathias PC. Measuring the rate of manual transcription error in outpatient point-of-care testing. Journal of the American Medical Informatics Association 2019;26:269–272. [DOI] [PMC free article] [PubMed] [Google Scholar]
- 30.Kelly CJ, Karthikesalingam A, Suleyman M, Corrado G, King D. Key challenges for delivering clinical impact with artificial intelligence. BMC Med 2019;17:195. [DOI] [PMC free article] [PubMed] [Google Scholar]
- 31.Betancur J, Otaki Y, Motwani M et al. Prognostic Value of Combined Clinical and Myocardial Perfusion Imaging Data Using Machine Learning. JACC Cardiovasc Imaging 2018;11:1000–1009. [DOI] [PMC free article] [PubMed] [Google Scholar]
- 32.Hu LH, Betancur J, Sharir T et al. Machine learning predicts per-vessel early coronary revascularization after fast myocardial perfusion SPECT: results from multicentre REFINE SPECT registry. Eur Heart J Cardiovasc Imaging 2020;21:549–559. [DOI] [PMC free article] [PubMed] [Google Scholar]
- 33.Hu L-H, Miller RJH, Sharir T et al. Prognostically safe stress-only single-photon emission computed tomography myocardial perfusion imaging guided by machine learning: report from REFINE SPECT. European Heart Journal - Cardiovascular Imaging 2020. [DOI] [PubMed]
- 34.Kingma D, Ba J. Adam: A Method for Stochastic Optimization. International Conference on Learning Representations 2014.
Associated Data
This section collects any data citations, data availability statements, or supplementary materials included in this article.