

Abstract
The human brain entertains rich spatiotemporal dynamics, which are drastically reconfigured when consciousness is lost due to anaesthesia or disorders of consciousness (DOC). Here, we sought to identify the neurobiological mechanisms that explain how transient pharmacological intervention and chronic neuroanatomical injury can lead to common reconfigurations of neural activity. We developed and systematically perturbed a neurobiologically realistic model of whole-brain haemodynamic signals. By incorporating PET data about the cortical distribution of GABA receptors, our computational model reveals a key role of spatially-specific local inhibition for reproducing the functional MRI activity observed during anaesthesia with the GABA-ergic agent propofol. Additionally, incorporating diffusion MRI data obtained from DOC patients reveals that the dynamics that characterise loss of consciousness can also emerge from randomised neuroanatomical connectivity. Our results generalise between anaesthesia and DOC datasets, demonstrating how increased inhibition and connectome perturbation represent distinct neurobiological paths towards the characteristic activity of the unconscious brain.
Subject terms: Biophysical models, Dynamical systems, Network models, Consciousness
Perturbations in a large-scale whole-brain model suggest that anesthesia and injury may be imparting functionally similar effects in terms of brain dynamics.
Introduction
The human brain generates a dynamically changing repertoire of neural activity, supporting its rich variety of conscious experiences and cognitive functions1–15. A central challenge of contemporary neuroscience is the quest to understand how the neurobiology and function of the human brain give rise to such rich conscious experience16,17. One way to address this question is to identify changes in brain function that accompany changes in conscious state18. Recently, increased focus on brain dynamics2,19–25 has enabled substantial progress on this question18,26–35.
However, the brain is a paradigmatic example of a complex system36, and different perturbations of its precise functioning can serve as a path towards loss of consciousness. Examples of such perturbations range from transient pharmacological (general anaesthetic) interventions having widespread effects on neuromodulation37–40, to chronic disorders of consciousness arising from injuries of diverse location and extent, often including changes to the physical connectivity between brain regions41–58. This similarity of outcomes and neural signatures18,26–30 despite arising from radically different causes, begs the question: How can (transient) pharmacological and (chronic) structural perturbations converge to similar effects on dynamic brain activity, and the corresponding state of unconsciousness?
Here, we sought to obtain mechanistic insights into this fundamental question by employing whole-brain computational modelling. Neuropsychological studies in human patients and experimental lesions in animal models have provided invaluable insights about brain organisation, function and dysfunction59–62. Whole-brain computational models can be systematically and reversibly manipulated in ways that are still beyond the capabilities of experimental research, whether in humans or animals63,64. Therefore, in-silico whole-brain models23,65,66 are uniquely suited to investigate how different neurobiological perturbations can induce similar alterations of brain activity23,63,66–78, including recent successful applications to the study of consciousness with oscillator-based models (Hopf)79–85 or models based on statistical mechanics (Ising)86–88.
Crucially, recent work has demonstrated that more detailed biophysical models that incorporate neurophysiologically realistic information about excitation, inhibition and neuromodulation – so-called Dynamic Mean Field (DMF) models – can provide insights about pharmacologically-induced changes in macroscale fMRI haemodynamics, in terms of the underlying neurobiology89–91. Such neurobiologically realistic computational models provide a principled way to bridge across scales, relating the macroscale neural dynamics of fMRI to the microscale neurophysiological mechanisms from which they emerge63,92. However, to date no studies have harnessed the power of DMF models to provide neurobiologically realistic accounts of pharmacological and chronic loss of consciousness.
Here, we leveraged a neurobiologically realistic DMF model informed by multimodal neuroimaging including empirical brain activity from functional MRI, anatomical connectivity obtained from diffusion MRI, and GABA-A receptor density estimated from positron emission tomography (PET). We used this modelling approach to simulate the empirical fMRI macroscale brain activity observed in the same n = 16 subjects during wakefulness and during loss of consciousness induced by the intravenous anaesthetic, propofol. We also studied the fMRI activity of a cohort (n = 21) of patients suffering from chronic disorders of consciousness (DOC) as a result of severe brain injury (traumatic or anoxic), comparing them with a group of n = 20 healthy controls. By subjecting the models to virtual anaesthesia (local modulation of inhibitory gain based on empirical GABA-A receptor distribution) and virtual DOC (alteration of the model’s structural connectome), we sought to identify the neurobiological mechanisms underlying a fundamental question of modern neuroscience: how can transient perturbations of neurotransmission and chronic lesions to the structural connectome, both give rise to unconsciousness and its characteristic similar haemodynamic signatures 18,26,27,29,93?
Results
We employed a neurobiologically realistic dynamic mean-field (Fig. 1) model to investigate how perturbations of neurotransmission and lesions to brain connectivity can both give rise to the characteristic spatiotemporal patterns of brain activity observed during loss of consciousness. The DMF model reduces the intricate dynamics of individual neurons to a set of coupled differential equations which approximate the detailed microscale neural properties of spiking neurons (incorporating realistic aspects of neurophysiology such as synaptic dynamics and membrane potential)94 via a mean-field reduction19,22,25,95,96. Specifically, cortical regions are represented as macroscopic neural fields, whose local dynamics are coupled together by a network of anatomical connections19,22,25. An additional biophysical haemodynamic model can then be used to turn the DMF model’s activity into a realistic simulator of BOLD signals97.
Fig. 1. Overview of whole-brain computational model incorporating multimodal neuroimaging data.

Based on a cortical parcellation with 68 regions of interest, each node (cortical region) is modelled through a neurophysiologically realistic biophysical model incorporating excitatory (NMDA) as well as inhibitory (GABA) synaptic dynamics. Nodes are connected by structural connectivity (from diffusion MRI) and the model’s simulated BOLD signals are fitted to simulate empirical BOLD signal patterns (from functional MRI). Neurotransmitter information from PET can also be added in the model as modulating the local neuronal gain89.
Following previous DMF modelling work89, we evaluate the quality of fit in terms of the Kolmogorov-Smirnov distance between the distributions of real and simulated functional connectivity dynamics (FCD), corresponding to the patterns of inter-temporal correlations between sliding windows of functional connectivity, thereby taking into account both spatial and temporal aspects of haemodynamic activity. We followed this procedure for each of our two datasets (Supplementary Figure 1 and Methods): for the propofol dataset we optimised the model to fit the functional connectivity dynamics of empirical fMRI data acquired during the awake scan, and for the DOC dataset we optimised the model to fit the FCD observed in the healthy controls. These two calibrated DMF models - with their corresponding global coupling values fitted to the BOLD signals of the conscious brain for each of our two datasets - constitute the starting point for our investigations.
Inhibitory modulation from GABA-A receptor distribution reveals a shared mechanism for loss of consciousness
Propofol is a potent agonist of inhibitory GABA-A receptors98,99. The effects of propofol anaesthesia on the brain were therefore modelled by capitalising on the recently built whole-brain map of GABA-A regional receptor density, generated on the basis of benzodiazepine receptor (BZR) density measured from [11C]flumazenil Positron Emission Tomography (PET; see Methods)100. Incorporating this information in the DMF model allowed us to evaluate the extent to which the dynamics of the anaesthetised brain can be explained in terms of propofol-induced alterations in the detailed balance of local excitation and inhibition.
In seminal previous work, Deco and colleagues89 modelled the effects of the serotonergic drug LSD by locally modulating the neuronal gain of each excitatory population in the model according to the empirical distribution of 5HT-2A receptors across brain regions89. Inspired by their approach, here we demonstrate that the influence of regional GABA-A receptor density on functional dynamics can be modelled using a DMF model informed by regional GABA-A receptor density.
The strategy followed by Deco and colleagues89 was to first calibrate the model on awake data to obtain a global coupling value (see Methods), and then fit a secondary inhibitory parameter separately on awake and post-propofol (anaesthetised) data. Our approach follows Deco’s but differs in one key respect: given the inhibitory nature of GABA, we modulated the inhibitory (rather than excitatory) local gain (note that the excitatory and inhibitory populations within each region in the biophysical model are mutually and recursively coupled, and hence both excitation and inhibition are eventually affected by this procedure) (Fig. 2a). To do so, we introduced an inhibitory gain scaling parameter in the model, denoted by sI. This parameter allowed us to scale the inhibitory gain at each region according to the empirical local density of GABA-A receptors, as quantified based on PET-derived maps of receptor density100.
Fig. 2. Modulation of inhibitory gain by empirical GABA-A receptor density improves model fit to propofol dynamics.

a The inhibitory gain of each node in the balanced DMF model is modulated by the regional density of GABA-A receptors, estimated from PET. b Box-plots show the model fit for n = 100 simulations, quantified as the KS-distance (lower is better) to the functional connectivity dynamics (FCD) derived from the propofol (anaesthetised) condition, using a value of gain for inhibitory scaling sI derived from calibrating the model with respect to either the awake (blue) or propofol (grey on shaded background) conditions. Middle line: median; box limits, upper and lower quartiles; whiskers, 1.5x inter-quartile range; “+” symbol indicates outliers; ***p < 0.001 from t-test. Source data are provided in Supplementary Data 1. We replicated this result using an alternative version of the KS-distance, which in addition to the distribution of FCD values also takes into account the temporal lag between them (Supplementary Fig. 2).
This procedure allowed us to ask whether adjusting the value of inhibitory gain sI according to local GABA-A receptor density would allow the model to simulate the spatiotemporal patterns of haemodynamic activity that characterise acute propofol-induced unconsciousness. A positive answer to this question would implicate regional GABA-ergic inhibition as a neurobiological mechanism behind the action of propofol (a known GABA-ergic agonist) in inducing the characteristic macroscale activity patterns observed during loss of consciousness due to propofol anaesthesia18,26,28,29.
To address this issue, we studied whether some appropriate value of sI (which scales the gain related to the local GABA-A receptor density) would improve the model’s ability to simulate the dynamics of deep propofol anaesthesia. For this purpose, we used the previously calibrated DMF model to generate simulations for each value of sI between 0 (corresponding to the model without local GABA inhibitory modulation) and 1, in increments of 0.02. Then, for each value of sI, we computed the KS distance between the model’s simulated functional connectivity dynamics, and the empirical FCD observed in the awake and in the anaesthetised subjects, respectively. Separately for each condition, the optimal value of sI, was then identified as the value that resulted in the minimum mean KS distance between empirical and simulated FCD (across n = 10 simulations for each value of sI).
Having completed the fitting procedure for our models, we then proceeded to analyse the models’ performance. To this end, we generated n = 100 simulations from each of the propofol-fitting and awake-fitting models. For both models, we then computed the KS distance between each simulation, and the empirical FCD observed during wakefulness, and during anaesthesia. This provided us with a way to quantify the ability of each model (in terms of goodness of fit, i.e., low KS distance) to simulate the empirical patterns of spatiotemporal brain activity observed during wakefulness, and the empirical patterns of spatiotemporal brain activity observed during propofol-induced loss of consciousness.
Our results indicate that the DMF model’s ability to simulate the empirical FCD observed during propofol-induced anaesthesia can be significantly improved (lower KS-distance) by increasing the inhibitory gain scaling from the value that best reproduces the awake functional connectivity dynamics (sI = 0.02) to a higher value (sI = 0.52) (Fig. 2b and Supplementary Table 1). In other words, the modulation of inhibition in accordance with the empirical distribution of GABA-A receptors across brain regions, makes the model capable of switching between simulating awake or anaesthetised brain activity. Since propofol is a well-known GABA-ergic agonist, these results confirm that taking into account GABA agonism (local modulation of inhibitory gain by regional GABA-A receptor density) is sufficient to recapitulate the known effects of the GABA-ergic agent propofol on empirical brain activity patterns, leading to dynamics that are known to characterise the state of unconsciousness.
Crucially, we also confirmed that the improved fit to anaesthetised dynamics is not merely the result of increasing overall inhibition in the model: rather, regional information about the distribution of GABA receptor density plays a key role in the model’s improved fit. To demonstrate this point, we show that the results are not replicated if the PET-derived regional distribution of GABA-A receptor density is reshuffled across regions while preserving spatial autocorrelation (Methods) (Fig. 3a, b), or if uniform values are used for each region (i.e., by setting all regions to have a value equal to the mean of the distribution; Fig. 3c). In both cases, the model’s ability to fit anaesthetised dynamics is significantly impaired compared with the model using the empirical distribution of GABA-A receptors obtained from in vivo PET imaging (Fig. 3 and Supplementary Table 1). Therefore, our results show that the specific regional distribution of GABA-A receptors across the cortex plays a key role in generating the spatiotemporal patterns of brain activity characteristic of unconsciousness induced by propofol administration.
Fig. 3. Modulation of inhibitory gain by reshuffled or uniform GABA-A receptor density.
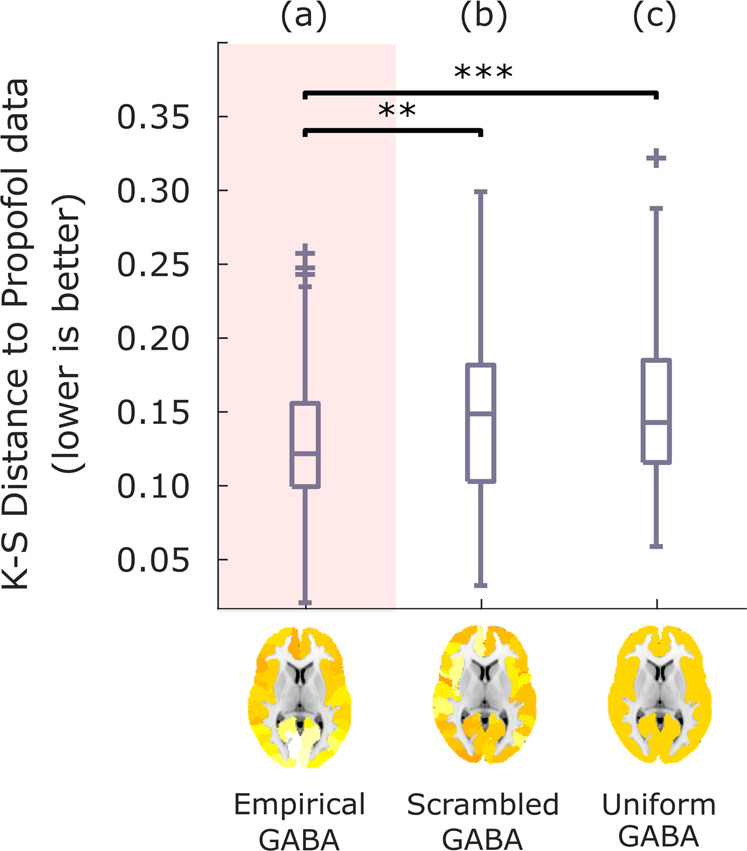
After identifying the value of sI that leads to the best fit with the empirical propofol data when modulating the inhibitory gain of each node in the balanced DMF model according to the empirical distribution of GABA-A receptors (a), the simulation is repeated after randomly reshuffling the regional receptor densities across the cortex (b), or setting them all to a uniform value (mean of the empirical distribution) (c). Box-plots show the model fit to the propofol data for n = 100 simulations, quantified as KS-distance (lower is better) between simulated and empirical FCD, for each variant of the model. Middle line: median; box limits, upper and lower quartiles; whiskers, 1.5x inter-quartile range; “+” symbol indicates outliers; **p < 0.01; ***p < 0.001 from t-test. Source data are provided in Supplementary Data 1. We replicated this result using an alternative version of the KS-distance, which in addition to the distribution of FCD values also takes into account the temporal lag between them (Supplementary Fig. 2).
Simulated brain injury induces unconscious-like dynamics
Whole-brain computational models provide a unique tool to understand the effects of connectome alterations on macroscale brain activity73,74,86. We developed a procedure to probe which of two conditions is more compatible with a given perturbation of the connectome, in terms of the connectome’s capacity to support the corresponding brain activity. We term this procedure, Connectome Replacement Analysis. The procedure involves (i) calibrating the model based on the healthy connectome; (ii) evaluating the relative suitability of this healthy calibrated model to reproduce the empirical activity patterns of the healthy conscious brain, versus the empirical activity patterns of our condition of interest (here, DOC patients), in terms of the difference between the KS-distance to the respective empirical FCDs; (iii) replacing the underlying healthy connectome of the initial calibrated model, with a perturbed connectome, and generating new simulated haemodynamic signals; (iv) re-evaluating the relative difference in KS-distance to each condition (healthy and DOC) for the new simulated brain activity.
Leveraging this capability, we subjected the DMF model to the virtual equivalent of severe brain injury: namely, we replaced the underlying connectivity matrix governing the long-range interactions between brain regions with a consensus connectome101 obtained from diffusion-weighted imaging of n = 21 patients with chronic DOC due to severe brain injury (Fig. 4a). This procedure imparts the model with effects akin to what severe brain injury does on anatomical connectivity. This virtual DOC provides a way to isolate the effects over brain dynamics of connectivity disruptions that result in loss of human consciousness.
Fig. 4. Connectome replacement analysis with DOC connectome.

a The original healthy connectome of the model is replaced with the group-average connectome obtained from diffusion MRI of n = 21 DOC patients, and the resulting model is used to generate n = 100 simulations. b–e Box-plots show the difference in model fit (KS-distance) between the two conditions (fit to DOC patients’ data minus fit to healthy controls’ data, over n = 100 simulations), for the initial model calibrated based on the healthy connectome (b), and after replacing the model’s initial connectome with either the DOC patients’ empirical consensus connectome (c), or after rewiring the initial connectome into a random network (d), or into a regular (lattice) network (e). Middle line: median; box limits, upper and lower quartiles; whiskers, 1.5x inter-quartile range; “+” symbol indicates outliers; ***p < 0.001; n.s. Not significant (p > 0.05) from t-test. Source data are provided in Supplementary Data 2. We replicated this result using an alternative version of the KS-distance, which in addition to the distribution of FCD values also takes into account the temporal lag between them (Supplementary Fig. 3).
Note that such substantial perturbations are naturally expected to deteriorate the model’s ability to replicate empirical brain activity (i.e., increasing the KS distance, corresponding to decreased goodness-of-fit): the initial calibrated model was optimised with biophysical parameters pertaining to healthy brains, and using a healthy connectome. However, what matters for this analysis is not the absolute value of the fit, but rather its relative difference between the two conditions. Specifically, our hypothesis was that the haemodynamic activity generated by the model with DOC connectome should be more similar (lower KS distance, indicating a better fit) to the empirical dynamics of DOC patients’ brains, than to the dynamics of conscious, healthy brains.
Our results supported these predictions. The calibrated model based on the healthy connectome exhibited a better fit for the dynamic activity patterns of the healthy brain than for the DOC patients’ brain activity (positive difference in KS-distance; Fig. 4b and Supplementary Table 2). This pattern was reversed upon replacing the healthy connectome with the consensus connectome101 obtained from DOC patients’ DTI data, such that the difference in KS-distance to the two conditions became negative, indicating on average a better fit to the empirical brain activity of DOC patients than healthy controls (Fig. 4c and Supplementary Table 2).
This observation supports our hypothesis, demonstrating that unconscious brain dynamics are more compatible with the DOC connectome than conscious dynamics; below, we also demonstrate that this result is not specific to the chronic unconsciousness that characterises disorders of consciousness, but rather it generalises to the transient unconsciousness caused by propofol anaesthesia, too. We also replicated this result when constructing the DOC “consensus connectome” after excluding the n = 6 DOC patients whose diffusion-weighted data were acquired with a different protocol (see Methods), thereby excluding this potential confound as an explanation for our results (Supplementary Fig. 4).
Remarkably, these results could be replicated by replacing the original healthy structural connectome with a randomised version having the same average connectivity102. After perturbation, the model’s fit to DOC patients’ empirical brain activity became better than the model’s fit to the spatiotemporal activity of the conscious brain (Fig. 4d and Supplementary Table 2), suggesting that the dynamics underlying unconsciousness are more compatible with a randomised connectome than the dynamics underlying the activity of the conscious brain. In contrast, this effect could not be observed when the original connectome was rewired into a regular (lattice) network, indicating that not just any perturbation of the connectome is suitable to improve the model’s fit to unconscious brain activity vis-à-vis conscious brain activity. Together, these results suggest that DOC dynamics are more compatible with an unstructured connectome.
Generalisation across datasets
Having identified the role of GABA-mediated inhibition for propofol anaesthesia, we next sought to determine to what extent inhibition can also explain the dynamics of unconsciousness arising from severe brain injury. Our rationale was that, even though these patients have not been exposed to GABA-ergic agents but rather owe their condition to severe brain injury, recent evidence suggests similarities of dynamic spatiotemporal patterns of brain activity during anaesthesia and disorders of consciousness18,26,27,30,103. A positive answer to this question would further implicate a change in the excitation-inhibition balance, not just in the generation of brain activity pertaining to propofol anaesthesia, but more broadly as a general mechanism responsible for the characteristic dynamics of unconscious states - whether due to anaesthesia or brain injury.
Therefore, we followed the same virtual anaesthesia procedure with empirical data from healthy controls and DOC patients (note that this analysis did not involve a direct comparison with the data from the Ontario dataset, neither for the awake nor for the propofol conditions). Intriguingly, we observed analogous results: local modulation of inhibitory gain based on GABA-A receptor density (optimal sI = 0.4) allowed the model to substantially improve its fit to DOC patients’ brain activity, compared with a model incorporating the same information about receptor distribution, but whose inhibitory gain scaling sI was optimised to fit the controls’ brain activity (sI = 0.02) (Fig. 5a, b and Supplementary Table 3). However, in contrast with propofol anaesthesia, the improvements were also observed when the regional receptor map was scrambled, or replaced by a uniform map, such that no significant difference was observed between these latter two models, and the model incorporating the empirical distribution of GABA-A receptors obtained from PET (Fig. 5c, d and Supplementary Table 3). Thus, these results suggest that whereas propofol anaesthesia depends on the specific distribution of GABA-A receptors across the cortex, indicating that these receptors are mediating the effects of propofol, the characteristic dynamics of DOCs are less selective, and appear to correspond to a non-specific increase in global inhibition.
Fig. 5. Modulation of inhibitory gain by empirical GABA-A receptor density improves model fit to DOC brain dynamics.
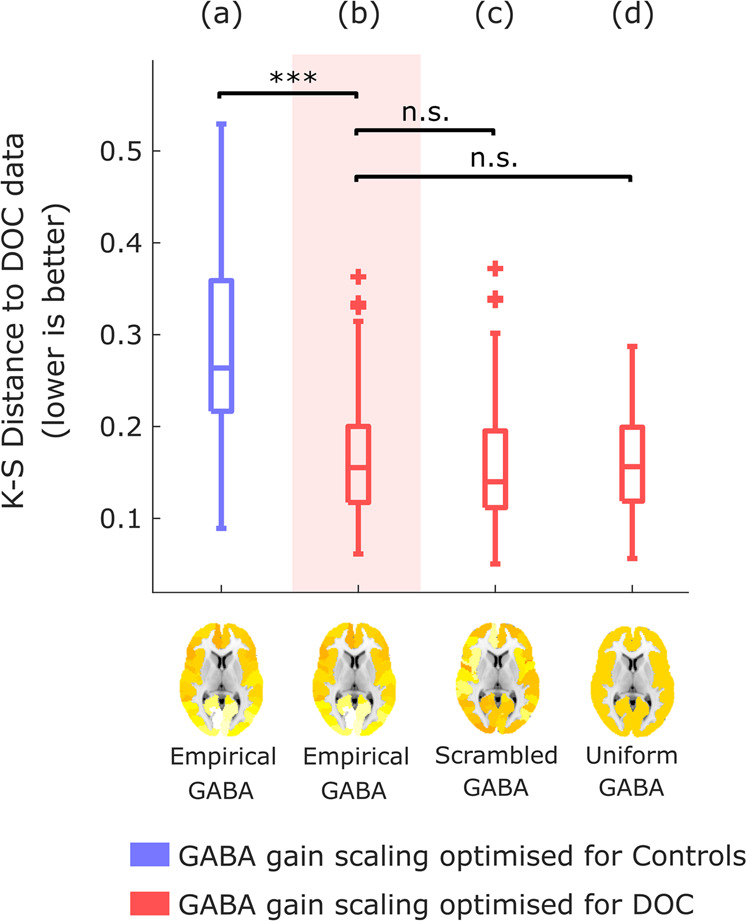
Box-plots show the KS-distance (lower is better) to the empirical brain activity of DOC patients, for n = 100 simulations of a model that (a) is informed by empirical GABA-A regional density, using the value of gain for inhibitory scaling sI derived from calibrating the model with respect to healthy controls’ empirical brain activity (blue); (b) is informed by empirical GABA-A regional density, using the value of gain for inhibitory scaling sI that provides the best fit to the DOC patients’ empirical brain activity (red); (c) same as (b), but the regional receptor densities are randomly reshuffled across the cortex; (d) same as (b), but the receptor densities are all set to a uniform value (the mean of the empirical distribution). Middle line: median; box limits, upper and lower quartiles; whiskers, 1.5x inter-quartile range; “+” symbol indicates outliers; ***p < 0.001. n.s. Not significant (p > 0.05) from t-test. Source data are provided in Supplementary Data 3.
Additionally, if propofol and severe injury are different ways by which the human brain can be pushed towards unconsciousness, then inducing a virtual DOC via connectome replacement should also lead to a model that is better able to simulate the characteristic spatiotemporal activity patterns of an anaesthetised brain, than an awake brain - thereby recapitulating what we previously observed with the macroscale brain activity of DOC patients. Remarkably, results show that - as previously observed with DOC patients -simulated functional connectivity dynamics generated from a model using the DOC connectome are more compatible (lower relative KS distance) with the functional connectivity dynamics of propofol anaesthesia than with the FCD of awake subjects’ brains (Fig. 6a, b and Supplementary Table 4).
Fig. 6. Connectome replacement analysis with DOC connectome generalises to propofol anaesthesia.
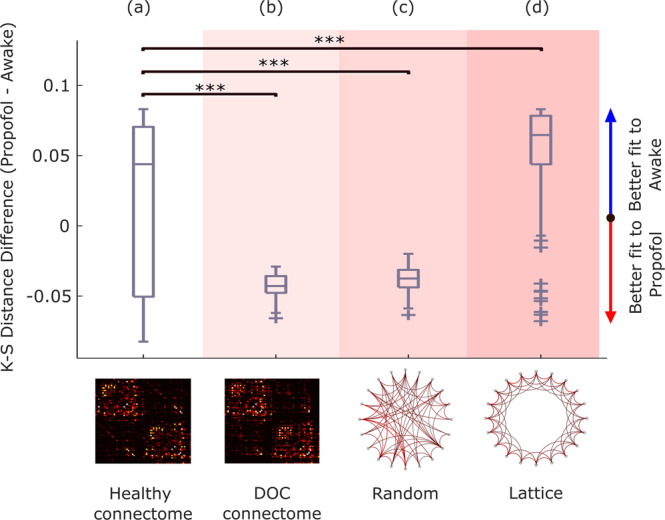
Box-plots show the difference in model fit (KS-distance) between the two conditions (fit to propofol data minus fit to awake data, over n = 100 simulations), for the initial model calibrated based on the healthy connectome (a), and after replacing the model’s initial connectome with either the DOC patients’ empirical consensus connectome (b), or after rewiring the initial connectome into a random network (c), or into a regular (lattice) network (d). Middle line: median; box limits, upper and lower quartiles; whiskers, 1.5x inter-quartile range; “+” symbol indicates outliers; ***p < 0.001 from t-test. Source data are provided in Supplementary Data 4.
Furthermore, the importance of the topology of the perturbed connectome was also observed for brain activity under propofol, with randomisation of the connectome similarly reversing the relative difference in the model’s ability to fit the FCD of conscious brains (awake) vis-à-vis unconscious brains (propofol) in favour of the latter (Fig. 6c and Supplementary Table 4). Conversely, the opposite effect was observed when the original connectome was replaced with a regular (lattice) network, which resulted in a further significant deterioration in the model’s ability to reproduce the FCD of the anaesthetised brain vis-à-vis the awake brain (Fig. 6d and Supplementary Table 4).
These findings generalise our DOC results to propofol anaesthesia, indicating that the DOC connectome is not only more compatible with the macroscale spatiotemporal patterns of DOC patients’ brain activity than with the brain activity of healthy individuals. Rather, the generalisation to propofol anaesthesia suggests that the DOC connectome may be more compatible with unconscious dynamics in general: whether arising from brain injury or pharmacological intervention.
Alternative approaches
We also considered alternative methodological approaches to complement our main analyses. Pertaining to modelling the propofol data, although for our main analyses we followed previous publications in employing a regionally homogeneous value of the gain scaling parameter sI89, we considered whether this value may also vary in a regionally-specific manner - in addition to the regional heterogeneity that we already incorporate in our model by taking into account the empirically-derived regional GABA receptor density. We reasoned that, if there is regional variability in inhibitory gain scaling (independent of the local density of receptors), a plausible account for this phenomenon may be the regional prevalence of specific types of inhibitory interneurons. Therefore, in addition to regional GABA-A receptor density from PET, we added regional variability in sI values in proportion to empirical regional values of different types of interneurons. We obtained these maps from the Allen Institute for Brain Science transcriptomic dataset, parcellated using standard pipelines from the abagen toolbox:104 somatostatin-positive (SST + ), parvalbumin-positive (PVALB + ) and vasoactive intestinal peptide-positive (VIP + ) ones, which together account for the majority of cortical interneurons. This analysis did not indicate significant improvements in the ability of the model to fit the propofol data, compared with our main model incorporating regionally heterogeneous GABA-A receptor densities but homogeneous sI (Supplementary Fig. 5). Although a computationally intensive joint optimisation of both regionally variable parameters may yield additional insights, our results show that taking into account the empirical heterogeneity of regional GABA-A receptor densities is already sufficient to improve the model’s ability to fit propofol data - which was our goal.
Pertaining to modelling the DOC data, insight about the effects of perturbations on a dynamical system can also be obtained by studying the system’s Jacobian, which takes into account both the system’s dynamics and its underlying network structure (here, the different connectomes: healthy, DOC, random and lattice), and whose eigenspectrum provides information about stability in the vicinity of fixed points in the system’s dynamics105. In Supplementary Note 1, we show that the real part of the eigenvalues of the reconstructed Jacobians from the healthy connectome exhibits the least similarity (correlation) with the eigenvalues obtained from perturbed connectomes (DOC, random and lattice), which are more highly correlated with each other (Supplementary Fig. 6). While our main results also clearly point to a similarity between the effects of random and DOC connectomes on simulated brain activity, our computational modelling suggests that their effects differ from those of a regular (lattice) network (Fig. 4). Thus, eigenspectrum analysis of the reconstructed system Jacobian and comparison of simulated versus empirical functional connectivity dynamics point to complementary insights that can be derived from these different methodologies.
Discussion
Here, we sought to identify neurobiological mechanisms that are capable of explaining how highly dissimilar causes - such as transient perturbations of neurotransmission versus chronic lesions to brain anatomy and connectivity - can give rise to loss of consciousness and its characteristic dynamic patterns of brain activity63. To this end, we employed a whole-brain Dynamic Mean Field model that simulates the macroscale functional haemodynamics of the human brain by means of neurobiologically realistic biophysical modelling, which integrates empirical spatiotemporal patterns from functional MRI, anatomical connectivity obtained from diffusion MRI, and neurotransmitter receptor density estimated from Positron Emission Tomography89–91. Our results demonstrate fundamental similarities, not just between the macroscale dynamic patterns of brain activity that characterise anaesthesia and disorders of consciousness18,26–30 but also between the neurobiological mechanisms from which they can arise - despite the fact that anaesthesia is a transient pharmacological intervention and DOCs are the result of permanent neuroanatomical injury. Both disorders of consciousness and propofol anaesthesia were shown to arise from neurobiological mechanisms that are functionally equivalent to connectome randomisation, and both involve increased perturbed excitation-inhibition balance, as indicated by incorporating into the model information about regional GABA-A receptor density estimated from PET
The effect of inhibition was assessed by enriching the DMF model, modulating the neuronal gain of each inhibitory population according to the empirical density of GABA-A receptors across cortical regions, quantified using in-vivo PET100. Our results demonstrate that GABA-mediated inhibition plays a mechanistic role in the emergence of the characteristic macroscale dynamic neural activity observed during propofol-induced unconsciousness. These results align with neurophysiological evidence indicating that propofol is primarily a GABA-A receptor agonist98,99. Indeed, our results further indicate that propofol anaesthesia is crucially dependent on the specific regional distribution of GABA-A receptors across the cortex, since neither reshuffling this distribution across regions nor setting all regions to equal density values could reproduce the same effect.
Remarkably, our PET-informed results showed that considering GABA-mediated scaling of regional inhibitory gain also improved the model’s ability to simulate the characteristic neural activity of DOC patients’ brains, even though these patients owe their chronic condition to severe brain injury rather than pharmacological intervention. This observation suggests a change of excitatory-inhibitory balance in favour of inhibition, not just in the generation of haemodynamic activity pertaining to propofol anaesthesia, but more broadly as a general neurobiological mechanism for the macroscale spatiotemporal activity patterns that characterise unconsciousness - whether due to anaesthesia or brain injury. Indeed, there is evidence that physiologically awake but unconscious DOC patients show cortical OFF-periods analogous to those observed in healthy individuals during sleep106, possibly arising from reduced cortico-cortical connectivity and a resulting shift in excitatory-inhibitory balance towards excessive inhibition107, as is observed at a local level after stroke108. And indeed, both disorders of consciousness and general anaesthesia are known to correspond to reduced cerebral metabolism, as measured with PET109,110.
Nevertheless, a key difference emerged between anaesthesia and DOC: whereas anaesthesia critically depends on propofol’s specific pattern of local inhibition across the cortex, incorporating regional specificity of GABA receptor density distribution did not further improve the model’s ability to simulate DOC patients’ functional connectivity dynamics, beyond the improvement provided by using a uniform or scrambled GABA-A receptor map. Therefore, whereas our results suggest that propofol anaesthesia may be causally mediated by GABA-A receptors and their specific distribution across the cortex, it appears that a global increase in inhibition is sufficient to generate the characteristic neural activity of disorders of consciousness.
Our results from connectome replacement point to injury-induced randomisation of the connectome as one such candidate mechanism in DOC patients. Specifically, our findings show that (a) unconscious fMRI functional connectivity dynamics (whether due to propofol anaesthesia or brain injury) are more compatible with the empirical DOC connectome, than conscious functional connectivity dynamics; and (b) unconscious functional connectivity dynamics are also more compatible with a random connectome than conscious ones, whereas the opposite holds for a lattice-like connectome (i.e., a regular network, the topological opposite of a random network), at least in the case of anaesthesia.
It is also remarkable that the same results from connectome replacement - greater compatibility of unconscious neural activity with the DOC connectome perturbation - could be generalised to the propofol dataset. For DOC patients, such a result may perhaps be expected, since the initial connectome used in the model was obtained from healthy controls, whereas the perturbed DOC connectome was obtained by combining the individual connectomes of the same DOC patients. However, observing the same result in the propofol dataset is a powerful validation of our approach, demonstrating that the results are specific to the presence vs absence of consciousness, rather than being influenced by the specific dataset used. Thus, thanks to connectome replacement we can infer that the increased neuronal inhibition that characterises both disorders of consciousness and anaesthesia, is functionally equivalent to randomisation of the connectome. However, propofol’s anaesthetic effects are mediated by GABA-A receptors according to their specific regional distribution, whereas disorders of consciousness can be explained in terms of a more generic increase in global inhibition - possibly arising from randomisation of the connectome due to anatomical lesions, whose extent and location are do not follow uniform patterns. Anaesthesia may be expected to operate similarly across individuals, in terms of which regions are more or less affected by propofol. In contrast, each DOC patient is unique in the cause, extent and location of their brain injury. As a result, whereas anaesthesia may depend on specific localised patterns, it stands to reason that the characteristic macroscale dynamics of DOC patients’ brains should arise from global-scale neurobiological mechanisms, which may originate from a variety of causes without necessarily depending on specific locations for injury.
Our focus here was on modelling signatures of unconsciousness that are shared across anaesthesia and disorders of consciousness; while this approach has enabled us to provide valuable insights about the neural mechanisms supporting human consciousness, this focus on common aspects means that we considered the cohort of DOC patients as a whole, both in terms of fitting the functional data and for obtaining a consensus connectome. In theory, it is possible that each patient may only exhibit increased inhibition in a specific region, but if such regions differ across patients, then considering them together may result in apparently uniform inhibition. Likewise, the similar effects of perturbation using a random connectome or the DOC connectome may in fact arise because we obtained a single DOC connectome from the combination of several patients, whose individual lesions may be specific but distinct. It is clear that the diversity of disorders of consciousness in terms of aetiology and severity can benefit from an individual-subject approach, to obtain complementary insights about each unique patient for the purposes of diagnosis, prognosis, and ultimately treatment111. In this regard, it is intriguing that some DOC patients can be paradoxically awakened by administration of the drug zolpidem, which is a GABA-ergic agonist112, which suggests that - at least for some patients - the causative neurobiological mechanisms may be substantially different from those identified here based on a group-average DOC connectome. Thus, having demonstrated the efficacy of our modelling approach at the group level, in future efforts we will build on the present results and apply the frameworks developed here to individual patients, to explore their specific deficits and potential avenues to promote recovery at a finer-grained level. Likewise, our framework could be adapted to model individual susceptibility to anaesthesia with GABA-ergic agents – and potentially predict individual risk of experiencing post-anaesthetic complications, such as emergence delirium113,114.
A well-known adage asserts that “All models are wrong”, and the present work is no exception. Models of neurobiological function can vary in complexity related to the level of physiological detail and scale, with both aspects incurring costs in terms of computational resources and time. Thus, trade-offs between realism and complexity are unavoidable23. Indeed, a variety of other modelling approaches are possible; even among DMF models, alternatives have been developed that incorporate additional information about regional neurobiology101,115 or use different fitting procedures90. More broadly, no single model can presently reproduce all relevant features of brain activity at once – in part because there is no consensus on what features of brain activity should be considered as relevant, or what the most appropriate scale for modelling is. In turn, these experimental and methodological considerations jointly shape what counts as a satisfactory model (i.e., the fitting criterion) – although here we sought to alleviate this concern by replicating our results with multiple fitting criteria. Likewise, alternative models (e.g. Hopf, Ising) have recently been used to investigate loss of consciousness during sleep79–84 anaesthesia81–83,85,87,88 and also disorders of consciousness83,85,86. Though less neurobiologically detailed, such models have been able to provide insights about different aspects of brain function, such as criticality and the predicted effects of applying external perturbations to individual regions. Thus, it is clear that further complementary insights may be obtained by considering additional neurobiological mechanisms and multiple levels of explanation - each of which may require a different modelling approach23,63,66.
Our results combining functional MRI (dynamic macroscale neural activity), diffusion MRI (anatomical connectivity) and PET (neurotransmitter system) demonstrate that human consciousness arises from the delicate balance of local excitation and inhibition, interacting across an intricate network of anatomical connections. Many paths can lead to unconsciousness by disturbing this balance, whether by influencing the nodes’ activity (through inhibitory modulation) or the connectivity between them (through connectome randomisation). As befits such a complex dynamical system as the human brain, it is likely that other paths to unconsciousness will also exist, explaining phenomena such as regular sleep-wake alternation, epileptic seizures, and the effects of non-GABAergic anaesthetics such as ketamine – some of which have already started to be explored using whole-brain computational modelling71,79,81,82,84. Extending the present framework to account for additional ways of losing consciousness will be a crucial endeavour. Likewise, molecular mechanisms beyond GABA-ergic inhibition provide a rich neuromodulatory landscape to support consciousness, with recent evidence indicating a common deficit of dopaminergic innervation across anaesthesia and disorders of consciousness116. Finally, it is vital to combine multimodal neuroimaging and whole-brain modelling to identify paths from unconsciousness back to consciousness, using our understanding of post-anaesthetic recovery to restore consciousness in DOC patients, whether by means of custom-designed drugs or deep brain stimulation66,67,89.
Overall, the present findings begin to unravel the neurobiological mechanisms by which different perturbations of the brain’s structure and function - transient pharmacological intervention and chronic neuroanatomical injury - can lead to unconsciousness. Having demonstrated the power of whole-brain computational modelling to address this challenge, the same framework may also prove fruitful to address the reverse problem: namely, how the recovery of consciousness after anaesthesia can inform our ability to restore consciousness in DOC patients.
Methods
Anaesthesia data: Recruitment
The propofol data employed in this study have been published before18,36,117. For clarity and consistency of reporting, where applicable we use the same wording as our previous studies. The propofol data were collected between May and November 2014 at the Robarts Research Institute in London, Ontario (Canada)18. The study received ethical approval from the Health Sciences Research Ethics Board and Psychology Research Ethics Board of Western University (Ontario, Canada). Healthy volunteers (n = 19) were recruited (18–40 years; 13 males). Volunteers were right-handed, native English speakers, and had no history of neurological disorders. In accordance with relevant ethical guidelines, each volunteer provided written informed consent, and received monetary compensation for their time. Due to equipment malfunction or physiological impediments to anaesthesia in the scanner, data from n = 3 participants (1 male) were excluded from analyses, leaving a total n = 16 for analysis18.
Anaesthesia data: Procedure
Resting-state fMRI data were acquired at different propofol levels: no sedation (Awake), and Deep anaesthesia (corresponding to Ramsay score of 5). As previously reported18, for each condition fMRI acquisition began after two anaesthesiologists and one anaesthesia nurse independently assessed Ramsay level in the scanning room. The anaesthesiologists and the anaesthesia nurse could not be blinded to experimental condition, since part of their role involved determining the participants’ level of anaesthesia. Note that the Ramsay score is designed for critical care patients, and therefore participants did not receive a score during the Awake condition before propofol administration: rather, they were required to be fully awake, alert and communicating appropriately. To provide a further, independent evaluation of participants’ level of responsiveness, they were asked to perform two tasks: a test of verbal memory recall, and a computer-based auditory target-detection task. Wakefulness was also monitored using an infrared camera placed inside the scanner.
Propofol (a potent agonist of inhibitory GABA-A receptors98,99) was administered intravenously using an AS50 auto syringe infusion pump (Baxter Healthcare, Singapore); an effect-site/plasma steering algorithm combined with the computer-controlled infusion pump was used to achieve step-wise sedation increments, followed by manual adjustments as required to reach the desired target concentrations of propofol according to the TIVA Trainer (European Society for Intravenous Aneaesthesia, eurosiva.eu) pharmacokinetic simulation program. This software also specified the blood concentrations of propofol, following the Marsh 3-compartment model, which were used as targets for the pharmacokinetic model providing target-controlled infusion. After an initial propofol target effect-site concentration of 0.6 µg mL−1, concentration was gradually increased by increments of 0.3 µg mL1, and Ramsay score was assessed after each increment: a further increment occurred if the Ramsay score was lower than 5. The mean estimated effect-site and plasma propofol concentrations were kept stable by the pharmacokinetic model delivered via the TIVA Trainer infusion pump. Ramsay level 5 was achieved when participants stopped responding to verbal commands, were unable to engage in conversation, and were rousable only to physical stimulation. Once both anaesthesiologists and the anaesthesia nurse all agreed that Ramsay sedation level 5 had been reached, and participants stopped responding to both tasks, data acquisition was initiated. The mean estimated effect-site propofol concentration was 2.48 (1.82–3.14) µg mL−1, and the mean estimated plasma propofol concentration was 2.68 (1.92–3.44) µg mL−1. Mean total mass of propofol administered was 486.58 (373.30–599.86) mg. These values of variability are typical for the pharmacokinetics and pharmacodynamics of propofol. Oxygen was titrated to maintain SpO2 above 96%.
At Ramsay 5 level, participants remained capable of spontaneous cardiovascular function and ventilation. However, the sedation procedure did not take place in a hospital setting; therefore, intubation during scanning could not be used to ensure airway security during scanning. Consequently, although two anaesthesiologists closely monitored each participant, scanner time was minimised to ensure return to normal breathing following deep sedation. No state changes or movement were noted during the deep sedation scanning for any of the participants included in the study18.
Anaesthesia data: Design
As previously reported18, once in the scanner participants were instructed to relax with closed eyes, without falling asleep. Resting-state functional MRI in the absence of any tasks was acquired for 8 min for each participant. A further scan was also acquired during auditory presentation of a plot-driven story through headphones (5 min long). Participants were instructed to listen while keeping their eyes closed. The present analysis focuses on the resting-state data only; the story scan data have been published separately87 and will not be discussed further here.
Anaesthesia data: FMRI data acquisition
As previously reported18, MRI scanning was performed using a 3-Tesla Siemens Tim Trio scanner (32-channel coil), and 256 functional volumes (echo-planar images, EPI) were collected from each participant, with the following parameters: slices = 33, with 25% inter-slice gap; resolution = 3 mm isotropic; TR = 2000 ms; TE = 30 ms; flip angle = 75 degrees; matrix size = 64 × 64. The order of acquisition was interleaved, bottom-up. Anatomical scanning was also performed, acquiring a high-resolution T1- weighted volume (32-channel coil, 1 mm isotropic voxel size) with a 3D MPRAGE sequence, using the following parameters: TA = 5 min, TE = 4.25 ms, 240 × 256 matrix size, 9 degrees flip angle18.
Disorders of consciousness patient data: Overview
The DOC patient data employed in this study have been published before18,29,58,118. For clarity and consistency of reporting, where applicable we use the same wording as our previous studies.
Disorders of consciousness patient data: Recruitment
A total of 71 DOC patients were recruited from specialised long-term care centres from January 2010 to December 201518. Ethical approval for this study was provided by the National Research Ethics Service (National Health Service, UK; LREC reference99/391). Patients were eligible to be recruited in the study if they had a diagnosis of chronic disorder of consciousness, provided that written informed consent to participation was provided by their legal representative, and provided that the patients could be transported to Addenbrooke’s Hospital (Cambridge, UK). The exclusion criteria included any medical condition that made it unsafe for the patient to participate, according to clinical personnel blinded to the specific aims of the study; or any reason that made a patient unsuitable to enter the MRI scanner environment (e.g., non-MRI-safe implants). Patients were also excluded based on substantial pre-existing mental health problems, or insufficient fluency in the English language prior to their injury. After admission to Addenbrooke’s Hospital, each patient underwent clinical and neuroimaging testing, spending a total of five days in the hospital (including arrival and departure days). Neuroimaging scanning took place at the Wolfson Brain Imaging Centre (Addenbrooke’s Hospital, Cambridge, UK), and medication prescribed to each patient was maintained during scanning.
For each day of admission, Coma Recovery Scale-Revised (CRS-R) assessments were recorded at least daily. Patients whose behavioural responses were not indicative of awareness at any time, were classified as UWS. In contrast, patients were classified as being in a minimally conscious state (MCS) if they provided behavioural evidence of simple automatic motor reactions (e.g., scratching, pulling the bed sheet), visual fixation and pursuit, or localisation to noxious stimulation. Since this study focused on whole-brain properties, coverage of most of the brain was required, and we followed the same criteria as in our previous studies:18,29 before analysis took place, patients were systematically excluded if an expert neuroanatomist blinded to diagnosis judged that they displayed excessive focal brain damage (over one third of one hemisphere), or if brain damage led to suboptimal segmentation and normalisation, or due to excessive head motion in the MRI scanner (exceeding 3 mm translation or 3 degrees rotation). One additional patient was excluded due to incomplete acquisition. Out of the initial sample of 71 patients who had been recruited, a total of n = 21 adults (13 males; 17–70 years; mean time post injury: 13 months) meeting diagnostic criteria for unresponsive wakefulness syndrome/vegetative state (UWS; N = 10) or minimally conscious state (MCS; N = 11) due to brain injury were included in this study (Table 1). In addition to the researcher and radiographer, a research nurse was also present during scanning. Since the patients’ status as DOC patients was evident, no researcher blinding was possible.
Table 1.
Demographic information for patients with disorders of consciousness.
| Sex | Age | Aetiology | Diagnosis | CRS-R Score | Scan |
|---|---|---|---|---|---|
| M | 46 | TBI | UWS | 6 | 12 dir |
| M | 57 | TBI | MCS | 12 | 12 dir |
| M | 35 | Anoxic | UWS | 8 | 12 dir |
| M | 17 | Anoxic | UWS | 8 | 12 dir |
| F | 31 | Anoxic | MCS | 10 | 12 dir |
| F | 38 | TBI | MCS | 11 | 12 dir |
| M | 29 | TBI | MCS | 10 | 63 dir |
| M | 23 | TBI | MCS | 7 | 63 dir |
| F | 70 | Cerebral bleed | MCS | 9 | 63 dir |
| F | 30 | Anoxic | MCS | 9 | 63 dir |
| F | 36 | Anoxic | UWS | 8 | 63 dir |
| M | 22 | Anoxic | UWS | 7 | 63 dir |
| M | 40 | Anoxic | UWS | 7 | 63 dir |
| F | 62 | Anoxic | UWS | 7 | 63 dir |
| M | 46 | Anoxic | UWS | 5 | 63 dir |
| M | 21 | TBI | MCS | 11 | 63 dir |
| M | 67 | TBI | MCS | 11 | 63 dir |
| F | 55 | Hypoxia | UWS | 7 | 63 dir |
| M | 28 | TBI | MCS | 8 | 63 dir |
| M | 22 | TBI | MCS | 10 | 63 dir |
| F | 28 | ADEM | UWS | 6 | 63 dir |
CRS-R Coma Recovery Scale-Revised, UWS Unresponsive Wakefulness Syndrome, MCS Minimally Conscious State, TBI Traumatic Brain Injury.
Disorders of consciousness patient data: FMRI data acquisition
As previously reported18, resting-state fMRI was acquired for 10 min (300 volumes, TR = 2000 ms) using a Siemens Trio 3 T scanner (Erlangen, Germany). Functional images (32 slices) were acquired using an echo planar sequence, with the following parameters: 3 × 3 × 3.75 mm resolution, TR = 2000 ms, TE = 30 ms, 78 degrees FA. Anatomical scanning was also performed, acquiring high-resolution T1-weighted images with an MPRAGE sequence, using the following parameters: TR = 2300 ms, TE = 2.47 ms, 150 slices, resolution 1 × 1 × 1 mm.
Disorders of consciousness patient data: Acquisition of diffusion-weighted imaging data
As we previously reported58, the DOC patients’ data were acquired over the course of several years, and as a result two different diffusion-weighted image acquisition schemes were used. For the first acquisition scheme, we collected 5 sets of 12 non-collinear diffusion-sensitising gradient directions, each set using a different b-value (5 b-values in total) ranging from 340 to 1590 s/mm2; therefore, a total of 60 diffusion-weighted volumes were acquired for each patient with this acquisition scheme. An echo planar sequence was used (TR = 8300 ms, TE = 98 ms, matrix size = 96 × 96, 63 slices, slice thickness = 2 mm, no gap, flip angle = 90°). This acquisition scheme was used for the first n = 6 patients (Table 1). The second, more recent acquisition scheme included 63 directions with a b-value of 1000 s/mm2; this acquisition scheme was adopted for all remaining DOC patients and also for all healthy controls. Each of these DWI acquisition types has been used before with DOC patients 49,51,58.
Healthy control data: Overview and recruitment
We also acquired fMRI and DWI data from n = 20 healthy volunteers (13 males; 19–57 years), with no history of psychiatric or neurological disorders58. The Cambridgeshire 2 Research
Ethics Committee approved the study (LREC 08/H0308/246), and data were collected between October 2009 and September 2010. The mean age was not significantly different between healthy controls (M = 35.75; SD = 11.42) and DOC patients (M = 38.24; SD = 15.96) (t(39) = −0.57, p = 0.571, Hedges’s g = −0.18; permutation-based t-test).
Healthy control data: FMRI data acquisition
Resting-state fMRI was acquired for 5:20 min (160 volumes, TR = 2000 ms) using a Siemens Trio 3 T scanner (Erlangen, Germany). The acquisition parameters were the same as those for the DOC patients: Functional images (32 slices) were acquired using an echo planar sequence, with the following parameters: 3 × 3 × 3.75 mm resolution, TR = 2000 ms, TE = 30 ms, 78 degrees FA. High-resolution T1-weighted anatomical images were also acquired, using an MPRAGE sequence with the following parameters: TR = 2300 ms, TE = 2.47 ms, 150 slices, resolution 1 × 1 × 1 mm.
Healthy control data: Acquisition of diffusion-weighted imaging data
The diffusion-weighted acquisition scheme was the same 63-directions scheme used for the DOC patients, as described above and in previous work:58 TR = 8300 ms, TE = 98 ms, matrix size = 96 × 96, 63 slices, slice thickness = 2 mm, no gap, flip angle = 90°, 63 directions with a b-value of 1000 s/mm2.
A summary of the data included in our modelling pipelines is provided in Table 2.
Table 2.
Summary of subjects included in modelling pipelines.
| Group | N | M/F | Site | Data type | # fMRI volumes used | DWI directions |
|---|---|---|---|---|---|---|
| Awake/Propofol | 16 | 12/4 | London, ON | fMRI |
250 (Awake) 250 (Propofol) |
Not acquired |
| Healthy controls | 20 | 13/7 | Cambridge, UK | fMRI, DWI | 155 | 63 directions, B = 1000 |
| DOC patients | 21 | 13/8 | Cambridge, UK | fMRI, DWI | 155 |
63 directions, B = 1000 (n = 15); 5 × 12 directions, B ranging from 340 to 1590 (n = 6) |
Awake and propofol data were acquired from the same subjects, respectively before and after infusion with the anaesthetic. For the DOC patients, 300 volumes were acquired in total, but to ensure consistency with controls we only used 155 consecutive volumes from each patient. Note that no direct comparisons were performed between data acquired in London, ON and data acquired in Cambridge, UK.
Functional MRI preprocessing and denoising
We followed the preprocessing pipeline described in our previous work18, which is based on the standard pipeline implemented within the SPM12-based (http://www.fil.ion.ucl.ac.uk/spm) CONN toolbox (http://www.nitrc.org/projects/conn), version 17 f119. The following steps are included in the standard CONN pipeline: removal of the first five scans to allow magnetisation to reach steady state; functional realignment and motion correction; slice-timing correction to account for differences in time of acquisition between slices; identification of outlier scans for subsequent regression by means of the quality assurance/artifact rejection software Artifact Detection Toolbox (art; (http://www.nitrc.org/projects/artifact_detect); spatial normalisation to MNI-152 standard space with 2 mm isotropic resampling resolution, using each volunteer’s high-resolution T1-weighted image to obtain each individual’s segmented grey matter, combined with an a priori grey matter template.
Given the presence of brain injury and corresponding deformations, DOC patients’ brains were individually preprocessed using SPM12, with visual inspections after each step. Additionally, to further reduce potential movement artifacts, data underwent despiking using the hyperbolic tangent squashing function from the CONN toolbox119. This method applies a continuous squashing function to the BOLD signal, rather than utilizing an absolute threshold that would result in cropping any values above that threshold. Since the controls had a shorter scan duration than DOC patients, the number of DOC functional volumes were truncated to be the same as the control subjects’ ones, after removal of the initial volumes to achieve steady-state magnetisation of the scanner, in order to ensure comparability between the two sets of Cambridge-acquired data (note that we do not perform direct comparisons between the Cambridge data and the data from London, Ontario).
Denoising also followed the same procedure as in our previous work:18 to reduce noise due to cardiac and motion artifacts we applied the anatomical CompCor method120 (also implemented within the CONN toolbox), by regressing out of the functional data the first five principal components attributable to each individual’s white matter signal; the first five components attributable to individual cerebrospinal fluid (CSF) signal; six subject-specific realignment parameters (three translations and three rotations) as well as their first-order temporal derivatives; the artifacts identified by art; and main effect of scanning condition120. Finally, after linear detrending, each individual’s denoised BOLD signal timeseries were band-pass filtered in the 0.008−0.09 Hz.range, to eliminate both low-frequency drift effects and high-frequency noise.
DWI preprocessing and tractography
The diffusion data were preprocessed with MRtrix3 tools, using the following steps (this is the same pipeline adopted in our previous work;58,121 for clarity and consistency of reporting, where applicable we use the same wording as in our previous publications). After manually removing diffusion-weighted volumes with substantial distortion51, the pipeline involved the following steps: (i) DWI data denoising by exploiting data redundancy in the PCA domain122 (dwidenoise command); (ii) Correction for distortions induced by eddy currents and subject motion by registering all DWIs to b0, using FSL’s eddy tool (through MRtrix3 dwipreproc command); (iii) rotation of the diffusion gradient vectors to account for subject motion estimated by eddy;123 (iv) b1 field inhomogeneity correction for DWI volumes (dwibiascorrect command); (v) generation of a brain mask through a combination of MRtrix3 dwi2mask and FSL BET commands.
After preprocessing, the DTI data were reconstructed using the model-free q-space diffeomorphic reconstruction algorithm (QSDR) implemented in DSI Studio (www.dsi-studio.labsolver.org)124, following our previous work58,125. Use of QSDR is desirable when investigating group differences52,124,126 because this algorithm preserves the continuity of fiber geometry for subsequent tracking124, since it reconstructs the distribution of the density of diffusing water in standard space. This approach has therefore been adopted in previous connectomics studies focusing on healthy individuals127 but also brain-injured patients128 and DOC patients specifically52,58. QSDR initially reconstructs DWI data in native space, and subsequently computes values of quantitative anisotropy (QA) in each voxel, based on which DSI Studio performs a nonlinear warp from native space to a template QA volume in Montreal Neurological Institute (MNI) space. Once in MNI standard space, spin density functions are reconstructed, with a mean diffusion distance of 1.25 mm with three fiber orientations per voxel124.
Finally, fiber tracking was carried out by means of DSI Studio’s own FACT deterministic tractography algorithm, requesting 1000,000 streamlines according to widely adopted parameters:58,125,127–129 angular cutoff = 55◦, step size = 1.0 mm, tract length between 10 mm (minimum) and 400 mm (maximum), no spin density function smoothing, and QA threshold determined by DWI signal in the cerebro-spinal fluid. Streamlines were automatically rejected if they presented improper termination locations, based on a white matter mask automatically generated by applying a default anisotropy threshold of 0.6 Otsu’s threshold to the anisotropy values of the spin density function125,127,129.
Brain parcellation
For both BOLD and DWI data, brains were parcellated into 68 cortical regions of interest (ROIs), according to the Desikan-Killiany anatomical atlas130, in line with previous whole-brain modelling work101.
Functional connectivity dynamics
Following Deco et al. (2018)89, functional connectivity dynamics (FCD) were quantified in terms of Pearson correlation between regional BOLD timeseries, computed within a sliding window of 30 TRs with increments of 3 TRs. Subsequently, the resulting matrices of functional connectivity at times tx and ty were themselves correlated, for each pair of timepoints tx and ty, thereby obtaining an FCD matrix of time-versus-time correlations. Thus, each entry in the FCD matrix represents the similarity between functional connectivity patterns at different points in time.
Consensus group structural connectivity
The structural connectivity (SC) for the DMF model was obtained by following the procedure described in Wang et al. (2019)101 to derive a group-consensus structural connectivity matrix. Separately for the healthy controls and DOC patients, a consensus matrix C was obtained as follows. For each pair of regions i and j, if more than half of subjects had non-zero connection i and j, Cij was set to the average across all subjects with non-zero connections between i and j. Otherwise, Cij was set to zero. Note that this procedure for constructing a group-consensus connectome will retain or exclude a given connection between two regions only if it is present (respectively, absent) in the majority of individuals in the cohort, such that the final consensus connectome is not expected to reflect the idiosyncrasies of individual patients, but only systematic patterns.
Whole-brain computational modelling
Whole-brain spontaneous brain activity (as quantified using blood oxygen level dependent (BOLD) signal data from functional MRI) was simulated using a neurobiologically realistic Dynamic Mean Field (DMF) model131. The DMF model19,22,25 uses an empirically validated mathematical mean-field approach to represent the collective behaviour of integrate-and-fire neurons by means of coupled differential equations, providing a neurobiologically plausible account of regional neuronal firing rate.
Specifically, the model simulates local biophysical dynamics of excitatory (NMDA) and inhibitory (GABA) neuronal populations, interacting over long-range neuroanatomical connections (white matter tracts obtained from diffusion MRI). The model further incorporates multimodal neuroimaging information about empirical brain dynamics (measured using functional MRI) and neurotransmitter receptor density, estimated from positron emission tomography (PET)89.
Each cortical area n (defined by a parcellation scheme) is represented in terms of two reciprocally coupled neuronal masses, one excitatory and the other inhibitory, with the synaptic connections between excitatory neuronal populations in different regions given by the weight of structural connectivity, to account for the number and density of interregional axon fibers. The DMF model has only one free parameter: a global coupling parameter, denoted by G, which scales the excitatory-to-excitatory coupling between brain regions, as established by the empirical structural connectome. Additional factors that can influence the long-range excitatory-to-excitatory coupling between brain regions, such as neurotransmission but also synaptic plasticity mechanisms, are accounted for by this global coupling parameter. Since conductivity of the white matter fibers is assumed to be constant across the brain, G constitutes the only free parameter in the model.
The following differential equations therefore govern the model’s behaviour:
| 1 |
| 2 |
| 3 |
| 4 |
| 5 |
| 6 |
| 7 |
Following previous work89,91, “for each excitatory (E) and inhibitory (I) neural mass, the quantities , , and represent its total input current (nA), firing rate (Hz) and synaptic gating variable, respectively. The function F(·) is the transfer function (or F–I curve), representing the non-linear relationship between the input current and the output firing rate of a neural population. Finally, is the local feedback inhibitory control of region n, which is optimized to keep its average firing rate at approximately 3 Hz25,91, and is uncorrelated Gaussian noise injected to region n”. The model’s fixed parameters are reported in Table 325,89,91. Additionally, is the neuromodulatory scaling factor modulating the transfer function for each cortical region in the model as a function of , the regional density of GABA-A receptors (see below for details) and an inhibitory gain scaling parameter . The original DMF model (corresponding to a DMF model with uniform GABA-A regional inhibitory gain, and no regionally heterogeneous neuromodulation) is obtained by setting to zero, in which case G remains the sole free parameter in the model. Details for optimisation of the parameter for the GABA-A modulated model are provided below.
Table 3.
Dynamic Mean Field model parameters.
| Parameter | Symbol | Value |
|---|---|---|
| External current | I0 | 0.382 nA |
| Excitatory scaling factor for I0 | WE | 1 |
| Inhibitory scaling factor for I0 | WI | 0.7 |
| Local excitatory recurrence | w+ | 1.4 |
| Excitatory synaptic coupling | JNMDA | 0.15 nA |
| Threshold for F (In(E)) | Ithr(E) | 0.403 nA |
| Threshold for F (In(I)) | Ithr(I) | 0.288 nA |
| Gain factor of F (In(E)) | gE | 310 nC−1 |
| Gain factor of F (In(I)) | gI | 615 nC-1 |
| Shape of F (In(E)) around Ithr(E) | dE | 0.16 s |
| Shape of F (In(I)) around Ithr(I) | dI | 0.087 s |
| Excitatory kinetic parameter | 0.641 | |
| Amplitude of uncorrelated Gaussian noise vn | 0.01 nA | |
| Time constant of NMDA | 100 ms | |
| Time constant of GABA | 10 ms |
A Balloon-Windkessel (BW) hemodynamic model97 was then used to turn simulated regional neuronal activity into simulated regional BOLD signal. The Balloon-Windkessel model considers the BOLD signal as a nonlinear function of the normalized total deoxyhemoglobin voxel content, normalized venous volume, resting net oxygen extraction fraction by the capillary bed, and resting blood volume fraction. The BOLD-signal estimation for each brain area is computed from the level of neuronal activity in that particular area. Finally, simulated regional BOLD signal was bandpass filtered in the same range as the empirical data (0.008–0.09 Hz).
Implementation
The code used to run all the simulations in this study was written in optimised C++ using the high-performance library Eigen. The C++ core of the code, together with Python and Octave/Matlab interfaces is publicly available as “FastDMF”131 and maintained at http://www.gitlab.com/concog/fastdmf.
To simulate BOLD data, FastDMF splits the problem in two steps: integrating the coupled differential equations underlying the DMF model, to obtain excitatory firing rates in each brain region; and using these firing rates to integrate the (uncoupled) differential equations of the BW hemodynamic model and obtain BOLD timeseries.
Integration of the DMF equations is performed with the Euler-Maruyama method, and it is highly parallelizable and bounded by the O(N^2) complexity of the matrix-vector multiplication corresponding to the excitatory-to-excitatory coupling between brain regions. Simulated excitatory firing rates are stored in a cylindrical array with a fixed buffer size to limit memory requirements.
In addition, a further set of threads is spawned to solve the BW model using the simulated excitatory firing rates. Since the BW solver reads from the same cylindrical array, it interfaces with the DMF solver with a controlled multi-threaded architecture. Every TR-equivalent in simulation time the value of all BOLD signals is copied to a pre-allocated array, to be returned at the end of the requested simulation time.
In a standard laptop, FastDMF attains a speed-up of between 5x and 10x over publicly available Matlab implementations, due to the speed of Eigen and the parallelisation of DMF and BW solvers. In addition, due to the cylindrical buffer, this implementation is able to simulate arbitrarily long BOLD time series with a fixed memory overhead, thereby allocating orders of magnitude less memory than a naive Matlab implementation.
Finally, the library includes interface functions for Matlab (via its C Matrix API) and Python (via the Boost.Python library). In both languages the function returns a standard array (numpy.ndarray in the case of Python) that can be easily processed for further analysis.
Fitting of the G parameter
Calibrating the model corresponds to finding the value of G that allows the model to best simulate observed fMRI activity patterns of the human brain at rest. In order to identify appropriate parameters for the simulations, early whole-brain modelling efforts used the grand average FC as target for fitting the model to empirical data. However, it has since become apparent that the macroscale neural signals measured by functional MRI are not static, even on the timescale of a few tens of seconds: rather, they exhibit a wide range of dynamic patterns. Therefore, in order to properly take into account the time-dependencies of FC, it is advantageous to fit the model to empirical functional connectivity dynamics (FCD). Doing so ensures that the simulated BOLD data will exhibit realistic patterns of time-evolving functional connectivity89,96.
Unlike matrices of inter-regional connectivity, where each brain region is the same across different scans, FCDs are represented as matrices encoding the relationship between brain dynamics at different timepoints. Since timepoints are not the same across individuals or scans, as our functional MRI data were acquired under conditions of task-free rest rather than being time-locked to a particular event, FCD matrices cannot be compared by means of simple correlation. Therefore, to evaluate model performance in terms of producing meaningful temporal dynamics, here we follow the approach of Deco et al. (2018)89, using the Kolmogorov-Smirnov distance to compare the histograms of empirical and simulated FCD values (obtained from the upper triangular FCD matrix), to find the G parameter that results in the best match between empirical and simulated functional connectivity dynamics. The same KS-distance was also used as the goodness-of-fit measure to quantify the similarity between empirical and simulated macroscale brain activity.
To find the value of G that generates simulations whose FCD best match empirical FCD, we generated n = 100 simulations for each value of G between 0.1 and 2.5, using increments of 0.1. For each simulation at each value of G, we computed the KS distance between empirical (group-wise) and simulated FCD. Finally, we set the model’s G parameter to the value that minimised the mean KS distance - corresponding to the model that is best capable of simulating the temporal dynamics of functional connectivity observed in the healthy human brain at rest.
This procedure was performed separately for the propofol dataset (with 250 TRs) and the DOC dataset, which was truncated to the number of TRs available for the healthy controls (155 TRs). For validation, we also replicated our main results when the traditional KS-distance was replaced with an alternative, two-dimensional version of the KS-distance as the chosen goodness-of-fit measure. This alternative measure, introduced by Peacock (1983)132, was used to take into account not only the distribution of inter-temporal correlation values (i.e., the values in the FCD matrix), but also their relative temporal position with respect to each other, in terms of the number of intervening sliding-windows between them. Mathematically, this corresponds to comparing the empirical and simulated distributions p(r, ) for a given FC correlation r across a time-lag .
Local inhibitory gain modulation from GABA-A maps
Since the general anaesthetic propofol is an agonist of the GABA-A receptor, we modulated local inhibitory gain based on the recent high-resolution quantitative atlas of human brain GABA-A receptors, generated on the basis of benzodiazepine receptor (BZR) density measured in vivo from [11C]flumazenil Positron Emission Tomography (PET) autoradiography100, made available by the Neurobiology Research Unit of the Copenhagen University Hospital. Briefly, a parametric map reflecting maximal binding of [11C]flumazenil was obtained by averaging Logan analysis estimates based on PET data obtained from n=16 (7 males) healthy volunteers (age range: 16–46 years: M = 26.6 +/− 8 years). Data were acquired with a High-Resolution Research Tomograph (CTI/Siemens). We refer the reader to the original publication for full details of the data acquisition and map generation procedure100. Following133, after parcellating the cortical map according to the Desikan-Killiany atlas used in the present study, the data were Z-scored, before normalising the values to lie between 0 and 1.
We then used the previously calibrated DMF model to generate simulations for values of sI up to 1, varying in increments of 0.02. Then, for each value of sI, we computed the KS distance between the model’s simulated macroscale dynamics and the empirical dynamics observed in each condition (awake or propofol, control or DOC). For each condition, the optimal value of sI, was then identified as the value that resulted in the minimum mean KS distance between empirical and simulated dynamics (across n = 10 simulations for each value of sI).
As validation analysis, we also repeated the same procedure, optimising the inhibitory gain scaling sI, but with two different kinds of receptor density maps: a scrambled map, whereby the values of GABA-A receptor density obtained from PET were randomised across regions while preserving their spatial autocorrelation134,135; and a uniform map, whereby each region was set to the same value, corresponding to the mean of the distribution of PET-derived receptor densities.
Connectome replacement
Connectome replacement was performed using the initial balanced DMF model (i.e., with optimised G parameter, but without additional inhibitory gain modulation), based on the consensus connectome from diffusion imaging of healthy controls (referred to as the healthy connectome).
Three perturbed connectomes were used. Firstly, the consensus connectome obtained from diffusion imaging of n = 21 DOC patients, referred to as the DOC connectome. Secondly, the original healthy connectome was randomised according to the weight-preserving procedure of102 to generate a random connectome that differs from the original in terms of topology, but preserves the weight distribution. Thirdly, we used the procedure described in102 to turn the healthy connectome into a lattice network with the same weight distribution - providing a different and opposite perturbation of the network’s topology.
For each perturbed connectome, the DMF model was used to generate n = 100 simulations, using the optimal global coupling G, but with inter-regional connectivity given by the perturbed connectome rather than the original connectome. This was repeated for each dataset (propofol and DOC) and the resulting simulations were compared with each condition (awake/propofol and control/DOC) in terms of KS-distance.
Statistics and reproducibility
Statistical differences were evaluated for significance at the standard alpha level of 0.05 (two-sided), using permutation-based between-subjects t-tests on the distributions of KS-distance values obtained from n = 100 simulations from the corresponding models being compared Mean and standard error of the mean of the data are displayed in the Figures. Supplementary Tables 1–4 report the test results. Effect sizes were estimated as Cohen’s d (standardised difference of means).
Reporting summary
Further information on research design is available in the Nature Research Reporting Summary linked to this article.
Supplementary information
Description of Additional Supplementary Files
Acknowledgements
The authors would like to thank all the participants for their contribution to this study. This work was supported by grants from the UK Medical Research Council [U.1055.01.002.00001.01 to A.M.O. and J.D.P.]; The James S. McDonnell Foundation [to A.M.O. and J.D.P.]; and the Canada Excellence Research Chairs program (215063 to A.M.O.); the National Institute for Health Research (NIHR, UK), Cambridge Biomedical Research Centre and NIHR Senior Investigator Awards [to D.K.M.], the Stephen Erskine Fellowship (Queens’ College, Cambridge, to E.A.S.), the Canadian Institute for Advanced Research (CIFAR; grant RCZB/072 RG93193) (to D.K.M. and E.A.S.); the L’Oreal-Unesco for Women in Science Excellence Research Fellowship to L.N.; the British Oxygen Professorship of the Royal College of Anaesthetists [to D.K.M.]; The Evelyn Trust, Cambridge and the EoE CLAHRC fellowship [J.A.]; the Gates Cambridge Trust (to A.I.L.); the Cambridge International Trust and the Howard Sidney Sussex Studentship (to M.M.C.); and the Vice-Chancellor Award (to P.C.). A.M.O. and D.K.M. are Fellows of the CIFAR Brain, Mind, and Consciousness Programme. P.A.M. and D.B. are funded by the Wellcome Trust (grant no. 210920/Z/18/Z). F.R. is funded by the Ad Astra Chandaria foundation. Computing infrastructure at the Wolfson Brain Imaging Centre (WBIC-HPHI) was funded by the M.R.C. research infrastructure award (MR/M009041/1). The research was also supported by the NIHR Brain Injury Healthcare Technology Co-operative based at Cambridge University Hospitals NHS Foundation Trust and University of Cambridge. The views expressed are those of the authors and not necessarily those of the NIHR or the Department of Health and Social Care. Finally, the authors would like to thank Ruben Herzog for helpful discussions, and extend their gratitude to Martin Norgaard and colleagues from the Neurobiology Research Unit at Copenhagen University Hospital for generously making their PET data publicly available.
Author contributions
A.I.L.: conceived the study; analysed data; wrote the first draft of the paper. P.A.M.: conceived the study; contributed to data analysis and interpretation of results; reviewed and edited the paper. F.R.: conceived the study; contributed to data analysis and interpretation of results; reviewed and edited the paper. M.M.C., P.C., A.R.D.P: contributed to data analysis. D.K.M.: reviewed the paper. D.B.: reviewed and edited the manuscript. E.A.S.: conceived the study; reviewed and edited the paper. P.F., G.B.W., J.A., J.D.P., A.M.O., L.N., D.K.M., and E.A.S. were involved in designing the original studies for which the present data were collected. P.F., M.M.C., G.B.W., J.A., L.N., and E.A.S. all participated in data collection.
Peer review
Peer review information
Communications Biology thanks Md Nasir Uddin and the other, anonymous, reviewer(s) for their contribution to the peer review of this work. Primary Handling Editor: George Inglis.
Data availability
Source data underlying Figs. 2b and 3 are presented in Supplementary Data 1. Source data underlying Fig. 4 are presented in Supplementary Data 2. Source data underlying Fig. 5 are presented in Supplementary Data 3. Source data underlying Fig. 6 are presented in Supplementary Data 6. The propofol and DOC patient data that support the findings of this study are available from Dr. Emmanuel Stamatakis, University of Cambridge (email: eas46@cam.ac.uk) upon reasonable request. The GABA PET maps are available from the Neurobiology Research Unit at Copenhagen University Hospital (https://xtra.nru.dk/BZR-atlas/).
Code availability
The C++ core of the DMF code, together with Python and Octave/Matlab interfaces, has been made publicly available131, and it is actively maintained at http://www.gitlab.com/concog/fastdmf. The CONN toolbox is freely available online (http://www.nitrc.org/projects/conn). DSI Studio is freely available online: dsi-studio.labsolver.org. MRtrix3 is freely available online: https://www.mrtrix.org. The abagen toolbox is freely available online: https://abagen.readthedocs.io/en/stable/.
Competing interests
The authors declare no competing interests.
Footnotes
Publisher’s note Springer Nature remains neutral with regard to jurisdictional claims in published maps and institutional affiliations.
Supplementary information
The online version contains supplementary material available at 10.1038/s42003-022-03330-y.
References
- 1.Atasoy S, Donnelly I, Pearson J. Human brain networks function in connectome-specific harmonic waves. Nat. Commun. 2016;7:1–10. doi: 10.1038/ncomms10340. [DOI] [PMC free article] [PubMed] [Google Scholar]
- 2.Atasoy S, Deco G, Kringelbach ML, Pearson J. Harmonic brain modes: A unifying framework for linking space and time in brain dynamics. Neuroscientist. 2018;24:277–293. doi: 10.1177/1073858417728032. [DOI] [PubMed] [Google Scholar]
- 3.Shine JM, et al. The dynamics of functional brain networks: Integrated network states during cognitive task performance. Neuron. 2016;92:544–554. doi: 10.1016/j.neuron.2016.09.018. [DOI] [PMC free article] [PubMed] [Google Scholar]
- 4.Shine JM, et al. Human cognition involves the dynamic integration of neural activity and neuromodulatory systems. Nat. Neurosci. 2019;22:289–296. doi: 10.1038/s41593-018-0312-0. [DOI] [PubMed] [Google Scholar]
- 5.Fukushima M, et al. Structure–function relationships during segregated and integrated network states of human brain functional connectivity. Brain Struct. Funct. 2018;223:1091–1106. doi: 10.1007/s00429-017-1539-3. [DOI] [PMC free article] [PubMed] [Google Scholar]
- 6.Allen EA, et al. Tracking whole-brain connectivity dynamics in the resting state. Cereb. Cortex. 2014;24:663–676. doi: 10.1093/cercor/bhs352. [DOI] [PMC free article] [PubMed] [Google Scholar]
- 7.Preti MG, Bolton TA, Van De Ville D. The dynamic functional connectome: State-of-the-art and perspectives. NeuroImage. 2017;160:41–54. doi: 10.1016/j.neuroimage.2016.12.061. [DOI] [PubMed] [Google Scholar]
- 8.Hutchison RM, Hutchison M, Manning KY, Menon RS, Everling S. Isoflurane induces dose-dependent alterations in the cortical connectivity profiles and dynamic properties of the brain’s functional architecture. Hum. Brain Mapp. 2014;35:5754–5775. doi: 10.1002/hbm.22583. [DOI] [PMC free article] [PubMed] [Google Scholar]
- 9.Hutchison RM, et al. Dynamic functional connectivity: Promise, issues, and interpretations. Neuroimage. 2013;80:5–79. doi: 10.1016/j.neuroimage.2013.05.079. [DOI] [PMC free article] [PubMed] [Google Scholar]
- 10.Barttfeld P, et al. Signature of consciousness in the dynamics of resting-state brain activity. Proc. Natl Acad. Sci. 2015;112:887–892. doi: 10.1073/pnas.1418031112. [DOI] [PMC free article] [PubMed] [Google Scholar]
- 11.Atasoy S, Vohryzek J, Deco G, Carhart-Harris RL, Kringelbach ML. Common neural signatures of psychedelics: Frequency-specific energy changes and repertoire expansion revealed using connectome-harmonic decomposition. Prog. Brain Res. 2018;242:97–120. doi: 10.1016/bs.pbr.2018.08.009. [DOI] [PubMed] [Google Scholar]
- 12.Atasoy S, et al. Connectome-harmonic decomposition of human brain activity reveals dynamical repertoire re-organization under LSD. Sci. Rep. 2017;7:1–18. doi: 10.1038/s41598-017-17546-0. [DOI] [PMC free article] [PubMed] [Google Scholar]
- 13.Lord LD, et al. Dynamical exploration of the repertoire of brain networks at rest is modulated by psilocybin. NeuroImage. 2019;199:127–142. doi: 10.1016/j.neuroimage.2019.05.060. [DOI] [PubMed] [Google Scholar]
- 14.Vohryzek J, Deco G, Cessac B, Kringelbach ML, Cabral J. Ghost attractors in spontaneous brain activity: Recurrent excursions into functionally-relevant BOLD phase-locking states. Front. Syst. Neurosci. 2020;14:20. doi: 10.3389/fnsys.2020.00020. [DOI] [PMC free article] [PubMed] [Google Scholar]
- 15.Vidaurre D, Smith SM, Woolrich MW. Brain network dynamics are hierarchically organized in time. Proc. Natl Acad. Sci. USA. 2017;114:12827–12832. doi: 10.1073/pnas.1705120114. [DOI] [PMC free article] [PubMed] [Google Scholar]
- 16.Dehaene S, Lau H, Kouider S. What is consciousness, and could machines have it? Science. 2017;358:486–492. doi: 10.1126/science.aan8871. [DOI] [PubMed] [Google Scholar]
- 17.Koch C, Massimini M, Boly M, Tononi G. Neural correlates of consciousness: progress and problems. Nat. Rev. Neurosci. 2016;17:307–321. doi: 10.1038/nrn.2016.22. [DOI] [PubMed] [Google Scholar]
- 18.Luppi, A. I. et al. Consciousness-specific dynamic interactions of brain integration and functional diversity. Nat. Commun.10, (2019). [DOI] [PMC free article] [PubMed]
- 19.Deco G, Jirsa VK. Ongoing cortical activity at rest: Criticality, multistability, and ghost attractors. J. Neurosci. 2012;32:3366–3375. doi: 10.1523/JNEUROSCI.2523-11.2012. [DOI] [PMC free article] [PubMed] [Google Scholar]
- 20.Deco G, Kringelbach ML, Jirsa VK, Ritter P. The dynamics of resting fluctuations in the brain: Metastability and its dynamical cortical core. Sci. Rep. 2017;7(Jun):3095. doi: 10.1038/s41598-017-03073-5. [DOI] [PMC free article] [PubMed] [Google Scholar]
- 21.Deco G, Jirsa VK, McIntosh AR. Emerging concepts for the dynamical organization of resting-state activity in the brain. Nat. Rev. Neurosci. 2011;12:43–56. doi: 10.1038/nrn2961. [DOI] [PubMed] [Google Scholar]
- 22.Deco G, et al. Resting-state functional connectivity emerges from structurally and dynamically shaped slow linear fluctuations. J. Neurosci. 2013;33:11239–11252. doi: 10.1523/JNEUROSCI.1091-13.2013. [DOI] [PMC free article] [PubMed] [Google Scholar]
- 23.Cabral J, Kringelbach ML, Deco G. Functional connectivity dynamically evolves on multiple time-scales over a static structural connectome: Models and mechanisms. NeuroImage. 2017;160:84–96. doi: 10.1016/j.neuroimage.2017.03.045. [DOI] [PubMed] [Google Scholar]
- 24.Honey CJ, Kötter R, Breakspear M, Sporns O. Network structure of cerebral cortex shapes functional connectivity on multiple time scales. Proc. Natl Acad. Sci. USA. 2007;104:10240–10245. doi: 10.1073/pnas.0701519104. [DOI] [PMC free article] [PubMed] [Google Scholar]
- 25.Deco G, et al. How local excitation-inhibition ratio impacts the whole brain dynamics. J. Neurosci. 2014;34:7886–7898. doi: 10.1523/JNEUROSCI.5068-13.2014. [DOI] [PMC free article] [PubMed] [Google Scholar]
- 26.Demertzi A, et al. Human consciousness is supported by dynamic complex patterns of brain signal coordination. Sci. Adv. 2019;5:1–12. doi: 10.1126/sciadv.aat7603. [DOI] [PMC free article] [PubMed] [Google Scholar]
- 27.Huang Z, Zhang J, Wu J, Mashour GA, Hudetz AG. Temporal circuit of macroscale dynamic brain activity supports human consciousness. Sci. Adv. 2020;6:87–98. doi: 10.1126/sciadv.aaz0087. [DOI] [PMC free article] [PubMed] [Google Scholar]
- 28.Golkowski D, et al. Changes in whole brain dynamics and connectivity patterns during sevoflurane- and propofol-induced unconsciousness identified by functional magnetic resonance imaging. Anesthesiology. 2019;130:898–911. doi: 10.1097/ALN.0000000000002704. [DOI] [PubMed] [Google Scholar]
- 29.Luppi, A. I. et al. Connectome harmonic decomposition of human brain dynamics reveals a landscape of consciousness. bioRxiv (2020) 10.1101/2020.08.10.244459.
- 30.Campbell JM, et al. Pharmacologically informed machine learning approach for identifying pathological states of unconsciousness via resting-state fMRI. NeuroImage. 2020;206:116316. doi: 10.1016/j.neuroimage.2019.116316. [DOI] [PMC free article] [PubMed] [Google Scholar]
- 31.Noirhomme Q, et al. Brain connectivity in pathological and pharmacological coma. Front. Sys. Neurosci. 2010;4:160. doi: 10.3389/fnsys.2010.00160. [DOI] [PMC free article] [PubMed] [Google Scholar]
- 32.Huang Z, et al. Decoupled temporal variability and signal synchronization of spontaneous brain activity in loss of consciousness: An fMRI study in anesthesia. NeuroImage. 2016;124:693–703. doi: 10.1016/j.neuroimage.2015.08.062. [DOI] [PubMed] [Google Scholar]
- 33.Tanabe, S. et al. Altered Global brain signal during physiologic, pharmacologic, and pathologic states of unconsciousness in humans and rats. Anesthesiology 1392–1406 (2020) 10.1097/ALN.0000000000003197. [DOI] [PMC free article] [PubMed]
- 34.Northoff G, Wainio-Theberge S, Evers K. Is temporo-spatial dynamics the “common currency” of brain and mind? In Quest of “Spatiotemporal Neuroscience. Phys. Life Rev. 2020;33:34–54. doi: 10.1016/j.plrev.2019.05.002. [DOI] [PubMed] [Google Scholar]
- 35.Northoff G, Lamme V. Neural signs and mechanisms of consciousness: Is there a potential convergence of theories of consciousness in sight? Neurosci. Biobehav. Rev. 2020;118:568–587. doi: 10.1016/j.neubiorev.2020.07.019. [DOI] [PubMed] [Google Scholar]
- 36.Varley TF, et al. Consciousness & brain functional complexity in propofol Anaesthesia. Sci Rep. 2020;10:1018. doi: 10.1038/s41598-020-57695-3. [DOI] [PMC free article] [PubMed] [Google Scholar]
- 37.Kelz MB, Mashour GA. The biology of general anesthesia from paramecium to primate. Curr. Biol. 2019;29:R1199–R1210. doi: 10.1016/j.cub.2019.09.071. [DOI] [PMC free article] [PubMed] [Google Scholar]
- 38.Mashour GA, Hudetz AG. Bottom-up and top-down mechanisms of general anesthetics modulate different dimensions of consciousness. Front. Neural Circuits. 2017;11:44. doi: 10.3389/fncir.2017.00044. [DOI] [PMC free article] [PubMed] [Google Scholar]
- 39.Hudetz AG, Mashour GA. Disconnecting consciousness: Is there a common anesthetic end point? Anesthesia Analgesia. 2016;123:1228–1240. doi: 10.1213/ANE.0000000000001353. [DOI] [PMC free article] [PubMed] [Google Scholar]
- 40.Hemmings HC, et al. Towards a comprehensive understanding of anesthetic mechanisms of action: A decade of discovery. Trends Pharmacol. Sci. 2019;40:464–481. doi: 10.1016/j.tips.2019.05.001. [DOI] [PMC free article] [PubMed] [Google Scholar]
- 41.Hannawi Y, Lindquist MA, Caffo BS, Sair HI, Stevens RD. Resting brain activity in disorders of consciousness: a systematic review and meta-analysis. Neurology. 2015;84:1272–1280. doi: 10.1212/WNL.0000000000001404. [DOI] [PMC free article] [PubMed] [Google Scholar]
- 42.Giacino JT, Fins JJ, Laureys S, Schiff ND. Disorders of consciousness after acquired brain injury: The state of the science. Nat. Rev. Neurol. 2014;10:99–114. doi: 10.1038/nrneurol.2013.279. [DOI] [PubMed] [Google Scholar]
- 43.Cavaliere C, et al. Diffusion tensor imaging and white matter abnormalities in patients with disorders of consciousness. Front. Hum. Neurosci. 2015;8:6–12. doi: 10.3389/fnhum.2014.01028. [DOI] [PMC free article] [PubMed] [Google Scholar]
- 44.Billeri, L. et al. Toward improving diagnostic strategies in chronic disorders of consciousness: An overview on the (re-)emergent role of neurophysiology. Brain Sci.10, 42 (2020). [DOI] [PMC free article] [PubMed]
- 45.Song M, Zhang Y, Cui Y, Yang Y, Jiang T. Brain network studies in chronic disorders of consciousness: Advances and perspectives. Neurosci. Bull. 2018;34:592–604. doi: 10.1007/s12264-018-0243-5. [DOI] [PMC free article] [PubMed] [Google Scholar]
- 46.Lant ND, Gonzalez-Lara LE, Owen AM, Fernández-Espejo D. Relationship between the anterior forebrain mesocircuit and the default mode network in the structural bases of disorders of consciousness. NeuroImage: Clin. 2016;10:27–35. doi: 10.1016/j.nicl.2015.11.004. [DOI] [PMC free article] [PubMed] [Google Scholar]
- 47.Newcombe VFJ, et al. Aetiological differences in neuroanatomy of the vegetative state: Insights from diffusion tensor imaging and functional implications. J. Neurol., Neurosurg. Psychiatry. 2010;81:552–561. doi: 10.1136/jnnp.2009.196246. [DOI] [PubMed] [Google Scholar]
- 48.Weng L, et al. Abnormal structural connectivity between the basal ganglia, thalamus, and frontal cortex in patients with disorders of consciousness. Cortex. 2017;90:71–87. doi: 10.1016/j.cortex.2017.02.011. [DOI] [PubMed] [Google Scholar]
- 49.Wang L, et al. White matter integrity correlates with residual consciousness in patients with severe brain injury. Brain Imaging Behav. 2018;12:1669–1677. doi: 10.1007/s11682-018-9832-1. [DOI] [PubMed] [Google Scholar]
- 50.Wu X, et al. White matter deficits underlying the impaired consciousness level in patients with disorders of consciousness. Neurosci. Bull. 2018;34:668–678. doi: 10.1007/s12264-018-0253-3. [DOI] [PMC free article] [PubMed] [Google Scholar]
- 51.Zheng ZS, Reggente N, Lutkenhoff E, Owen AM, Monti MM. Disentangling disorders of consciousness: Insights from diffusion tensor imaging and machine learning. Hum. Brain Mapp. 2017;38:431–443. doi: 10.1002/hbm.23370. [DOI] [PMC free article] [PubMed] [Google Scholar]
- 52.Tan, X. et al. Structural connectome alterations in patients with disorders of consciousness revealed by 7-tesla magnetic resonance imaging. NeuroImage: Clin.22, e101702 (2019). [DOI] [PMC free article] [PubMed]
- 53.Bodart O, et al. Global structural integrity and effective connectivity in patients with disorders of consciousness. Brain Stimulation. 2018;11:358–365. doi: 10.1016/j.brs.2017.11.006. [DOI] [PubMed] [Google Scholar]
- 54.Ferraro S, et al. Interhemispherical anatomical disconnection in disorders of consciousness patients. J. Neurotrauma. 2019;36:1535–1543. doi: 10.1089/neu.2018.5820. [DOI] [PubMed] [Google Scholar]
- 55.Fernández-Espejo D, et al. Diffusion weighted imaging distinguishes the vegetative state from the minimally conscious state. NeuroImage. 2011;54:103–112. doi: 10.1016/j.neuroimage.2010.08.035. [DOI] [PubMed] [Google Scholar]
- 56.Kuceyeski A, et al. The application of a mathematical model linking structural and functional connectomes in severe brain injury. NeuroImage: Clin. 2016;11:635–647. doi: 10.1016/j.nicl.2016.04.006. [DOI] [PMC free article] [PubMed] [Google Scholar]
- 57.Stafford CA, Owen AM, Fernández-Espejo D. The neural basis of external responsiveness in prolonged disorders of consciousness. NeuroImage: Clin. 2019;22:101791. doi: 10.1016/j.nicl.2019.101791. [DOI] [PMC free article] [PubMed] [Google Scholar]
- 58.Luppi, A. I. et al. Preserved fractal character of structural brain networks is associated with covert consciousness after severe brain injury. NeuroImage: Clinical102682 (2021) 10.1016/j.nicl.2021.102682. [DOI] [PMC free article] [PubMed]
- 59.Keifer J, Summers CH. Putting the “biology” back into “neurobiology”: The strength of diversity in animal model systems for neuroscience research. Front. Syst. Neurosci. 2016;10:69. doi: 10.3389/fnsys.2016.00069. [DOI] [PMC free article] [PubMed] [Google Scholar]
- 60.Bisiach E, Luzzatti C. Unilateral Neglect of Representational Space. Cortex. 1978;14:129–133. doi: 10.1016/S0010-9452(78)80016-1. [DOI] [PubMed] [Google Scholar]
- 61.Scoville W, Milner B. Loss of recent memory after bilateral hippocampal lesions. J. Neurol., Neurosurg., Psychiatry. 1957;20:11–21. doi: 10.1136/jnnp.20.1.11. [DOI] [PMC free article] [PubMed] [Google Scholar]
- 62.Weiskrantz, L. Blindsight: A case study and implications. (1986).
- 63.Cofré R, et al. Whole-brain models to explore altered states of consciousness from the bottom up. Brain Sci. 2020;10:1–29. doi: 10.3390/brainsci10090626. [DOI] [PMC free article] [PubMed] [Google Scholar]
- 64.Deco G, Tononi G, Boly M, Kringelbach ML. Rethinking segregation and integration: Contributions of whole-brain modelling. Nat. Rev. Neurosci. 2015;16:430–439. doi: 10.1038/nrn3963. [DOI] [PubMed] [Google Scholar]
- 65.Marinazzo D, et al. Information transfer of an Ising model on a brain network. BMC Neurosci. 2013;14:P376. doi: 10.1186/1471-2202-14-S1-P376. [DOI] [Google Scholar]
- 66.Kringelbach ML, Deco G. Brain states and transitions: Insights from computational neuroscience. Cell Rep. 2020;32:108128. doi: 10.1016/j.celrep.2020.108128. [DOI] [PubMed] [Google Scholar]
- 67.Deco G, Kringelbach ML. Great expectations: Using whole-brain computational connectomics for understanding neuropsychiatric disorders. Neuron. 2014;84:892–905. doi: 10.1016/j.neuron.2014.08.034. [DOI] [PubMed] [Google Scholar]
- 68.Sanz-Leon P, Knock SA, Spiegler A, Jirsa VK. Mathematical framework for large-scale brain network modeling in The Virtual Brain. NeuroImage. 2015;111:385–430. doi: 10.1016/j.neuroimage.2015.01.002. [DOI] [PubMed] [Google Scholar]
- 69.Bensaid S, Modolo J, Merlet I, Wendling F, Benquet P. COALIA: a computational model of human EEG for consciousness research. Front. Syst. Neurosci. 2019;13:575043. doi: 10.3389/fnsys.2019.00059. [DOI] [PMC free article] [PubMed] [Google Scholar]
- 70.Adhikari MH, et al. Decreased integration and information capacity in stroke measured by whole brain models of resting state activity. Brain. 2017;140:1068–1085. doi: 10.1093/brain/awx021. [DOI] [PMC free article] [PubMed] [Google Scholar]
- 71.Hashemi M, et al. The Bayesian virtual epileptic patient: A probabilistic framework designed to infer the spatial map of epileptogenicity in a personalized large-scale brain model of epilepsy spread. NeuroImage. 2020;217:116839. doi: 10.1016/j.neuroimage.2020.116839. [DOI] [PubMed] [Google Scholar]
- 72.Aerts H, et al. Modeling brain dynamics after tumor resection using The Virtual Brain. NeuroImage. 2020;213:116738. doi: 10.1016/j.neuroimage.2020.116738. [DOI] [PubMed] [Google Scholar]
- 73.Váša F, et al. Effects of lesions on synchrony and metastability in cortical networks. NeuroImage. 2015;118:456–467. doi: 10.1016/j.neuroimage.2015.05.042. [DOI] [PubMed] [Google Scholar]
- 74.Hellyer PJ, Scott G, Shanahan M, Sharp DJ, Leech R. Cognitive flexibility through metastable neural dynamics is disrupted by damage to the structural connectome. J. Neurosci. 2015;35:9050–9063. doi: 10.1523/JNEUROSCI.4648-14.2015. [DOI] [PMC free article] [PubMed] [Google Scholar]
- 75.Honey CJ, Sporns O. Dynamical consequences of lesions in cortical networks. Hum. Brain Mapp. 2008;29:802–809. doi: 10.1002/hbm.20579. [DOI] [PMC free article] [PubMed] [Google Scholar]
- 76.Alstott J, Breakspear M, Hagmann P, Cammoun L, Sporns O. Modeling the impact of lesions in the human brain. PLoS Computational Biol. 2009;5:e1000408. doi: 10.1371/journal.pcbi.1000408. [DOI] [PMC free article] [PubMed] [Google Scholar]
- 77.Cabral J, Kringelbach ML, Deco G. Exploring the network dynamics underlying brain activity during rest. Prog. Neurobiol. 2014;114:102–131. doi: 10.1016/j.pneurobio.2013.12.005. [DOI] [PubMed] [Google Scholar]
- 78.Hellyer PJ, et al. The control of global brain dynamics: Opposing actions of frontoparietal control and default mode networks on attention. J. Neurosci. 2014;34:451–461. doi: 10.1523/JNEUROSCI.1853-13.2014. [DOI] [PMC free article] [PubMed] [Google Scholar]
- 79.Deco, G. et al. Awakening: Predicting external stimulation to force transitions between different brain states. Proc. Nat. Acad. Sci. 201905534 (2019) 10.1073/pnas.1905534116. [DOI] [PMC free article] [PubMed]
- 80.Jobst BM, et al. Increased Stability and breakdown of brain effective connectivity during slow-wave sleep: Mechanistic insights from whole-brain computational modelling. Sci. Rep. 2017;7:4634. doi: 10.1038/s41598-017-04522-x. [DOI] [PMC free article] [PubMed] [Google Scholar]
- 81.Hahn G, et al. Signature of consciousness in brain-wide synchronization patterns of monkey and human fMRI signals. NeuroImage. 2020;226:117470. doi: 10.1016/j.neuroimage.2020.117470. [DOI] [PubMed] [Google Scholar]
- 82.Ipiña, I. P. et al. Modeling regional changes in dynamic stability during sleep and wakefulness. NeuroImage215, 116833 (2020). [DOI] [PMC free article] [PubMed]
- 83.Sanz Perl, Y. et al. Perturbations in dynamical models of whole-brain activity dissociate between the level and stability of consciousness. bioRxiv (2020) 10.1101/2020.07.02.185157. [DOI] [PMC free article] [PubMed]
- 84.Deco, G., Tagliazucchi, E., Laufs, H., Sanjuán, A. & Kringelbach, M. L. Novel intrinsic ignition method measuring local-global integration characterizes wakefulness and deep sleep. Eneurology.4 ENEURO.0106-17.2017 (2017). [DOI] [PMC free article] [PubMed]
- 85.López-González, A. et al. Loss of consciousness reduces the stability of brain hubs and the heterogeneity of brain dynamics. bioRxiv 2020.11.20.391482 (2020) 10.1101/2020.11.20.391482. [DOI] [PMC free article] [PubMed]
- 86.Abeyasinghe PM, et al. Consciousness and the dimensionality of DOC patients via the generalized ising model. J. Clin. Med. 2020;9:1342. doi: 10.3390/jcm9051342. [DOI] [PMC free article] [PubMed] [Google Scholar]
- 87.Kandeepan S, et al. Modeling an auditory stimulated brain under altered states of consciousness using the generalized ising model. NeuroImage. 2020;223:117367. doi: 10.1016/j.neuroimage.2020.117367. [DOI] [PubMed] [Google Scholar]
- 88.Stramaglia, S. et al. Ising model with conserved magnetization on the human connectome: Implications on the relation structure-function in wakefulness and anesthesia. Chaos27, (2017). [DOI] [PubMed]
- 89.Deco G, et al. Whole-brain multimodal neuroimaging model using serotonin receptor maps explains non-linear functional effects of LSD. Curr. Biol. 2018;28:3065–3074. doi: 10.1016/j.cub.2018.07.083. [DOI] [PubMed] [Google Scholar]
- 90.Kringelbach ML, et al. Dynamic coupling of whole-brain neuronal and neurotransmitter systems. Proc. Natl. Acad. Sci. USA. 2020;117:9566–9576. doi: 10.1073/pnas.1921475117. [DOI] [PMC free article] [PubMed] [Google Scholar]
- 91.Herzog R, et al. A mechanistic model of the neural entropy increase elicited by psychedelic drugs. Sci. Rep. 2020;10:17725. doi: 10.1038/s41598-020-74060-6. [DOI] [PMC free article] [PubMed] [Google Scholar] [Retracted]
- 92.Shine, J. M. et al. Computational models link cellular mechanisms of neuromodulation to large-scale neural dynamics. Nat. Neurosci. 1–12 (2021) 10.1038/s41593-021-00824-6. [DOI] [PubMed]
- 93.Luppi, A. I. et al. A Synergistic Workspace for Human Consciousness Revealed by Integrated Information Decomposition. bioRxiv 2020.11.25.398081 (2020) 10.1101/2020.11.25.398081. [DOI] [PMC free article] [PubMed]
- 94.Izhikevich EM, Edelman GM. Large-scale model of mammalian thalamocortical systems. Proc. Natl. Acad. Sci. USA. 2008;105:3593–3598. doi: 10.1073/pnas.0712231105. [DOI] [PMC free article] [PubMed] [Google Scholar]
- 95.Wong KF, Wang XJ. A recurrent network mechanism of time integration in perceptual decisions. J. Neurosci. 2006;26:1314–1328. doi: 10.1523/JNEUROSCI.3733-05.2006. [DOI] [PMC free article] [PubMed] [Google Scholar]
- 96.Hansen ECA, Battaglia D, Spiegler A, Deco G, Jirsa VK. Functional connectivity dynamics: Modeling the switching behavior of the resting state. NeuroImage. 2015;105:525–535. doi: 10.1016/j.neuroimage.2014.11.001. [DOI] [PubMed] [Google Scholar]
- 97.Stephan KE, Weiskopf N, Drysdale PM, Robinson PA, Friston KJ. Comparing hemodynamic models with DCM. NeuroImage. 2007;38:387–401. doi: 10.1016/j.neuroimage.2007.07.040. [DOI] [PMC free article] [PubMed] [Google Scholar]
- 98.Yip GMS, et al. A propofol binding site on mammalian GABA A receptors identified by photolabeling. Nat. Chem. Biol. 2013;9:715–720. doi: 10.1038/nchembio.1340. [DOI] [PMC free article] [PubMed] [Google Scholar]
- 99.Jurd R, et al. General anesthetic actions in vivo strongly attenuated by a point mutation in the GABA A receptor β3 subunit. FASEB J. 2003;17:250–252. doi: 10.1096/fj.02-0611fje. [DOI] [PubMed] [Google Scholar]
- 100.Nørgaard, M. et al. A High-resolution in vivo atlas of the human brain’s Benzodiazepine binding site of GABA A receptors. bioRxiv. (2020) 10.1101/2020.04.10.035352.
- 101.Wang P, et al. Inversion of a large-scale circuit model reveals a cortical hierarchy in the dynamic resting human brain. Sci. Adv. 2019;5:1–12. doi: 10.1126/sciadv.aat7854. [DOI] [PMC free article] [PubMed] [Google Scholar]
- 102.Muldoon SF, Bridgeford EW, Bassett DS. Small-world propensity and weighted brain networks. Sci. Rep. 2016;6:1–13. doi: 10.1038/srep22057. [DOI] [PMC free article] [PubMed] [Google Scholar]
- 103.Lu, C.-W., Lin, T.-Y. & Wang, S.-J. Facilitation of glutamate release from rat cerebral cortex nerve terminal by subanesthetic concentration propofo. [DOI] [PubMed]
- 104.Markello, R. D. et al. Standardizing workflows in imaging transcriptomics with the Abagen toolbox. eLife10, e72129 (2021). [DOI] [PMC free article] [PubMed]
- 105.Barter, E., Brechtel, A., Drossel, B. & Gross, T. A closed form for Jacobian reconstruction from time series and its application as an early warning signal in network dynamics. Proc. Royal Soc. A477, 1–17 (2021). [DOI] [PMC free article] [PubMed]
- 106.Rosanova, M. et al. Sleep-like cortical OFF-periods disrupt causality and complexity in the brain of unresponsive wakefulness syndrome patients. Nat. Commun.9, e4427 (2018). [DOI] [PMC free article] [PubMed]
- 107.Funk CM, et al. Role of somatostatin-positive cortical interneurons in the generation of sleep slow waves. J. Neurosci. 2017;37:9132–9148. doi: 10.1523/JNEUROSCI.1303-17.2017. [DOI] [PMC free article] [PubMed] [Google Scholar]
- 108.Fanciullacci C, et al. Delta power is higher and more symmetrical in ischemic stroke patients with cortical involvement. Front. Hum. Neurosci. 2017;11:385. doi: 10.3389/fnhum.2017.00385. [DOI] [PMC free article] [PubMed] [Google Scholar]
- 109.Boveroux P, et al. Brain function in physiologically, pharmacologically, and pathologically altered states of consciousness. Int. Anesthesiol. Clin. 2008;46:131–146. doi: 10.1097/AIA.0b013e318181a8b3. [DOI] [PubMed] [Google Scholar]
- 110.Laureys S, Owen AM, Schiff ND. Brain function in coma, vegetative state, and related disorders. Lancet Neurol. 2004;3:537–546. doi: 10.1016/S1474-4422(04)00852-X. [DOI] [PubMed] [Google Scholar]
- 111.Luppi, A. I. et al. Mechanisms underlying disorders of consciousness: Bridging gaps to move toward an integrated translational science. Neurocritical Care35, 37–54 (2021). [DOI] [PMC free article] [PubMed]
- 112.Sutton JA, Clauss RP. A review of the evidence of zolpidem efficacy in neurological disability after brain damage due to stroke, trauma and hypoxia: A justification of further clinical trials. Brain Inj. 2017;31:1019–1027. doi: 10.1080/02699052.2017.1300836. [DOI] [PubMed] [Google Scholar]
- 113.Radtke FM, et al. Risk factors for inadequate emergence after anesthesia: Emergence delirium and hypoactive emergence. Minerva Anestesiologica. 2010;76:394–404. [PubMed] [Google Scholar]
- 114.Xará D, Silva A, Mendonça J, Abelha F. Inadequate emergence after anesthesia: Emergence delirium and hypoactive emergence in the Postanesthesia Care Unit. J. Clin. Anesthesia. 2013;25:439–446. doi: 10.1016/j.jclinane.2013.02.011. [DOI] [PubMed] [Google Scholar]
- 115.Demirtaş M, et al. Hierarchical heterogeneity across human cortex shapes large-scale neural dynamics. Neuron. 2019;101:1181–1194.e13. doi: 10.1016/j.neuron.2019.01.017. [DOI] [PMC free article] [PubMed] [Google Scholar]
- 116.Spindler, L. R. B. et al. Dopaminergic brainstem disconnection is common to pharmacological and pathological consciousness perturbation. Proc. Nat. Acad. Sci.118, e2026289118 (2021). [DOI] [PMC free article] [PubMed]
- 117.Naci, L. et al. Functional diversity of brain networks supports consciousness and verbal intelligence. Scientific Rep.8, 1–15 (2018). [DOI] [PMC free article] [PubMed]
- 118.Varley, T. F. et al. Fractal dimension of cortical functional connectivity networks & severity of disorders of consciousness. PLoS ONE15, 1–20 (2020). [DOI] [PMC free article] [PubMed]
- 119.Whitfield-Gabrieli S, Nieto-Castanon A. Conn: A Functional Connectivity Toolbox for Correlated and Anticorrelated Brain Networks. Brain Connectivity. 2012;2:125–141. doi: 10.1089/brain.2012.0073. [DOI] [PubMed] [Google Scholar]
- 120.Behzadi Y, Restom K, Liau J, Liu TT. A component based noise correction method (CompCor) for BOLD and perfusion based fMRI. NeuroImage. 2007;37:90–101. doi: 10.1016/j.neuroimage.2007.04.042. [DOI] [PMC free article] [PubMed] [Google Scholar]
- 121.Tournier, J. D. et al. MRtrix3: A fast, flexible and open software framework for medical image processing and visualisation. NeuroImage202, 1–17 (2019). [DOI] [PubMed]
- 122.Veraart J, et al. Denoising of diffusion MRI using random matrix theory. NeuroImage. 2016;142:394–406. doi: 10.1016/j.neuroimage.2016.08.016. [DOI] [PMC free article] [PubMed] [Google Scholar]
- 123.Leemans A, Jones DK. The B-matrix must be rotated when correcting for subject motion in DTI data. Magn. Reson. Med. 2009;61:1336–1349. doi: 10.1002/mrm.21890. [DOI] [PubMed] [Google Scholar]
- 124.Yeh F-C, Wedeen VJ, Tseng W-YI. Estimation of fiber orientation and spin density distribution by diffusion deconvolution. NeuroImage. 2011;55:1054–1062. doi: 10.1016/j.neuroimage.2010.11.087. [DOI] [PubMed] [Google Scholar]
- 125.Luppi AI, Stamatakis EA. Combining network topology and information theory to construct representative brain networks. Netw. Neurosci. 2021;5:96–124. doi: 10.1162/netn_a_00170. [DOI] [PMC free article] [PubMed] [Google Scholar]
- 126.Yeh F-C, Verstynen TD, Wang Y, Fernández-Miranda JC, Tseng W-Y. Deterministic diffusion fiber tracking improved by quantitative anisotropy. PLoS ONE. 2013;8:80713. doi: 10.1371/journal.pone.0080713. [DOI] [PMC free article] [PubMed] [Google Scholar]
- 127.Gu, S. et al. Controllability of structural brain networks. Nat. Commun.6, e8414 (2015). [DOI] [PMC free article] [PubMed]
- 128.Gu S, et al. Optimal trajectories of brain state transitions. NeuroImage. 2017;148:305–317. doi: 10.1016/j.neuroimage.2017.01.003. [DOI] [PMC free article] [PubMed] [Google Scholar]
- 129.Medaglia, J. D. et al. Cognitive control in the controllable connectome. arXiv preprint arXiv:1606.09185. 1–30 (2016).
- 130.Desikan RS, et al. An automated labeling system for subdividing the human cerebral cortex on MRI scans into gyral based regions of interest. NeuroImage. 2006;31:968–980. doi: 10.1016/j.neuroimage.2006.01.021. [DOI] [PubMed] [Google Scholar]
- 131.Mediano, P. A. M., Luppi, A. I., Herzog, R. & Rosas, F. E. FastDMF: Fast simulator of the dynamic mean field model of brain dynamics. Zenodo (2022). 10.5281/zenodo.6373512
- 132.Peâcock JA. Two-dimensional goodness-of-fit testing in astronomy. Mon. Not. R. Astr. Soc. 1983;202:615–627. doi: 10.1093/mnras/202.3.615. [DOI] [Google Scholar]
- 133.Hansen, J. Y., Markello, R. D., Palomero-gallagher, N., Dagher, A. & Misic, B. Correspondence between gene expression and neurotransmitter receptor and transporter density in the human cortex. bioRxiv 1–13 10.1101/2021.11.30.469876. [DOI] [PubMed]
- 134.Markello RD, Misic B. Comparing spatial null models for brain maps. NeuroImage. 2021;236:118052. doi: 10.1016/j.neuroimage.2021.118052. [DOI] [PubMed] [Google Scholar]
- 135.Alexander-Bloch AF, et al. On testing for spatial correspondence between maps of human brain structure and function. NeuroImage. 2018;178:540–551. doi: 10.1016/j.neuroimage.2018.05.070. [DOI] [PMC free article] [PubMed] [Google Scholar]
Associated Data
This section collects any data citations, data availability statements, or supplementary materials included in this article.
Supplementary Materials
Description of Additional Supplementary Files
Data Availability Statement
Source data underlying Figs. 2b and 3 are presented in Supplementary Data 1. Source data underlying Fig. 4 are presented in Supplementary Data 2. Source data underlying Fig. 5 are presented in Supplementary Data 3. Source data underlying Fig. 6 are presented in Supplementary Data 6. The propofol and DOC patient data that support the findings of this study are available from Dr. Emmanuel Stamatakis, University of Cambridge (email: eas46@cam.ac.uk) upon reasonable request. The GABA PET maps are available from the Neurobiology Research Unit at Copenhagen University Hospital (https://xtra.nru.dk/BZR-atlas/).
The C++ core of the DMF code, together with Python and Octave/Matlab interfaces, has been made publicly available131, and it is actively maintained at http://www.gitlab.com/concog/fastdmf. The CONN toolbox is freely available online (http://www.nitrc.org/projects/conn). DSI Studio is freely available online: dsi-studio.labsolver.org. MRtrix3 is freely available online: https://www.mrtrix.org. The abagen toolbox is freely available online: https://abagen.readthedocs.io/en/stable/.