

Structured Abstract
Objective
We aimed to examine associations between the oral, fecal and mucosal microbiome communities and adenoma formation.
Summary Background Data
Data is limited regarding the relationships between microbiota and preneoplastic colorectal lesions.
Methods
Individuals undergoing screening colonoscopy were prospectively enrolled and divided into adenoma and non-adenoma formers. Oral, fecal, non-adenoma and adenoma-adjacent mucosa were collected along with clinical and dietary information. 16S rRNA gene libraries were generated using V4 primers. DADA2 processed sequence reads and custom R-scripts quantified microbial diversity. Linear regression identified differential taxonomy and diversity in microbial communities and machine learning identified adenoma former microbial signatures.
Results
One-hundred-four subjects were included, 46% with adenomas. Mucosal and fecal samples were dominated by Firmicutes and Bacteroidetes while Firmicutes and Proteobacteria were most abundant in oral communities. Mucosal communities harbored significant microbial diversity that was not observed in fecal or oral communities. Random forest classifiers predicted adenoma formation using fecal, oral, and mucosal amplicon sequence variant (ASV) abundances. The mucosal classifier reliably diagnosed adenoma formation with an area under the curve (AUC)= 0.993 and an out-of-bag (OOB) error of 3.2%. Mucosal classifier accuracy was strongly influenced by five taxa associated with the family Lachnospiraceae, genera Bacteroides and Marvinbryantia, and Blautia obeum. In contrast, classifiers built using fecal and oral samples manifested high OOB error rates (47.3% and 51.1% respectively) and poor diagnostic abilities (fecal and oral AUC = 0.53).
Conclusion
Normal mucosa microbial abundances of adenoma formers manifest unique patterns of microbial diversity that may be predictive of adenoma formation.
Mini-Abstract
Fecal, oral swab and mucosal samples were obtained at time of screening colonoscopy and 16S sequencing performed. Microbial abundances and diversity of patients with and without adenomas were compared. We found that the fecal and mucosal-associated microbiomes were distinct, and that the mucosal microbiome was highly predictive of adenoma status.
Introduction
Colorectal cancer (CRC) is a leading cause of cancer-related mortality1 and has been associated with increasing age as well as environmental, hereditary, dietary and behavioral factors.2–5 Recent findings suggest that CRC is associated with intestinal microbial dysbiosis, or an imbalance in the microbiome that associates with a disease state.6 Microbiomes may be evaluated multiple ways, including by quantifying the relative abundance of specific microbial taxa, the byproducts they produce (e.g., metabolites), or the ecological richness and diversity of the overall microbial community.
The healthy human intestine harbors dense and diverse microbial populations, with the colon alone harboring approximately 1014 bacteria.7,8 While an individual’s microbiome is relatively stable outside of infancy and advanced aging,9–11 microbiota also have the potential to contribute to human disease.12 One disease linked to microbial dysbiosis is CRC.13–16 Most CRC studies related to the microbiome focus on later stages of the disease and cancer-tissue specific microbiota.17 Since it is accepted that CRC follows the adenoma-carcinoma sequence.18,19 we aimed to examine the changes in the microbiome apparent at the pre-neoplastic stage of the adenoma. Study of the microbiome associated with adenomas may help resolve the relationship between the microbiome and neoplasia over the course of tumorigenesis. Altered microbial diversity has been identified in individuals with colorectal adenomas.20,21 Individuals with adenomas may also harbor potentially pathologic alterations in the abundance of specific microbiota,20–23 which may possess virulence factors23,24 or synthesize oncogenic byproducts.12,21,25,26 Most of the aforementioned studies rely on the examination of fecal samples exclusively of individuals with adenomas. In addition, these studies often include previously collected samples, some of which were greater than 10 years old or lacked clinical demographics. The current study is significant as we offer an analysis of a cohort with rigorous sample collection of oral, fecal and mucosal samples with associated patient data. We hypothesized that the microbiome associated with adenomas would be distinctive than that of adenoma free individuals, and that these alterations in the microbiome may help explain the risk of developing colorectal adenomas. In addition, we aimed to examine whether fecal, oral and mucosal microbiota signatures similarly depict microbial populations and if signatures can be used to predict adenoma formation.
Methods
Subject enrollment
Patients undergoing screening colonoscopy at Oregon Health and Science University were prospectively enrolled between October 2018–2019 following informed consent (Institutional Review Board #17350). As comparable mean abundances were not available in the literature at the time of study initiation, based enrollment goals on the sample size required to show differences in comparable studies and were able only to perform a retrospective power analysis to confirm that we were adequately powered to detect an effect with a power of 80% and alpha = 0.05 with our sample size. Inclusion criteria were age ≥ 18, English speaking, undergoing screening colonoscopy. Exclusion criteria were planned diagnostic colonoscopy, failure to complete bowel preparation, failure to collect a stool sample prior to bowel preparation, history of hereditary CRC syndrome and antibiotics within 90 days. One-hundred-fourteen patients were enrolled, and 10 excluded (Fig 1). One patient was excluded as the final polyp pathology demonstrated a colonic carcinoid tumor, and three patients were excluded due to poor bowel preparation resulting in incomplete colonoscopy. An additional six patients were excluded from the final analysis as they had hyperplastic polyps resulting in a mucosal abnormality but not an adenoma.
Fig 1.
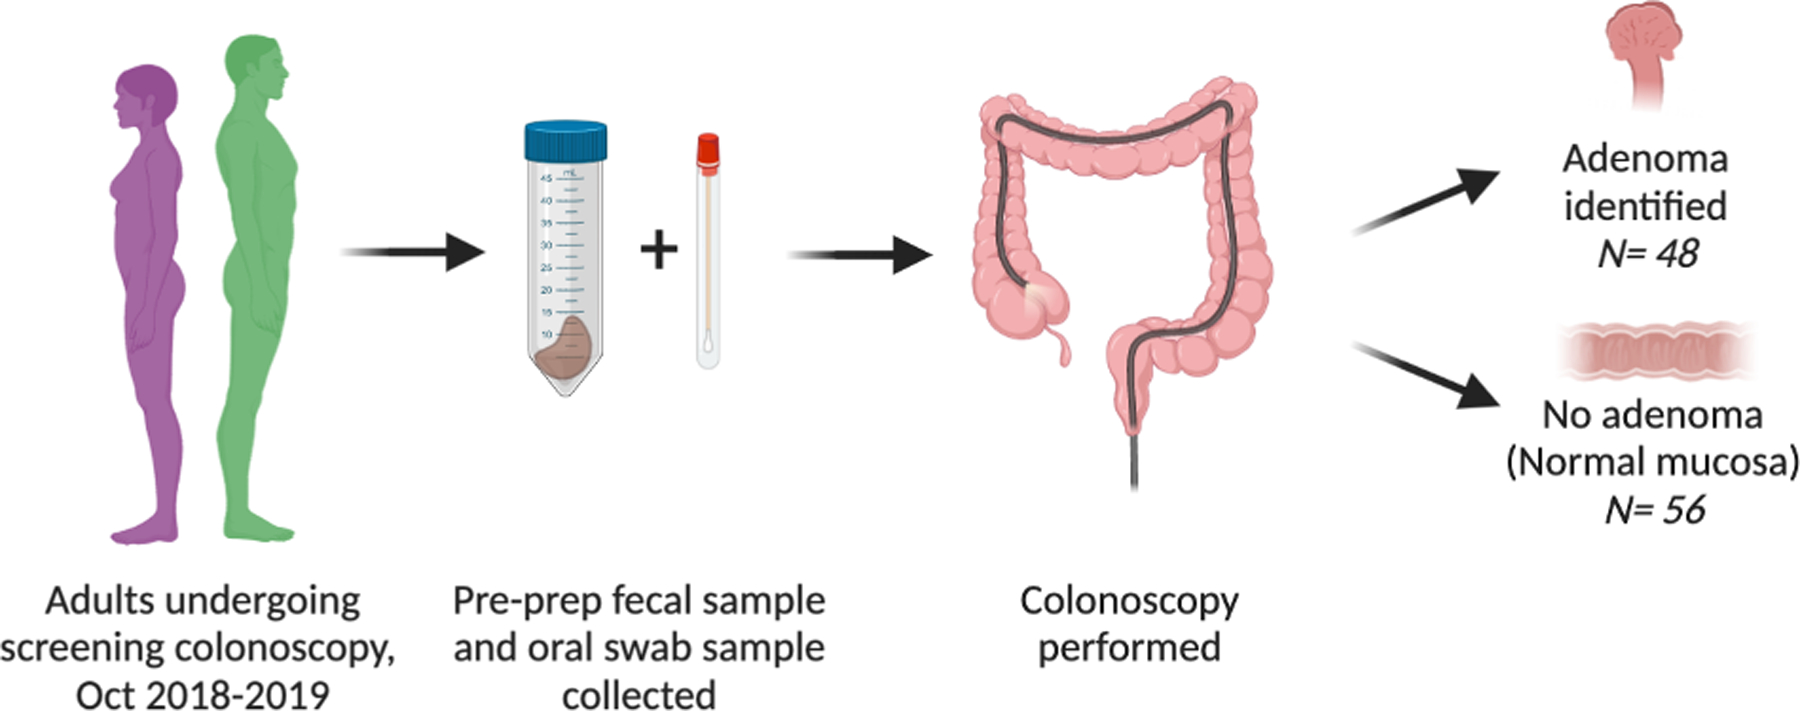
Cohort enrollment flowchart.
Data collection and processing
Clinical data
Patients completed a medical and habits questionnaire and additional information was extracted by study physicians from the electronic medical record. Endoscopic reports and pathology reports for each lesion were obtained from the electronic medical record.
Fecal and oral swab samples
Stool samples were obtained by patients using a Zymo Research DNA/RNA Shield Fecal Collection Tube within the 24 hours preceding the initiation of a polyethylene glycol-based bowel preparation. Samples were placed immediately at −20˚C and transferred to −80°C at colonoscopy. Buccal mucosa samples were collected with the Zymo Research DNA/RNA Shield Collection Tube with Swab and stored at −80°C.
Mucosal samples
Normal mucosa from the right colon, left colon and rectum of each subject was collected during colonoscopy using cold biopsy forceps. When polyps were found, biopsies were taken 1–2mm from the polyp and classified as the microbiome of the polyp. Mucosal samples stored in RNAlater at −80°C.
DNA Isolation
Microbial DNA was isolated from fecal, oral swab, and mucosal samples with the DNeasy PowerSoil Pro kit following the manufacturer’s protocol. An additional 10-minute incubation at 65˚C facilitated cellular lysis and was followed by bead beating on the highest setting for 10-minutes using Vortex Genie 2 and a 24-sample vortex adaptor (QIAGEN).
Sequencing
Amplification of the 16S rRNA V4 region was performed as previously described using the 515f and 806r primers in triplicate using 1µL of DNA.27,28 The resulting amplicon libraries quantified using the Qubit® HS kit and pooled into three sequencing pools by combining a total of 200ng of individual amplicon libraries. Library pools were purified using the QIAquick PCR Purification Kit, diluted to a concentration of 10nM and submitted to the Oregon State University Center for Genome Research and Biocomputing for cluster generation and sequencing on an Illumina MiSeq instrument. Sequence reads were input into DADA229 for quality filtering, amplicon sequence variant (ASV) calling (default parameters), and taxonomic assignment against the Silva database (v128).30
Statistical analysis
Raw ASV tables filtered to remove non-prokaryotic ASVs and rarefied to a depth of 10,000 counts in R. Samples with less than 10,000 sequences were removed. Microbial community richness and Shannon entropy were calculated in R. Generalized linear models (fecal and oral) or generalized linear mixed models (mucosa) resolved relationships between patient adenoma quantity and alpha-diversity. Models were built for each tissue type (fecal, oral, mucosal) separately. Mixed models accounted multiple mucosal sampling within patients. The same approach was used to calculate associations between adenoma number and individual ASV abundances with false discovery controlled using qvalue (R::qvalue::qvalue).31 Wilcoxon tests quantified differences in alpha-diversity between adenoma formers and non-formers. Permutational multivariate analysis of variance defined associations between microbiome beta-diversity and patient parameters. Community level correlations for microbial abundance were calculated with linear models using patients for which a complete sample set was available. Since multiple biopsies were collected for each patient, the mean taxon intra-patient the mean taxon intra-patient mucosal abundance was used for correlation.
Random forest analysis32evaluated if microbial abundance predicts adenoma formation. Independent random forest classifiers were generated using fecal, oral, and mucosal ASV or genera abundances in R (randomForest::randomForest, ntree=5000, , replace =T). For the mucosal ASV and genera classifiers one-thousand-fold cross-validation was performed by training a model on a random subset of 90% of mucosal samples and classifying the remaining samples. Mean error for cross validation was calculated as 1- (#accurate classifications/total classifications).
Availability of data and materials
All code generated during this analysis is available at the following URL: https://github.com/chrisgaulke/ohsu_combined_adenoma_data. The raw sequence files generated during the current study are available at the NCBI Sequence Read Archive (SRA) project numbers PRJNA650009 and PRJNA745994.
Results
Of the 104 patients included, the mean age was 60 years (range 41–78 years, SD ±8.7). Adenomas were identified in 46% of participants and most commonly located in the ascending colon (58%) (Table 1). The vast majority of adenomas were tubular adenomas (87%). Patients with and without adenomas were similar in terms of age, sex, body mass index, race/ethnicity and family history of CRC (Supplemental Table 1). Significant differences existed between adenoma formers in terms of smoking (26% controls, 48% adenoma formers, p = 0.016; Supplemental Table 1). Conversely, regular activity was associated with the absence of adenomas (77% controls, 58% adenoma formers, p = 0.032).
Table 1:
Adenoma Characteristics
| N | % | Min | Max | |
|---|---|---|---|---|
| Participants with adenomas | 48 | 46% | 0 | 17 |
| TA | 41 | 37% | 0 | 16 |
| TVA | 3 | 3% | 0 | 1 |
| SS | 11 | 10% | 0 | 2 |
| Frequency of adenoma by type | 128 | |||
| TA | 111 | 87% | ||
| TVA | 3 | 2% | ||
| SS | 14 | 11% | ||
| Location of adenomas | 128 | |||
| Ascending | 74 | 58% | ||
| Transverse | 20 | 16% | ||
| Descending | 27 | 21% | ||
| Rectum | 7 | 5% |
N, Number; Min, Minimum; Max, Maximum; TA, tubular adenoma; TVA, tubulovillous adenoma; SS, sessile serrated adenoma
A total of 27,523,989 oral, fecal, and mucosal microbial sequence reads (median = 50,882 reads/library) were generated. Mucosal and fecal samples were dominated by Firmicutes and Bacteroidetes, while Firmicutes and Proteobacteria were most abundant in oral communities. At the ASV level, mucosal communities harbored significant microbial diversity not observed in fecal or oral communities. Only ~40% of mucosal taxa were observed in fecal samples with a smaller proportion (~9%) represented in oral swabs (Supplemental Figure 1A). Concordantly, fecal microbial abundances moderately associated with mucosal abundances (R2 = 0.615, p < 2.2×10⁻¹⁶; Supplemental Figure 1B). Oral and mucosal taxa abundances were poorly correlated (R2 = 0.005, p = 4.18×10−08; Supplemental Figure 1C).
We next asked if microbial abundances were predictive of adenoma formation. Random forest classifiers predicted adenoma formation using fecal, oral, and mucosal ASV abundances. Classifiers built using fecal and oral samples manifested high out-of-bag (OOB) error rates (47.3% and 51.1% respectively) and poor diagnostic abilities (fecal and oral area under the curve (AUC) = 0.53; Figure 2A). In contrast, the mucosal classifier reliably diagnosed adenoma formation with an AUC of 0.993 and an OOB error of 3.2%. Consistent results were observed for classifiers built using genera abundances (Supplemental Figure 2A). Permutational cross-validation confirmed that these results were robust to variation in the model training dataset (ASV mean prediction error 3.8%, genera mean prediction error 8.6%).
Figure 2. Mucosal Microbial Signatures Accurately Predict Adenoma Formers.
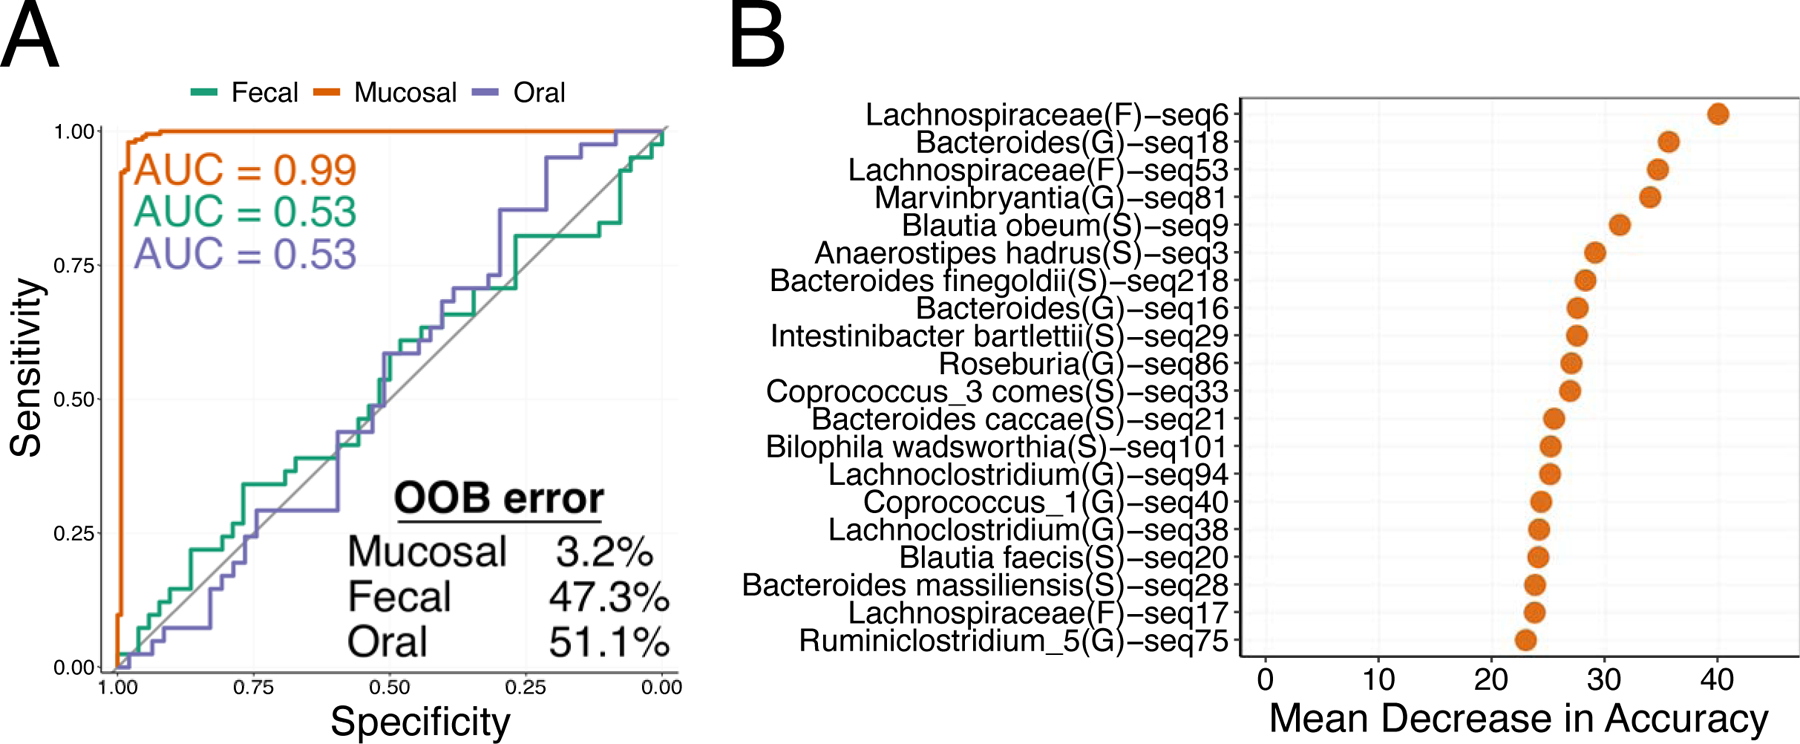
A) Receiver operator characteristic curves for fecal (green line), Mucosal (Orange line), and Oral (purple line) random forest classifiers. The grey line represents an area under the curve (AUC) of 0.5. Model AUCs are colored by tissue and model out-of-bag (OOB) error is indicated. B) A variable importance plot for mucosal random forest classifier.
To determine the importance of each taxa in our models we computed the mean decrease in accuracy that occurred when a specific taxon was removed from our mucosal adenoma classifiers. Mucosal classifier accuracy was strongly influenced by five taxa associated with the family Lachnospiraceae, genera Bacteroides and Marvinbryantia, and Blautia obeum (Figure 2B). Consistent results were observed for genera with Bacteroides, Marvinbryantia, Lachnoclostridium, Dorea and Intestinibacter contributing substantially to model accuracy (Supplemental Figure 2B).
Alterations in microbiome alpha-diversity have been reported for individuals with colorectal adenomas.20,21 To determine if colorectal adenoma formation impacted microbiome alpha-diversity in our cohort, we quantified ASV richness and shannon entropy in each sample type. We found that adenoma formers exhibited depleted fecal richness (W = 1444, p = 0.004) and Shannon entropy (W = 1357, p = 0.024) compared to non-formers. However, mucosal and oral community alpha-diversity did not significantly differ between these groups (Figure 3A, Supplemental Figure 3A). Fecal richness (GLM, t = −2. 827, p = 0.0058) and Shannon entropy (GLM, t = −2.383, p = 0.0193) also negatively associated with increasing number of colonic adenomas (Figure 3B, Supplemental Figure 3B). Richness and Shannon entropy were not correlated with adenoma burden in mucosal or oral samples (Figure 3C, D, Supplemental Figure 3C, D).
Figure 3. Adenoma abundance correlates with microbial richness in feces.
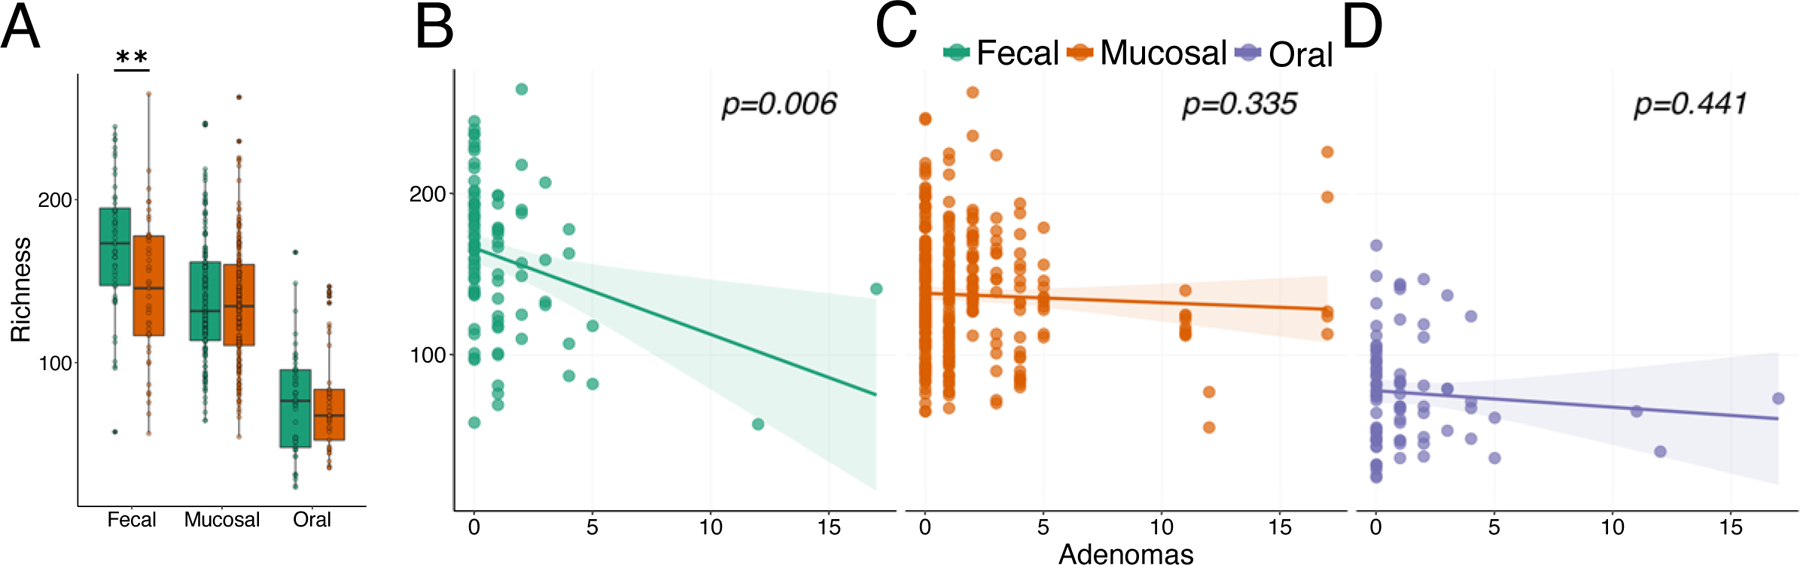
A) Boxplot of microbial richness in adenoma formers (orange boxes) and non-formers (green boxes) across tissues. Depleted microbial richness associates with increasing number of colonic adenomas in B) feces but not in C) mucosal or D) oral samples. Mucosal community richness is shown for each individual biopsy collected from an individual patient. Colored lines indicated best fit regression lines with shaded regions indicating standard error. In box plots ** denotes p < 0.01.
Given the relationship between alpha-diversity and the presence and number of adenomas, we asked if patients with adenomas manifest different patterns of ASV beta-diversity as measured by Bray-Curtis dissimilarity. We calculated the beta-diversity across all samples and then quantified how this diversity associated with tissue type and adenoma burden. Microbiome beta-diversity was significantly associated with patient adenoma burden (PERMANOVA, R2 = 0.02, p = 0.0002), tissue type (PERMANOVA, R2 = 0.24, p = 0.0002), and the interaction (PERMANOVA, R2 = 0.01, p = 0.0008) between tissue type and adenoma burden (Figure 4). Given the interaction between tissue type and adenoma we then calculated associations between microbiome diversity and the number of adenomas for each tissue type separately. For mucosal communities we also asked if the location of the mucosal sample influenced community diversity. Consistent with our random forest findings we did not detect significant relationships between oral (PERMANOVA, R2 = 0.01, p = 0.48) or fecal (PERMANOVA, R2 = 0.01, p = 0.26) microbiome diversity and adenoma number (Supplemental Figure 4). However, mucosal microbiome diversity did correlate (PERMANOVA, R2 = 0.04, p = 0.0002) with adenoma number. No association between colorectal location and microbiome diversity was detected (PERMANOVA, R2 = 0.01, p = 0.96).
Figure 4. Microbial diversity associates with collection site and adenoma burden.
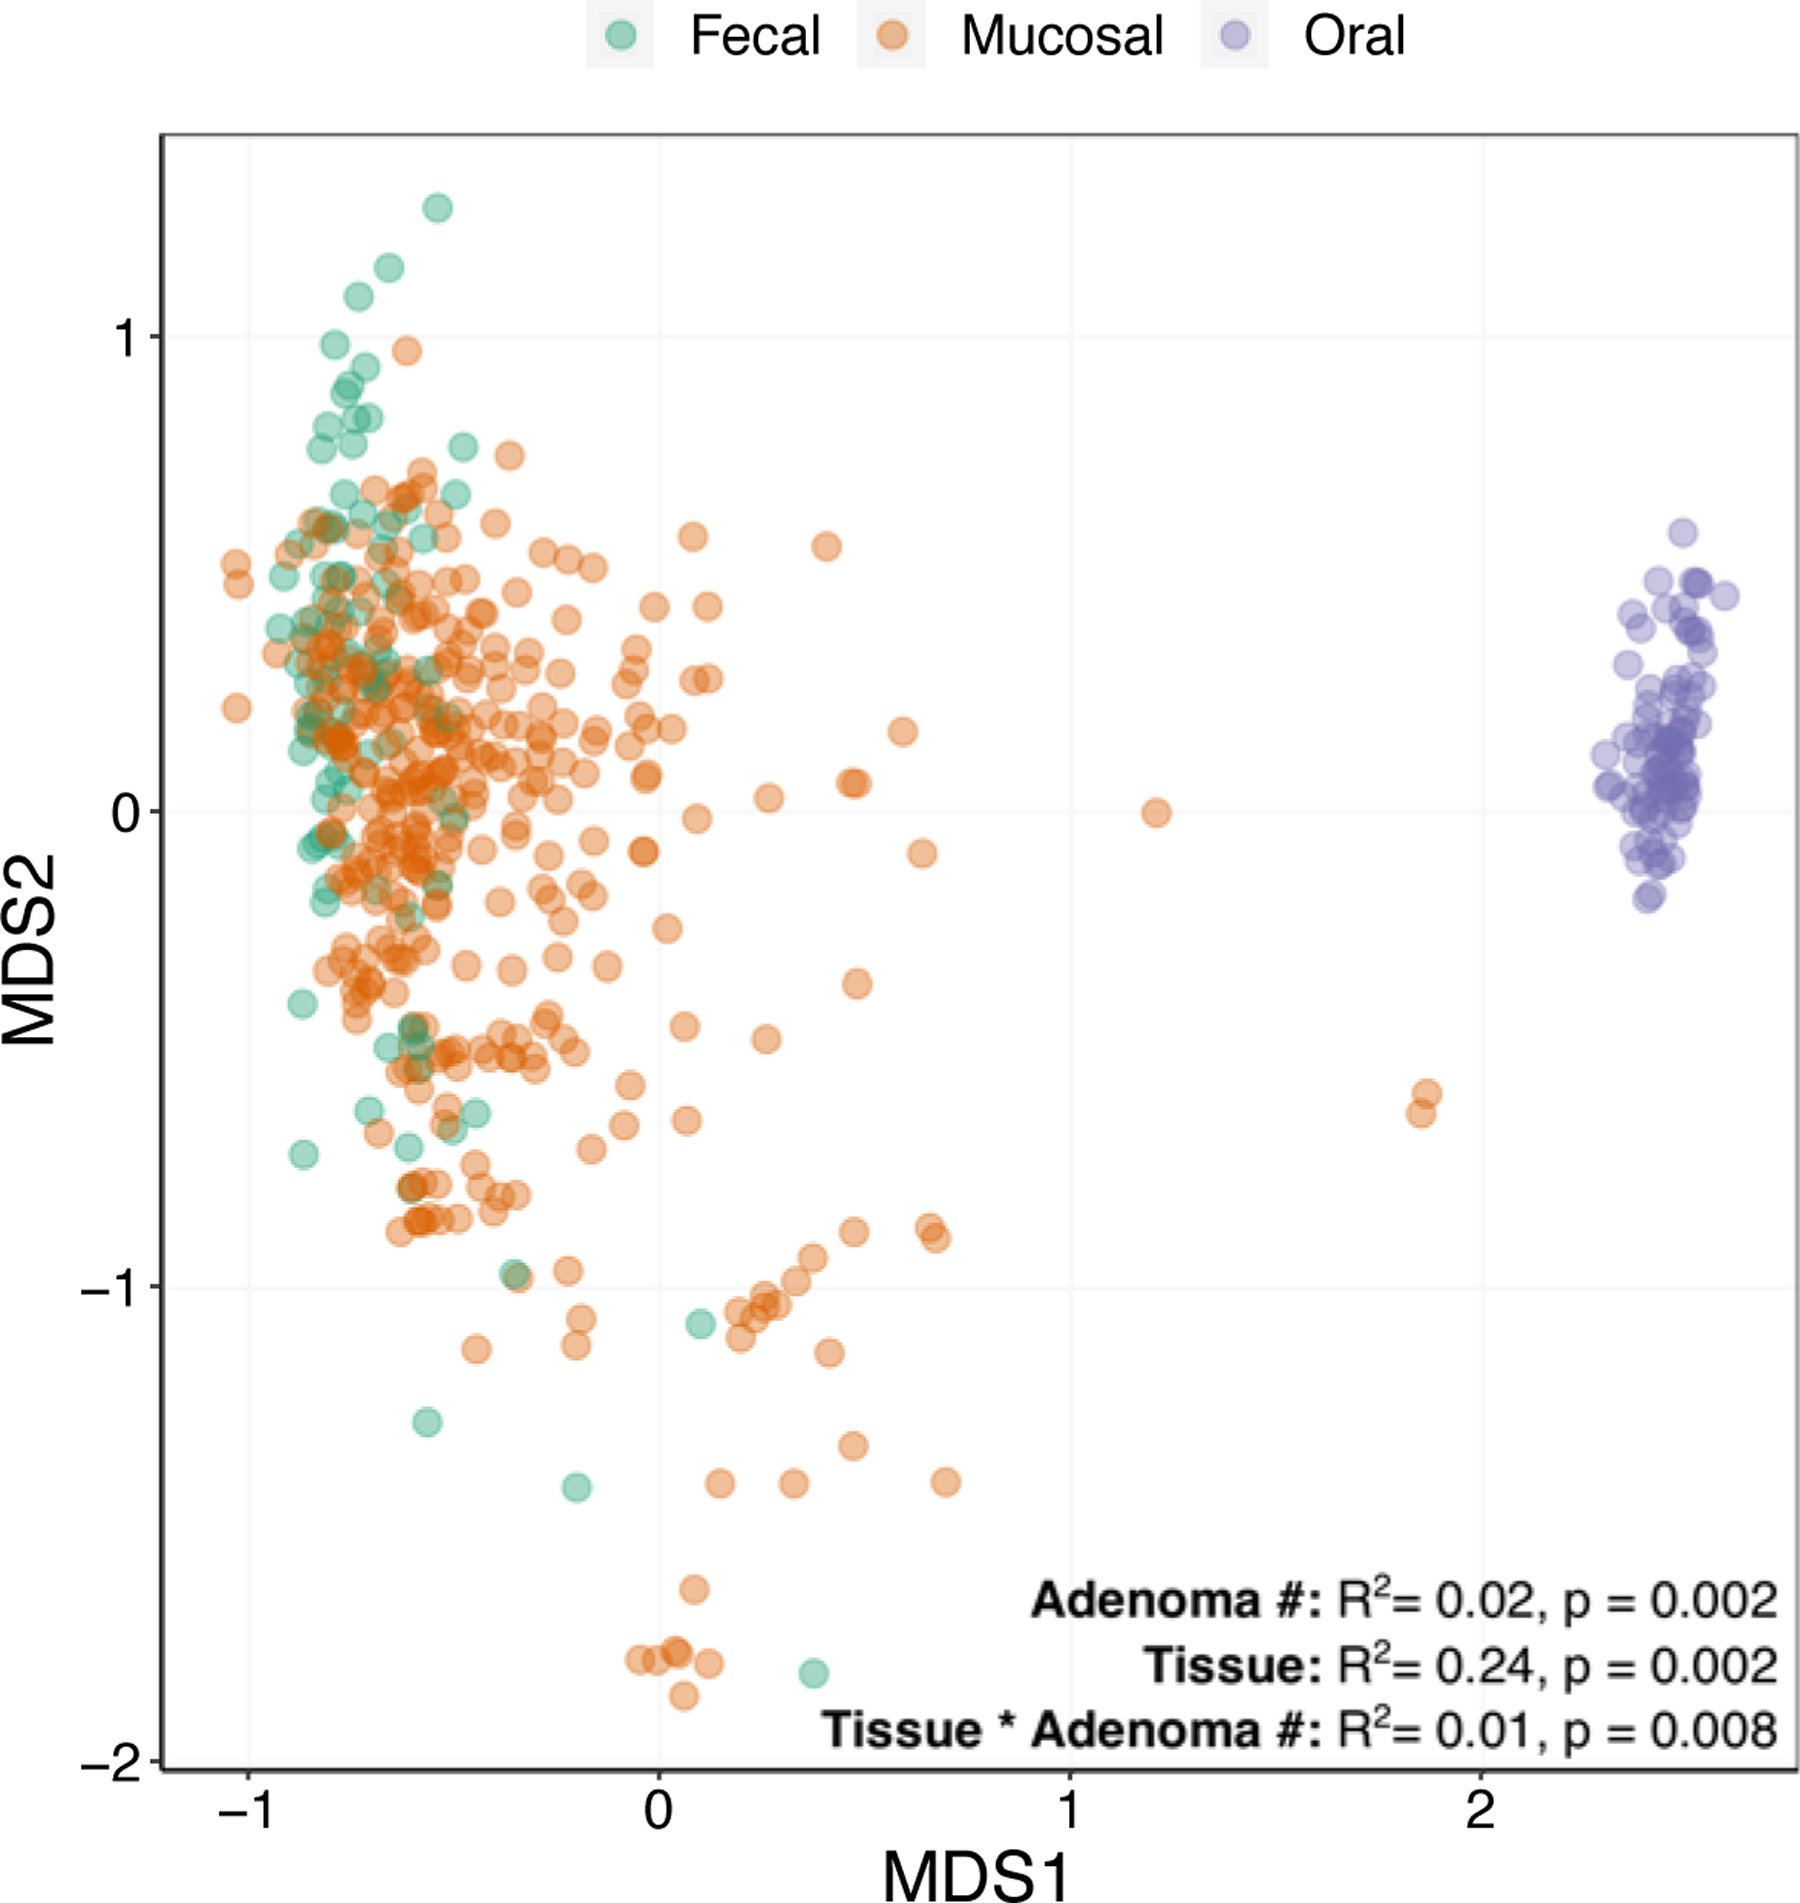
A non-metric multidimensional scaling ordination of fecal (green), mucosal (orange), and oral (purple) microbiome samples. Associations (PERMANOVA) between adenoma burden and tissue type are indicated.
Next, we used linear regression to quantify associations between individual taxon abundances and adenoma burden. In mucosal samples, ASVs associated with the genera Streptococcus and Bacteroides and the families Ruminococcaceae and Lachnospiraceae consistently correlated with higher adenoma burden (Figure 5). Amplicon sequence variants associated with the genera Veillonella (GLMM, z = 4.14, p = 3.55×10−05), Odoribacter (GLMM, z = 2.77, p = 5.55×10−03), Haemophillus (GLMM, z = 2.85, p = 4.28×10−03), Coprobacter (GLMM, z = 2.76, p = 5.85×10−03), Eggerthella (GLMM, z = 2.52, p = 1.19×10−02), Granulicatella (GLMM, z = 5.70, p = 1.21×10−08), and Actinomyces (GLMM, z = 3.06, p = 2.18×10−03) were also associated with elevated adenoma number. Two fecal ASVs, one associated with the family Lachnospiraceae (GLM, t = 4.10, p = 8.99×10−05) and one with the taxa Erysipelatoclostridium ramosum (GLM, t = 4.33, p = 3.89×10−05), both positively correlated with adenoma burden. A single oral ASV corresponding to Rothia mucilaginosa (GLM, t = 4.80, p = 6.56×10−06) was also positively associated with adenoma number. However, none of the associations observed between fecal and oral taxa and adenoma burden were reflected in the mucosa.
Figure 5. Microbial taxa abundances associate with adenoma burden.
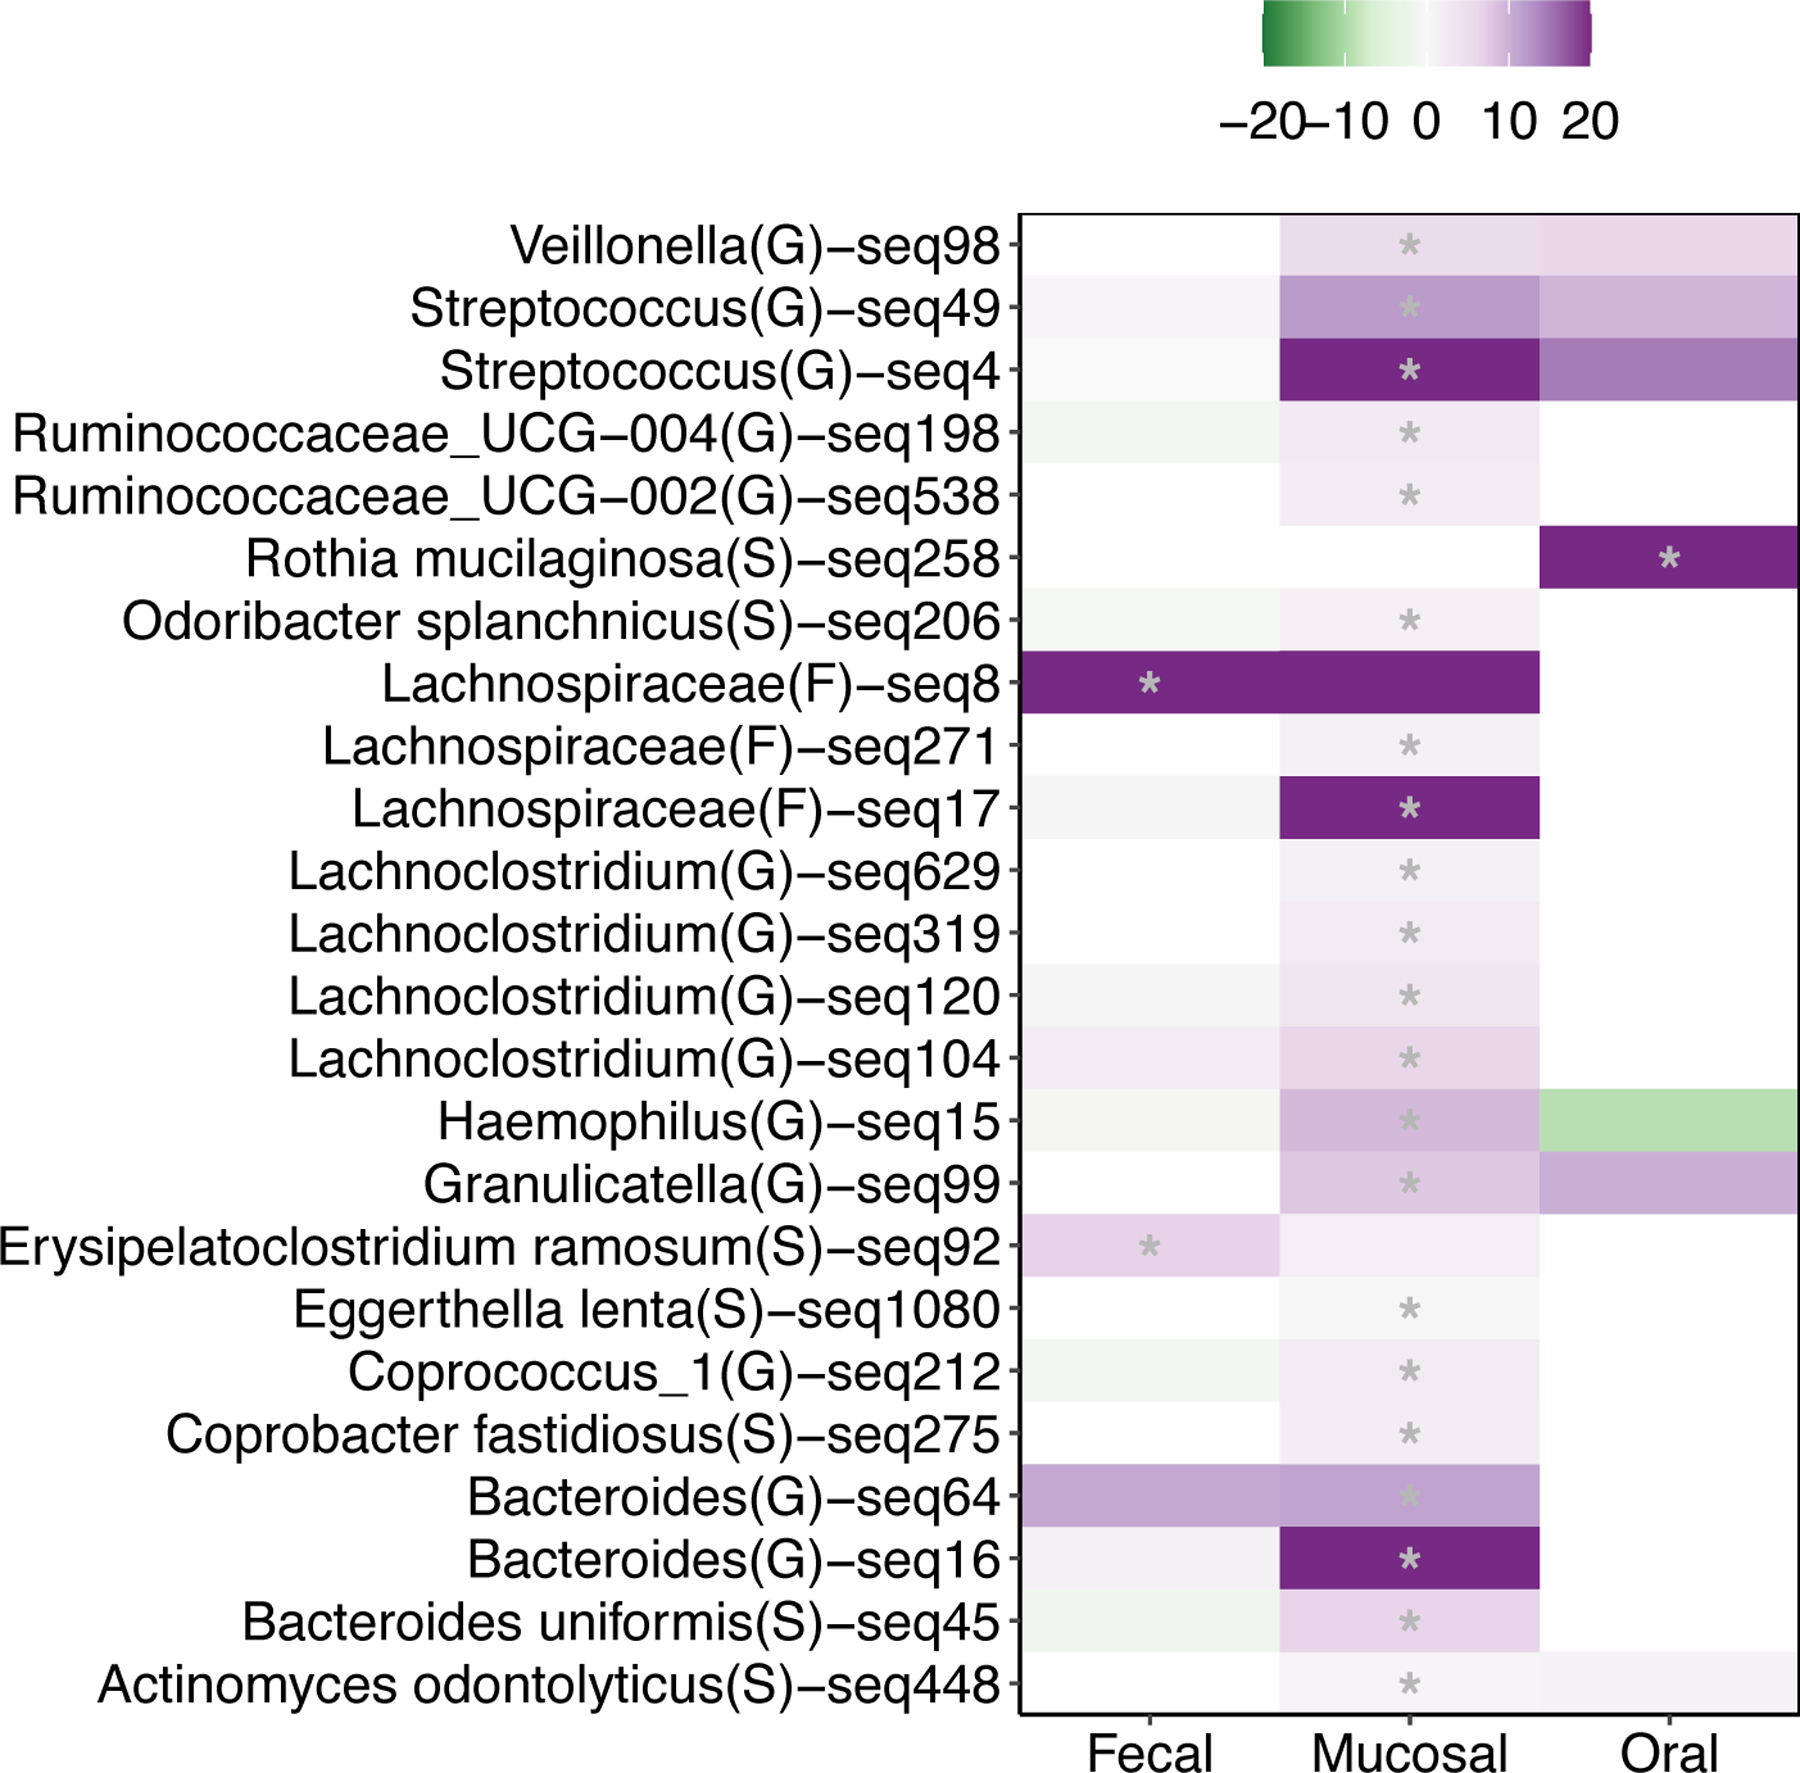
A heat map of associations between Amplicon Sequence Variant (ASV) abundances and colonic adenoma burden. The color of each heat map cell represents the magnitude and direction of an individual ASV generalized linear model coefficient in fecal, oral, or mucosal samples. ASVs with q-value < 0.1 in at least one tissue type are included and a grey asterisk in a cell indicates a q-value < 0.1. The ASV identifier and imputed ASV taxonomy indicated for each row is the most granular taxonomic classification available for each ASV.
Fifty-eight percent of adenomas in our cohort were located in the ascending colon. Since microbiome variation correlates with adenoma number, we reasoned that differences in adenoma burden across the length of the colon could link to varying microbial abundance. To evaluate if the microbiome contributes to this phenomenon, we used generalized linear mixed models to quantify differences in ASV abundance across colonic locations. The abundance of five ASVs (q < 0.1) were significantly impacted by colonic location, however, none of these were differentially abundant in the right colon when compared to the left colon (Supplemental Figure 5A). At the level of genera (q < 0.1), the abundance of 13 taxa associated with colonic location (Supplemental Figure 5B). The abundance of one of these taxa, Ruminococcaceae_UCG.014 (GLMM, z = −2.65, p = 8.17×10−03), was significantly decreased in the right colon. When more permissive false discovery thresholds (i.e., q < 0.2) were applied, the abundance of several additional taxa were noted to be altered in the right colon. Specifically, Blautia (GLMM, z = −2.50, p = 0.01), Alistipes (GLMM, z = −3.05, p = 2.31×10−03), Barnesiella (GLMM, z = −2.80, p = 5.06×10−03), were all depleted in the right colon, while the genus Haemophilus (GLMM, z = 3.01, p = 2.60×10−03) was elevated (Supplemental Figure 5B).
Discussion
There is mounting evidence supporting a connection between the microbiome and CRC, and the key to understanding the principal factors of this relationship likely resides in the pre-neoplastic stage: the adenoma. The adenoma-carcinoma sequence is well documented, in which CRC develops from a pre-malignant adenoma.18,21 Analyzing the relationship between the human intestine and adenoma development may help narrow the focus on important early changes that either incite, support or result from neoplastic transformation. Using 16S sequencing, we compared the microbial signatures of patients with and without adenomas. Our cohort is one of the larger prospectively collected adenoma cohorts conducted in the United States including robust patient data as well as multiple sample types. We found that the fecal, oral and mucosal microbiomes are unique. Fecal samples demonstrated decreased alpha-diversity in association with adenoma formation, a pattern that was not observed in oral or mucosal samples. Alternatively, mucosal microbial taxonomic abundances were reliably associated with adenoma formation, even using samples of normal appearing mucosal tissue, and specific taxa may be linked to adenoma formation.
The majority of the existing literature regarding the association between the microbiome and colonic neoplasms has been performed on fecal samples. Our study clearly demonstrates that the microbial communities are different between sampling type, with far fewer than half of the taxa observed in two or more sampling types. It is reasonable to assume that fecal samples are more representative of the intra-luminal microbiome whereas the mucosal biopsies are more representative of the brush-border associated microbiome, including microbiota more likely to directly interact with colonocytes, form biofilms or those with cellular invasion capabilities. We did not identify significant overlap between these populations, and therefore caution that study of the fecal microbiome alone may incompletely characterize the intestinal microbiome and its role in adenoma formation.
We also found that the microbiome demonstrates some variation by colonic location as studied with mucosal biopsies. While the overall diversity was not significantly different along the colon, we identified a limited number of taxa which were largely decreased in abundance in the proximal colon in comparison to the distal colon and rectum. Only with application of a more permissive false discovery rate did we appreciate a relative increase in one genus: Haemophilus. Notably, Haemophilus also links with increased adenoma burden suggesting that this genus may contribute to the development of adenomas or be better suited to thrive in a microenvironment in which adenomas are present. Haemophilus has also been associated with CRC in prior studies.20 The subtle differences in the microbiome along the colon are interesting as right-sided lesions are commonly of the CMS1 subtype, which is characterized by increased inflammatory cell infiltration,33 causing one to consider the possible interplay between the tumor microenvironment and the microbiome. In fact, Burns et al, using whole-exome sequencing, found that microbiome alterations seen in CRC, particularly in the proximal microbiome, were associated with alterations in tumor gene expression, specifically loss-of-function mutations.34
We found that the adenoma-associated fecal microbiome demonstrates decreased alpha-diversity, and that the magnitude of decrease in alpha-diversity correlated with adenoma count. This was not apparent in mucosal or oral samples. Peters et al, in one of the largest evaluations of the adenoma-associated fecal microbiome to date, also appreciated similar alpha-diversity associated with adenomas.20 Alternatively, Hale et al, evaluating another large cohort, failed to identify alterations in microbiome diversity in their cohort, as have others.22,23 In contrast, Feng et al’s analysis of 156 fecal samples from Austrian identified increased diversity in the pre-neoplastic and neoplastic groups, with a distinct increase in the number of virulence genes.21 It is possible that the stage of adenoma development may play a role in the heterogeneity of results. However analyses of diversity at different stages of adenoma development has yet to identify significant differences in diversity between early and advanced adenomas,23,35 though trends are apparent. While we did not appreciate a difference in alpha-diversity in mucosal samples, existing studies have shown variable results in regard to alpha-diversity though have more commonly demonstrated it to be increased in association with early neoplasms.21,24,36,37
Aside from the finding that the microbiome is unique to sample types, perhaps the most compelling finding of this study is the significant association of specific taxonomic abundances with adenoma burden. We identified differential abundance of specific taxa in fecal, oral and mucosal samples, though interestingly with limited crossover between the microbiomes associated with each sample type. In adenoma formers, mucosal samples had increases in Streptococcus, Bacteroides, Ruminococcaceae, Lachnospiraceae, Veillonella, Odoribacter, Haemophillus, Coprobacter, Eggerthella, Granulicatella, and Actinomyces. Using fecal samples, adenoma formers were associated with increases in Lachnospiraceae and Erysipelatoclostridium ramosum, whereas Rothia mucilaginosa was associated with increased adenomas using oral swab samples.
Mucosal abundances alone were reliably associated with adenoma formation, with an AUC of 0.993 and with low out-of-bag error rates. Alternatively fecal and oral abundances resulted in weaker diagnostic capabilities and higher error rates. To confirm the reliability of the mucosal findings, we repeated the modeling at different taxonomic levels with consistent findings. Together these data indicate that adenoma formers are accurately identified using mucosal microbiota abundance profiles and that these differences in mucosal microbial signals are not well modelled by fecal and oral microbial communities. What is particularly interesting, however, is that it is not just the adenoma-adjacent mucosal samples which harbor this diagnostic capability, but rather the normal appearing samples that are not immediately associated with an adenoma. While further study is indicated to understand causality, the fact that microbiome differences exist in adenoma formers in regions without structural change does seem to at least suggest that differences in the microbiome may precede adenoma formation.
Our study includes 104 participants, including 48 with adenomas, and this size certainly limits our ability to extrapolate the complex relationships between the microbiome and human characteristics. Additionally, with our sample size, we may have missed subtle location effects or associations between the microbiome and adenoma formation which larger studies could help resolve. However, our study is one of the largest studies in which samples of both fecal and mucosal samples were prospectively collected. The study also includes multiple tissue types with linked patient data. While we took care to collect the fecal samples prior to preparation, this was not possible for collection of the mucosal samples. Shober et al highlight that the variation introducted by bowel preparation is less than that of inter-individual variation.38 Given that our groups were subjected to the same preparation with the same bowel preparation scores, we don’t expect that the variation introduced by the bowel preparation will significantly affect our conclusions. Our data still suggest that there are adherent microbiota that are not evacuated with bowel preparation, that have a significant association with adenoma presence. While inclusion of metabolomics may aid in understanding some of the interactions between the microbiome and colonocytes, the absence of this data does not detract from the finding that the microbiomes by sample type are distinct, and given the AUC in our modeling, is unlikely to add more explanatory power to our model. While we are able to evaluate relationships between microbiota and adenomas, clearly without a longitudinal design we are unable to evaluate directionality or more causal associations within our cohort.
In light of these findings, the assumption that the fecal microbiome is an appropriate surrogate for the mucosal microbiome is called into question. We have shown these microbial communities to be unique, which is consistent with prior findings.39 We did identify differences apparent in the fecal microbiome which did associate with adenoma formation, most notably a decrease in the fecal alpha-diversity in individuals with adenomas. While these differences were not apparent in the mucosal samples, it is possible that the intra-luminal microbiome, as captured by the fecal samples, interacts with cellular functions through metabolomics, not through direct microbial and colonocyte interactions. Despite possible mechanisms for the intra-luminal microbiota to interact with colonocytes, our data suggest that the mucosal microbiome is far more predictive of adenoma formation, even in samples from normal appearing tissue. This suggests that future study of the microbiome may be incomplete if mucosal samples are excluded. More exciting, though, is the predictive capability of the microbiome on adenoma formation.
Conclusions
An altered microbiome has been implicated in CRC development. As CRC follows the adenoma-carcinoma sequence, study at the adenoma stage may help unlock key interactions between the microbiota and tumorigenesis. Our study provides an analysis of multiple tissue sample types for evaluation of the microbiome in association with adenoma formation, with non-adenoma formers serving as a control. Importantly, we found that the fecal microbiome and mucosal microbiome were distinct and not proxies for one another. While decreased fecal microbial diversity was associated with adenoma formation, differences in taxonomic microbial abundances were the most predictive indicator of adenoma presence.
Supplementary Material
Supplemental Figure 1. Microbial communities vary across tissue sample type. A) A Venn diagram of ASV presence in mucosal (Orange), fecal (green) and oral (blue) communities. Overlapping fragments of circles represent shared ASVs between tissues. B) Mean mucosal ASV abundances plotted against mean fecal ASV abundances. C) Mean mucosal ASV abundances plotted against mean oral ASV abundances. Black lines represent best fit lines for each linear model.
Supplemental Figure 2. Genera Abundances are Highly Accurate Predictors of Adenoma Formers. A) Receiver operator characteristic curves for fecal (green line), Mucosal (Orange line), and Oral (purple line) random forest classifiers. The grey line represents an area under the curve (AUC) of 0.5. Model AUCs are colored by tissue and model out-of-bag (OOB) error is indicated. B) A variable importance plot for mucosal random forest classifier.
Supplemental Figure 3. Microbial alpha diversity correlates with fecal Shannon entropy. A) Boxplot of microbial Shannon entropy in adenoma formers (orange boxes) and non-formers (green boxes) across tissues. Depleted microbial Shannon entropy associated with increasing number of colonic adenomas in B) feces but not in C) mucosal or D) oral samples. Colored lines indicated best fit lines with shaded regions indicating standard error.
Supplemental Figure 4. Mucosal microbial beta-diversity associates with adenoma burden but not location. Non-metric multidimensional scaling ordination of A) mucosal, B) fecal, and C) oral microbial communities. The circles are colored by patient adenoma burden.
Supplemental Figure 5. Microbial taxa abundances vary across colon. Heat maps of model coefficients from generalized linear models (left colon is default) for A) Amplicon Sequence Variant (ASV; q <0.1) and B) genera (q<0.2) abundances. The color of each heat map cell represents an individual variable coefficient. A grey asterisk in a cell indicates a p-value < 0.05. The ASV identifier and imputed ASV taxonomy indicated for each row is the most granular taxonomic classification available for each ASV. RC, right colon; REC, rectum; SGD, sigmoid colon; TV, transverse colon; F, family; G, genus; S, species.
Acknowledgements
The authors would like to thank Sarah Diamond MD, Assistant Professor in the Division of Gastroenterology and Hepatology at Oregon Health and Science University, for her assistance with sample collection, and Linda Watson MBA, for her editorial contributions.
Funding Sources
1. Bob and Charlee Moore Foundation (Robert Martindale)
2. NIH R01HL143803 (Sudarshan Anand)
References
- 1.Siegel RL, Miller KD, Jemal A. Cancer statistics, 2020. CA Cancer J Clin. 2020;70:7–30. [DOI] [PubMed] [Google Scholar]
- 2.Park SY, Boushey CJ, Wilkens LR, et al. High-Quality Diets Associate With Reduced Risk of Colorectal Cancer: Analyses of Diet Quality Indexes in the Multiethnic Cohort. Gastroenterology. 2017;153:386–394.e2. [DOI] [PMC free article] [PubMed] [Google Scholar]
- 3.Nigro ND, Bull AW. Prospects for the prevention of colorectal cancer. Dis Colon Rectum. 1987;30:751–754. [DOI] [PubMed] [Google Scholar]
- 4.Botteri E, Iodice S, Bagnardi V, et al. Smoking and Colorectal Cancer. Jama. 2008;300:2765. [DOI] [PubMed] [Google Scholar]
- 5.Dekker E, Tanis PJ, Vleugels JLA, et al. Colorectal cancer. Lancet. 2019;394:1467–1480. [DOI] [PubMed] [Google Scholar]
- 6.Watson KM, Gaulke CA, Tsikitis VL. Understanding the microbiome: a primer on the role of the microbiome in colorectal neoplasia. Ann Gastroenterol. 2020;223–236. [DOI] [PMC free article] [PubMed]
- 7.Sender R, Fuchs S, Milo R. Revised Estimates for the Number of Human and Bacteria Cells in the Body. PLoS Biol. 2016;14:1–14. [DOI] [PMC free article] [PubMed] [Google Scholar]
- 8.Huttenhower C, Gevers D, Knight R, et al. Structure, function and diversity of the healthy human microbiome. Nature. 2012;486:207–214. [DOI] [PMC free article] [PubMed] [Google Scholar]
- 9.Faith JJ, Guruge JL, Charbonneau M, et al. The long-term stability of the human gut microbiota. Science (80- ).;341. Epub ahead of print 2013. [DOI] [PMC free article] [PubMed] [Google Scholar]
- 10.Yatsunenko T, Rey FE, Manary MJ, et al. Human gut microbiome viewed across age and geography. Nature. 2012;486:222–227. [DOI] [PMC free article] [PubMed] [Google Scholar]
- 11.Voigt AY, Costea PI, Kultima JR, et al. Temporal and technical variability of human gut metagenomes. Genome Biol. 2015;16:1–12. [DOI] [PMC free article] [PubMed] [Google Scholar]
- 12.Rath S, Rud T, Karch A, et al. Pathogenic functions of host microbiota. Microbiome. 2018;6:1–13. [DOI] [PMC free article] [PubMed] [Google Scholar]
- 13.Louis P, Hold GL, Flint HJ. The gut microbiota, bacterial metabolites and colorectal cancer. Nat Rev Microbiol. 2014;12:661–672. [DOI] [PubMed] [Google Scholar]
- 14.Huipeng W, Lifeng G, Chuang G, et al. The differences in colonic mucosal microbiota between normal individual and colon cancer patients by polymerase chain reaction-denaturing gradient gel electrophoresis. J Clin Gastroenterol. Epub ahead of print 2014. [DOI] [PubMed]
- 15.Saus E, Iraola-Guzmán S, Willis JR, et al. Microbiome and colorectal cancer: Roles in carcinogenesis and clinical potential. Mol Aspects Med. 2019;1–14. [DOI] [PMC free article] [PubMed]
- 16.Wang T, Cai G, Qiu Y, et al. Structural segregation of gut microbiota between colorectal cancer patients and healthy volunteers. ISME J. Epub ahead of print 2012. [DOI] [PMC free article] [PubMed]
- 17.Dohlman AB, Arguijo Mendoza D, Ding S, et al. The cancer microbiome atlas: a pan-cancer comparative analysis to distinguish tissue-resident microbiota from contaminants. Cell Host Microbe. 2021;1–18. [DOI] [PMC free article] [PubMed]
- 18.Leslie A, Carey FA, Pratt NR, et al. The colorectal adenoma ± carcinoma sequence. 2002;845–860. [DOI] [PubMed]
- 19.Vogelstein B, Fearon ER, Stanley RH, et al. Genetic Alterations During Colorectal-Tumor Development. N Engl J Med. 1988;319:525–532. [DOI] [PubMed] [Google Scholar]
- 20.Peters BA, Dominianni C, Shapiro JA, et al. The gut microbiota in conventional and serrated precursors of colorectal cancer. Microbiome. 2016;4:69. [DOI] [PMC free article] [PubMed] [Google Scholar]
- 21.Feng Q, Liang S, Jia H, et al. Gut microbiome development along the colorectal adenoma-carcinoma sequence. Nat Commun.;6. Epub ahead of print 2015. [DOI] [PubMed] [Google Scholar]
- 22.Hale VL, Chen J, Johnson S, et al. Shifts in the fecal microbiota associated with adenomatous polyps. Cancer Epidemiol Biomarkers Prev.;26. Epub ahead of print 2017. [DOI] [PMC free article] [PubMed] [Google Scholar]
- 23.Mori G, Rampelli S, Orena BS, et al. Shifts of Faecal Microbiota during Sporadic Colorectal Carcinogenesis. Sci Rep.;8. Epub ahead of print 2018. [DOI] [PMC free article] [PubMed] [Google Scholar]
- 24.Burns MB, Lynch J, Starr TK, et al. Virulence genes are a signature of the microbiome in the colorectal tumor microenvironment. Genome Med. Epub ahead of print 2015. [DOI] [PMC free article] [PubMed]
- 25.Kim M, Vogtmann E, Ahlquist DA, et al. Fecal metabolomic signatures in colorectal adenoma patients are associated with gut microbiota and early events of colorectal cancer pathogenesis. MBio. 2020;11:1–16. [DOI] [PMC free article] [PubMed] [Google Scholar]
- 26.Dai Z, Coker OO, Nakatsu G, et al. Multi-cohort analysis of colorectal cancer metagenome identified altered bacteria across populations and universal bacterial markers. Microbiome. 2018;6:70. [DOI] [PMC free article] [PubMed] [Google Scholar]
- 27.Caporaso JG, Lauber CL, Walters WA, et al. Global patterns of 16S rRNA diversity at a depth of millions of sequences per sample. Proc Natl Acad Sci U S A. 2011;108:4516–4522. [DOI] [PMC free article] [PubMed] [Google Scholar]
- 28.Caporaso J et al. ltra-high-throughput microbial community analysis on the Illumina HiSeq and MiSeq platform. ISME J. 2012;6:1621–1624. [DOI] [PMC free article] [PubMed] [Google Scholar]
- 29.Callahan BJ, McMurdie PJ, Rosen MJ, et al. DADA2: High-resolution sample inference from Illumina amplicon data. Nat Methods. Epub ahead of print 2016. [DOI] [PMC free article] [PubMed]
- 30.Yilmaz P, Parfrey LW, Yarza P, et al. The SILVA and “all-species Living Tree Project (LTP)” taxonomic frameworks. Nucleic Acids Res. Epub ahead of print 2014. [DOI] [PMC free article] [PubMed]
- 31.Storey JD, Tibshirani R. Statistical significance for genomewide studies. Proc Natl Acad Sci U S A. 2003;100:9440–9445. [DOI] [PMC free article] [PubMed] [Google Scholar]
- 32.Breiman L Random Forests. 2001. Epub ahead of print 2001.
- 33.Guinney J, Dienstmann R, Wang X, et al. The consensus molecular subtypes of colorectal cancer. Nat Med. 2015;21:1350–1356. [DOI] [PMC free article] [PubMed] [Google Scholar]
- 34.Burns MB, Montassier E, Abrahante J, et al. Colorectal cancer mutational profiles correlate with defined microbial communities in the tumor microenvironment. PLoS Genet. 2018;14:1–24. [DOI] [PMC free article] [PubMed] [Google Scholar]
- 35.Yang T-W, Lee W-H, Tu S-J, et al. Enterotype-based Analysis of Gut Microbiota along the Conventional Adenoma-Carcinoma Colorectal Cancer Pathway. Sci Rep. 2019;9:10923. [DOI] [PMC free article] [PubMed] [Google Scholar]
- 36.Sanapareddy N, Legge RM, Jovov B, et al. Increased rectal microbial richness is associated with the presence of colorectal adenomas in humans. ISME J. Epub ahead of print 2012. [DOI] [PMC free article] [PubMed]
- 37.Shen XJ, Rawls JF, Randall T, et al. Molecular characterization of mucosal adherent bacteria and associations with colorectal adenomas. Gut Microbes. 2010;1:138–147. [DOI] [PMC free article] [PubMed] [Google Scholar]
- 38.Shobar RM, Velineni S, Keshavarzian A, et al. The Effects of Bowel Preparation on Microbiota-Related Metrics Differ in Health and in Inflammatory Bowel Disease and for the Mucosal and Luminal Microbiota Compartments. Clin Transl Gastroenterol. 2016;7:e143. [DOI] [PMC free article] [PubMed] [Google Scholar]
- 39.Chen W, Liu F, Ling Z, et al. Human intestinal lumen and mucosa-associated microbiota in patients with colorectal cancer. PLoS One.;7. Epub ahead of print 2012. [DOI] [PMC free article] [PubMed] [Google Scholar]
Associated Data
This section collects any data citations, data availability statements, or supplementary materials included in this article.
Supplementary Materials
Supplemental Figure 1. Microbial communities vary across tissue sample type. A) A Venn diagram of ASV presence in mucosal (Orange), fecal (green) and oral (blue) communities. Overlapping fragments of circles represent shared ASVs between tissues. B) Mean mucosal ASV abundances plotted against mean fecal ASV abundances. C) Mean mucosal ASV abundances plotted against mean oral ASV abundances. Black lines represent best fit lines for each linear model.
Supplemental Figure 2. Genera Abundances are Highly Accurate Predictors of Adenoma Formers. A) Receiver operator characteristic curves for fecal (green line), Mucosal (Orange line), and Oral (purple line) random forest classifiers. The grey line represents an area under the curve (AUC) of 0.5. Model AUCs are colored by tissue and model out-of-bag (OOB) error is indicated. B) A variable importance plot for mucosal random forest classifier.
Supplemental Figure 3. Microbial alpha diversity correlates with fecal Shannon entropy. A) Boxplot of microbial Shannon entropy in adenoma formers (orange boxes) and non-formers (green boxes) across tissues. Depleted microbial Shannon entropy associated with increasing number of colonic adenomas in B) feces but not in C) mucosal or D) oral samples. Colored lines indicated best fit lines with shaded regions indicating standard error.
Supplemental Figure 4. Mucosal microbial beta-diversity associates with adenoma burden but not location. Non-metric multidimensional scaling ordination of A) mucosal, B) fecal, and C) oral microbial communities. The circles are colored by patient adenoma burden.
Supplemental Figure 5. Microbial taxa abundances vary across colon. Heat maps of model coefficients from generalized linear models (left colon is default) for A) Amplicon Sequence Variant (ASV; q <0.1) and B) genera (q<0.2) abundances. The color of each heat map cell represents an individual variable coefficient. A grey asterisk in a cell indicates a p-value < 0.05. The ASV identifier and imputed ASV taxonomy indicated for each row is the most granular taxonomic classification available for each ASV. RC, right colon; REC, rectum; SGD, sigmoid colon; TV, transverse colon; F, family; G, genus; S, species.
Data Availability Statement
All code generated during this analysis is available at the following URL: https://github.com/chrisgaulke/ohsu_combined_adenoma_data. The raw sequence files generated during the current study are available at the NCBI Sequence Read Archive (SRA) project numbers PRJNA650009 and PRJNA745994.