

Summary
Chemical-induced gene expression profiles provide critical information of chemicals in a biological system, thus offering new opportunities for drug discovery. Despite their success, large-scale analysis leveraging gene expressions is limited by time and cost. Although several methods for predicting gene expressions were proposed, they only focused on imputation and classification settings, which have limited applications to real-world scenarios of drug discovery. Therefore, a chemical-induced gene expression ranking (CIGER) framework is proposed to target a more realistic but more challenging setting in which overall rankings in gene expression profiles induced by de novo chemicals are predicted. The experimental results show that CIGER significantly outperforms existing methods in both ranking and classification metrics. Furthermore, a drug screening pipeline based on CIGER is proposed to identify potential treatments of drug-resistant pancreatic cancer. Our predictions have been validated by experiments, thereby showing the effectiveness of CIGER for phenotypic compound screening of precision medicine.
Keywords: gene expression, drug repurposing, learning-to-rank, attention, pancreatic cancer, graph neural network, precision medicine, phenotype screening, cancer therapy, machine learning
Graphical abstract
Highlights
-
•
A new deep-learning method (CIGER) for chemical-induced gene expression ranking
-
•
CIGER can predict gene expression for de novo chemicals from chemical structures
-
•
We discovered drugs for the treatment of drug-resistant pancreatic cancer
The bigger picture
In recent years, a phenotype-based drug discovery approach using chemical-induced gene expressions has shown to be effective in drug discovery and precision medicine. However, it is not feasible to experimentally determine chemical-induced gene expressions for all available chemicals of interest, thereby hindering the application of gene expression-based compound screening on a large scale. Thus, it is crucial to design a computational approach that can generate gene expression information for any chemicals. We proposed a new, deep-learning framework named chemical-induced gene expression ranking (CIGER) to predict a landmark gene expression profile (i.e., gene ranking) induced by de novo chemicals based on their chemical structures. Leveraging CIGER, we predicted and experimentally validated that several existing drugs can increase the therapeutic response on drug-resistant pancreatic cancer. Our results demonstrated the effectiveness of CIGER for precision drug discovery in practice.
The power of drug-repurposing methods leveraging chemical-induced gene expression is limited due to the sparseness and low throughput of the gene expression data. We proposed a deep-learning framework to predict gene expression profiles (i.e., gene ranking) for de novo chemicals from their chemical structures as well as a phenotype-based drug-repurposing pipeline for finding potential treatments for diseases from existing drugs. A case study for pancreatic cancer demonstrates the effectiveness of our method for precision drug discovery in practice.
Introduction
Phenotypic screening has been shown to be more effective than target-based screening for first-in-class drug discovery, but this approach also has some limitations due to the low throughput of phenotypic assays.1 Recently, several high-throughput phenotypic datasets that cover the wide ranges of chemical compounds and cell lines have been developed to alleviate this problem. A gene expression profiling method based on these datasets has been shown to be a very effective and powerful tool for phenotypic drug discovery and system pharmacology. Computational techniques that leverage genome-wide gene expression, especially chemical-induced differential gene expression, has demonstrated a great potential in drug repurposing,2, 3, 4, 5 elucidation of drug mechanisms,6 lead identification,7 and predicting side effect of drug compounds.8
Pioneered by Connectivity Map,9 a database that consists of ∼1,300 chemical-induced gene expression profiles of five human cancer cell lines, many studies have been proposed to identify existing drugs for the treatment of new diseases by selecting drugs that reverse the disease gene expressions.10,11 However, the low coverage across cell types in Connectivity Map limited the performance of those methods, especially in large-scale analysis settings. To alleviate this limitation, a novel and affordable gene expression profiling method has been proposed. In particular, the Library of Integrated Network-based Cell-Signature (LINCS) program introduced the L1000 platform, which measured the expression of the most informative genes (i.e., ∼1,000 landmark genes) instead of whole-genome data, thus reducing the cost for measuring each gene expression profile to ∼$5.12 This profiling technique resulted in a gene expression dataset, called LINCS L1000, which consists of ∼1,400,000 gene expression profiles covering the responses of ∼20,000 compounds at different concentrations across ∼80 human cell lines. Despite the significantly increasing coverage of compounds and cell lines in the L1000, large-scale analysis based on this dataset is still limited due to several problems. First, despite the wide coverage across cell lines, compounds, and concentrations, there are many missing expression values in the vast and high-dimensional combinatorial space of chemicals, concentrations, and cell lines. Moreover, there are hundreds of millions of drug-like chemicals, so it is not feasible to measure gene expression profiles across a large number of cell lines for all of these chemicals. Second, the LINCS L1000 and other gene expression datasets are highly noisy due to experimental limitations.13,14 As a result, many experiment measurements are not reliable in these datasets. These problems seriously affect the performance of large-scale genome analysis using the LINCS L1000 and motivate the development of computational methods to predict missing gene expression values in this high-dimensional combinatorial space.
Several studies have been proposed to predict gene expression values for chemical-induced gene expression data in general,15, 16, 17, 18, 19, 20, 21, 22 and for the LINCS L1000 in particular,13,23,24 but most of them have focused on the imputation and classification settings only. In particular, they predict either expression values or classes of certain genes in the gene expression profiles or whole gene expression profiles of certain existing chemicals. The imputation setting is not practical or useful in the real-world application of drug discovery, in which the assessment of novel chemicals (i.e., chemicals not in the gene expression dataset) cannot be made due to the unavailability of the corresponding gene expression profiles. Moreover, formulating this problem as a classification problem has limited scope for practical applications, because this setting focuses only on a small subset of genes, whereas down-stream analysis based on gene expression profiles often benefits most with use of the information of all the profile (i.e., ranking of genes).25 There have also been some studies proposed in the recommender system context for predicting the ranking of items in data.26,27 However, these methods are designed for matrix data only; hence, they cannot be adapted to work with the LINCS L1000 dataset, which is formulated as high-dimensional data.
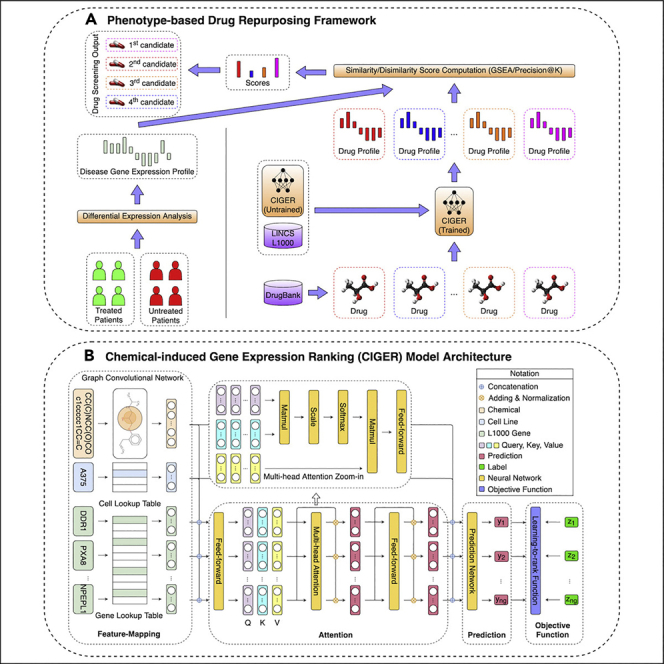
In this work, we propose a new framework, named chemical-induced gene expression ranking (CIGER), that can predict gene ranking in L1000 gene expression profiles induced by de novo chemicals. In particular, CIGER is a neural-network-based architecture that leverages the representations of biological objects including chemicals, cell lines, and genes to predict the gene ranking in the corresponding gene expression profiles. This framework consists of several components, as follows. First, due to the importance of ranking information with respect to gene expressions,25 we focus on prediction in the whole gene expression profile by using some ranking loss functions28, 29, 30, 31, 32, 33 instead of considering prediction on each gene separately by some regression or classification loss functions in the optimization process. Second, we learn the contextualized representations for genes before making predictions by using an attention mechanism named multi-head attention34 to capture the dependencies among genes, chemicals, and cell lines. We also utilize a graph convolutional network35 to extract useful information from the graph structure of chemicals. Finally, the multi-layer feedforward neural network is used to predict gene ranking from the contextualized representations. Figure 1 presents the overall architecture of CIGER, and the details of this model are shown in the Experimental procedures section. We evaluate the effectiveness of CIGER for predicting gene expression ranking and classification tasks on the LINCS L1000 dataset under a 5-fold cross-validation setting. The results show that CIGER significantly outperforms other models across all ranking and classification metrics. Furthermore, we design a new in silico drug screening pipeline for finding potential treatments from all drugs in the DrugBank database for pancreatic cancer based on their chemical-induced gene expression profiles (i.e., gene rankings) generated by CIGER. This pipeline demonstrates that CIGER can facilitate phenotypic compound screening for precision drug discovery in practice. In summary, the contributions of this work are as follows:
-
•
We propose a deep-learning framework (CIGER) that leverages chemical, cell, and gene representations to predict gene ranking in chemical-induced gene expression profiles for de novo chemicals, which is a more practical but more challenging problem.
-
•
Leveraging CIGER, we design a new phenotypic (i.e., gene expression) drug-repurposing pipeline and use pancreatic cancer as a showcase, although it can be easily applied for finding treatments for other diseases.
-
•
The source code and the generated gene signatures of all drugs in DrugBank are made available for research purposes at https://github.com/pth1993/CIGER.
Figure 1.

Overview architecture of chemical-induced gene expression ranking (CIGER)
This model consists of the four main components: feature-mapping, attention, prediction, and learning-to-rank objective function. It takes input as a tuple of chemical structure, cell line, and L1000 genes and then predicts the ranking of genes in the corresponding gene expression profile. Note that the multi-head attention zoom-in is detailed architecture of the multi-head attention layer in CIGER and is separated from the main figure.
Results and discussion
Chemical-induced gene expression data analysis
Several genome-wide chemical-induced gene expression datasets have been published and applied in drug discovery and system pharmacology, and the LINCS L1000 dataset12 is the largest and latest dataset among them. This dataset includes the gene expression profiles generated from a platform called L1000. Specifically, this platform measures the expression of 978 landmark genes, which captures most of the information from the entire transcriptome. Since the first release of the LINCS L1000 dataset, which includes more than 1.3 million gene expression profiles from ∼20,000 small-molecule compounds over 77 cell lines, there have been many studies focusing on improving the quality of this dataset.36, 37, 38 In our study, we experiment with an L1000 dataset using Bayesian analysis for calculating peak deconvolution.39 This dataset has been shown to generate more robust z-score profiles from L1000 assay data compared with the original L1000 dataset using k-means clustering for calculating peak deconvolution,12 and therefore gives better representation for chemicals. Initially, we investigated the sparse and noisy problems of this gene expression dataset by calculating the average Pearson’s correlation (APC) scores among bio-replicate gene expression profiles (level 4 data) of experiments and then visualizing these scores in the chemical-cell line space. From Figure 2, we can observe that only 5.36% of experiments are available in this combinatorial space (i.e., 21,229 chemicals × 83 cell lines), and among existing experiments, only 8.47% of them have the corresponding APC scores > 0.6. These obstacles certainly hinder the utility of this dataset to its down-stream applications in drug discovery. Figure 2 also shows the statistics of this dataset with respect to cell lines, exposure times, and chemical concentrations. We can see that the top 10 most popular cell lines account for 77.14% of the number of experiments, and the most popular time exposure and chemical concentration are 24 h (67.56%) and 10 μM (44.82%), respectively.
Figure 2.

LINCS L1000 data statistical analysis (cell lines, dosages, and time exposures are shown in random order)
(A) Gene expression profiles in chemical-cell line space (i.e., yellow denotes missing profiles for chemical-cell line pairs, and red and blue denote that the pairs with the corresponding correlation scores are smaller (unstable) and larger (stable) than 0.6, respectively).
(B) Proportion of profiles by cell lines.
(C) Proportion of profiles by time exposures.
(D) Proportion of profiles by chemical concentrations
In our study, to reduce the noise of this dataset, we selected only the gene expression profiles (level 5 data) of the 10 most popular cell lines (i.e., A375, A549, HA1E, HCC515, HELA, HT29, MCF7, PC3, VCAP, YAPC) in both phase I (GSE92742) and phase II (GSE70138) of this dataset that satisfy two conditions: (1) the APC scores among their bio-replicates (level 4 data) be larger than 0.6, and (2) the concentration and exposure time of chemicals be the largest (i.e., 10 μM and 24 h, respectively). The resulting dataset includes some duplicate experiments (i.e., experiments with the same chemical and cell line), so we calculated the ranking of each L1000 gene across duplicate experiments and then selected the experiment that had the most genes close to the median. Ranking loss functions focused on optimizing the top-ranked objects only, whereas in gene expression analysis, both the most up-regulated (positive z-score) and the down-regulated (negative z-score) genes are important so we multiplied the z-scores in the gene expression profiles with −1 when training the model to rank down-regulated genes. After processing, the data consisted of 3,294 gene expression profiles. The number of chemicals and the statistics of gene expression values corresponding to each cell line are shown in Table 1.
Table 1.
Number of chemicals and gene expression statistics across cell lines for gene expression dataset after processing
| #Gene expression |
Gene expression value |
|||
|---|---|---|---|---|
| Profile (3,294) | Max | Mean | Min | |
| A375 | 430 | 7.8573 | −0.0161 | −7.6315 |
| A549 | 232 | 6.5863 | 0.0059 | −6.4124 |
| HA1E | 394 | 6.6578 | −0.0100 | −6.6511 |
| HCC515 | 262 | 6.6362 | −0.0027 | −6.1765 |
| HELA | 191 | 5.2012 | −0.0138 | −5.1913 |
| HT29 | 334 | 5.8744 | 0.0179 | −5.7641 |
| MCF7 | 561 | 8.8711 | 0.0067 | −8.7236 |
| PC3 | 481 | 8.6328 | −0.0181 | −8.5835 |
| VCAP | 256 | 6.6322 | −0.0158 | −6.3357 |
| YAPC | 153 | 5.1836 | −0.0504 | −5.1830 |
Gene expression ranking for de novo chemicals
To validate the effectiveness of CIGER for predicting gene expression ranking for novel chemicals, we conducted experiments on the LINCS L1000 dataset39 to compare its prediction performances with existing methods, including DeepCOP24 and Tensor-Train Weight Optimization (TT-WOPT).40 The detailed architectures of these models are presented in experimental procedures. Because our study focuses on predicting gene expression ranking for novel chemicals, we performed experiments under 5-fold cross-validation (i.e., train:dev:test = 60:20:20) divided by chemicals to ensure the chemicals in the development, and testing sets are not seen in the training set. Normalized Discounted Cumulative Gain (NDCG) and Precision@K (see experimental procedures) are used for comparing gene rankings between predicted and ground-truth gene expression profiles.
Previous work24 formulateed the gene expression prediction as a classification problem by classifying significantly regulated genes. Although such work showed promising results, the classification setting was actually not very effective or practical in the down-stream applications, because it could not represent the whole gene expression profile. Subsequent analysis using chemical-induced gene expression profiles will benefit most from the information of all the profiles. Thus, we target a more realistic but more challenging scenario, in which the model predicts the ranking of genes in the gene expression profile. In particular, we evaluate CIGER, DeepCOP, and a random permutation (Note S1) for the ranking task by measuring the ranking of up-regulated genes (genes that have z-scores > 0) and down-regulated genes (genes that have z-scores < 0). DeepCOP was not originally developed for predicting gene ranking, so we use its predicted probability scores to generate ranked lists. As shown in Table 2, CIGER significantly outperforms DeepCOP and random permutation by a large margin across all ranking metrics. Specifically, CIGER achieves NDGC scores of 0.8275 and 0.8460, which reduces the error rates of DeepCOP by 9.1 and 6.8% for up-regulated and down-regulated gene ranking, respectively. CIGER also achieves significantly better Precision@K compared with DeepCOP, showing the effectiveness of CIGER for predicting the ranking of genes in all gene expression profiles of novel chemicals. To further validate the performances of CIGER, we conducted the significant testing (i.e., paired-sample t test) with respect to NDCG scores between CIGER and the best baseline method (i.e., DeepCOP). The p values of the paired-sample t test for up-regulated and down-regulated gene ranking tasks are 1.93 × 10⁻³⁰ and 4.18 × 10−41, respectively, thereby showing the superiority of CIGER for gene expression ranking compared with the existing methods. We also evaluated the performances of CIGER and baseline methods for ranking tasks with respect to each cell line. The cell-specific evaluations (i.e., NDCG and Precision@K) for these methods are shown in Tables S1 and S2.
Table 2.
Average performance (NDCG and Precision@K) of CIGER, DeepCOP, and the random ranking for ranking up-regulated and down-regulated genes under the 5-fold cross-validation setting
| Model | NDCG | P@10 | P@50 | P@100 | P@200 |
|---|---|---|---|---|---|
| Up-regulated gene ranking | |||||
| Random | 0.7309 ± 0.0025 | 0.2045 ± 0.1270 | 0.2045 ± 0.0556 | 0.2045 ± 0.0382 | 0.2045 ± 0.0254 |
| TT-WOPT | 0.7384 ± 0.0010 | 0.2606 ± 0.0143 | 0.2395 ± 0.0093 | 0.2284 ± 0.0077 | 0.2181 ± 0.0060 |
| DeepCOP | 0.8083 ± 0.0022 | 0.5430 ± 0.0131 | 0.4656 ± 0.0111 | 0.4161 ± 0.0104 | 0.3559 ± 0.0068 |
| CIGER | 0.8275 ± 0.0041 | 0.5973 ± 0.0170 | 0.5276 ± 0.0126 | 0.4735 ± 0.0101 | 0.4027 ± 0.0077 |
| Down-regulated gene ranking | |||||
| Random | 0.7418 ± 0.0013 | 0.2045 ± 0.1270 | 0.2045 ± 0.0556 | 0.2045 ± 0.0382 | 0.2045 ± 0.0254 |
| TT-WOPT | 0.7534 ± 0.0007 | 0.2876 ± 0.0076 | 0.2618 ± 0.0050 | 0.2471 ± 0.0052 | 0.2297 ± 0.0040 |
| DeepCOP | 0.8346 ± 0.0030 | 0.6084 ± 0.0190 | 0.5304 ± 0.0180 | 0.4779 ± 0.0143 | 0.4077 ± 0.0090 |
| CIGER | 0.8460 ± 0.0023 | 0.6342 ± 0.0120 | 0.5753 ± 0.0041 | 0.5250 ± 0.0034 | 0.4465 ± 0.0035 |
Gene expression classification for de novo chemicals
Besides the ranking setting, we also compared CIGER with baseline methods, including TT-WOPT, DeepCOP, and logistic regression (LR) in the classification setting, in which the models predict whether genes are up-regulated or down-regulated due to molecular intervention. As shown in Table 3, CIGER outperforms TT-WOPT, LR, and DeepCOP by a large margin, which demonstrates its effectiveness for gene expression classification tasks. In particular, CIGER achieves AUC scores of 0.7202 and 0.7558 for up-regulated and down-regulated gene classification tasks, respectively. For baseline methods, DeepCOP achieves better performances than LR, indicating that the linear model is not capable of capturing the relationship between input features and gene regulation effects. The performances of TT-WOPT for the two classification tasks, as we expected, are 0.4981 and 0.5096, which are equivalent to a coin toss. TT-WOPT, designed for imputation setting, does not leverage any feature information except for the gene expression values in the training set when predictions are made, so this method is not suitable for de novo chemical setting. We also evaluate the classification performances of these models by AU-PRC and F1 scores. Table S3 shows the results measured by these classification metrics.
Table 3.
Average performances (AUC) of CIGER and baseline models for up-regulated and down-regulated gene classification tasks under 5-fold cross-validation setting
| Methods | Objective function | Classification tasks |
|
|---|---|---|---|
| Up-regulated | Down-regulated | ||
| TT-WOPT | N/A | 0.4981 ± 0.0097 | 0.5096 ± 0.0097 |
| Logistic regression | Binary cross entropy | 0.6270 ± 0.0209 | 0.6480 ± 0.0182 |
| DeepCOP | Binary cross entropy | 0.6764 ± 0.0176 | 0.6925 ± 0.0217 |
| CIGER-NA | ListMLE | 0.6741 ± 0.0071 | 0.7166 ± 0.0102 |
| CIGER-NA | ListNet | 0.6723 ± 0.0122 | 0.7254 ± 0.0081 |
| CIGER-NA | RankCosine | 0.6992 ± 0.0106 | 0.7289 ± 0.0123 |
| CIGER-NA | RankNet | 0.6810 ± 0.0052 | 0.7192 ± 0.0108 |
| CIGER-A | RankCosine | 0.7086 ± 0.0106 | 0.7448 ± 0.0040 |
| CIGER | RankCosine | 0.7202±0.0057 | 0.7558 ± 0.0061 |
TT-WOPT, CIGER, and its variants (i.e., CIGER-A and CIGER-NA) are trained with z-score values whereas logistic regression and DeepCOP are trained with binary labels indicating gene regulation stages.
Drug repurposing for pancreatic cancer
Drug candidate prediction for pancreatic cancer
To further investigate the effectiveness of CIGER, we designed the drug-screening pipeline using this model to find potential treatments for pancreatic cancer from existing drugs. Previous drug repurposing research has identified useful targets and drug candidates for killing pancreatic cancer cells or inhibiting tumor growths with e thlimited numbers of drugs obtained from compound library or by target.42,43 Here, we performed drug repurposing with all existing drugs from DrugBank. Furthermore, we aimed to discover drugs that can induce the drug sensitivity of pancreatic cancer sub-types that are resistant to existing anti-cancer therapies rather than screen compounds that can kill cancer cells directly. A recent study has shown that the combination of metformin and vitamin C can restore TET2 and GATA6 activities in an aggressive squamous-like pancreatic ductal adenocarcinoma sub-type, which are the biomarkers of classical-pancreatic tumor, thereby improving therapeutic responses and survival of aggressive pancreatic sub-types.44 The main step of this screening pipeline is to compare the chemical-induced gene expression profiles generated by CIGER with a gene expression profile computed from pancreatic cancer cell lines treated by metformin and vitamin C. For drug gene expression profiles, we send queries to the DrugBank database to retrieve the list of all existing drugs (i.e., 11,179 drugs) with their corresponding SMILES representations and then use CIGER trained on the LINCS L1000 dataset to generate profiles for these drugs from their SMILES representations. For gene expression profile of pancreatic cancer treated by metformin and vitamin C, we performed differential expression analysis with DESeq241 between metformin- and vitamin C-treated samples and mock-treated samples.44 Then, we computeed the similarity with respect to ranking information between the gene expression profiles of treatment and drugs across 10 cell lines by gene set enrichment analysis (GSEA) and Precision@200 scores to find potential treatments for this disease. Note that we derived the treatment profile as the differential expression of treated disease samples versus untreated disease samples, which is different from the differential expression of disease samples versus normal samples used in deriving the disease profile mentioned in previous studies. Thus, the drug candidates from our pipeline would induce similar gene expression profiles as a treatment (i.e., metformin/vitamin C) profile instead of having inverse correlation with the disease profile as in previous studies. The details of the method used to generate drug and treatment gene expression profiles and the screening process are shown in experimental procedures. Figure 3 shows the proposed drug screening pipeline using CIGER.
Figure 3.

Drug screening pipeline using CIGER
This model is trained with the LINCS L1000 dataset to learn the relation between gene expression profiles and molecular structures (i.e., SMILES). Then, molecular structures retrieved from the DrugBank database are put into CIGER to generate the corresponding gene expression profiles. Finally, these profiles are compared with treatment profiles calculated from treated and untreated samples to find the most potential treatments for that disease
Top drugs selected by Precision@200 and GSEA scores are listed in Tables 4 and 5, respectively. The two-dimensional molecular structures of these drugs are visualized in Figures S3 (Precision@200) and S4 (GSEA). Sucrosofate and inositol hexasulphate in this list are known to bind human fibroblast growth factor 1, which is related to tumor growth and invasion.45 For drugs selected by GSEA score, six of them are confirmed to affect phosphatidylinositol 3-kinase (PI3K) or mammalian target of rapamycin (mTOR) pathway. As PI3K/Akt/mTOR signaling is one of the most important intracellular pathways that regulate the cell cycle, it can be targeted by drugs to regulate the metabolism in cancer cells, resulting in phenotype shift, increased cell death, and decreased cell proliferation.46,47 Biguanide and its medication drug (i.e., metformin) have been shown to be effective for pancreatic cancer tumor growth inhibition.44,48,49 Note that the drugs selected by CIGER are not available in the training set of the LINCS L1000 dataset, thereby showing its real potential application in drug discovery that enables high-throughput phenotypic drug screening by utilizing the molecular structure’s information only. Also, cell-specific prediction may also provide improvement for predictions. The cell-specific ranks and similarity scores (i.e., Precision@200 and GSEA) of these drug candidates are shown in Tables S5 and S6.
Table 4.
Drug candidates selected by Precision@200
| DrugBank ID | Name | Formula | Information |
|---|---|---|---|
| DB00364 | Sucralfate | Treat and prevent the return of duodenal ulcers | |
| DB01666 | Inositol Hexasulphate | Binding to human acidic fibroblast growth factor | |
| DB14815 | Ginsenoside B2 | Extract from Panax notoginseng (Japanese ginseng), decreases the β-amyloid protein | |
| DB15532 | Madecassoside | Found in Centella asiatica (Gotu kola), anti-inflammatory, wound healing, and anti-oxidant activities | |
| DB06749 | Ginsenoside Rb1 | Abundant in Panax quinquefolius (American ginseng), protected against amyloid β-induced neurotoxicity | |
| DB14528 | Chromium gluconate | Supplement to intravenous solutions given for total parenteral nutrition | |
| DB09517 | Sodium ferric gluconate complex | Treats iron deficiency anemia | |
| DB03995 | Betadex | Pharmacologically inactive substance, useful for stabilizing, solubilizing, or delivering intermediate size molecules. | |
| DB01901 | Sucrosofate | Drug retention and drug encapsulation stability |
Table 5.
Drug candidates selected by GSEA
| DrugBank ID | Name | Formula | Information |
|---|---|---|---|
| DB00975 | Dipyridamole | Prevents the degradation of cAMP, an inhibitor of platelet function | |
| DB11896 | Gedatolisib | Targets PI3K/mTOR, in development of solid tumors and acute myeloid leukemia (AML) | |
| DB12774 | AZD-8055 | ATP-competitive mammalian target of rapamycin (mTOR) kinase inhibitor, with in vitro and in vivo antitumor activity | |
| DB08882 | Linagliptin | Dipeptidyl peptidase-4 (DPP-4) inhibitors with hypoglycemic activity | |
| DB12904 | ZSTK-474 | PI3K inhibitor | |
| DB13100 | Biguanide | mTOR inhibitor, type II diabetes mellitus treatment | |
| DB13051 | CH-5132799 | PI3K inhibitor | |
| DB11925 | Vistusertib | Inhibitor of mTOR | |
| DB11864 | Preladenant | Selective antagonist at the adenosine A2A receptor |
Experimental validation for pancreatic cancer drug candidates
To evaluate our candidates generated from our predictions, several drugs, including dipyridamole, AZD-8055, linagliptin, and preladenant, are tested in vitro together with the combination of metformin and vitamin C as a positive control. We used the above-mentioned drugs to treat pancreatic cancer cell lines and performed western blot to show the level of GATA6 and TET2, thus evaluating the effect of the predicted candidate drugs. The methods for experimental validation are described in Note S4.
As shown in Figures 4A and 4B, western blot following quantification showed that the combination of metformin and vitamin C increased TET2 and GAT6 levels in PANC-1 cells at 24 h. Dipyridamole can also significantly increase TET2 levels after 24 h treatments in PANC-1 cells, and linagliptin increased both TET2 and GATA6 levels significantly, suggesting that they can induce similar responses to metformin and vitamin C.
Figure 4.

In vitro experiments of dipyridamole, AZD-8055, linagliptin, and preladenant with the combination of metformin and vitamin C as a positive control
(A) Quantification of TET2 levels in drug treatments. Dipyridamole and linagliptin can significantly increase TET2 level after 24-h treatments.
(B) Quantifications of GATA6 expressions in drugs treatment. Linagliptin increased GATA6 expressions in PANC-1 after 24-h treatment. Data are presented as means ± SD (n = 3).
(C) Linagliptin and metformin vitamin C increased 5hmc levels in PANC-1 cells after 24-h treatment. Quantifications of 5 hmc dot blots (n = 3), data are represented as means ± SD. ∗p < 0.05, ∗∗p < 0.01, ∗∗∗p < 0.001 (unpaired two-tailed t test and one-way ANOVA).
(D) The effect of drug treatments on clonogenic survival as a measure of growth rate. All data are presented as means ± SD (n = 3). ∗∗p < 0.005, ∗∗∗∗p < 0.0001 (analyzed using one-way ANOVA)
To investigate whether the increase in TET2 and GATA6 would have an effect on 5hmc, dot blots of all drugs were performed and quantified. As shown in Figure 4C, metformin/vitamin C and linagliptin significantly increased 5hmc levels in PANC-1 genomic DNA after 24-h treatment. Representative bands of western blot are shown in Figure S3. To study the effect of treatments on the growth of PANC-1 cells, clonogenic survival of cells with metformin/vitamin C or linagliptin treatment was analyzed. As showed in Figure 4D, metformin and vitamin C treatment demonstrated a significantly lower percentage of survival compared with negative control, and linagliptin treatment caused a significantly lower survival rate compared with both the negative control and the combination of metformin and vitamin C. To understand the way linagliptin improved treatment sensitivity, we analyzed the predicted drug signature of linagliptin with paslincs50 to find the affected pathways. We found the antifolate resistance pathway at the top of the list, which is related to drug resistance in cancer treatment. The compounds we identified can be further studied in vivo, or use tools like Code-AE51 to predict their patient-specific clinical response to predict their performance in the real application.
Ablation study for CIGER
An ablation study was conducted to further investigate how CIGER surpasses the limitations of existing methods for chemical-induced gene expression prediction. In particular, we removed components from CIGER (i.e., CIGER-NA and CIGER-A) and observed the changes in its prediction performances. We also explored the impact of noisy data on prediction performance.
Learning-to-rank objective function
In this experiment, we investigated the effectiveness of learning-to-rank objective functions (i.e., ListMLE,32 ListNet,31 RankCosine,33 and RankNet28) to learn the dependencies among genes. In order to do that, we compared CIGER-NA with DeepCOP (binary cross entropy) for gene expression classification tasks. CIGER-NA is a variant of CIGER in which the attention component is removed, and the extended connectivity fingerprint (ECFP) is used instead of neural fingerprint (learned by graph convolutional network) to represent a chemical, so the main difference between CIGER-NA and DeepCOP is at the objective functions they optimize. As shown in Table 3, the overall performance of CIGER-NA was better than DeepCOP for both classification tasks. Among these objective functions, using CIGER-NA with RankCosine achieved the best improvement compared with DeepCOP. In particular, it achieved AUC scores of 0.6992 and 0.7289, which was significantly better than the AUC scores of 0.6764 and 0.6925 of DeepCOP for up-regulated and down-regulated gene classification tasks, respectively. Therefore, we used RankCosine as the ranking objective function for CIGER and its variant.
Data-driven representations for chemicals
To validate the improvement of data-driven features over pre-defined features for chemicals, we compared the performance of using ECFP (i.e., CIGER-NA) and neural fingerprint generated by graph convolutional network (i.e., CIGER-A). As shown in Table 3, using neural fingerprint achieved better performance than ECFP. In particular, CIGER-A achieved AUC scores of 0.7086 and 0.7448, which were better than 0.6992 and 0.7289 of CIGER-NA, indicating the effectiveness of the approach that automatically learns representations for chemicals from data.
Multi-head attention mechanism
We compared CIGER with its variants in this experiment to evaluate the effectiveness of the multi-head attention component for prediction performance. As shown in Table 3, by leveraging the attention mechanism to learn the dependencies among genes and chemicals, CIGER achieved the best performance compared with its variants. In particular, it outperformed CIGER-A by achieving AUC scores of 0.7202 and 0.7558 compared with 0.7086 and 0.7448 of CIGER-A for up-regulated and down-regulated gene classification tasks, respectively. CIGER-NA, without both graph convolutional network and multi-head attention components, as we expected, achieved the worst performance among its variants. All these results demonstrate the improvement of using multi-head attention for gene expression prediction.
Noisy gene expression data
To validate the impact of the noisy problem in LINCS L1000 dataset on the prediction performance of CIGER, we trained this model on the whole dataset (i.e., without removing noisy profiles which have APC scores < 0.6 among their bio-replicates) and compared it with the one trained on high-quality data only (i.e., including only profiles that have APC scores > 0.6 among their bio-replicates). The results (i.e., NDCG, Precision@K) shown in Table S4 indicate that noisy gene expression can significantly hinder the prediction performance of CIGER. In particular, its NDCG scores decreased from 0.8275 and 0.8460 to 0.7761 and 0.7966, respectively, for up-regulated and down-regulated gene ranking.
Existing limitations
Although achieving superior results compared with the baseline methods and showing feasibility in gene expression-based drug repurposing for pancreatic cancer, our proposed method still has some limitations. First, it cannot generate chemical-induced gene expression profiles with respect to the new cell lines (i.e., except 10 cell lines in the training dataset) caused by the lack of cell line representations. Second, due to the noise issue in the LINCS L1000 dataset, we could only utilize a small subset of these data for training, thereby hindering the prediction performance of our method for de novo chemicals. Third, the limited size of the LINCS L1000 dataset in terms of chemicals (i.e., ∼20,000 small molecules) inhibits CIGER from learning generalized representation for chemicals in the complex molecular space. Finding efficient cell line representation, de-noising gene expression data, and pre-training on the large molecular datasets are the keys to surpassing these limitations, and we leave them in our future works.
Conclusion
Large-scale analysis that leverages chemical-induced gene expression profiles has attracted great attention in drug discovery. However, the effectiveness of this approach is limited by the spareness and noise measurement problems. In this study, we propose CIGER, a novel and robust neural network-based model for predicting the ranking of genes in the gene expression profiles induced by de novo chemicals. Our model achieves state-of-the-art results compared with other methods for both gene expression classification and ranking tasks in a de novo chemical setting. Furthermore, with the capability of predicting the ranking of genes in the chemical-induced gene expression profiles across different cell lines leveraging the chemical structures only, CIGER provides new opportunities for subsequent molecular phenotype-based drug repurposing by comparing the ranking of genes in chemical-induced profiles with the treatment profiles computed from chemical-treated and -untreated disease states. The similar or reverse of gene expression ranking will suggest the most potential drug candidates for specific diseases. In summary, CIGER could be a powerful tool for phenotypic compound screening.
Experimental procedures
Resource availability
Lead contact
Requests for information should be directed to the lead contact, Ping Zhang (zhang.10631@osu.edu).
Materials availability
This study did not generate any new materials.
Ranking task definition
In the LINCS L1000 dataset, each experiment can be considered as a tuple of the chemical compound, cell line, and corresponding gene expression profile. These biological and chemical objects are transformed into numerical representations for use in the computational models. In particular, the L1000 dataset can be represented by the following matrices , , , and , where are feature matrices of chemicals, cell lines, and L1000 genes in the dataset, is the gene expression matrix, are numbers of experiments and L1000 genes, and are feature dimensions of chemical compound, cell line, and gene, respectively. The goal of this task is predicting the ranking of genes in the expression profile based on the feature matrices.
CIGER architecture
The CIGER architecture consists of four main components: (1) the feature-mapping component, which transforms biological and chemical objects to numerical representations, including a graph convolutional network, to transform the simplified molecular-input line-entry system (SMILES) representations of chemicals to numerical vectors and embedding lookup tables to transform cell lines and L1000 gene indexes to binary vectors, (2) the attention component, which looks at all L1000 genes and chemicals to create contextualized representation for each gene, (3) the prediction component, which predicts the ranking of all L1000 genes in gene expression, and (4) the learning-to-rank objective function, which optimizes the global prediction performance for all L1000 genes. Figure 1 presents the overview architecture of CIGER. The details of each component are as follows.
Feature mapping for biological and chemical objects
We use the graph convolutional network and gene ontology consortium to construct numerical representations for chemical compounds and L1000 genes. For cell lines, we simply use one-hot vectors.
The chemical feature matrix is generally pre-defined in traditional approaches. One popular method is the extended connectivity fingerprint (ECFP), which represents molecular sub-structures by means of circular atom neighborhoods. Specifically, the presence or absence of sub-structures is encoded in a fixed-size binary vector. The main drawback of this method is that the sub-structures need to be available before training and therefore may not be the optimized way to represent the chemicals for particular tasks. Recently, with the advancement of graph neural networks, some data-driven methods have been proposed to effectively exploit the graph-based structure of chemicals.52,53 Compared with pre-defined approaches, these methods can automatically find the most important sub-structures that are optimized representations for chemicals for the prediction tasks by optimizing the objective function from training. In our work, we use a graph convolutional network35 to exploit information from chemicals, which can be seen as graphs of atoms (nodes) and bonds (edges). This method can be seen as the differentiable variant of ECFP, in which every step is continuous and differentiable and therefore allows updates from gradient propagation. In particular, the graph convolutional network updates the representation of one particular node from the information of its neighborhoods in the graph by convolutional operation so that each node in the output layer represents the sub-structure of the original graph. Following the setting in,35 we use the 2-layer graph convolutional network (radius = 2), which means that the sub-structures represented by this method are the span of 2-hop distance from the atom. Inputs for the graph convolutional network are the feature vectors of atoms and bonds that capture their properties such as atom symbol, degree, and type of bonds. The dimension of fingerprints generated by the graph convolutional network is set to be 1,024 which is similar to ECFP for a fair comparison. The detailed implementation of the graph convolution network used for chemicals is shown in Note S2.
The Gene Ontology Consortium54 has been shown to be an effective way to represent genes and proteins by capturing their biological process, molecular function, and cellular component. In our experiments, we follow the data processing described in Woo et al.24 by selecting 1,107 gene ontology terms that appeared in at least three L1000 genes and using them to construct . These representations can be seen as binary vectors, where the indexes of bit 1 mean the appearance of gene ontology terms associated with these indexes.
Multi-head attention for contextualized representation
We utilize multi-head attention34 to capture the dependencies among genes for learning better representation. In particular, for ith experiment, chemical and cell line are concatenated with each gene in and then put into the feedforward neural network layer and ReLU activation function to generate contextualized as follows:
where are learned parameters and is a concatenation operation on . The contextualized representation for L1000 genes is packed into matrix and then put into multi-head attention to learn attention-based representation. In particular, multi-head attention transforms the input feature matrix (i.e., ) to three separate matrices as follows:
where are the trainable parameter matrices, is the dimension of transformed features, and then the attention-based representations for the input features are computed as follows:
where , σ, and d are the attention representation, softmax function, and scale factor.
Multi-output prediction for gene ranking
The 2-layer feedforward neural network with ReLU activation function is used to predict the rank of each gene in the gene expression profile. The weight of this network is shared across all L1000 genes.
Learning-to-rank objective functions
CIGER optimizes the predictions for all L1000 genes together rather than individually by using learning-to-rank objective functions. In particular, CIGER treats the gene expression profiles as the lists ranked by their z-score and then minimizes several learning-to-rank objective functions including both pairwise (i.e., RankNet28) and listwise (i.e. ListNet,31 ListMLE,32 and RankCosine33) functions between the predicted (y) and the ground-truth (z) gene expression profiles. Details of these objective functions are presented in Note S3.
Baseline methods
We compare CIGER with the following baseline models for chemical-induced gene expression ranking and classification tasks.
Logistic regression
LR is the linear model used in the gene expression classification task. We use the scikit-learn implementation55 to train this model on the LINCS L1000 dataset. Inputs for LR are the concatenations of 1,024-bit circular topological fingerprints for chemical, one-hot vector for cell line, and multi-hot vectors (i.e., 1,107-bit) that represent the inclusion of Gene Ontology terms for L1000 genes. The outputs of linear functions are put into the logistic function to model the probabilities of being (up- or down-) regulated for L1000 genes induced by chemicals.
DeepCOP
DeepCOP is the neural network-based model for gene expression classification task.24 We re-implement this model in PyTorch framework56 and use the same hyper-parameters as in the original paper. This model consists of three layers with SeLU activation function for the first layer and ReLU activation function for the following layers. Inputs for DeepCOP are similar to those of LR, and the objective function is binary cross-entropy between the ground-truth and predicted labels.
Tensor-train weight optimization
40The tensor completion-based model is used to impute missing values in high-dimensional (tensor) data from existing values. It has shown good performance when applied to predict z-score values of the LINCS L1000 dataset. This method leverages existing labels (z-score) only to make predictions, so additional feature information such as chemicals, cell lines, and genes are not required. We use the MATLAB implementation provided by the authors to train this model in our de novo chemical setting.
CIGER-A
CIGER-A is the variant of our proposed model that makes predictions without the attention mechanism.
CIGER-NA
CIGER-NA is the variant of our proposed model that does not use either neural fingerprint or attention mechanism.
Evaluation metrics
To evaluate the performance of prediction models on the testing sets, the area under the receiver operating characteristic (AUC) is chosen for classification tasks, and NDCG and Precision@K are used for ranking tasks. The details of NDCG and Precision@K are as follows.
Normalized discounted cumulative Gain)
NDCG is the metric used to evaluate the performance of models in ranking tasks. This metric focuses on two aspects of the ranking models: (1) giving higher ranks for higher relevant items and (2) highly relevant items being ranked higher than marginally relevant items and, in turn, having higher ranks than non-relevant items. In particular, NDCG at rank p is calculated as follows:
where discounted cumulative gain (DCGp) and ideal discounted cumulative gain (IDCGp), which is the maximum possible values of DCGp, are computed as follows:
where is the relevant score of the result at position i, and is the sorted list of relevant items up to position p. In our setting, the relevant scores are z-score (minus z-score in the case of ranking down-regulated genes) values in the gene expression profiles. Because negative scores cause NDCG to be unbounded, so for up-regulated and down-regulated gene rankings we set all negative relevant s to be 0. Precision@K is another metric we used to evaluate the performance of models in ranking tasks. It is the proportion of genes in the top-K predicted set that is up-regulated or down-regulated. In particular, Precision@K is computed as follows:
where is the set of up-regulated or down-regulated genes (i.e., we select the top 200 genes that have the largest and smallest z-scores as the sets of the ground-truth up-regulated and down-regulated genes, respectively) and is the sets of top-K genes in the predicted ranked lists. In our study, we evaluate the performances of models at different K-levels including 10, 50, 100, and 200.
Drug repurposing pipeline
Drug gene expression profile
To generate drug profiles used in the drug screening process, we sent queries to the DrugBank database to retrieve the list of all existing drugs (i.e., 11,179 drugs) with their corresponding SMILES representations and then used CIGER trained on the LINCS L1000 dataset to generate gene expression profiles (i.e., gene ranking) for these drugs from their SMILES representations. In our study, each drug is represented by 10 cell-specific gene expression profiles. Note that under the cross-validation setting, each profile is the average of the corresponding profiles generated from different models trained on different data folds. In summary, this process results in a ranking matrix of 11,179 rows (drugs) and 10 columns (cell lines).
Treatment gene expression profile
For pancreatic the cancer treatment gene expression profile, we performed differential expression analysis between metformin- and vitamin C-treated samples and mock-treated samples with DESeq2.41 A recent study showed that metformin and vitamin C treatment could restore TET2 activity in an aggressive squamous-like pancreatic ductal adenocarcinoma sub-type, and increase biomarkers of classical pancreatic tumors, which are related to improved therapeutic responses and survival.44 To search for drugs that can restore epigenetic control in pancreatic tumors, like metformin and vitamin C, we used pancreatic cancer gene expression data from this study, where the human pancreatic tumor cell line PSN1, orthotopically implanted into mice, was treated with metformin combined with vitamin C or mock treatment. RNA-seq gene expression data are filtered to get human-only reads. In total, three metformin/vitamin C-treated samples and three mock-treated control samples were used for differential expression analysis. Those up/down-regulated genes can be used as signatures that characterize the treatment (i.e., the differential expression analysis is from mock-treated samples to treated samples).
Screening method
A screening process was conducted by comparing drug profiles with treatment profiles in terms of gene ranking. Specifically, Precision@200 and GSEA scores wee used to find drugs whose profiles were most similar to the treatment profiles with respect to each cell line. The reason is that we wanted to find drugs that induce similar responses in pancreatic cancer as metformin/vitamin C treatment, which has been shown to be effective in restoring epigenetic control in pancreatic cancer cells and improving therapeutic responses. Then, for each cell line, the top 10 most similar drug candidates were retrieved for further analysis. Previous studies showed that consensus gene expression profiles could give a more comprehensive representation and improve confidence in gene-expression analysis, so we used results from all 10 cell lines to determine drug candidates. In particular, we selected drugs that are in the top 10 of at least three cell lines for Precision@200 and two2 cell lines for GSEA as our potential treatments for pancreatic cancer.
Acknowledgments
This work was supported by the National Institute of General Medical Sciences (NIGMS) of NIH (R01GM141279 [P.Z.], R01GM122845 [L.X.]) and the National Institute on Aging (NIA) of NIH (R01AD057555 [L.X.]). E.O. was supported by Kidani Memorial Trust. E.O. is the Chief Scientific Officer of EpiCombi.AI Therapeutics.
Author contributions
Conceptualization, P.Z. and L.X.; Resources, Y.Q., J.L., S.Z., and E.O.; Methodology, T.H.P., L.X., and P.Z.; Investigation, T.H.P., Y.Q., L.X., and P.Z.; Formal Analysis, T.H.P., Y.Q., L.X., and P.Z.; Writing – Original Draft, T.H.P., L.X., and P.Z.; Writing – Review & Editing, T.H.P., Y.Q., J.L., S.Z., E.O., L.X., and P.Z.; Supervision, P.Z.
Declaration of interests
The authors declare no competing interests.
Inclusion and diversity
We worked to ensure diversity in experimental samples through the selection of the cell lines. We worked to ensure diversity in experimental samples through the selection of the genomic datasets. While citing references scientifically relevant for this work, we also actively worked to promote gender balance in our reference list. The author list of this paper includes contributors from the locations where the research was conducted who participated in the data collection, design, analysis, and/or interpretation of the work.
Published: February 4, 2022
Footnotes
Supplemental information can be found online at https://doi.org/10.1016/j.patter.2022.100441.
Supplemental information
Data and code availability
The Bayesian-based peak deconvolution LINCS L1000 dataset is available at https://github.com/njpipeorgan/L1000-bayesian. The pre-processed gene expression data used in our study and gene expression profiles generated from CIGER for all drugs in DrugBank are available at https://github.com/pth1993/CIGER. CIGER source code and its usage instructions are available in Github (https://github.com/pth1993/CIGER).
References
- 1.Terstappen G.C., Schlüpen C., Raggiaschi R., Gaviraghi G. Target deconvolution strategies in drug discovery. Nat. Rev. Drug Discov. 2007;6:891–903. doi: 10.1038/nrd2410. [DOI] [PubMed] [Google Scholar]
- 2.Lamb J., Crawford E.D., Peck D., Modell J.W., Blat I.C., Wrobel M.J., Lerner J., Brunet J.-P., Subramanian A., Ross K.N., et al. The Connectivity Map: using gene-expression signatures to connect small molecules, genes, and disease. Science. 2006;313:1929–1935. doi: 10.1126/science.1132939. [DOI] [PubMed] [Google Scholar]
- 3.Hu G., Agarwal P. Human disease-drug network based on genomic expression profiles. PLoS One. 2009;4:e6536. doi: 10.1371/journal.pone.0006536. [DOI] [PMC free article] [PubMed] [Google Scholar]
- 4.Dudley J.T., Deshpande T., Butte A.J. Exploiting drug–disease relationships for computational drug repositioning. Brief. Bioinform. 2011;12:303–311. doi: 10.1093/bib/bbr013. [DOI] [PMC free article] [PubMed] [Google Scholar]
- 5.Kosaka T., Nagamatsu G., Saito S., Oya M., Suda T., Horimoto K. Identification of drug candidate against prostate cancer from the aspect of somatic cell reprogramming. Cancer Sci. 2013;104:1017–1026. doi: 10.1111/cas.12183. [DOI] [PMC free article] [PubMed] [Google Scholar]
- 6.Wei G., Twomey D., Lamb J., Schlis K., Agarwal J., Stam R.W., Opferman J.T., Sallan S.E., den Boer M.L., Pieters R., et al. Gene expression-based chemical genomics identifies rapamycin as a modulator of MCL1 and glucocorticoid resistance. Cancer Cell. 2006;10:331–342. doi: 10.1016/j.ccr.2006.09.006. [DOI] [PubMed] [Google Scholar]
- 7.Hassane D.C., Guzman M.L., Corbett C., Li X., Abboud R., Young F., Liesveld J.L., Carroll M., Jordan C.T. Discovery of agents that eradicate leukemia stem cells using an in silico screen of public gene expression data. Blood. 2008;111:5654–5662. doi: 10.1182/blood-2007-11-126003. [DOI] [PMC free article] [PubMed] [Google Scholar]
- 8.Stegmaier K., Ross K.N., Colavito S.A., O’Malley S., Stockwell B.R., Golub T.R. Gene expression–based high-throughput screening (GE-HTS) and application to leukemia differentiation. Nat. Genet. 2004;36:257–263. doi: 10.1038/ng1305. [DOI] [PubMed] [Google Scholar]
- 9.Lamb J. The Connectivity Map: a new tool for biomedical research. Nat. Rev. Cancer. 2007;7:54–60. doi: 10.1038/nrc2044. [DOI] [PubMed] [Google Scholar]
- 10.Chong C.R., Sullivan D.J. New uses for old drugs. Nature. 2007;448:645–646. doi: 10.1038/448645a. [DOI] [PubMed] [Google Scholar]
- 11.Novac N. Challenges and opportunities of drug repositioning. Trends Pharmacol. Sci. 2013;34:267–272. doi: 10.1016/j.tips.2013.03.004. [DOI] [PubMed] [Google Scholar]
- 12.Subramanian A., Narayan R., Corsello S.M., Peck D.D., Natoli T.E., Lu X., Gould J., Davis J.F., Tubelli A.A., Asiedu J.K., et al. A next generation connectivity map: L1000 platform and the first 1,000,000 profiles. Cell. 2017;171:1437–1452. doi: 10.1016/j.cell.2017.10.049. [DOI] [PMC free article] [PubMed] [Google Scholar]
- 13.Hodos R., Zhang P., Lee H.-C., Duan Q., Wang Z., Clark N.R., Ma’ayan A., Wang F., Kidd B., Hu J., et al. volume 23. World Scientific; 2018. Cell-specific prediction and application of drug-induced gene expression profiles; pp. 32–43. (Pacific Symposium on Biocomputing). [PMC free article] [PubMed] [Google Scholar]
- 14.Yue X., Wang Z., Huang J., Parthasarathy S., Moosavinasab S., Huang Y., Lin S.M., Zhang W., Zhang P., Sun H. Graph embedding on biomedical networks: methods, applications and evaluations. Bioinformatics. 2020;36:1241–1251. doi: 10.1093/bioinformatics/btz718. [DOI] [PMC free article] [PubMed] [Google Scholar]
- 15.Troyanskaya O., Cantor M., Sherlock G., Brown P., Hastie T., Tibshirani R., Botstein D., Altman R.B. Missing value estimation methods for DNA microarrays. Bioinformatics. 2001;17:520–525. doi: 10.1093/bioinformatics/17.6.520. [DOI] [PubMed] [Google Scholar]
- 16.Bø T.H., Dysvik B., Jonassen I. LSimpute: accurate estimation of missing values in microarray data with least squares methods. Nucleic Acids Res. 2004;32:e34. doi: 10.1093/nar/gnh026. [DOI] [PMC free article] [PubMed] [Google Scholar]
- 17.Kim H., Golub G.H., Park H. Missing value estimation for DNA microarray gene expression data: local least squares imputation. Bioinformatics. 2005;21:187–198. doi: 10.1093/bioinformatics/bth499. [DOI] [PubMed] [Google Scholar]
- 18.Cai Z., Heydari M., Lin G. Iterated local least squares microarray missing value imputation. J. Bioinform. Comput. Biol. 2006;4:935–957. doi: 10.1142/s0219720006002302. [DOI] [PubMed] [Google Scholar]
- 19.Oba S., Sato M.-A., Takemasa I., Monden M., Matsubara K.-I., Ishii S. A Bayesian missing value estimation method for gene expression profile data. Bioinformatics. 2003;19:2088–2096. doi: 10.1093/bioinformatics/btg287. [DOI] [PubMed] [Google Scholar]
- 20.Wang X., Li A., Jiang Z., Feng H. Missing value estimation for DNA microarray gene expression data by Support Vector Regression imputation and orthogonal coding scheme. BMC Bioinformatics. 2006;7:32. doi: 10.1186/1471-2105-7-32. [DOI] [PMC free article] [PubMed] [Google Scholar]
- 21.Ouyang M., Welsh W.J., Georgopoulos P. Gaussian mixture clustering and imputation of microarray data. Bioinformatics. 2004;20:917–923. doi: 10.1093/bioinformatics/bth007. [DOI] [PubMed] [Google Scholar]
- 22.Lagunin A., Ivanov S., Rudik A., Filimonov D., Poroikov V. DIGEP-Pred: web service for in silico prediction of drug-induced gene expression profiles based on structural formula. Bioinformatics. 2013;29:2062–2063. doi: 10.1093/bioinformatics/btt322. [DOI] [PubMed] [Google Scholar]
- 23.Iwata M., Sawada R., Iwata H., Kotera M., Yamanishi Y. Elucidating the modes of action for bioactive compounds in a cell-specific manner by large-scale chemically-induced transcriptomics. Sci. Rep. 2017;7:40164. doi: 10.1038/srep40164. [DOI] [PMC free article] [PubMed] [Google Scholar]
- 24.Woo G., Fernandez M., Hsing M., Lack N.A., Cavga A.D., Cherkasov A. DeepCOP: deep learning-based approach to predict gene regulating effects of small molecules. Bioinformatics. 2020;36:813–818. doi: 10.1093/bioinformatics/btz645. [DOI] [PubMed] [Google Scholar]
- 25.Bourdakou M.M., Athanasiadis E.I., Spyrou G.M. Discovering gene re-ranking efficiency and conserved gene–gene relationships derived from gene co-expression network analysis on breast cancer data. Sci. Rep. 2016;6:1–29. doi: 10.1038/srep20518. [DOI] [PMC free article] [PubMed] [Google Scholar]
- 26.Rendle S., Freudenthaler C., Gantner Z., Schmidt-Thieme L. Proceedings of the Twenty-Fifth Conference on Uncertainty in Artificial Intelligence. 2009. BPR: Bayesian Personalized ranking from implicit feedback; pp. 452–461. [Google Scholar]
- 27.Wang Y., Sun H., Zhang R. International Conference on Web-Age Information Management. Springer; 2014. AdaMF: adaptive boosting matrix factorization for recommender system; pp. 43–54. [Google Scholar]
- 28.Burges C., Shaked T., Renshaw E., Lazier A., Deeds M., Hamilton N., Hullender G. Proceedings of the 22nd International Conference on Machine Learning. 2005. Learning to rank using gradient descent; pp. 89–96. [Google Scholar]
- 29.Freund Y., Iyer R., Schapire R.E., Singer Y. An efficient boosting algorithm for combining preferences. J. Mach. Learn. Res. 2003;4:933–969. [Google Scholar]
- 30.Cao Y., Xu J., Liu T.-Y., Li H., Huang Y., Hon H.-W. Proceedings of the 29th Annual International ACM SIGIR Conference on Research and Development in Information Retrieval. 2006. Adapting ranking SVM to document retrieval; pp. 186–193. [Google Scholar]
- 31.Cao Z., Qin T., Liu T.-Y., Tsai M.-F., Li H. Proceedings of the 24th International Conference on Machine Learning. 2007. Learning to rank: from pairwise approach to listwise approach; pp. 129–136. [Google Scholar]
- 32.Xia F., Liu T.-Y., Wang J., Zhang W., Li H. Proceedings of the 25th International Conference on Machine Learning. 2008. Listwise approach to learning to rank: theory and algorithm; pp. 1192–1199. [Google Scholar]
- 33.Qin T., Zhang X.-D., Tsai M.-F., Wang D.-S., Liu T.-Y., Li H. Query-level loss functions for information retrieval. Inf. Process. Manag. 2008;44:838–855. [Google Scholar]
- 34.Vaswani A., Shazeer N., Parmar N., Uszkoreit J., Jones L., Gomez A.N., Kaiser Ł., Polosukhin I. Advances in Neural Information Processing Systems. 2017. Attention is all you need; pp. 5998–6008. [Google Scholar]
- 35.Duvenaud D.K., Maclaurin D., Iparraguirre J., Bombarell R., Hirzel T., Aspuru-Guzik A., Adams R.P. Advances in Neural Information Processing Systems. 2015. Convolutional networks on graphs for learning molecular fingerprints; pp. 2224–2232. [Google Scholar]
- 36.Liu C., Su J., Yang F., Wei K., Ma J., Zhou X. Compound signature detection on LINCS L1000 big data. Mol. BioSyst. 2015;11:714–722. doi: 10.1039/c4mb00677a. [DOI] [PMC free article] [PubMed] [Google Scholar]
- 37.Li Z., Li J., Yu P. l1kdeconv: an R package for peak calling analysis with LINCS L1000 data. BMC Bioinformatics. 2017;18:356. doi: 10.1186/s12859-017-1767-9. [DOI] [PMC free article] [PubMed] [Google Scholar]
- 38.Duan Q., Reid S.P., Clark N.R., Wang Z., Fernandez N.F., Rouillard A.D., Readhead B., Tritsch S.R., Hodos R., Hafner M., et al. L1000CDS 2: LINCS L1000 characteristic direction signatures search engine. NPJ Syst. Biol. Appl. 2016;2:1–12. doi: 10.1038/npjsba.2016.15. [DOI] [PMC free article] [PubMed] [Google Scholar]
- 39.Qiu Y., Lu T., Lim H., Xie L. A Bayesian approach to accurate and robust signature detection on LINCS L1000 data. Bioinformatics. 2020;36:2787–2795. doi: 10.1093/bioinformatics/btaa064. [DOI] [PMC free article] [PubMed] [Google Scholar]
- 40.Iwata M., Yuan L., Zhao Q., Tabei Y., Berenger F., Sawada R., Akiyoshi S., Hamano M., Yamanishi Y. Predicting drug-induced transcriptome responses of a wide range of human cell lines by a novel tensor-train decomposition algorithm. Bioinformatics. 2019;35:i191–i199. doi: 10.1093/bioinformatics/btz313. [DOI] [PMC free article] [PubMed] [Google Scholar]
- 41.Love M.I., Huber W., Anders S. Moderated estimation of fold change and dispersion for RNA-seq data with DESeq2. Genome Biol. 2014;15:550. doi: 10.1186/s13059-014-0550-8. [DOI] [PMC free article] [PubMed] [Google Scholar]
- 42.Fujii A., Masuda T., Iwata M., Tobo T., Wakiyama H., Koike K., Kosai K., Nakano T., Kuramitsu S., Kitagawa A., et al. The novel driver gene ASAP2 is a potential druggable target in pancreatic cancer. Cancer Sci. 2021;112:1655. doi: 10.1111/cas.14858. [DOI] [PMC free article] [PubMed] [Google Scholar]
- 43.Kim I., Choi Y.-S., Song J.H., Choi E.A., Park S., Lee E.J., Rhee J.-K., Kim S.C., Chang S. A drug-repositioning screen for primary pancreatic ductal adenocarcinoma cells identifies 6-thioguanine as an effective therapeutic agent for TPMT-low cancer cells. Mol. Oncol. 2018;12:1526–1539. doi: 10.1002/1878-0261.12364. [DOI] [PMC free article] [PubMed] [Google Scholar]
- 44.Eyres M., Lanfredini S., Xu H., Burns A., Blake A., Willenbrock F., Goldin R., Hughes D., Hughes S., Thapa A., et al. TET2 drives 5hmc marking of GATA6 and epigenetically defines pancreatic ductal adenocarcinoma transcriptional subtypes. Gastroenterology. 2021;161:653–668.e16. doi: 10.1053/j.gastro.2021.04.044. [DOI] [PubMed] [Google Scholar]
- 45.Bai Y.-P., Shang K., Chen H., Ding F., Wang Z., Liang C., Xu Y., Sun M.-H., LI Y.-Y. FGF-1/-3/FGFR 4 signaling in cancer-associated fibroblasts promotes tumor progression in colon cancer through Erk and MMP-7. Cancer Sci. 2015;106:1278–1287. doi: 10.1111/cas.12745. [DOI] [PMC free article] [PubMed] [Google Scholar]
- 46.Xie Y., Jin Y., Merenick B.L., Ding M., Fetalvero K.M., Wagner R.J., Mai A., Gleim S., Tucker D.F., Birnbaum M.J., et al. Phosphorylation of GATA-6 is required for vascular smooth muscle cell differentiation after mTORC1 inhibition. Sci. Signal. 2015;8:ra44. doi: 10.1126/scisignal.2005482. [DOI] [PMC free article] [PubMed] [Google Scholar]
- 47.Liu R., Leslie K.L., Martin K.A. Epigenetic regulation of smooth muscle cell plasticity. Biochim. Biophys. Acta (BBA)-Gene Regul. Mech. 2015;1849:448–453. doi: 10.1016/j.bbagrm.2014.06.004. [DOI] [PMC free article] [PubMed] [Google Scholar]
- 48.Li X., Li T., Liu Z., Gou S., Wang C. The effect of metformin on survival of patients with pancreatic cancer: a meta-analysis. Sci. Rep. 2017;7:1–8. doi: 10.1038/s41598-017-06207-x. [DOI] [PMC free article] [PubMed] [Google Scholar]
- 49.Hébert A., Parisotto M., Rowell M.-C., Doré A., Ruiz A.F., Lefrancois G., Kalegari P., Ferbeyre G., Schmitzer A.R. Phenylethynylbenzyl-modified biguanides inhibit pancreatic cancer tumor growth. Sci. Rep. 2021;11:1–11. doi: 10.1038/s41598-021-87993-3. [DOI] [PMC free article] [PubMed] [Google Scholar]
- 50.Ren Y., Sivaganesan S., Clark N.A., Zhang L., Biesiada J., Niu W., Plas D.R., Medvedovic M. Predicting mechanism of action of cellular perturbations with pathway activity signatures. Bioinformatics. 2020;36:4781–4788. doi: 10.1093/bioinformatics/btaa590. [DOI] [PMC free article] [PubMed] [Google Scholar]
- 51.He D., Liu Q., Xie L. Robust prediction of patient-specific clinical response to unseen drugs from in vitro screens using context-aware deconfounding autoencoder. bioRxiv. 2021 doi: 10.1101/2021.05.20.445055. [DOI] [Google Scholar]
- 52.Gilmer J., Schoenholz S.S., Riley P.F., Vinyals O., Dahl G.E. Proceedings of the 34th International Conference on Machine Learning. PMLR; 2017. Neural message passing for quantum chemistry; pp. 1263–1272. [Google Scholar]
- 53.Yang K., Swanson K., Jin W., Coley C., Eiden P., Gao H., Guzman-Perez A., Hopper T., Kelley B., Mathea M., et al. Analyzing learned molecular representations for property prediction. J. Chem. Inf. Model. 2019;59:3370–3388. doi: 10.1021/acs.jcim.9b00237. [DOI] [PMC free article] [PubMed] [Google Scholar]
- 54.Ashburner M., Ball C.A., Blake J.A., Botstein D., Butler H., Cherry J.M., Davis A.P., Dolinski K., Dwight S.S., Eppig J.T., et al. Gene ontology: tool for the unification of biology. Nat. Genet. 2000;25:25–29. doi: 10.1038/75556. [DOI] [PMC free article] [PubMed] [Google Scholar]
- 55.Pedregosa F., Varoquaux G., Gramfort A., Michel V., Thirion B., Grisel O., Blondel M., Prettenhofer P., Weiss R., Dubourg V., et al. Scikit-learn: machine learning in Python. J. Mach. Learn. Res. 2011;12:2825–2830. [Google Scholar]
- 56.Paszke A., Gross S., Chintala S., Chanan G., Yang E., DeVito Z., Lin Z., Desmaison A., Antiga L., Lerer A. Proceedings of the 2017 Neural Information Processing Systems Workshop Autodiff. 2017. Automatic differentiation in pytorch. [Google Scholar]
Associated Data
This section collects any data citations, data availability statements, or supplementary materials included in this article.
Supplementary Materials
Data Availability Statement
The Bayesian-based peak deconvolution LINCS L1000 dataset is available at https://github.com/njpipeorgan/L1000-bayesian. The pre-processed gene expression data used in our study and gene expression profiles generated from CIGER for all drugs in DrugBank are available at https://github.com/pth1993/CIGER. CIGER source code and its usage instructions are available in Github (https://github.com/pth1993/CIGER).