Abstract
DNA damage shuts down genome-wide transcription to prevent transcriptional mutagenesis and initiate repair signaling, but the mechanism to stall elongating RNA polymerase (Pol) II is not fully understood. Central to the DNA damage response, the Poly(ADP-ribose) polymerase 1 (PARP1) initiates DNA repair by translocating to the lesions, where it catalyzes protein poly(ADP-ribosylation). Here, we report that PARP1 inhibits Pol II elongation through inactivating the transcription elongation factor P-TEFb, a CDK9-cyclin T1 (CycT1) heterodimer. Upon sensing damage, the activated PARP1 binds to transcriptionally engaged P-TEFb and modifies CycT1 at multiple positions, including histidines that are rarely used as an acceptor site. This prevents CycT1 from undergoing liquid-liquid phase separation that is required for CDK9 to hyperphosphorylate Pol II and stimulate elongation. Functionally, poly(ADP-ribosylation) of CycT1 promotes DNA repair and cell survival. Thus, the PARP1-P-TEFb signaling plays a protective role in transcription quality control and genomic stability maintenance upon DNA damage.
Introduction
Transcriptional control at the level of RNA polymerase (Pol) II pausing and release is instrumental for the proper expression of numerous genes in metazoans1, 2. The paused Pol II near the promoter-proximal region is stimulated by the positive transcription elongation factor b (P-TEFb), a cyclin-dependent protein kinase complex composed of CDK9 and cyclin(Cyc) T1, to transit into the processive elongation phase2. During this process, CDK9 phosphorylates the negative elongation factors NELF and DSIF, as well as the C-terminal domain (CTD) of Pol II, all of which contribute to productive elongation3. As such, P-TEFb is recognized as the master regulator that controls global transcriptional elongation2.
Recent studies have uncovered a key role of biomolecular condensation in enabling compartmentalized biochemical reactions in vivo4, 5. Most of the nuclear regulatory processes are believed to be orchestrated within these membrane-less condensates in a highly efficient yet strictly organized manner6–11. We showed previously that the intrinsically disordered region (IDR) of CycT1 forms phase-separated condensates to promote efficient hyperphosphorylation of the CTD by CDK9 and robust transcriptional elongation12. However, the mechanisms governing the formation and dissolution of the P-TEFb condensates have not been elucidated.
The human genome faces constant genotoxic insults that cause DNA damage and genomic instability13. Cells respond to DNA damage by rapidly silencing transcription to maintain the fidelity of DNA and RNA synthesis and genome integrity14. While the UV-induced bulky DNA adducts may directly impede the translocation of Pol II and induce the transcription-coupled nucleotide excision repair (TC-NER) pathway15, other types of DNA damage, such as non-bulky base lesions and strand breaks, can potentially be overlooked by Pol II and thus requires sophisticated signaling to halt transcription16, 17. Recent studies have revealed multiple mechanisms that contribute to strand break-induced transcriptional repression18–24. However, the initial signaling event that pauses elongating Pol II remains obscure.
The DNA damage response (DDR) is a complex defense mechanism for maintaining genome stability25. A plethora of signaling and effector molecules act in concert to rapidly detect and repair lesions. Among them, PARP1, the founding member of the PARP family, is key for repairing DNA base lesions and strand breaks25. Upon sensing DNA damage, PARP1 becomes activated and catalyzes the NAD+-dependent polymerization of the ADP-ribose units, resulting in the attachment of the PAR polymers onto substrates25, 26. The primary acceptor of PAR is PARP1 itself, and this auto-PARylation event creates a scaffold to recruit many downstream DDR factors to damaged loci27, 28. Once this is accomplished, PAR can be rapidly degraded by PAR glycohydrolase (PARG)29, enabling a new round of signaling and repair. Because of the fast dynamics and lability of PAR, a full repertoire of the interacting partners and substrates of the PARylated PARP1 (PAR-PARP1) is yet to be identified.
In this study, we have identified CycT1 as a binding partner and substrate of PAR-PARP1. CycT1 is modified on multiple positions, including histidines that are rarely used as an acceptor site, in and around the histidine-rich domain (HRD). Our results show that the PARP1-mediated CycT1 PARylation inhibits Pol II elongation and induces global transcriptional shutdown in response to DNA damage. This is accomplished through the PARylation-dependent suppression of CycT1 phase separation and hyperphosphorylation of Pol II CTD by P-TEFb. Together, these results have revealed a key role of the PARP1-P-TEFb axis in transcription quality control that is crucial for DNA damage repair and cell survival under genotoxic stress.
Results
P-TEFb associates with PAR-PARP1
To investigate the functional outcome of PARP1 activation, we performed a pull-down assay coupled with comparative mass spectrometry (MS) analysis to identify proteins that are specifically associated with PAR-PARP1. The Strep-tagged and immobilized unmodified and auto-PARylated PAR-PARP1 were separately incubated with HeLa nuclear extracts (NE) to capture associated proteins for MS analysis (Fig. 1a), which identified 875 proteins in the pull-downs (PDs). Among them, 103 and 406 proteins were only associated with unmodified- and PAR-PARP1, respectively, and 366 bound to both (Fig. 1b and Table S1). Gene ontology analysis indicates that the proteins preferentially associated with PAR-PARP1 (Fig. 1c) are mostly related to RNA processing, transcription and DNA repair processes (Fig. 1d). Notably, the P-TEFb subunits CDK9 and CycT1 were among the most significantly enriched proteins in the PAR-PARP1 interactome (Fig. 1e), a conclusion that was confirmed by Western blot analysis (Fig. 1f). Given P-TEFb’s pivotal role in regulating Pol II elongation, we decided to explore the functional connection between PARP1 and P-TEFb following DNA damage.
Figure 1. P-TEFb interacts with activated PARP1 upon DNA damage.
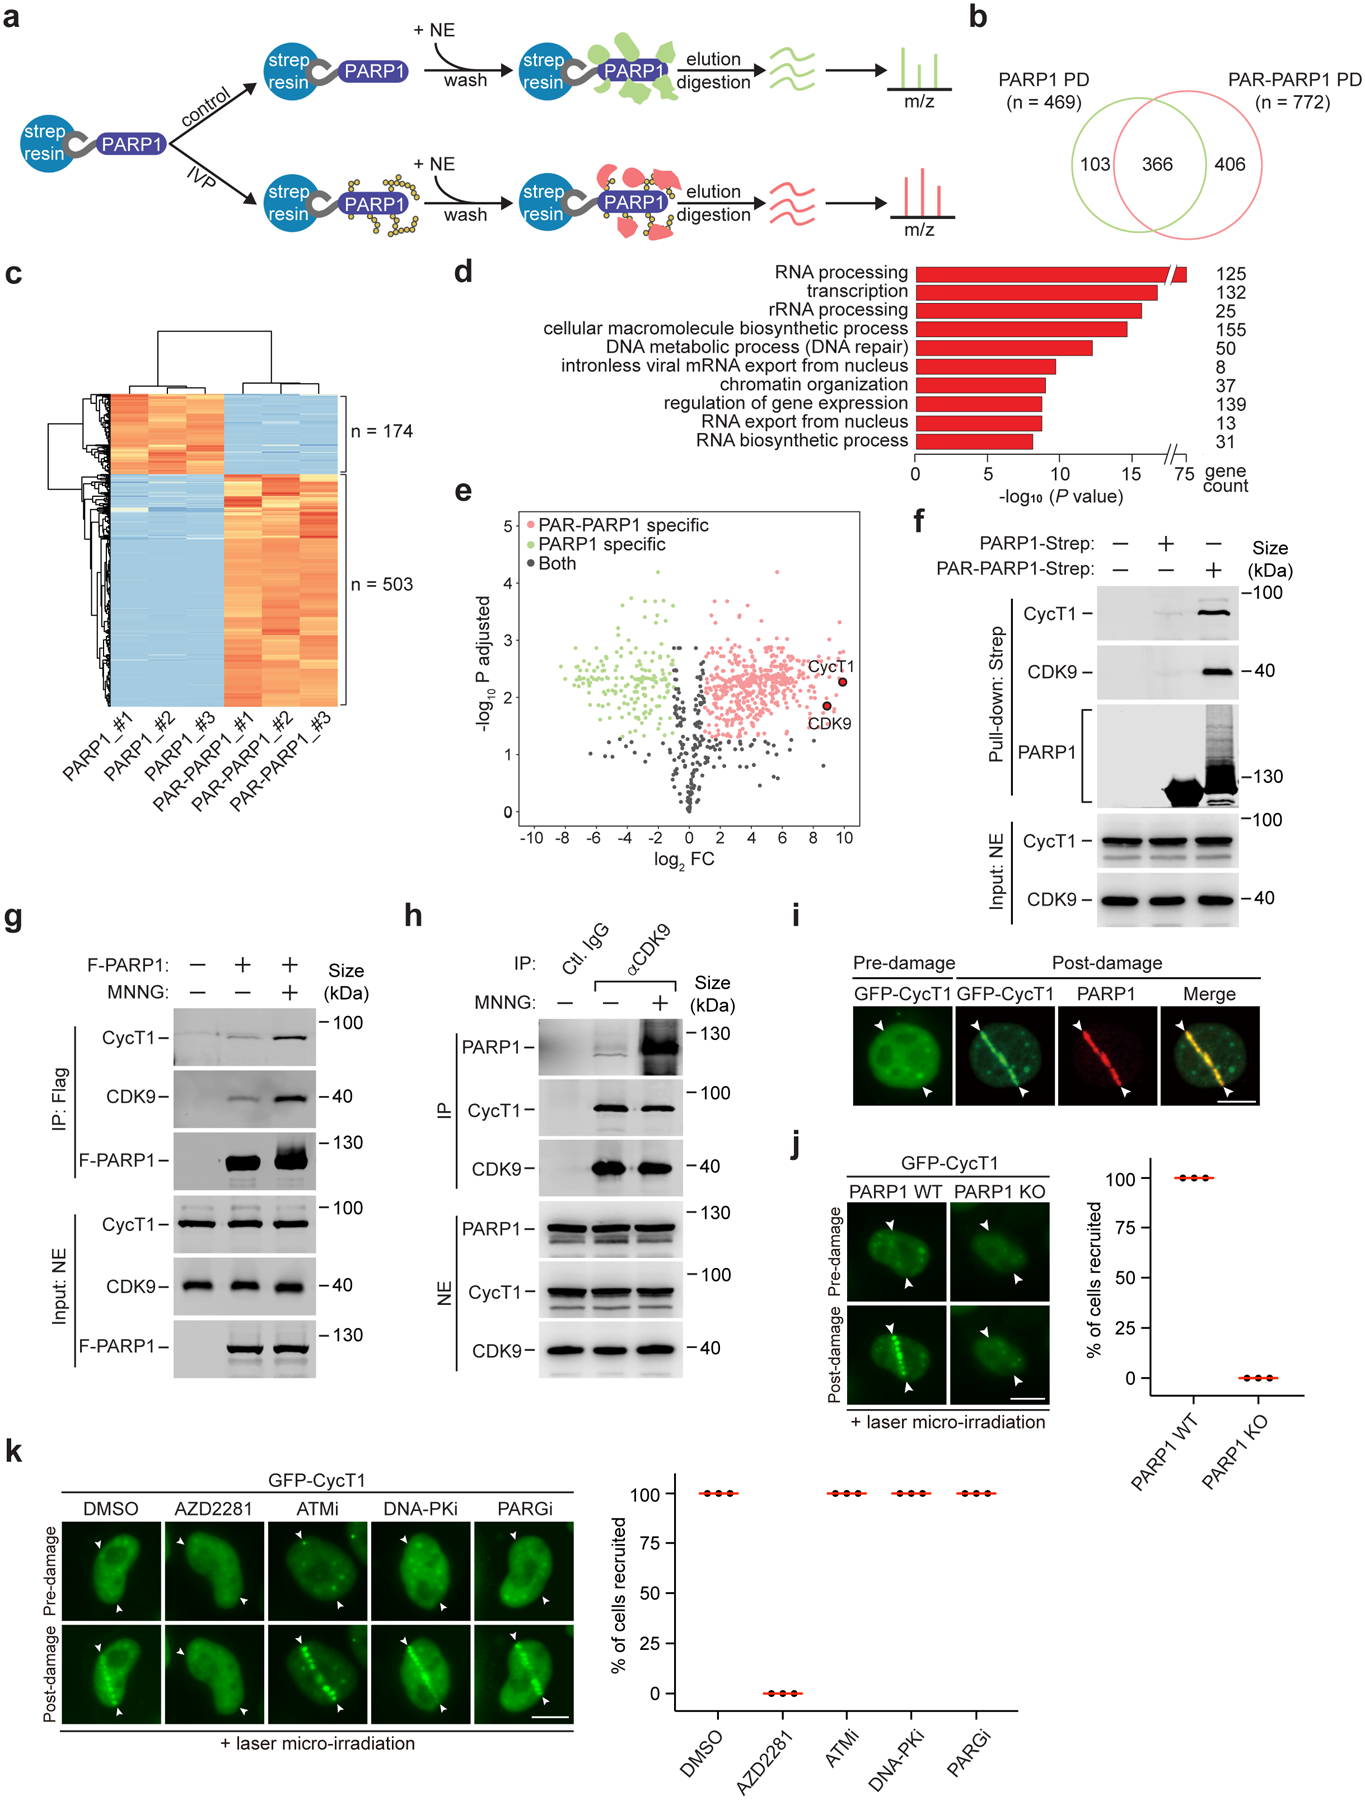
a, Experimental design of comparative mass spectrometry analysis of the PARP1 and PAR-PARP1 interactomes obtained by pull downs. IVP: In vitro PARylation. NE: Nuclear extracts. m/z: Mass-to-charge ratio. b, Venn diagram depicting the number of proteins identified by mass spectrometry from the PARP1 or PAR-PARP1 pull-down (PD). c, Heat map analysis depicting label-free quantifications of the number of proteins bound to PARP1 or PAR-PARP1 with at least 2-fold changes. The binding assays were performed in triplicates as indicated by #1–3. d, Gene ontology analysis of the MS-identified proteins that specifically interacted with PAR-PARP1. Statistical analysis was performed using the Benjamini-Hochberg procedure. e, Volcano plot analysis to visualize the identified proteins after label-free quantification. The x-axis is the log2 fold change of protein abundance in the PAR-PARP1 PD over the PARP1 PD. Red, green, and black dots indicate the proteins bound to PAR-PARP1, PARP1 and both, respectively. Dots for CDK9 and CycT1 are highlighted. f, Immobilized PARP1-Strep or PAR-PARP1-Strep was incubated with NE. The input and pull-down proteins were analyzed by Western blotting (WB). g, HeLa cells expressing F-PARP1 or not (−) were either untreated or treated with MNNG. NE and anti-Flag immunoprecipitates (IP) were analyzed by WB. h, HeLa cells were untreated or treated with MNNG. NE and IP with the indicated antibodies were analyzed by WB. i, HeLa cells expressing GFP-CycT1 were subjected to laser microirradiation and analyzed by immunofluorescence staining with antibody against PARP1. The entry and exit points of the laser beam are indicated by arrowheads. j, WT or PARP1 KO HeLa cells expressing GFP-CycT1 were subjected to laser irradiation and then imaged by live-cell microscopy. Right: Quantification of % cells showing the GFP-CycT1 recruitment. k, HeLa cells expressing GFP-CycT1 were treated with the indicated inhibitors and analyzed as in j. Experiment in i was repeated twice, yielding similar results. i-k, Scale bar = 10 μM. j, k, data are presented as mean ± s.d. with n = 3 independent experiments. All Western blots are representative of three independent experiments. Gel source data are available online.
DNA damage increases PARP1-P-TEFb interaction
To confirm the P-TEFb-PARP1 interaction in vivo, we first performed co-immunoprecipitation (co-IP) analysis and observed that the interaction increased drastically in cells treated with methylnitronitrosoguanidine (MNNG), a potent DNA-alkylating agent that activates PARP130, 31 (Fig. 1g, h). Since PARP1 is activated upon sensing DNA damage, we investigated whether P-TEFb is recruited to DNA lesions. Cells expressing GFP-CycT1 were subjected to laser microirradiation to generate a mixture of DNA damage including base lesions and strand breaks32. Live-cell imaging revealed that GFP-CycT1 was rapidly recruited to the damage sites, where it co-localized with PARP1 (Fig. 1i and Extended Data Fig. 1a). Importantly, the recruitment was completely abolished in the PARP1 knockout (KO) cells (Fig. 1j), suggesting PARP1’s critical role in recruiting CycT1.
In addition to PARP1, the ATM and DNA-PK kinases also orchestrate the DDR. However, in cells pretreated with the ATM or DNA-PK inhibitor (Extended Data Fig. 1b, c), GFP-CycT1 remained trapped at DNA lesions (Fig. 1k). In contrast, pretreating cells with the PARP1 inhibitor AZD2281 completely abolished the recruitment of GFP-CycT1. Thus, the induced interaction with PAR-PARP1 recruits P-TEFb to DNA lesions and is involved in the PARP1-mediated DDR signaling.
PARP1 directly binds to CycT1 HRD in a PAR-dependent manner
To further investigate the P-TEFb-PARP1 interaction, we performed in vitro binding assays using purified recombinant proteins and found that CycT1, but not CDK9, was efficiently precipitated by wild-type (WT) PAR-PARP1 (Fig. 2a–c). As controls, the PARP1 mutant E988Q that only catalyzes mono(ADP-ribosylation)33 was largely unable to pull down CycT1, while the catalytically inactive PARP1-E988A completely lost the binding (Fig. 2a). Furthermore, the treatment with PARG weakened the MNNG-induced PARP1-CycT1 interaction (Fig. 2d). Thus, PARP1 directly binds to the P-TEFb subunit CycT1 in a PAR-dependent manner.
Figure 2. The PARP1-CycT1 binding depends on the histidine-rich domain of CycT1 and the PAR chains on PARP1 and is likely facilitated by electrostatic interactions between the two.
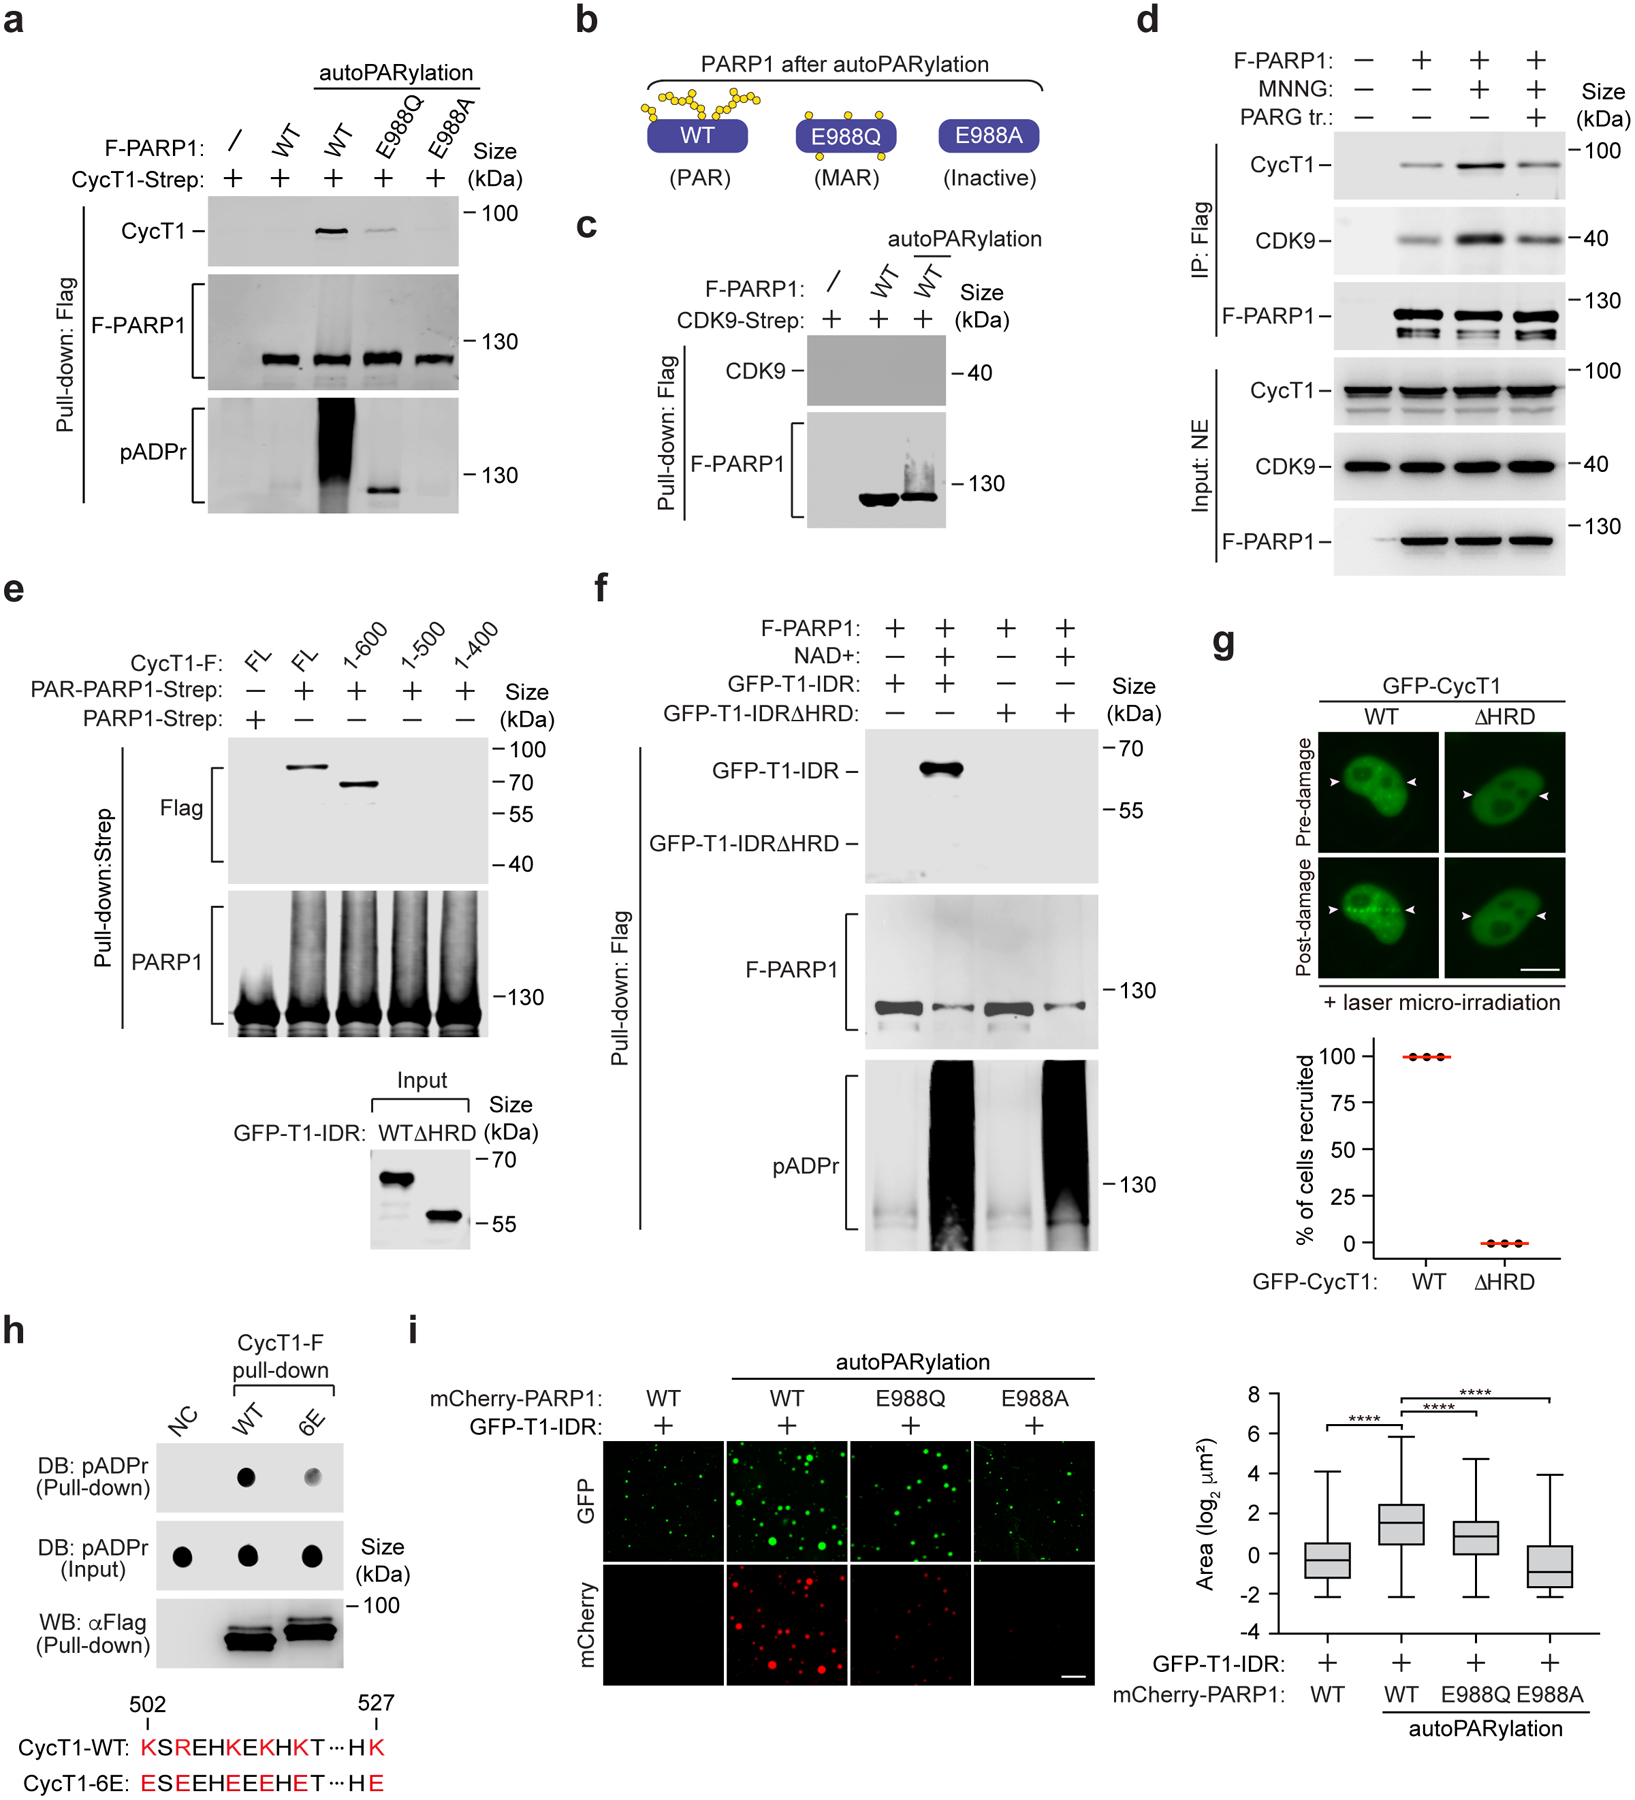
a, c, e, & f, Purified and immobilized WT or mutant F-PARP1 or PARP1-Strep was subjected to autoPARylation reaction in vitro. The pattern of ADP-ribose attached on WT and mutant PARP1 after the reaction is diagramed in b. After the reactions were stopped, the unmodified or modified PARP1 was incubated with purified CycT1-Strep (a), CDK9-Strep (c), full-length (FL) or truncated CycT1-F (e) or WT or the HRD-deleted GFP-CycT1-IDR (f). The input and pull-down proteins were analyzed by Western blotting (WB). d, HeLa cells expressing F-PARP1 or not were untreated or treated with MNNG. anti-Flag immunoprecipitates (IP) were incubated with recombinant PARG or not and then examined by WB. g, HeLa cells expressing WT or the HRD-deleted GFP-CycT1 were subjected to laser microirradiation and analyzed and quantified as in Fig.1i. Scale bar = 10 μM. The error bars indicate mean ± s.d. with n = 3 independent experiments. h, Purified and immobilized WT or mutant CycT1-F was incubated with autoPARylated PARP1. The input and pull-down proteins were analyzed by Dot blotting (DB) or WB. Bottom: The altered residues in CycT1–6E and their corresponding positions in WT CycT1 are in red. i, GFP-CycT1-IDR (0.4 mg/ml) mixed with unmodified mCherry-PARP1 or in vitro PARylated WT or mutant mCherry-PARP1 (0.1 mg/ml) was subjected to droplet formation assay and examined by fluorescence microscopy for GFP and mCherry fluorescence. Scale bar = 10 μM. Right: Size quantification of the droplets in each group. The box plots show the minimum, first quartile, median, third quartile and maximum with n representing the number of droplets examined over 3 independent experiments: mCherry-PARP1-WT (n=2907), mCherry-PARP1-WT-PARylation (n=2284), mCherry-PARP1-E988Q-PARylation (n=1797), mCherry-PARP1-E988A-PARylation (n=3782); statistical analysis was performed using two-tailed unpaired t-tests; ****P < 0.0001. All Western blots are representative of three independent experiments. Gel source data are available online.
Next, we tested a series of CycT1 deletion mutants and found that the region around amino acid (aa) 500 is necessary for the binding to PAR-PARP1 (Fig. 2e). Furthermore, the IDR of CycT1, which contains the HRD essential for phase separation12, was sufficient to bind PAR-PARP1 in an HRD-dependent manner (Fig. 2f). Consistently, the deletion of HRD abrogated GFP-CycT1’s accumulation at laser-induced DNA lesions (Fig. 2g).
Since HRD and PAR are oppositely charged, it is possible that the CycT1-PARP1 binding was enhanced by electrostatic interactions. Supporting this idea, when six positively charged residues within the HRD were changed to glutamate, the resulting mutant CycT1–6E significantly reduced PAR-binding compared to WT CycT1 (Fig. 2h). Moreover, only mCherry-PAR-PARP1, but not the mono- or unmodified version, could be incorporated into and increase the size of phase-separated GFP-CycT1-IDR droplets (Fig. 2i). Neither the unmodified nor the PARylated mCherry-PARP1 alone formed droplets under the same conditions (Extended Data Fig. 1d). Taken together, we conclude that the CycT1-PARP1 binding requires the HRD of CycT1 and PAR chains on PARP1.
CycT1 is directly PARylated by PARP1 upon DNA damage
To test whether CycT1 is a substrate of PARP1, immunoprecipitated CycT1 from MNNG-treated cells was analyzed by Western blotting. Indeed, the PARylation of CycT1 was detected with the specific ADP-ribose-binding reagent pADPr34 (Fig. 3a and Extended Data Fig. 2a) and also with the PAR-specific antibody αpADPr (10H) or pan-ADPr that recognizes the terminal ADP-ribose (Extended Data Fig. 2b). Consistent with the above binding results, CycT1 but not CDK9 was PARylated upon MNNG treatment (Extended Data Fig. 2c, d).
Figure 3. PARP1 directly PARylates CycT1 in response to DNA damage.
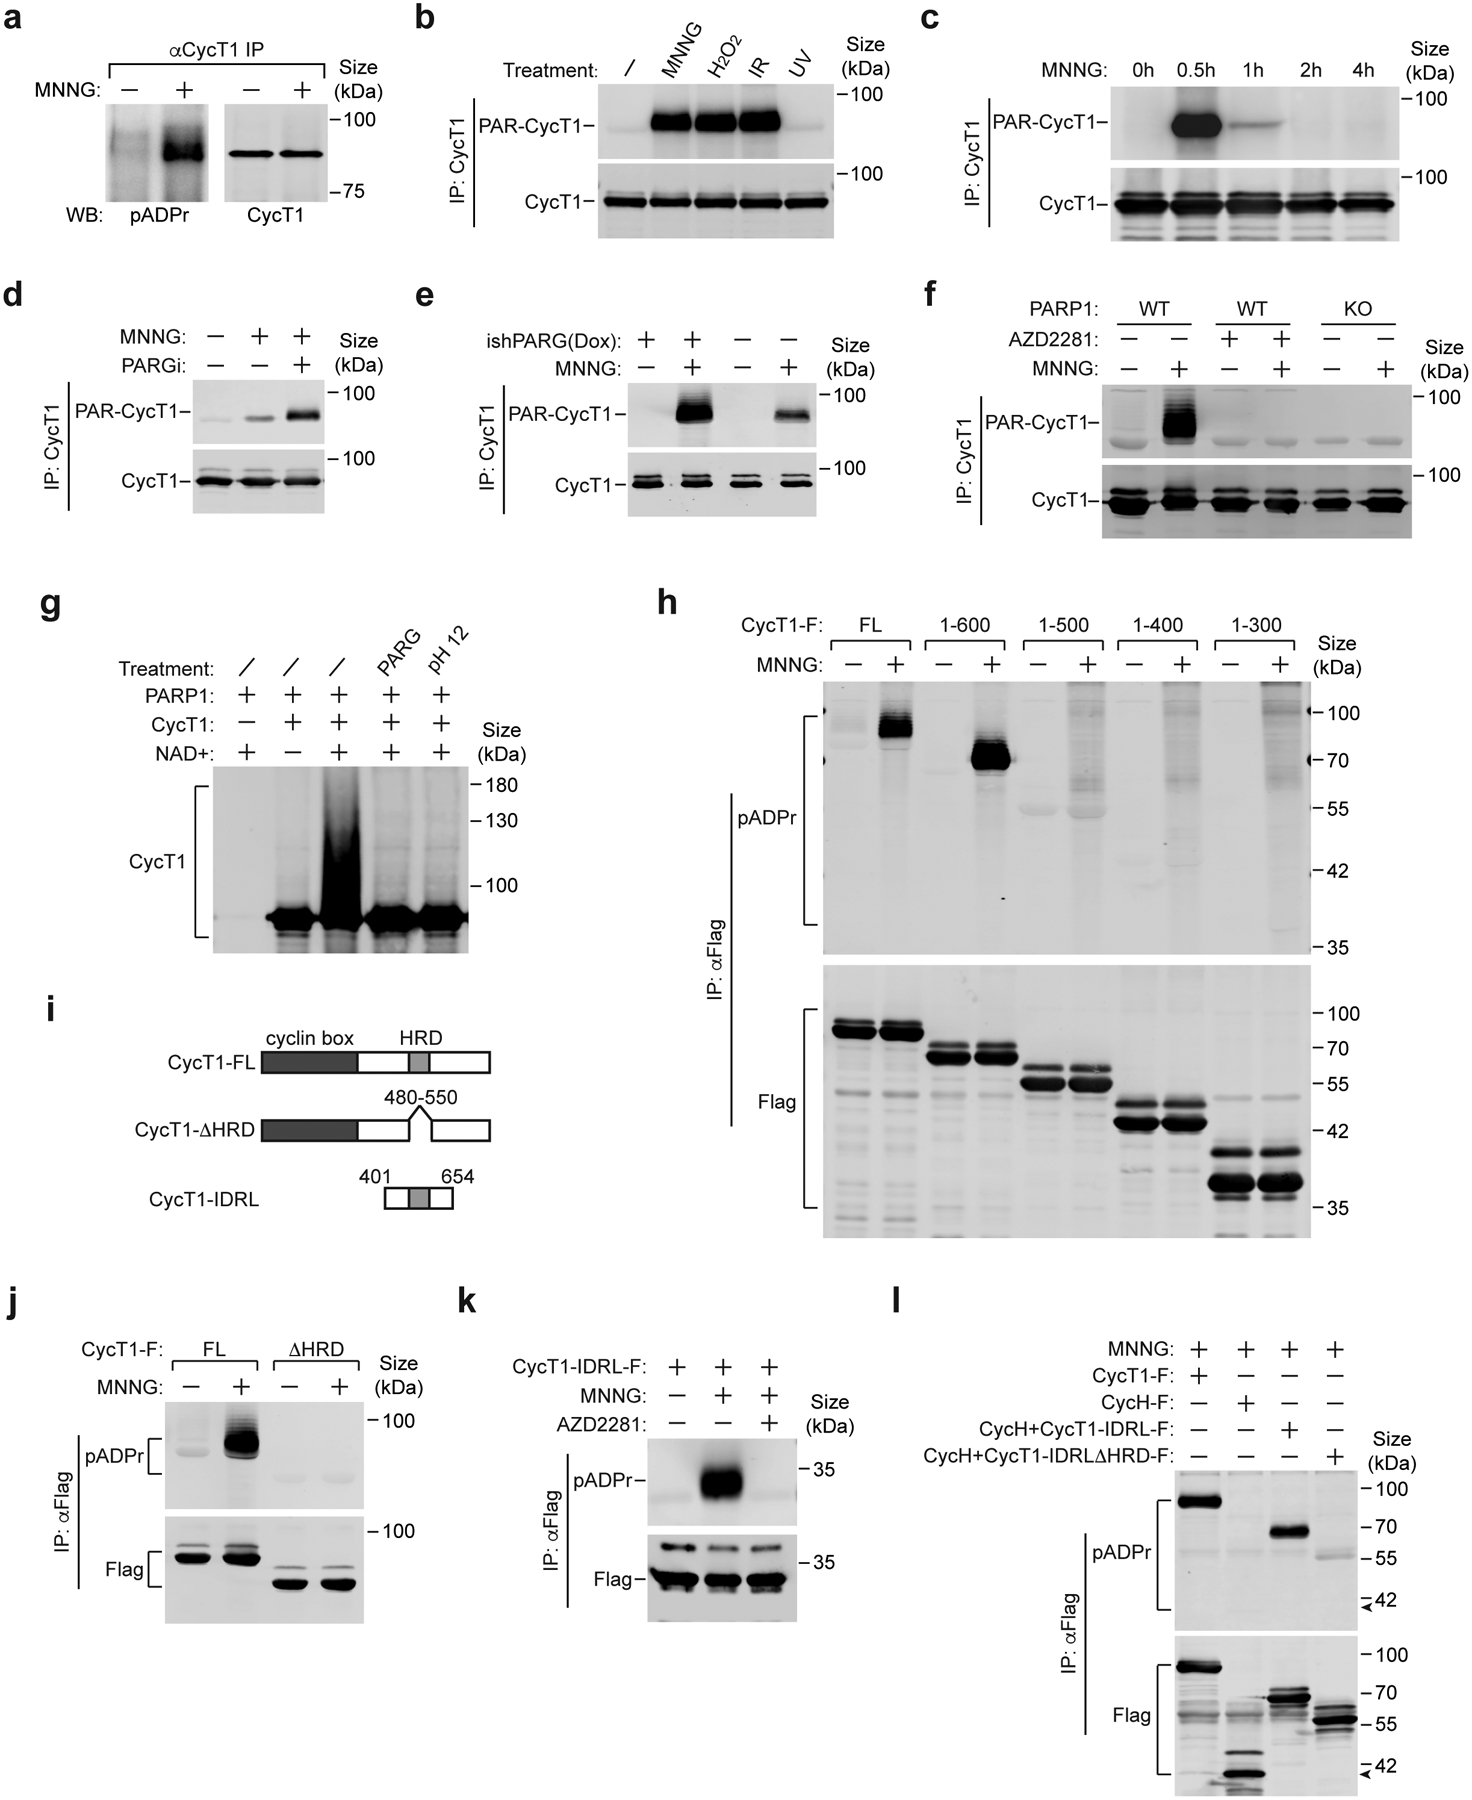
a, Nuclear extracts of control or MNNG-treated HeLa cells were subjected to immunoprecipitation with anti-CycT1 antibody. The immunoprecipitates (IP) were analyzed by Western blotting (WB) with the indicated antibodies. b, HeLa cells were untreated or treated with the indicated agents or chemicals. CycT1 were affinity-purified from whole cell extracts (WCE) and analyzed by WB. IR: ionizing radiation. c & d, HeLa cells were untreated or treated with MNNG for the indicated time periods (c) or with MNNG alone or MNNG plus PDD00017273 for 0.5 hr (d). CycT1 affinity-purified from WCE were analyzed by WB. e, CycT1 affinity-purified from control or doxycycline (Dox)-inducible PARG knockdown cells (ishPARG), which were either untreated or treated with MNNG, was examined by WB. f, Parental (WT) or PARP1 KO cells were untreated or treated with MNNG or/and AZD2281 as indicated. CycT1 purified from WCE were analyzed by WB. g, Affinity-purified CycT1 were incubated in ADP-ribosylaton reactions with PARP1 and NAD+ as indicated. After the reaction, the modified CycT1 were either untreated or treated with 100 ng PARG or 100 mM Tris-HCl, pH 12 and then analyzed by WB to detect the PARylated CycT1. h, j, & k, HeLa cells expressing the indicated Flag-tagged full-length (FL) or truncated CycT1 proteins were untreated or treated with MNNG or MNNG plus AZD2281 as indicated. The anti-Flag IP from WCE were analyzed by WB. i, A diagram depicting the protein domains and mutants of CycT1. l, HeLa cells expressing the indicated Flag-tagged proteins were treated with MNNG. The anti-Flag IP from WCE were analyzed by WB. The arrow denotes the expected position of WT CycH-F. All Western blots are representative of three independent experiments. Gel source data are available online.
Intriguingly, in addition to MNNG, exposing cells to H2O2, a well-known inducer of oxidative DNA damage, or ionizing radiation (IR) by X-rays, which create mainly DNA base lesions and double-strand breaks (DSBs)13, efficiently promoted PARylation of CycT1 (Fig. 3b and Extended Data Fig. 3a). In contrast, UV-irradiation, which produces lesions to significantly distort DNA's structure15, failed to generate PAR-CycT1, although the same treatment efficiently disrupted the 7SK snRNP and induced the accumulation of the DNA damage marker γH2AX35, 36 (Extended Data Fig. 3b, c). Furthermore, the overall cellular levels of protein PARylation were robustly increased by MNNG, H2O2 and IR, but not UV (Extended Data Fig. 3d). Thus, the PARylation of CycT1 appears to be induced by certain types of DNA damage characterized by their abilities to activate PARP1.
In cells treated with MNNG or H2O2, CycT1 PARylation peaked within 30 minutes and then quickly declined (Fig. 3c and Extended Data Fig. 3e). This is different from the patterns of phosphorylation of ATM and DNA-PK and ubiquitination of H2AX during the treatment (Extended Data Fig. 3f). As expected, inhibiting PARG with PDD00017273 or the shRNA-mediated PARG knockdown significantly increased the MNNG-induced CycT1 PARylation (Fig. 3d, e and Extended Data Fig. 3g), whereas treating cells with the PARP inhibitor PJ34 produced the opposite effect (Extended Data Fig. 3h).
Further supporting the idea that PARP1 is the enzyme to PARylate CycT1, knocking out (KO) the PARP1 gene37 or chemically inhibiting the activity of PARP1, but not ATM and DNA-PK, completely abrogated the MNNG-induced CycT1 PARylation (Fig. 3f and Extended Data Fig. 3i). The direct PARylation of CycT1 by PARP1 was also confirmed by in vitro reactions containing recombinant proteins (Fig. 3g). In the presence of PARP1 and NAD+, the PAR chains appended onto CycT1 resulted in a major upward shift in the SDS-PAGE gel, which was eliminated by the PARG treatment or high pH. Collectively, these data demonstrate PARP1’s direct PARylation of CycT1 in response to DNA damage.
The HRD is required for CycT1’s PARylation by PARP1
To determine the region of CycT1 important for PARylation, we examined a series of truncated CycT1 and found that truncations to amino acid (aa) 500 and beyond abolished the MNNG-induced PARylation (Fig. 3h). Consistent with the above binding data, the CycT1 HRD and its PAR-binding activity were both required in this process (Fig. 3i, j and Extended Data Fig. 3j). Moreover, a CycT1 fragment (aa 401–654; termed CycT1-IDRL) was efficiently PARylated by PARP1 (Fig. 3k). Appending CycT1-IDRL onto CycH, the cyclin partner of CDK7, enabled PARylation of the fusion protein in an HRD-dependent manner (Fig. 3l). Together, these data underscore the importance of the HRD for CycT1’s PARylation that occurs primarily within the IDRL fragment.
CycT1 is not primarily PARylated on aspartate (D) and glutamate (E)
We next sought to determine the PARylation sites in CycT1. In light of previous data showing D and E as frequently modified by PARP138, 39, we mutated a total of 17 D/Es into alanines (17A) within CycT1-IDRL. Surprisingly, not only was 17A PARylated, the modification was even more efficient than on WT CycT1 (Extended Data Fig. 4a). Moreover, the MNNG-induced CycT1 PARylation was resistant to hydroxylamine (Fig. 4a), which cleaves PAR chains attached to acidic residues40, suggesting that these D/Es were not used as the principal PARylation sites and could even inhibit the modification. We thus opted to use IDRL17A for site identification in order to focus on residues other than D/Es.
Figure 4. PARP1 PARylates CycT1 at multiple sites within and near the HRD.
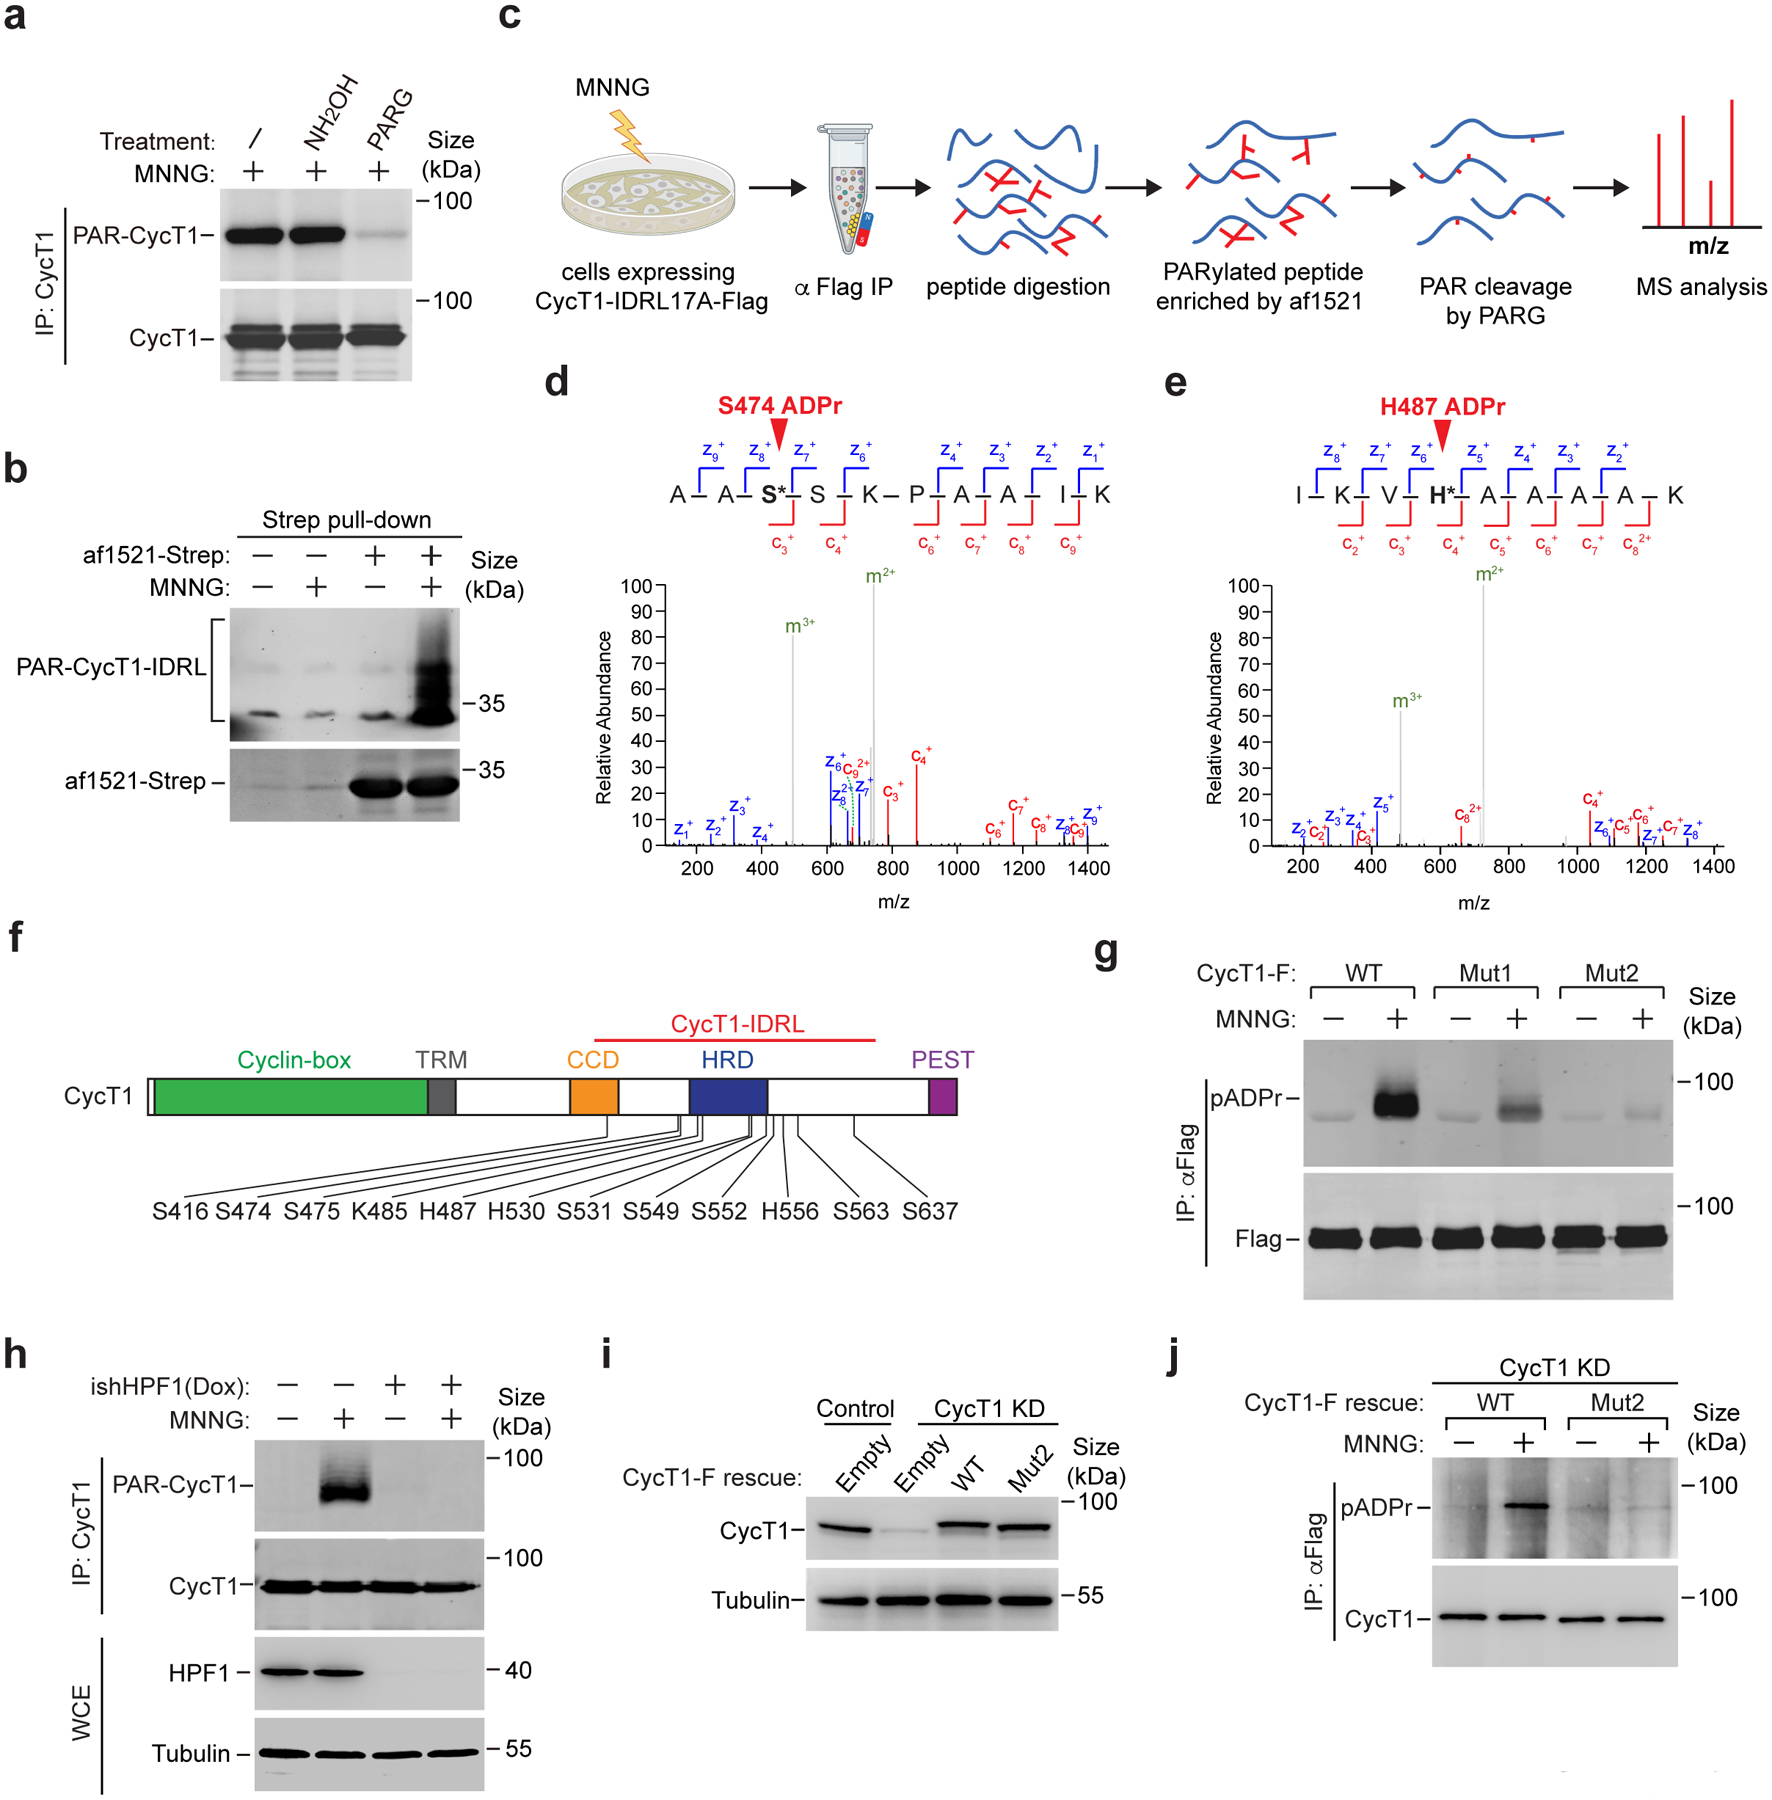
a, CycT1 affinity-purified from MNNG-treated cells were either untreated or treated with NH2OH or PARG and then analyzed by Western blotting (WB) to detect the PARylated CycT1. b, HeLa cells expressing CycT1-IDRL-F were untreated or treated with MNNG. WCE were incubated with immobilized af1521-Strep protein to pull down the PARylated proteins. The bait (af1521-Strep) and bound (PAR-CycT1-IDRL-F) proteins were analyzed by WB with anti-Strep and anti-Flag antibodies, respectively. c, A strategy to enrich PARylated peptides for identification of modification sites by LC-MS/MS. CycT1-IDRL17A-Flag was purified by anti-Flag IP from MNNG-treated cells and digested with trypsin into peptides. The PARylated peptides were enriched with immobilized af1521-Strep as in b, treated with PARG to generate uniform mass tags of one or multiples of 541.06 Daltons at the modified sites, and analyzed by LC-MS/MS. d & e, Fully annotated ETD tandem mass spectrum of a representative peptide with the indicated ADP-ribosylated residue, with both c-ions (red) and z-ions (blue) pinpointing the modification site. f, Schematic diagram of human CycT1 showing the various domains and distribution of PARylation sites as determined by LC-MS/MS. g, HeLa cells expressing the indicated CycT1-F proteins were untreated or treated with MNNG. The anti-Flag IP from WCE were analyzed by WB. h, Control or the doxycycline (Dox)-inducible HPF1 knockdown cells (ishHPF1) were untreated or treated with MNNG. The WCE and immunoprecipitated CycT1 from WCE were analyzed by WB. i, HeLa cells were depleted of CycT1 (CycT1 KD) and reconstituted with stably expressed WT or Mut2 CycT1-F. The CycT1 levels in parental (control), CycT1 KD and reconstituted cells were analyzed by WB. j, HeLa cells reconstituted with WT or Mut2 CycT1-F were untreated or treated with MNNG. The anti-Flag IP from WCE were analyzed by WB. All Western blots are representative of three independent experiments. Gel source data are available online.
The Af1521 protein exhibits high-affinity for ADP-ribose and could be used to enrich PARylated proteins41, which was confirmed by its pull downs of both full-length and IDRL CycT1 in PARylated form (Fig. 4b and Extended Data Fig. 4b). Based on this, we established a workflow for unbiased identification of CycT1 PARylation sites in vivo (Fig. 4c). The PARylated IDRL17A tryptic peptides enriched by Af1521 were treated with PARG to trim away the PAR chains, leaving the mono(ADP-riboses) (MAR) attached to the modified residues as a fixed mass tag of 541.06 Daltons for MS analysis (Fig. 4c and Extended Data Fig. 4c, d).
PARP1 PARylates CycT1 at sites in and around the HRD
Because the ADP-ribose-peptide bond is highly labile, we used the electron transfer dissociation (ETD) mode of tandem MS for fragmentation to unambiguously assign the ADP-ribosylation sites. By analyzing the positions and masses of all the possible fragment ions generated from a modified peptide through cleavage of peptide bonds at different positions (Fig. 4d, e and Extended Data Fig. 5a), we identified a total of 12 ADP-ribosylation sites on CycT1 (Fig. 4f and Extended Data Fig. 5b). These include 8 serines, 3 histidines and 1 lysine, all of which are near or within the HRD. When they were changed to alanines, the resulting mutant (CycT1-Mut1) showed significantly reduced PARylation in MNNG-treated cells (Fig. 4g), indicating that they were likely PARylated in vivo. It is worth noting that the direct ADP-ribosylation of a histidine is uncommon39. In nearly all the reported cases, a modified histidine called diphthamide (Dph) is ADP-ribosylated in mammalian cells42.
Considering that the majority of the identified sites are serines, we asked whether the PARP1 cofactor HPF1 that is key for modifying serines43 is essential for CycT1 PARylation. Indeed, the knockdown of HPF1 mostly abrogated this process (Fig. 4h), indicating the serines as the major acceptor sites. Given PARP1’s promiscuous selection of PARylation sites especially when the primary sites are mutated44, we tested whether other nearby serines can potentially serve as secondary sites. Consistent with this idea, changing the remaining serines in IDRL (Extended Data Fig. 5b) to alanines (CycT1-Mut2) further abolished PARylation of transiently expressed CycT1-Mut2 (Fig. 4g) and CycT1-Mut2 stably expressed near the endogenous level (Fig. 4i, j). Importantly, CycT1-Mut2 displayed otherwise WT activity in PAR-binding, interactions with the major P-TEFb partners, and support of CDK9’s kinase activity (Extended Data Fig. 5c, d and also see below in Fig. 5h). Together, these results indicate that multiple residues, especially serines within the CycT1 IDRL are PARylated by PARP1.
Figure 5. PARylation of transcription-engaged CycT1 disrupts phase separation and inhibits CDK9’s hyperphosphorylation of Pol II CTD.
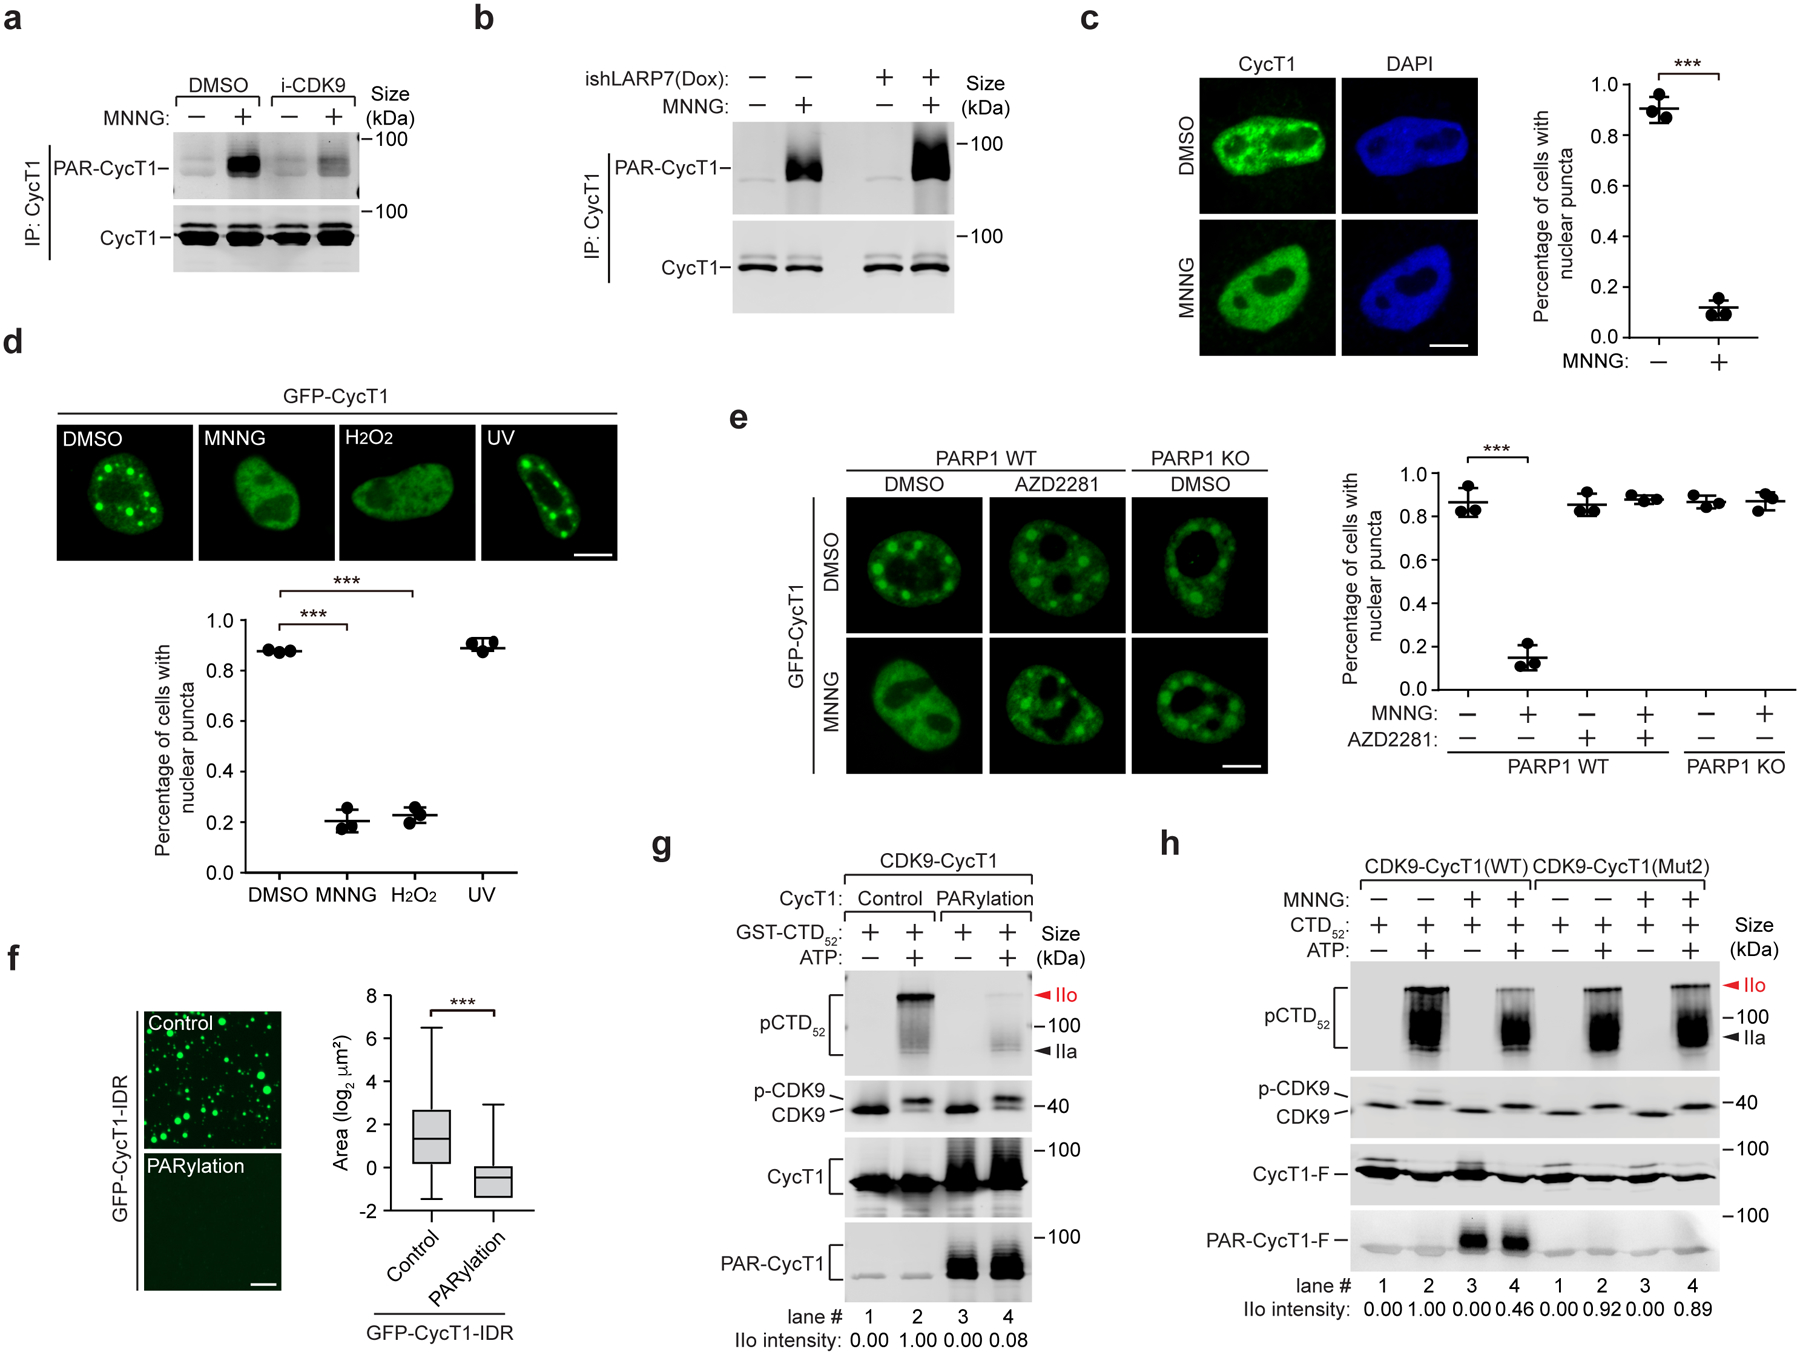
a, HeLa cells were pre-treated with DMSO or i-CDK9 and then untreated or treated with MNNG as indicated. CycT1 immunoprecipitated from whole cell extracts (WCE) were analyzed by Western blotting (WB). b, Control or Dox-inducible LARP7 knockdown cells were untreated or treated with MNNG. Affinity-purified CycT1 from WCE were examined by WB. c, HeLa cells were treated with DMSO or MNNG and analyzed by immunofluorescence staining with anti-CycT1 antibody. Right: Quantification of % cells showing nuclear puncta. d, HeLa cells expressing GFP-CycT1 were treated with the indicated agents. The distribution patterns of GFP-CycT1 were examined by fluorescence microscopy and quantified as in c. e, WT or PARP1 KO cells expressing GFP-CycT1 were pre-treated with DMSO or AZD2281 and then incubated with DMSO or MNNG as indicated. The distribution patterns of GFP-CycT1 were examined and quantified as in c. f, Solutions containing GFP-CycT1-IDR (2 mg/ml) that was in vitro PARylated or not (control) were subjected to droplet formation assay and examined by microscopy for green fluorescence. Scale bar = 25 μM. Right: Quantification of the sizes of the droplets in each group. The box plots show the minimum, first quartile, median, third quartile and maximum with n representing the number of droplets examined in a representative experiment out of 3 independent ones: GFP-CycT1-IDR-Control (n=1957), GFP-CycT1-IDR-PARylation (n=361); statistical analysis was performed using two-tailed unpaired t-tests; ***P < 0.001. g, P-TEFb containing CycT1 that was PARylated or not (control) were tested in kinase reactions containing GST–CTD52 as the substrate and then analyzed by WB. The relative IIo intensities were quantified and shown at bottom. h, P-TEFb containing Flag-tagged WT or Mut2 CycT1 was affinity-purified from control or MNNG-treated cells and tested in kinase reactions as in g. Scale bars in c-e = 10 μM. All data are presented as mean ± s.d. with n = 3 independent experiments. Statistical analyses were performed using two-tailed unpaired t-tests; ***P < 0.001. All Western blots are representative of three independent experiments. Gel source data are available online.
Transcriptionally engaged CycT1 is preferentially PARylated upon DNA damage
What is the function of CycT1 PARylation in DDR? The first hint came from the observations that the MNNG-induced CycT1 PARylation was significantly suppressed when Pol II elongation was blocked by the CDK9 inhibitor i-CDK945, DRB, or actinomycin-D (ActD) (Fig. 5a and Extended Data Fig. 6a&b), suggesting that the PARylation occurred during active transcription. Consistently, CycT1 present in the inactive 7SK snRNP46–48 lacked robust PARylation (Extended Data Fig. 6c). In contrast, liberating P-TEFb from 7SK snRNP by knocking down the LARP7 subunit49 markedly enhanced the CycT1 PARylation (Fig. 5b and Extended Data Fig. 6d). Thus, the transcriptionally engaged CycT1 appeared to be preferentially modified by PARP1 upon DNA damage.
PARylation disrupts CycT1 phase separation and inhibits CDK9’s hyperphosphorylation of Pol II CTD
Given that all the identified PARylation sites are in or near the HRD that is required for CycT1 phase separation12, we examined the impact of PARylation in this process. Upon inducing PARylation by either MNNG or H2O2, the phase-separated CycT1 present in the nuclear speckles12 rapidly disassembled in a PARP1-dependent manner (Fig. 5c–e and Extended Data Fig. 6e). In contrast, CycT1’s distribution pattern did not change after UV irradiation (Fig. 5d). The disruption of CycT1 phase separation was probably due to the presence of negatively charged PAR chains that neutralize the positive charges of the neighboring HRD. Supporting this view, WT GFP-CycT1-IDR failed to form phase-separated droplets upon PARylation by PARP1 in vitro, whereas droplet formation by GFP-CycT1-IDR-Mut2, which was largely unmodified, was unaffected in this process (Fig. 5f and Extended Data Fig. 6f–h). Moreover, incubating NAD+ with pre-formed droplets containing GFP-CycT1-IDR and mCherry-PAR-PARP1 induced the PARylation of CycT1-IDR and dissolved the droplets (Extended Data Fig. 6i, j). These data together indicate that PARylation inhibits CycT1 phase separation.
In agreement with our previous demonstration that CycT1 phase separation is required for CDK9’s full kinase activity12, the in vitro PARylated CycT1 failed to support CDK9’s hyperphosphorylation of Pol II CTD (the IIo form; Fig. 5g). Similarly, WT P-TEFb purified from MNNG-treated cells, in which CycT1 was PARylated, displayed decreased CTD kinase activity compared to P-TEFb from untreated cells (Fig. 5h). In contrast, MNNG had little effect on the activity of CDK9 bound to CycT1-Mut2. Together, these results establish a direct link between CycT1 PARylation and the inhibition of CycT1 phase separation and CDK9’s kinase activity.
DNA damage suppresses individual and global gene transcription through inhibiting P-TEFb
To capture dynamic transcriptional changes upon DNA damage, we employed 4-thiouridine (4sU) labeling to measure newly synthesized RNA (Extended Data Fig. 7a) derived from the P-TEFb-sensitive HIV-1 and cellular FOS and JUN gene promoters2, 50,51. By stimulating CycT1 PARylation, both MNNG and H2O2 markedly decreased transcription from these promoters (Fig. 6a, Extended Data Fig. 7b&7c). In particular, the MNNG’s suppression of HIV-1 transcription was at the level of producing long transcripts, i.e. elongation (Fig. 6a), and abrogated by PARP1 inhibition or gene knockout (Fig. 6b), indicating the effect as PARP1-dependent.
Figure 6. PARylation of CycT1 downregulates transcriptional elongation and promotes DNA repair and cell survival upon DNA damage.
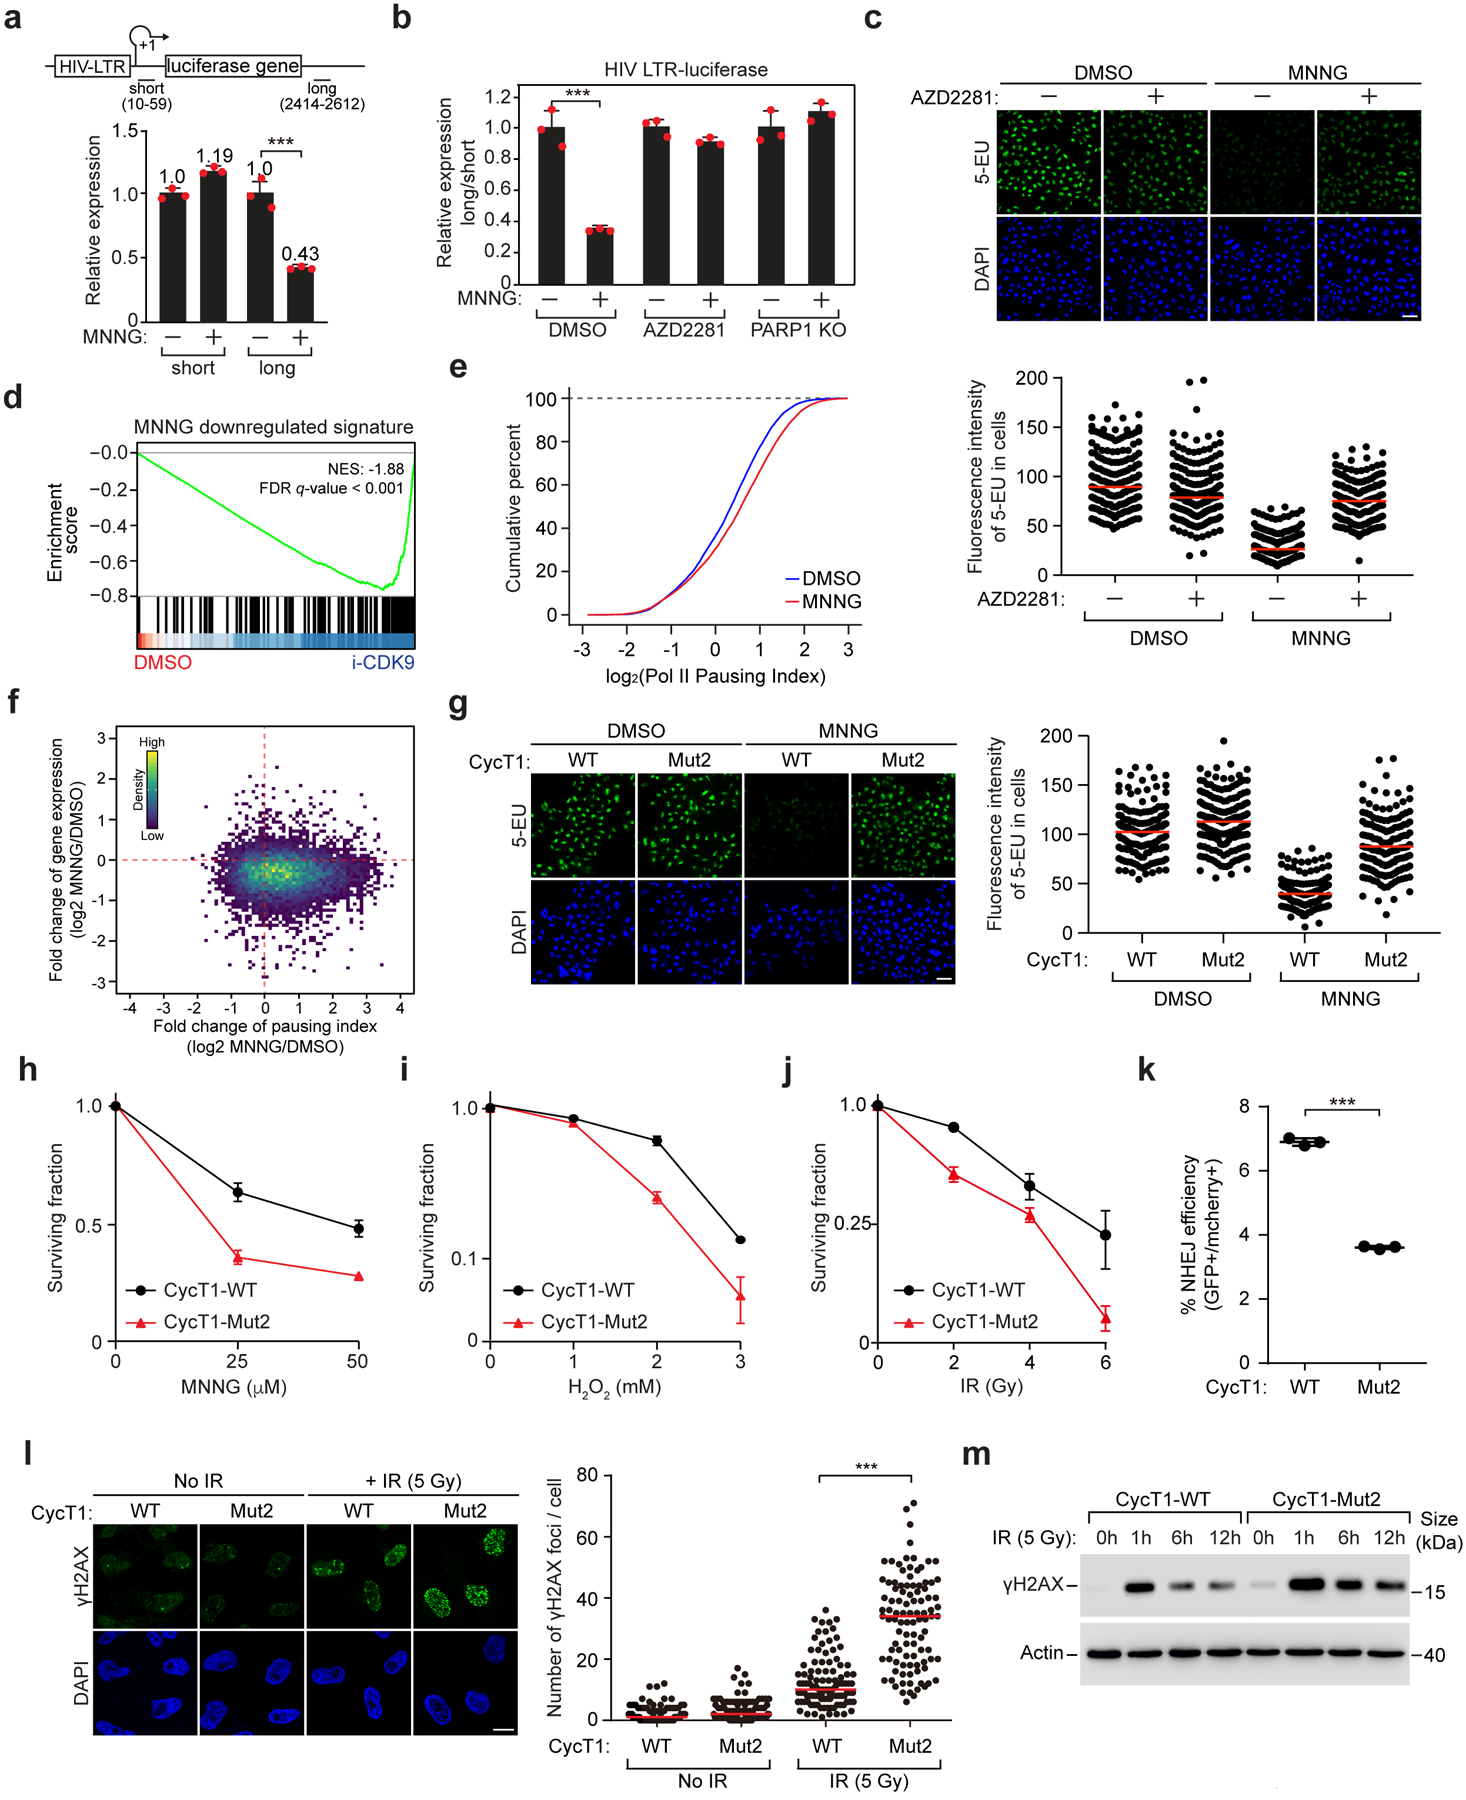
a, The normalized mRNA levels at the promoter-proximal (short) and –distal (long) positions of HIV-1 LTR-luciferase reporter gene in untreated or MNNG-treated cells were determined by 4sU-labeling followed by qRT-PCR analysis. b, WT or PARP1 KO cells containing HIV-1 LTR-luciferase reporter were treated with the indicated chemicals. The “long vs. short” ratios of HIV-1 mRNA levels were measured as in a. c, HeLa cells were untreated or pre-treated with AZD2281 and then treated with DMSO or MNNG. Newly synthesized RNA was analyzed by 5-EU-labeling. Bottom: Quantification of fluorescence intensity per cell. Red lines indicate mean intensity in each group. The number of cells analyzed: control-DMSO: 188; AZD2281-DMSO: 221; control-MNNG: 195; AZD2281-MNNG: 202. d, GSEA showing RNA-seq-detected MNNG-downregulated gene set in i-CDK9- versus DMSO-treated cells. e, CUT & RUN-sequencing analysis of Pol II pausing index in cells treated with DMSO or MNNG. f, Scatterplot showing the log2 fold changes of gene expression versus Pol II pausing index after exposure to MNNG. g, Newly synthesized RNA in HeLa cells reconstituted with the indicated CycT1 proteins were untreated or treated with MNNG and analyzed as in c. The number of cells examined: CycT1-WT-DMSO: 165; CycT1-Mut2-DMSO: 174: CycT1-WT-MNNG: 162; CycT1-Mut2-MNNG: 156. h-j, Viability of cells reconstituted with the indicated CycT1 was measured before or after the exposure to MNNG (h), H2O2 (i) and IR (j). k, NHEJ efficiency of U2OS EJ5-GFP cells expressing the indicated CycT1 was analyzed by FACS for GFP levels 48 hr after I-SceI expression. l, HeLa cells reconstituted with WT or Mut2 CycT1 were analyzed by immunofluorescence staining before and 12 hr after IR treatment with anti-γH2AX. Scale bar = 10 μM. Right: Quantification of the γH2AX foci number per cell. Red lines indicate the mean in each population. The number of cells examined: CycT1-WT no IR: 101; CycT1-Mut2 no IR: 106; CycT1-WT+IR: 103; CycT1-Mut2+IR: 100. m, HeLa cells reconstituted with WT or Mut2 CycT1 were untreated or treated with IR and allowed to recover for the indicated periods. WCE was examined by WB. In a, b, h-k, data are presented as mean ± s.d. with n = 3 independent samples. In c, g, scale bar = 50 μM. In c, g, i, m, data are representative of three independent experiments with similar results. Gel source data are available online.
Interestingly, when monitoring the status of transcriptional repression in a DSB reporter system52 (Extended Data Fig. 7d), we observed that the inhibition of PARP1 did not attenuate the DSB-induced suppression of reporter gene expression (Extended Data Fig. 7e). In contrast, inhibiting ATM largely restored the transcription in the presence of the DSBs (Extended Data Fig. 7e), consistent with the previous reports18, 53.
To measure the impact on global transcription after DNA damage, we performed 5-ethynyl uridine (5-EU) labeling24 and observed a dramatic and global reduction of nascent RNA synthesis in MNNG-treated cells and that this effect was PARP1-dependent (Fig. 6c). Importantly, the repression of transcription by MNNG occurred in parallel with the disruption of CycT1 phase separation, with the effects detected as early as 20 min post-treatment and becoming evident at 40 min (Extended Data Fig. 7f–h), reconfirming a functional connection between the two events in response to DNA damage.
To further examine the MNNG effect on a global scale, we also performed high-throughput sequencing of 4sU-labeled RNA in DMSO-, MNNG- or i-CDK9-treated cells. Compared to DMSO, MNNG caused more genes to be downregulated than upregulated (Extended Data Fig. 7i). Most of the genes suppressed by MNNG (fold change >4) were also downregulated by i-CDK9 treatment (Fig. 6d). Although additional cellular targets likely exist, the strong concordance between the gene expression profiles induced by MNNG and i-CDK9 (Extended Data Fig. 7j), two structurally very different compounds, suggests that the MNNG inhibition of transcription was largely achieved through suppressing P-TEFb. Consistently, MNNG elevated the promoter-proximal pausing of Pol II (Fig. 6e) just as observed for i-CDK945. As expected, the genes with increased pausing displayed mostly reduced expression in MNNG-treated cells (Fig. 6f).
DNA damage-induced CycT1 PARylation silences transcription
To directly link the MNNG-induced transcriptional inhibition to the PARylation of CycT1, we replaced endogenous CycT1 with the PARylation-defective Mut2 and found that the MNNG inhibition of global and JUN and FOS transcription was largely alleviated in the Mut2-expressing cells (Fig. 6g and Extended Data Fig. 7k, l), underscoring the key role of CycT1 PARylation in damage-induced transcriptional silencing.
Given the reported roles of NELF-E, NuRD, ATM, and DNA-PK in DDR18, 20, 24, 54, we tested the possible involvement of these proteins in MNNG-induced transcriptional inhibition and found that transcription remained largely silenced in the NELF-E or MTA1 (a NuRD subunit) knockdown cells after the treatment (Extended Data Fig. 8a–d). Similarly, chemically inhibiting ATM or DNA-PK did not alleviate transcriptional repression caused by MNNG (Extended Data Fig. 8e). Thus, the MNNG-induced transcriptional inhibition does not appear to invoke the actions of these factors. Rather, the PARylation of CycT1 by PARP1 plays a major role in this process.
CycT1 PARylation promotes cell survival and DNA damage repair
Finally, we investigated the physiological function of CycT1 PARylation in cellular response to DNA damage. The cell viability analysis demonstrated that the Mut2-expressing cells were more sensitive to the MNNG or H2O2 treatment compared to WT CycT1 cells (Fig. 6h, i). Similarly, the Mut2 cells also displayed a decreased viability upon exposure to ionizing radiation (IR), but not UV irradiation, when compared to WT cells (Fig. 6j and Extended Data Fig. 9a).
Correlating with these differences, a reporter cell line (EJ5-GFP) containing an integrated nonhomologous end joining (NHEJ) reporter gene and expressing CycT1-Mut2 exhibited reduced NHEJ frequency compared to the cells expressing WT CycT1 (Fig. 6k). The Mut2-expressing cells also displayed brighter foci and accumulated a higher level of γH2AX than WT cells after the IR treatment (Fig. 6l, m). Moreover, pretreating cells with the PARP1 inhibitor AZD2281 only allowed IR to further increase the γH2AX level in WT but not Mut2 cells, and that the γH2AX level in the Mut2 cells remained similarly high with or without the pretreatment (Extended Data Fig. 9b & 9c). Together, these data confirm that transcriptional inhibition caused by DNA-damaging agents such as MNNG, H2O2 and IR serves to promote repair and cell survival, and that this effect is primarily mediated by PARP1’s modification of CycT1 and inhibition of P-TEFb phase separation.
Discussion
Analogous to a train that must stop to avoid derailment when encountering a broken rail, Pol II transcription immediately halts when major DNA damage occurs15, 55. This rapid pause of elongating Pol II is critical to activate various DDR signaling events that influence the cellular decision between death and survival14, 56. While bulky lesions such as those produced by UV-irradiation severely distort the DNA helix and can physically block Pol II translocation and elicit TC-NER14, 15, what has been less well understood until now is the mechanism that halts Pol II in response to relatively subtle and non-helix-distorting lesions. Here, our data support a model that the DNA damage-induced and PARP1-catalyzed PARylation of CycT1 and the resultant disruption of P-TEFb’s phase separation are likely used by cells to halt Pol II under such conditions (Extended Data Fig. 10).
Notably, not all types of DNA damage produce an equal effect on PARP1 activation. Acting as a molecular sensor of DNA damage, PARP1 binds to single-stranded DNA breaks with high affinity57. Among the damaging agents used in the current study, we observed strong CycT1 PARylation caused by MNNG, H2O2 and IR (Fig. 3b). While IR causes both base lesions and strand breaks, oxidative (e.g. H2O2) and alkylating (e.g. MNNG) agents primarily generate base lesions that are repaired via the base excision repair (BER) pathway25. Nonetheless, intermediates such as single-stranded breaks derived from BER are likely detected by PARP1, resulting in activation.
In contrast, the UV-induced lesions are repaired primarily by the NER pathway. Although PARP1 has been shown to facilitate the initial recognition step in genome-wide NER58, 59, it remains unclear how extensive its catalytic activity is involved. Notably, we did not observe an obvious activation of PARP1 and CycT1 PARylation after UV-irradiation, suggesting that the PARP1-CycT1 signaling is probably not involved in the UV-initiated NER pathway. This signaling is apparently also not used to inhibit transcription when DSBs are induced upstream of a reporter gene promoter (Extended Data Fig. 7e), which likely involves chromatin remodeling to silence the downstream transcription18, 21. UV is known to release P-TEFb from 7SK snRNP to temporarily stimulate elongation so as to increase the lesion detection for subsequent repair2, 25, 48, 60. Collectively, these observations indicate that distinct mechanisms are used by cells to modulate transcription in response to different types of DNA damage.
Even for the relatively subtle base lesions that are comparatively small and non-helix-distorting, transcription must be transiently stopped to prevent the synthesis of mutated transcripts. Although PARP1 has been implicated in initiating DNA repair, its role in regulating the initial transcriptional response to these subtle lesions had been largely unknown. The extensive PAR chains on PARP1 not only help recruit multiple factors participating in different aspects of DDR, but also add a huge amount of negative charges to PARP1. Once the substrates are PARylated, a further increase in local concentration of negative charges occurs, which can provide additional levels of regulation.
A good example illustrating this point is revealed in the sequence of events surrounding PARP1’s recruitment and then PARylation of CycT1. Upon sensing DNA breakage, PARP1 becomes activated and self-PARylated. The electrostatic interactions between the negatively charged PAR and the positively charged HRD of CycT1 promote the recruitment of CycT1 into phase-separated condensates where CycT1 is PARylated by PARP1. However, once the PAR chains are attached to CycT1 in the immediate vicinity of the HRD, they neutralize the charges and allow P-TEFb to rapidly exit the condensates and thus lose the ability to hyperphosphorylate the CTD, leading to transcriptional shutdown.
Similar to the HRD of CycT1, the positively charged arginine-glycine-glycine (RGG) repeats of FET proteins such as FUS have also been shown to bind to PAR via electrostatic interactions, leading to their recruitment and subsequent PARylation at DNA damage sites61–63. Just like PAR-CycT1, the PARylated FUS quickly dissociates from the condensates. Collectively, these studies indicate a dual function of PARylation at sites of DNA damage. Prior to PARP1’s PARylation of its substrates containing positively charged motifs, the electrostatic attraction between PAR-PARP1 and the motifs provides a mechanism for recruiting the substrates to phase-separated condensates at damage sites. However, once the substrates are PARylated to neutralize the positive charges of the neighboring motifs, they exit the condensates to elicit various cellular responses to DNA damage.
In addition to its well-characterized role in DDR, PARP1 has been shown to modulate transcription through PARylating various transcriptional regulators under normal conditions44, 64. Whereas a previous study links the PARylation of NELF by PARP1 to activation of transcriptional elongation65, we observed PARP1’s negative effect on elongation in cells upon DNA damage. How PARP1 switches its substrate from NELF to P-TEFb when cells are shifted from normal to genotoxic conditions remains to be investigated. Nevertheless, it is clear from these studies that the roles of PARP1 in regulating transcription are likely diverse and context-specific.
In summary, our work describes an important role of the PARP1-CycT1 signaling in cellular transcriptional response to DNA damage. The observation that CycT1 was rapidly PARylated by PARP1 upon damage indicates that CycT1 is likely an immediate downstream target of PARP1 signaling to halt elongating Pol II and prevent transcriptional mutagenesis. Since PARP1 and P-TEFb have emerged as promising targets in cancer therapy2, 66, our revelation of an intimate relationship between the two may facilitate the development of effective and synergistic therapeutics to fight cancer.
Methods
Antibodies, plasmids and cell lines
The following antibodies were purchased from commercial sources: CycT1 (Santa Cruz Biotech, sc-10750), pan-ADPr (anti-pan-ADP-ribose binding reagent; Millipore, MABE1016), pADPr (ADP-ribose-binding reagent; Millipore, MABE1031), polyclonal anti-PAR polymer antibody 10H (Enzolifesciences, ALX-804–220-R100), γH2AX (Sigma-Aldrich, 05–636), Flag (Sigma-Aldrich, F3165), PARP1 (Cell signaling technology, #9542), and RNA Pol II phospho-Ser5 (Millipore, 04–1572), Phospho-ATM (Ser1981; HUABIO, ET1705–50), DNA-PKCS (phosphor Ser2056; Abbkine, ABP55803). Polyclonal antibodies against CDK9 were generated in our own laboratory and have been described previously49.
The cDNA fragments encoding PARP1 and PARG were amplified by PCR and inserted into the pGFP-His expression vector12. The af1521 fragments were inserted into the pGFP-2xStrep (modified from pGFP-His). The cDNAs for PARP1, CycT1, and CDK9 were cloned into pRK549 with a 2xStrep tag at the C-terminus. The Flag-tagged PARG, CDK9, CycT1 including WT and mutants, were cloned into pRK5. The shRNAs used for PARG and HPF1 knockdown were cloned into the lentiviral vector Tet-pLKO-puro (Addgene). The plasmids expressing GFP-CycT1-IDR, shCycT1, shLARP7, GST-CTD9, and GST-CTD52 have been described previously12, 49. The HeLa-based PARP1 KO cell line was generated by using CRISPR-Cas9 as previously described37.
Cell treatment and preparation of cell extracts
Transient gene expression in HeLa or HEK293T cells was performed with transfection reagent Polyethylenimine (PEI MAX 40K, Polysciences Catalog# 24765) according to the manufacturer’s instructions. For induction of DNA damage, cells were exposed to 1 μM MNNG or 2 mM H2O2 for 20–30 min. In case of PARylation analysis, cells were pre-treated with 1 μM PARG inhibitor PDD00017273 (Sigma Aldrich) or PARP1 inhibitor AZD2281 or PJ34 for 1 hr. Cells were lysed in the following buffer: 50 mM HEPES pH7.9, 350 mM NaCl, 5 mM EDTA, 1% NP-40, 3 mM DTT, and 0.1 mM PMSF. After centrifugation for 10 min at 14,000 rpm, the supernatant was collected as whole cell extracts (WCE). The procedure for making nuclear extract (NE) has been described previously49.
Immunoprecipitation (IP)
The procedure has been described previously with some modifications12. Briefly, for anti-Flag IP, WCE or NE prepared from HeLa cells transfected with the indicated expressing constructs were incubated with anti-Flag agarose beads (Sigma) for 2 hr at 4 °C before washing and elution. For precipitations of endogenous proteins, WCE or NE were incubated overnight with the specific antibodies or total rabbit IgG as a negative control and then with protein A beads (Invitrogen) for 1 hr at 4 °C. After incubation, the immunoprecipitates were washed extensively with buffer D (20 mM HEPES pH7.9, 15% (v/v) glycerol, 0.2 mM EDTA, 0.1% NP-40, 0.3 M KCl) before elution with 0.1 M glycine (pH2.0). The eluted materials were analyzed by Western blotting with the indicated antibodies.
Preparation of CycT1 tryptic peptides
The filter-aided sample preparation (FASP) strategy was used for CycT1 digestion. Briefly, the protein sample was loaded into a 10K filter column (Millipore) and centrifuged. The original solution was replaced with 8 M urea in 0.1 M Tris-HCl, pH8.0 by centrifugation for three times to remove the detergent. Disulfide bridges were reduced with 50 mM dithiothreitol (DTT) by incubating at room temperature for 30 min, then follow by carboxyamidomethylation with 50 mM iodoacetamide (IAA) at room temperature for 30 min. Excess chemicals including urea were removed through extensive washes with 100 mM NH4HCO3 and centrifugation at 14,000 rpm for 20 min each time. The protein suspension was then incubated with 5 ug trypsin (Promega) for digestion overnight at 37 °C, and the resulting peptides were collected by centrifugation at 14,000 rpm for 20 min.
Purification of 2xStrep-tagged af1521 macrodomain
E. coli BL21 cells transformed with the plasmid expressing af1521–2xStrep were cultured in 37 °C until the OD reached 0.6. For induction, 0.2 mM IPTG was added to the culture and continued for 3 hr at 30 °C. Harvested cells were collected and re-suspended in lysis buffer (50 mM Tris-HCl pH7.5, 500 mM NaCl, 1 mM DTT, 1% Triton X-100) on ice and sonicated (40% output, 16 cycles of 15 sec on and 60 sec off). After centrifugation at 11,500 rpm for 1 hr, the soluble fraction of the lysate was collected, aliquoted, and kept at −80 °C until use. The procedure for protein purification has been described previously12.
Enrichment of PARylated CycT1 peptides
The tryptic peptide mixture obtained through FASP was incubated for 2 hr with 10 ug of af1521–2xStrep immobilized on Strep-Tactin beads at 4 °C in the presence of 50 mM Tris-HCl pH8.0, 10 mM MgCl2, 1 mM DTT and 50 mM NaCl. After three washes with ice-cold PBS, the enriched peptides on beads were treated with 5 ug PARG-His at 37 °C for 3 hr in the presence of 50 mM Tris-HCl pH7.8, 25 mM MgCl2 and 1 mM DTT. The PARG-treated peptides, both in solution and retained on the beads, were acidified (pH2.0) with 0.1% formic acid and desalted using homemade reversed-phase C18 Stage Tips. The eluted peptides were lyophilized and stored at −80°C before analysis.
Liquid Chromatography with tandem mass spectrometry (LC-MS/MS) analysis
All MS experiments were performed on a nanoscale EASY-nLC 1200 UHPLC system (Thermo Fisher Scientific) connected to an Orbitrap Fusion Lumos equipped with a nanoelectrospray ion source (Thermo Fisher Scientific). Mobile phase A contained 0.1% formic acid (v/v) in water; mobile phase B contained 0.1% formic acid in 80% acetonitrile. The peptides were dissolved in 0.1% formic acid with 2% acetonitrile and separated on a RP-HPLC analytical column (75 μm×25 cm) packed with 2 μm C18 beads (Thermo Fisher Scientific) using a linear gradient ranging from 6% to 26% B in 90 min and followed by a linear increase to 44% B in 15 min at a flow rate of 300 nL/min. The Orbitrap Fusion Lumos acquired data in a manner that alternated between full-scan MS and MS2 scans. The spray voltage was set at 2.2 kV and the temperature of ion transfer capillary was 300 °C. The MS spectra (350−1750 m/z) were collected with a resolution of 60,000, AGC target of 600,000 charges, and a maximal injection time of 60 ms. Precursor ions were isolated with a window of 1.3 m/z, with an AGC target of 200,000 charges, a resolution of 60,000, and a maximal injection time of 120 ms. The precursor fragmentation was accomplished using electron transfer dissociation (ETD) in positive ion mode.
Mass spectrometry data analysis
Raw data were processed using Proteome Discoverer (PD, version 2.1), and MS/MS spectra were searched against the reviewed SwissProt human proteome database and the IDRL-17A sequence. All searches were carried out with precursor mass tolerance of 20 ppm, fragment mass tolerance of 0.02 Da, oxidation (M) (+15.9949 Da), ADP-ribosylation (D, E, S, T, R, K, H) (+541.0611 Da), and acetylation (protein N-terminus) (+42.0106 Da) as variable modifications, carbamidomethylation (C) (+57.0215 Da) as fixed modification and three trypsin missed cleavages allowed. Only peptides with at least six amino acids in length were considered. The peptide and protein identifications were filtered by PD to control the false discovery rate (FDR) <1%.
In vitro PARylation assay
The reactions were performed with affinity-purified 100 ng PARP1 and 100 ng CycT1 in the presence of 1 mM NAD+, 100 ng sheared salmon sperm DNA in a reaction buffer containing 50 mM Tris-HCl pH 7.5, 4 mM MgCl2, 20 mM NaCl, and 250 μM fresh DTT for 2 hr at 25 °C, before the reaction products were analyzed subsequently.
In vitro kinase assay
P-TEFb containing CycT1-F was affinity-purified by using anti-Flag agarose beads (Sigma) under high salt plus detergent (1 M KCl + 1% NP-40) conditions. 300 ng of purified proteins still attached to the beads were incubated with 100 ng recombinant GST-CTD52 and 100 ng GST-CTD9 at 30 °C in a 25 μL reaction that also contained 50 mM HEPES pH 7.3, 50 mM NaCl, 1 mM DTT, 10 mM MgCl2, and 0.1 mM ATP. The kinase reactions were stopped by the addition of SDS-PAGE sample-loading buffer. After heating at 95 °C for 10 min, the samples were analyzed by SDS-PAGE and Western blotting with the indicated antibodies.
Phase-separated droplet formation
The procedures for protein purification have been described previously12. Briefly, the soluble fraction of the lysates containing GFP-fusion proteins was obtained according to the protocol provided by the manufacturer (IBA GmbH). After concentration by Amicon ultra centrifugal filter (Millipore), the proteins were aliquoted, and kept at −80 °C until use.
The droplet formation assay was performed as described12 with minor modifications. Briefly, to facilitate the formation of phase-separated liquid droplets, the fusion proteins with or without going through the in vitro ADP-ribosylation reaction were diluted in a buffer containing 20 mM Tris-HCl pH 7.5, 1 mM DTT and 37.5 mM NaCl. Five μL of the protein solution were trapped between two coverslips and images were acquired on a confocal microscope (Zeiss LSM880) and images were processed by Image J (Fiji).
4-thiouridine (4sU) metabolic labeling of newly transcribed mRNA
Cells were labeled with DMEM containing 500 μM 4sU (Sigma) and treated with MNNG, H2O2 or i-CDK9 as indicated in the relevant figure legend. Total RNA was isolated with TRIzol, which was followed by isopropanol precipitation. 70 μg of purified RNA was biotinylated with 100 μg/mL MTSEA-biotin (Biotium) in biotinylation buffer (50 mM HEPES pH 7.5, 5 mM EDTA) with constant rotation at room temperature for 30 min. The biotinylated RNA was subjected to streptavidin selection (Dynabeads MyOne Streptavidin C1, Life technologies) according to the manufacturer’s instructions to isolate newly transcribed RNA for RT-qPCR analysis using the Quantagene q225 qPCR system (Kubo Technology, Beijing).
Primer sequences for RT-qPCR:
HIV-LTR-short-forward: 5’- GTTAGACCAGATCTGAGCCT -3’;
HIV-LTR- short-reverse: 5’- GTGGGTTCCCTAGTTAGCCA -3’;
HIV-LTR-long-forward: 5’- GCTATTAATAACTATGCTCAAAAAT -3’;
HIV-LTR-long-reverse: 5’- CAACAACAATTGCATTCATTTTATG -3’;
18S-forward: 5’- ACCCGTTGAACCCCATTCGTGA -3’;
18S-reverse: 5’- GCCTCACTAAACCATCCAATCGG -3’;
FOS-forward: 5’- GCCTCTCTTACTACCACTCACC -3’;
FOS-reverse: 5’- AGATGGCAGTGACCGTGGGAAT -3’;
MYC-forward: 5’- CCTGGTGCTCCATGAGGAGAC -3’;
MYC-reverse: 5’- CAGACTCTGACCTTTTGCCAGG -3’.
5-Ethynyl uridine (EU) labeling of nascent RNA
The temporally nascent global RNA transcription was detected using the Click-iT® RNA Imaging Kits (Invitrogen, C10329) according to the manuals. Cells were untreated or treated with indicated reagents followed by efficiently incorporation of 5-EU into RNA. images were acquired on a confocal microscope (Zeiss LSM880) and the fluorescence intensity was quantified by Image J (Fiji).
RNA-seq data analysis
For RNA-seq analysis, after removing reads that were potential PCR duplicates, the remaining reads were used for subsequent analysis. The paired-end 150 bp reads were mapped to hg38 reference genome by STAR (v2.7.6) aligner. We used edgeR (v 3.26.5) to identify differentially expressed genes, and spike-in factor was used to normalize library sizes. Graphs were plotted using ggplot2 function in R.
Gene set enrichment and gene ontology analyses
Gene Set Enrichment Analysis (GSEA) was performed using R package ‘clusterProfiler’ (v3.12.0). All detected genes between DMSO and i-CDK9 conditions were ranked from highest to lowest based on log2 fold change (Log2FC) values. This pre-ranked list of genes was used as input for GSEA. We used the differentially expressed genes (DEGs) with an P < 0.01 and Log2FC < (−2) between DMSO and MNNG conditions as a priori defined set of genes. Normalized enrichment scores (NES) and Benjamini-Hochberg (BH) adjusted P value were calculated by a permutation test with 1000 iterations. Gene Ontology (GO) analysis was performed as previously described45.
ChIP-seq data analysis
Single-end 150 bp reads were mapped to hg38 reference genome using Bowtie2 (v2.4.1). Samtools (v1.11) was used to convert file format. Potential PCR duplicates were removed using MarkDuplicates (Picard, REMOVE_DUPLICATES=true). For pausing index (PI) analysis, protein coding genes from GENCODE (v35) were used as the annotated gene set. The sequence from −30 to +300 bp relative to the transcription start site (TSS) was defined as the promoter region and the remaining length of the gene was regarded as the gene body45. We calculated the reads density (reads number/region length) for each region and computed the PI as the ratio of the reads density of the promoter versus the gene body.
Statistics and Reproducibility
All data were derived from at least three independent experiments unless otherwise indicated in the figure legends with similar results. Statistical analyses were performed using a two-tailed unpaired Student’s t-test or as indicated in the figure legends. No statistical method was used to predetermine sample size. No data were excluded from the analyses. The experiments were not randomized. The Investigators were not blinded to allocation during experiments and outcome assessment.
Extended Data
Extended Data Fig. 1. Kinetics of CycT1 recruitment to laser-induced DNA lesions.
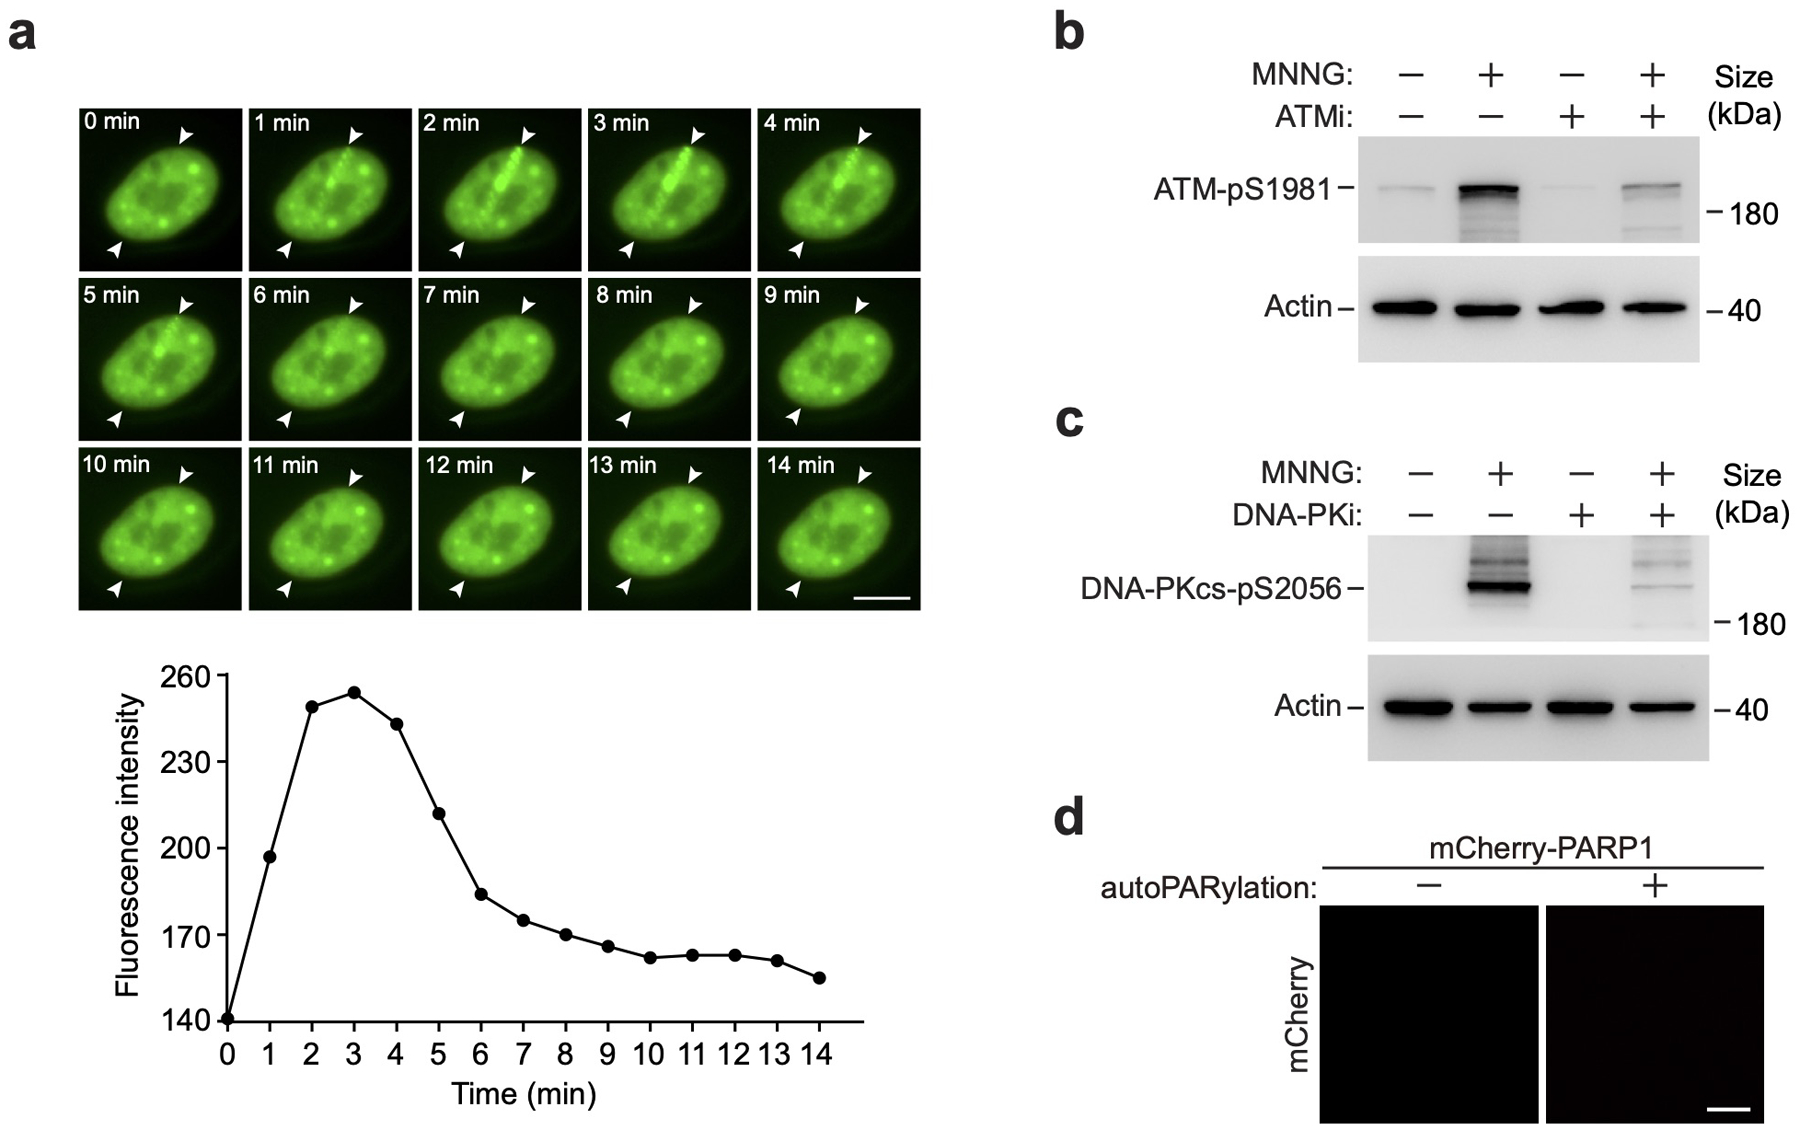
a, HeLa cells expressing GFP-CycT1 were subjected to laser microirradiation and examined with live-cell imaging at the indicated time points. The entry and exit points of the laser beam are indicated by arrowheads. Scale bar = 10 μM. Bottom: The relative intensities of GFP-CycT1 signals at the irradiation sites were measured at the indicated time points. b&c, HeLa cells were untreated or treated with MNNG or/and the inhibitor of ATM (ATMi) (b) or DNA-PK (DNA-PKi) (c) as indicated. Whole cell extracts were analyzed by Western blotting for the indicated proteins. d, Unmodified or in vitro PARylated mCherry-PARP1 (0.1 mg/ml) was subjected to droplet formation assay and examined by fluorescence microscopy for mCherry fluorescence. Scale bar = 10 μM. Experiments in a and d were repeated independently twice with similar results. All Western blots are representative of three independent experiments. Gel source data are available online.
Extended Data Fig. 2. CycT1 but not CDK9 in P-TEFb is PARylated in response to treatment with MNNG.
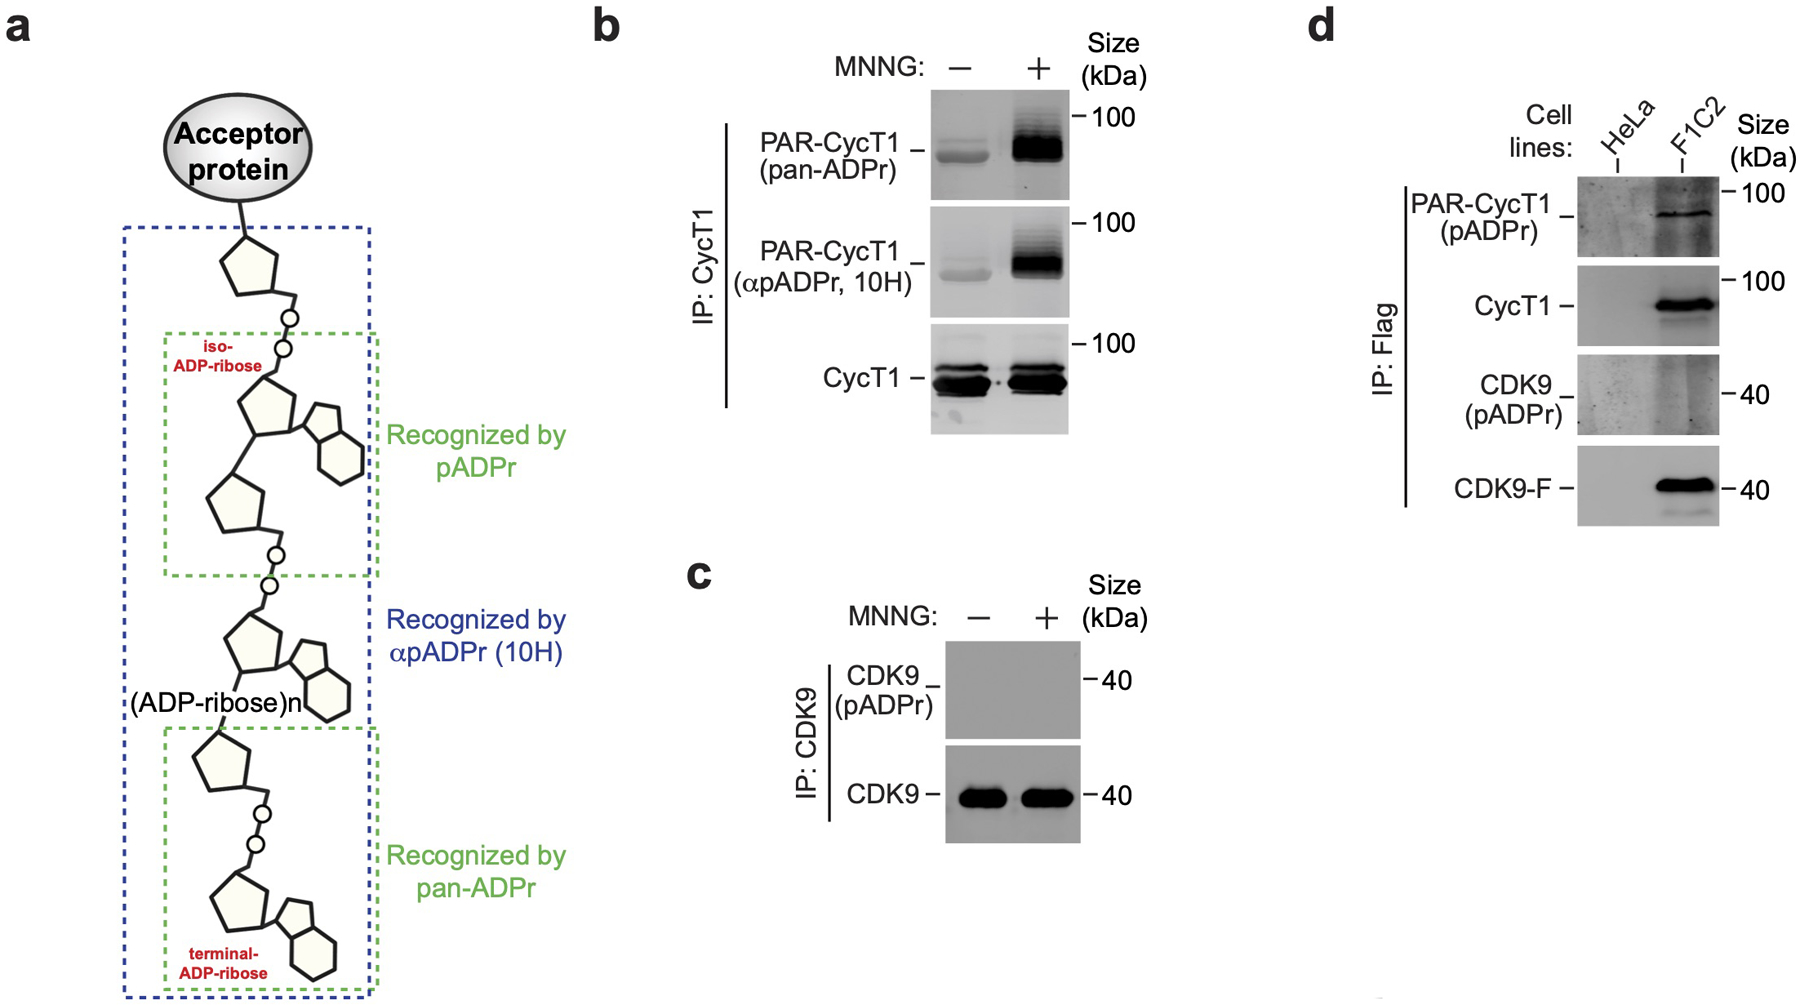
a, Schematic diagram depicting different regions on the PAR polymer that are recognized by pan-ADPr, αpADPr (10H) and pADPr, respectively. b, CycT1 was affinity-purified from HeLa cells either untreated or treated with MNNG and analyzed by Western blotting (WB) with pan-ADPr and αpADPr (10H). c, CDK9 was purified from HeLa cells, which were untreated or treated with MNNG, and analyzed by WB. d, HeLa or F1C2 cells stably expressing CDK9-F were treated with MNNG. Anti-Flag immunoprecipitates (IP) were analyzed by WB for the indicated proteins. All Western blots are representative of three independent experiments. Gel source data are available online.
Extended Data Fig. 3. PARylation of CycT1 depends on PARP1 activation and is dynamically modulated by enzymes controlling PAR synthesis and degradation in response to certain types of DNA damage.
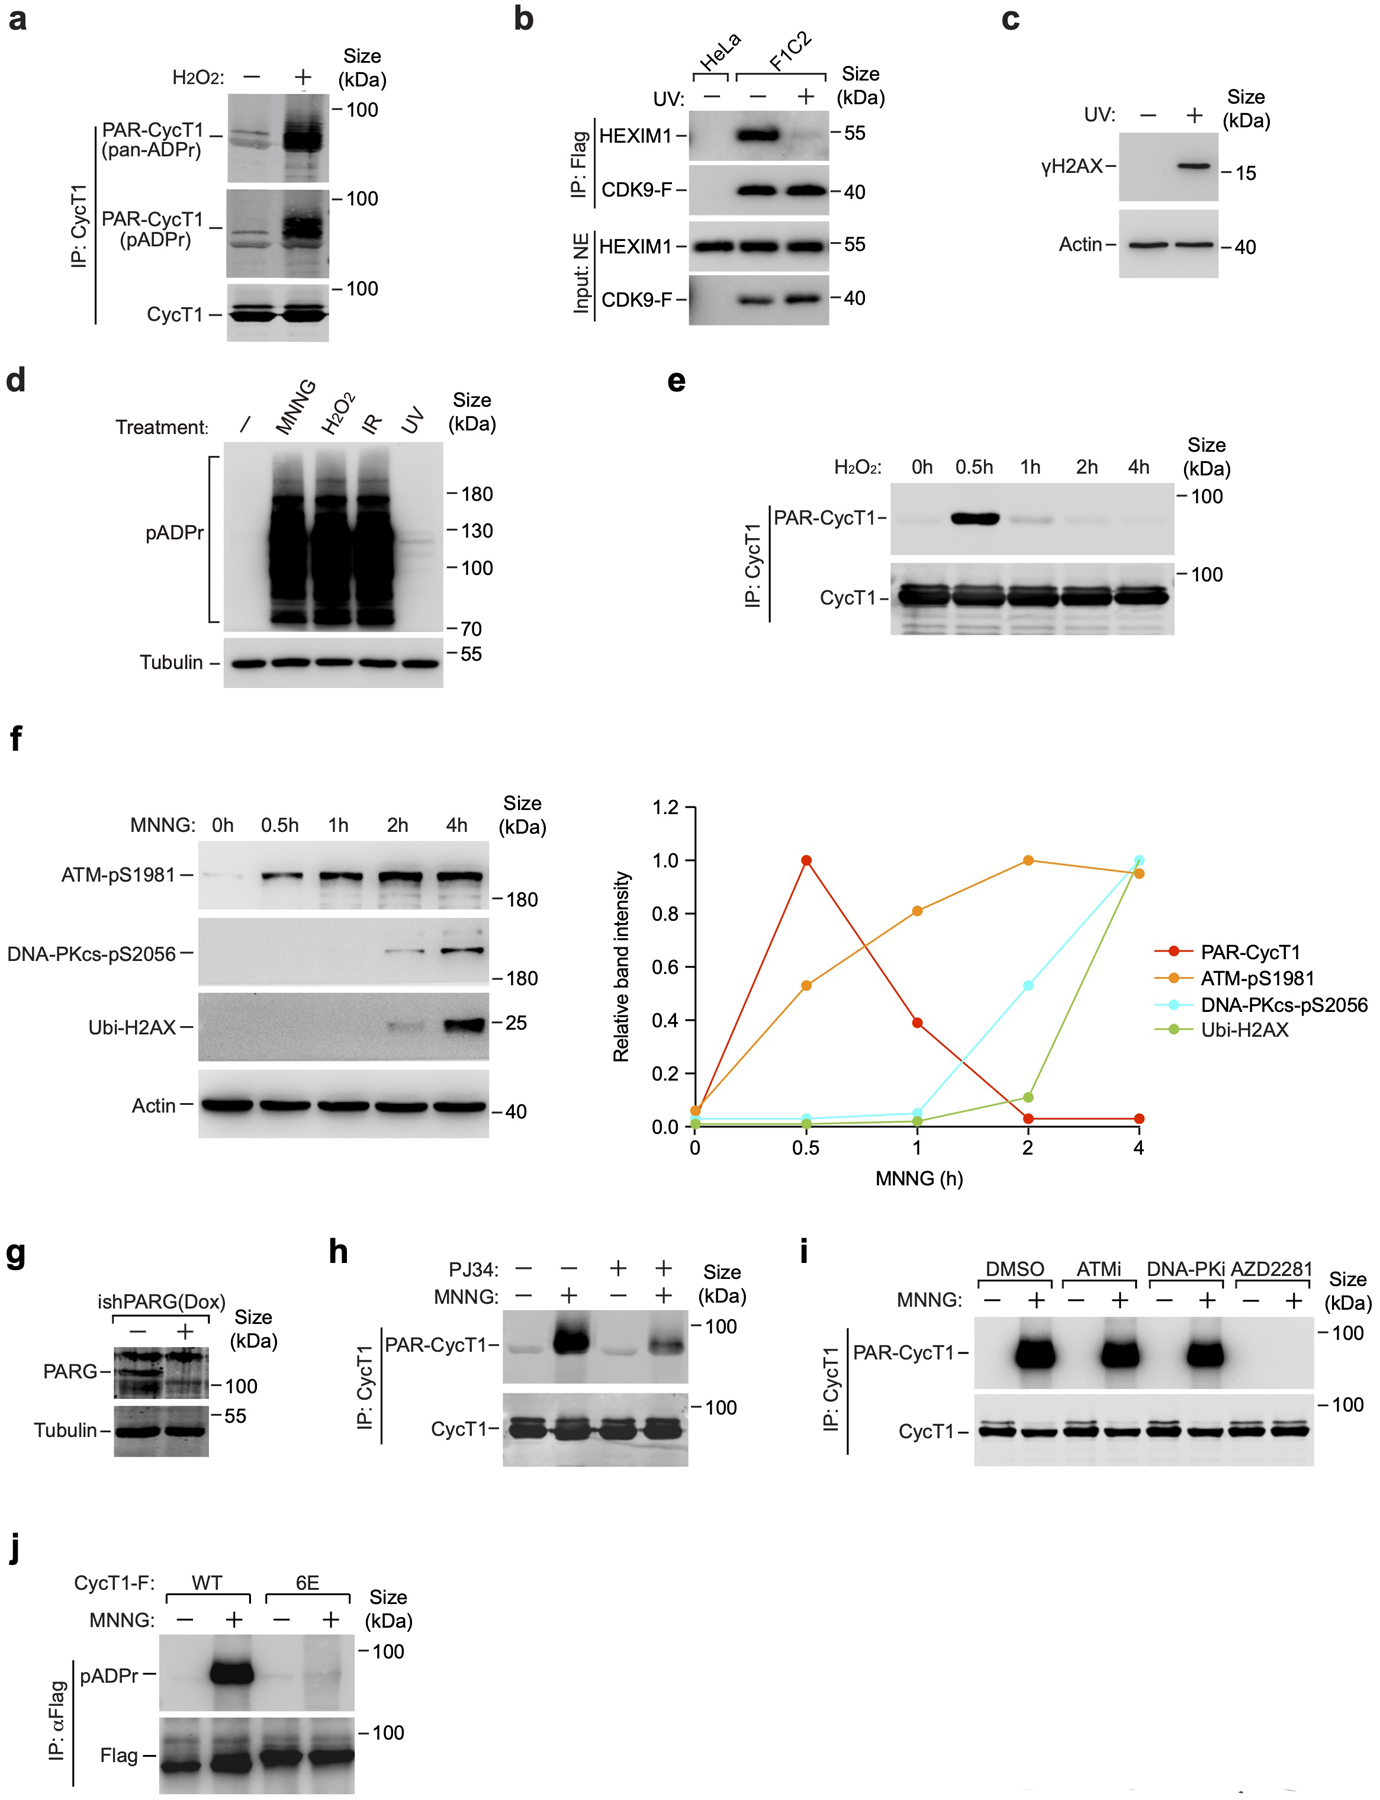
a, CycT1 was affinity-purified from HeLa cells either untreated or treated with H2O2 and analyzed by Western blotting (WB) with pan-ADPr and pADPr. b, HeLa or F1C2 cells stably expressing CDK9-F were either untreated or treated with UV. Nuclear extracts (NE; input) and anti-Flag immunoprecipitates (IP) were analyzed by WB for the indicated proteins. c, Whole cell extracts (WCE) of cells either untreated or treated with UV were analyzed by WB for the indicated proteins. d, WCE of cells treated with the indicated agents were examined by WB with the antibodies marked on the left. e, HeLa cells were untreated or treated with H2O2 for the indicated periods of time. CycT1 immunoprecipitated from WCE were analyzed by WB. f, WCE of cells treated with MNNG for the indicated periods of time were analyzed by WB for the indicated proteins. Right:Quantification of WB signals for the indicated proteins. PAR-CycT1 was quantified based on the signals in Fig. 3c. g, The PARG protein levels in control and PARG knockdown cells were analyzed by WB. h, & i, CycT1 purified from NE of HeLa cells treated with the indicated chemicals were analyzed by WB. j, HeLa cells expressing the indicated CycT1-F proteins were untreated or treated with MNNG. The anti-Flag IP from WCE were analyzed by WB. All Western blots are representative of three independent experiments. Gel source data are available online.
Extended Data Fig. 4. Mutations of D and E residues in CycT1 IDR into A does not diminish MNNG-induced CycT1 PARylation; PARG treatment generates a homogenous pool of MARylated CycT1.
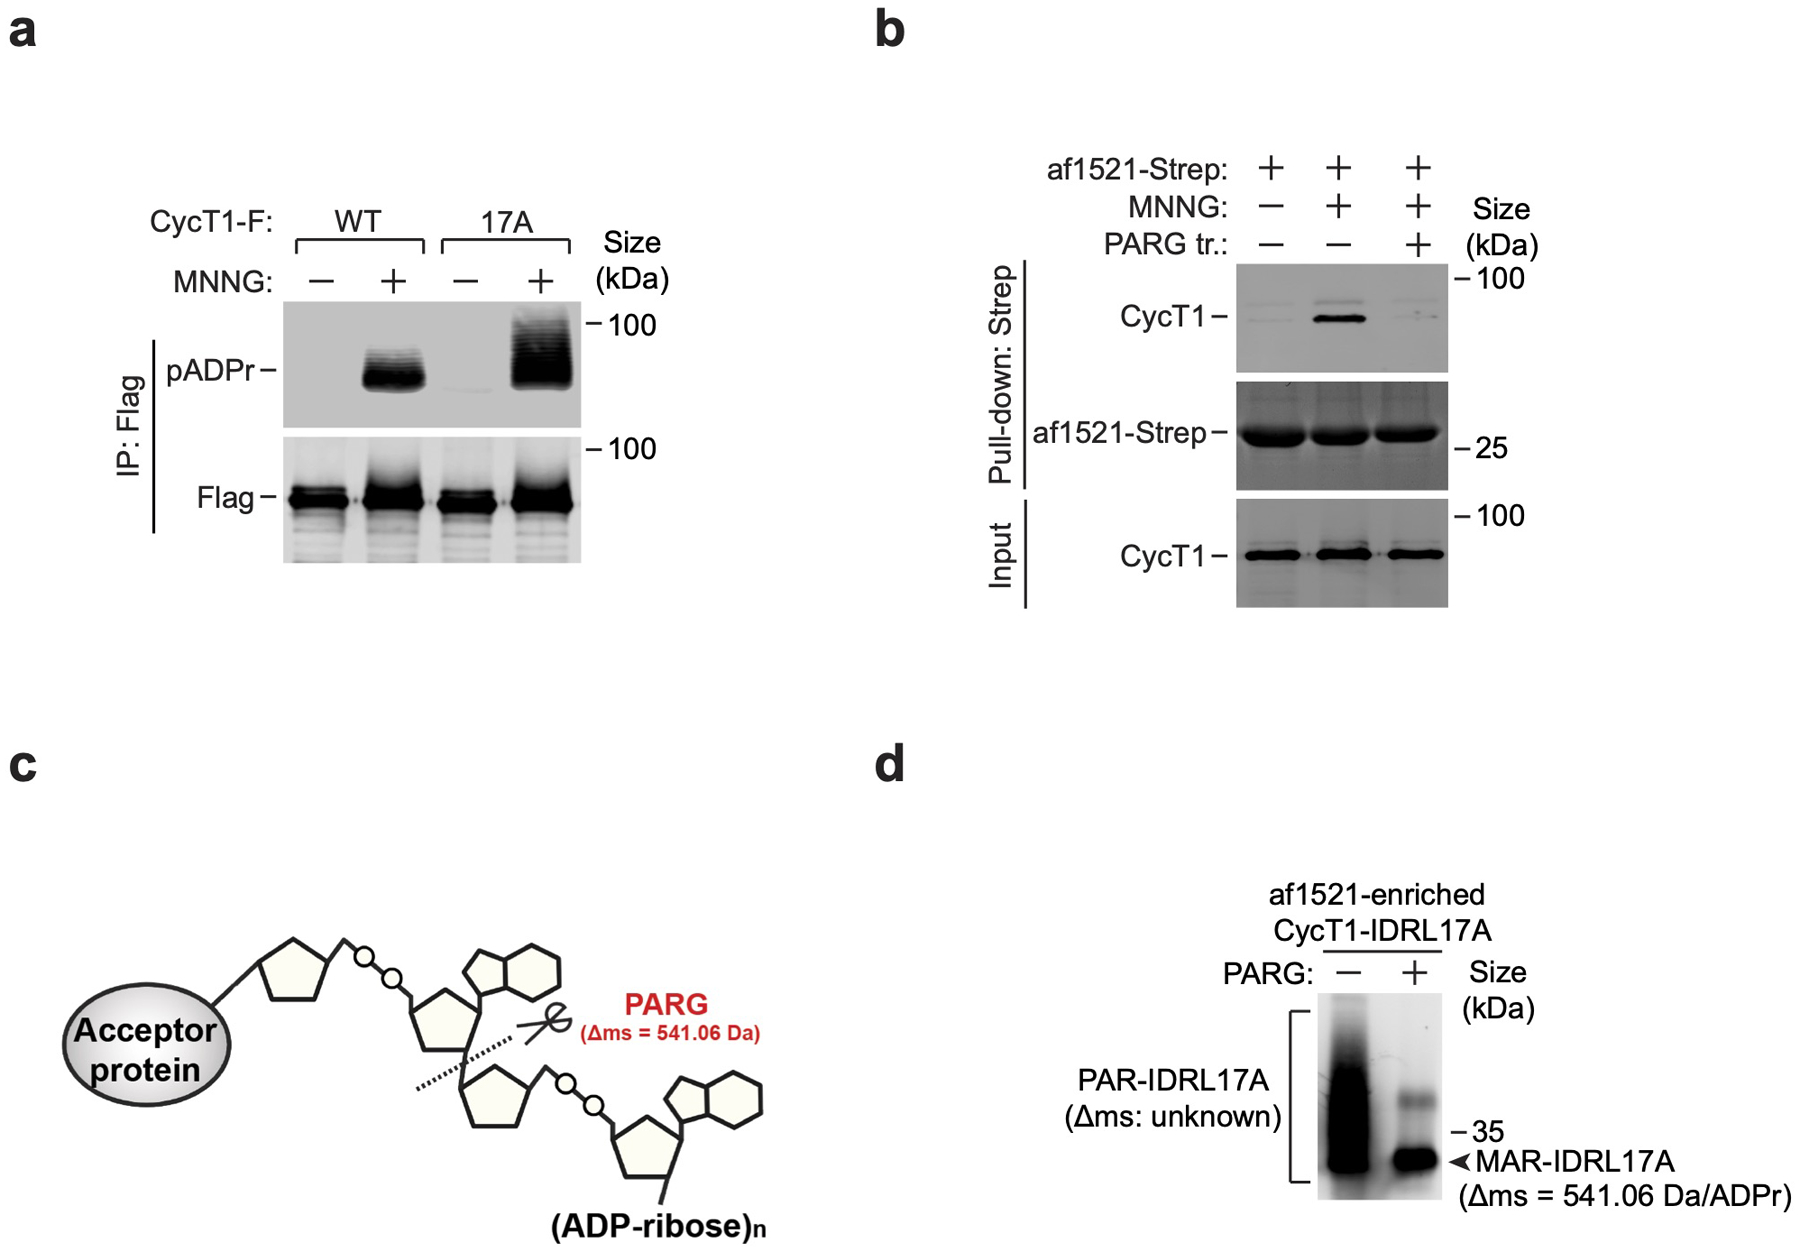
a, HeLa cells expressing the indicated CycT1-F proteins were untreated or treated with MNNG. The anti-Flag immunoprecipitates (IP) from whole cell extracts (WCE) were analyzed by Western blotting (WB). b, The immobilized af1521-Strep was incubated with WCE of HeLa cells untreated or treated with MNNG or/and PARG as indicated. The input and bound proteins were analyzed by WB. c, A schematic representation displaying PARG’s hydrolysis activity toward the PAR chain to leave behind a mono-ADP-ribose unit of 541.06 Dalton (Da). d, The Af1521-enriched CycT1-IDRL17A was untreated or treated with PARG in vitro and then analyzed by WB. All Western blots are representative of three independent experiments. Gel source data are available online.
Extended Data Fig. 5. Identification of CycT1 PARylation sites by ETD LC-MS/MS and mutation of CycT1 PARylation sites doesn’t affect the binding to PAR and P-TEFb partners.
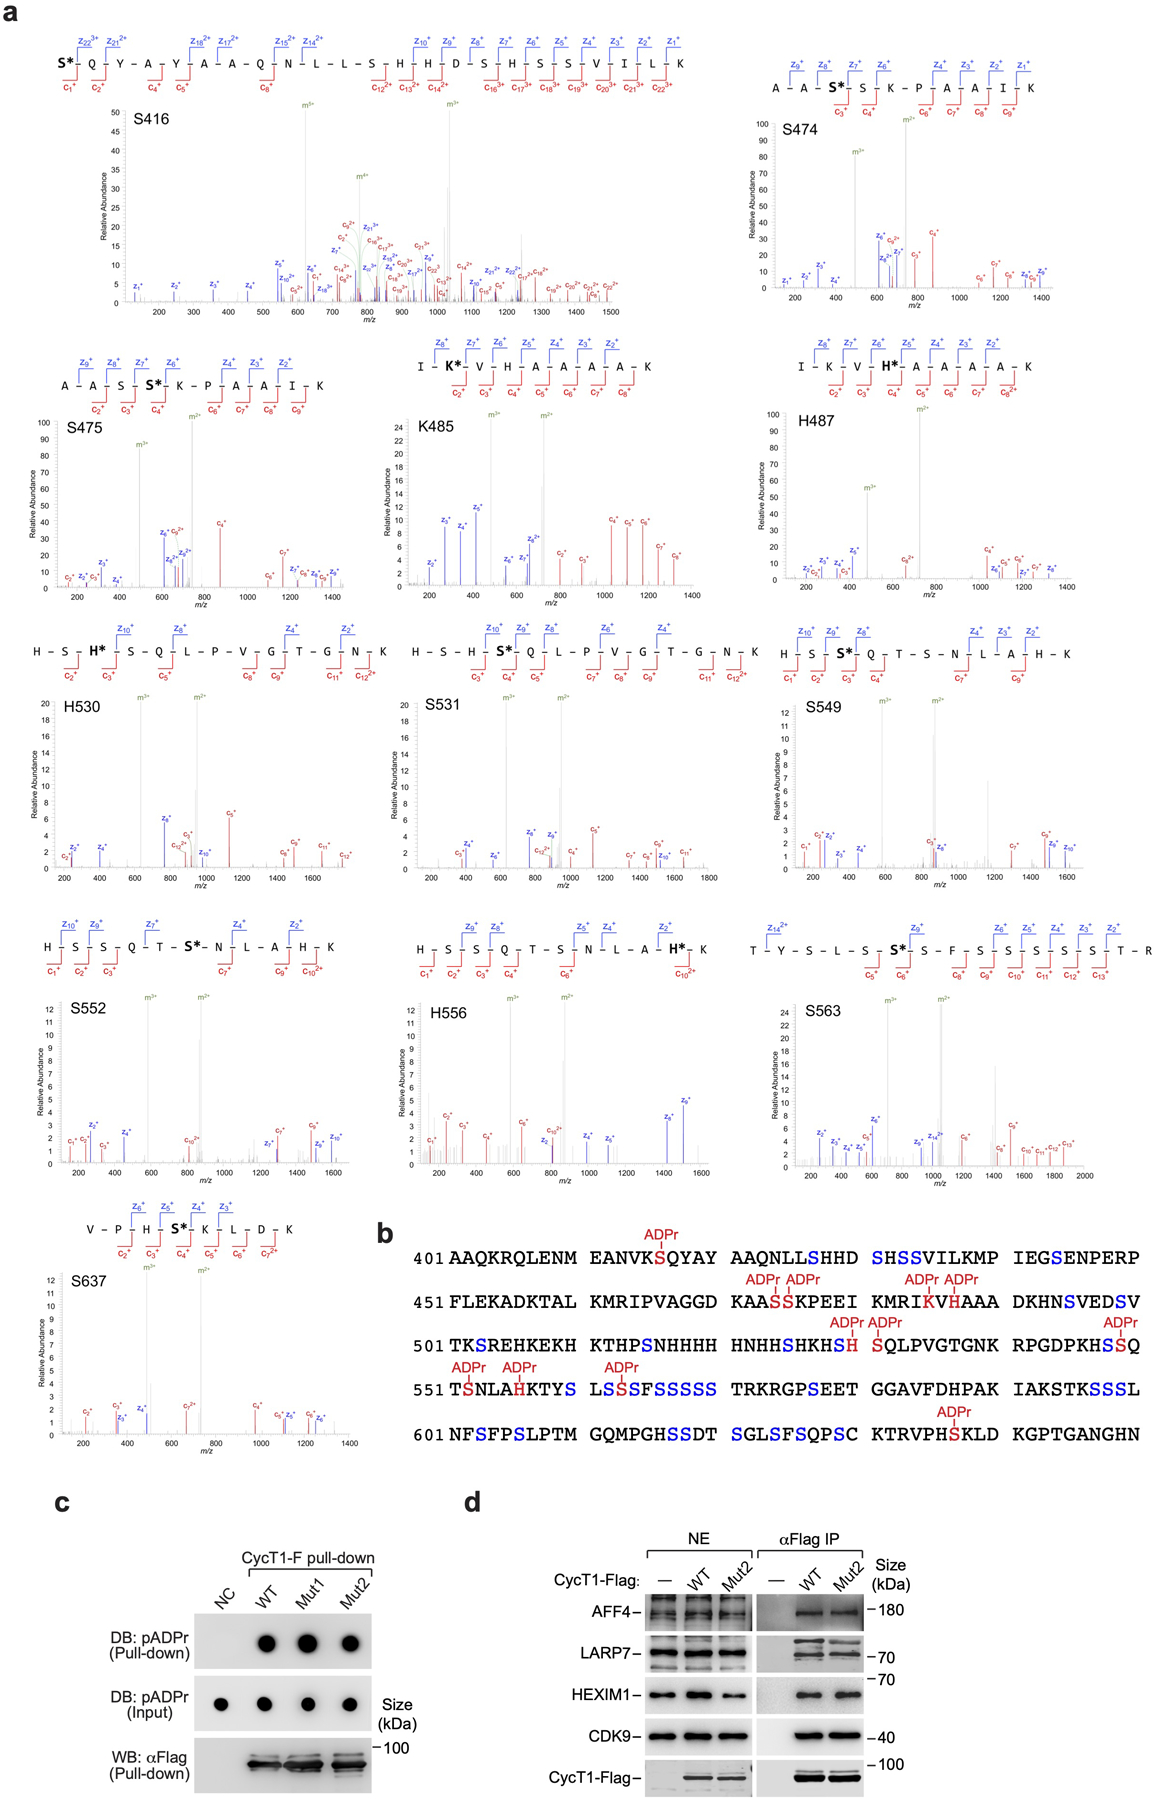
a, The ETD tandem mass spectra of the identified ADP-ribosylated peptides of CycT1, with c-ions and z-ions marked in red and blue, respectively. b, The sequence of the CycT1 IDRL region (aa 401–650) with the 12 identified PARylation sites highlighted in red and the remaining serine residues labeled in blue. c, Purified and immobilized WT or mutant CycT1-F was incubated with autoPARylated PARP1. The input and pull-down proteins were analyzed by Dot blotting (DB) or Western blotting (WB). d, Nuclear extracts (NE) of HeLa cells expressing WT or mutant CycT1-F proteins and anti-Flag immunoprecipitates (IP) from NE were analyzed by WB for the indicated proteins. All Western blots are representative of three independent experiments. Gel source data are available online.
Extended Data Fig. 6. Transcriptionally engaged CycT1 is preferentially targeted for PARylation upon MNNG-induced DNA damage, which inhibits CycT1’s phase separation.
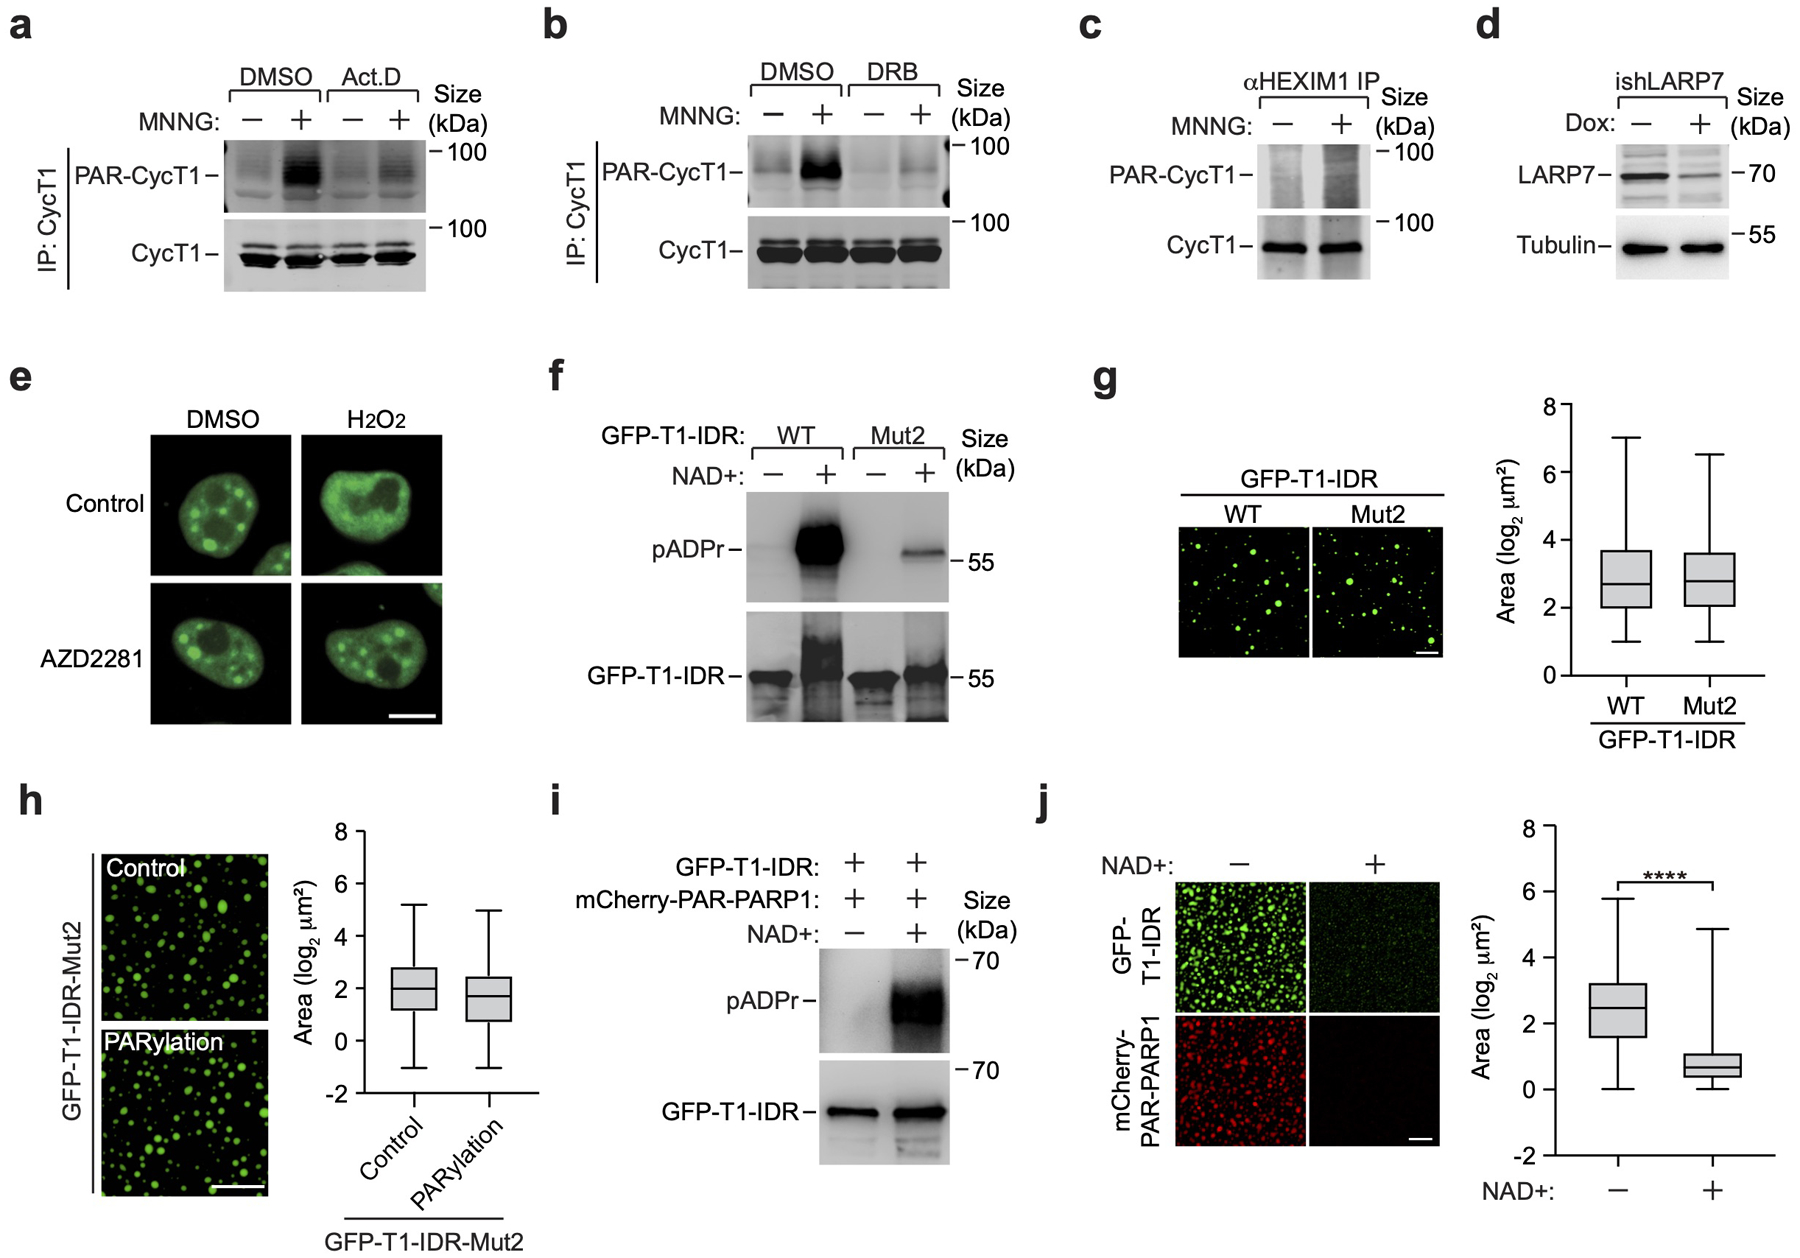
a, & b, CycT1 affinity-purified from whole cell extracts (WCE) of HeLa cells, which were untreated or treated with the indicated chemicals, were analyzed by Western blotting (WB). c, Nuclear extracts (NE) of control or MNNG-treated HeLa cells were subjected to immunoprecipitation with anti-HEXIM1 antibody. The immunoprecipitates (IP) were analyzed by WB. d, The LARP7 protein levels in NE of HeLa cells expressing a LARP7-specific shRNA only in the presence of doxycycline (Dox) were analyzed by WB. e, HeLa cells expressing GFP-CycT1 were untreated (control) or treated with the indicated chemical(s). The distribution patterns of GFP-CycT1 were analyzed by fluorescence microscopy. Scale bar = 10 μM. f, WT and mutant GFP-CycT1-IDR were subjected to in vitro ADP-ribosylation reactions containing NAD+ or not and then analyzed by WB. g, Solutions containing 2 mg/ml of WT or mutant GFP-CycT1-IDR were subjected to droplet formation assay and examined by fluorescence microscopy for GFP signals. Scale bar = 20 μM. Right: Quantification of the sizes of droplets in each group. The box plots show the minimum, first quartile, median, third quartile and maximum with n represents the number of droplets: GFP-CycT1-IDR-WT (n=849), GFP-CycT1-IDR-Mut2 (n=621). h, Solutions containing GFP-CycT1-IDR Mut2 proteins that were in vitro PARylated or not were subjected to droplet formation assay and analyzed as in g. Scale bar = 25 μM. Right: Quantification of the sizes of droplets in each group. The box plots are as described in g with n represents the number of droplets: GFP-CycT1-IDR-Mut2-Control (n=1346), GFP-CycT1-IDR-Mut2-PARylation (n=1371). i, Liquid droplets containing GFP-CycT1-IDR (0.1 mg/ml) and mCherry-PAR-PARP1 (0.025 mg/ml) were incubated with or without NAD+ and then analyzed by WB. j, Samples analyzed in i were further examined by fluorescence microscopy for GFP and mCherry fluorescence signals. Scale bar = 25 μM. Right: Quantification of the sizes of droplets in each group. The box plots are as described in g with n represents the number of droplets: GFP-CycT1-IDR −NAD+ (n=1410), GFP-CycT1-IDR +NAD+ (n=2483); statistical analysis was performed using two-tailed unpaired t-tests; ****P < 0.0001. Experiment in e was repeated independently three times with similar results. g, h, j, Data are representative of three independent experiments with similar results. All Western blots are representative of three independent experiments. Gel source data are available online.
Extended Data Fig. 7. MNNG/H2O2-induced CycT1 PARylation inhibits P-TEFb’s transcriptional elongation activity.
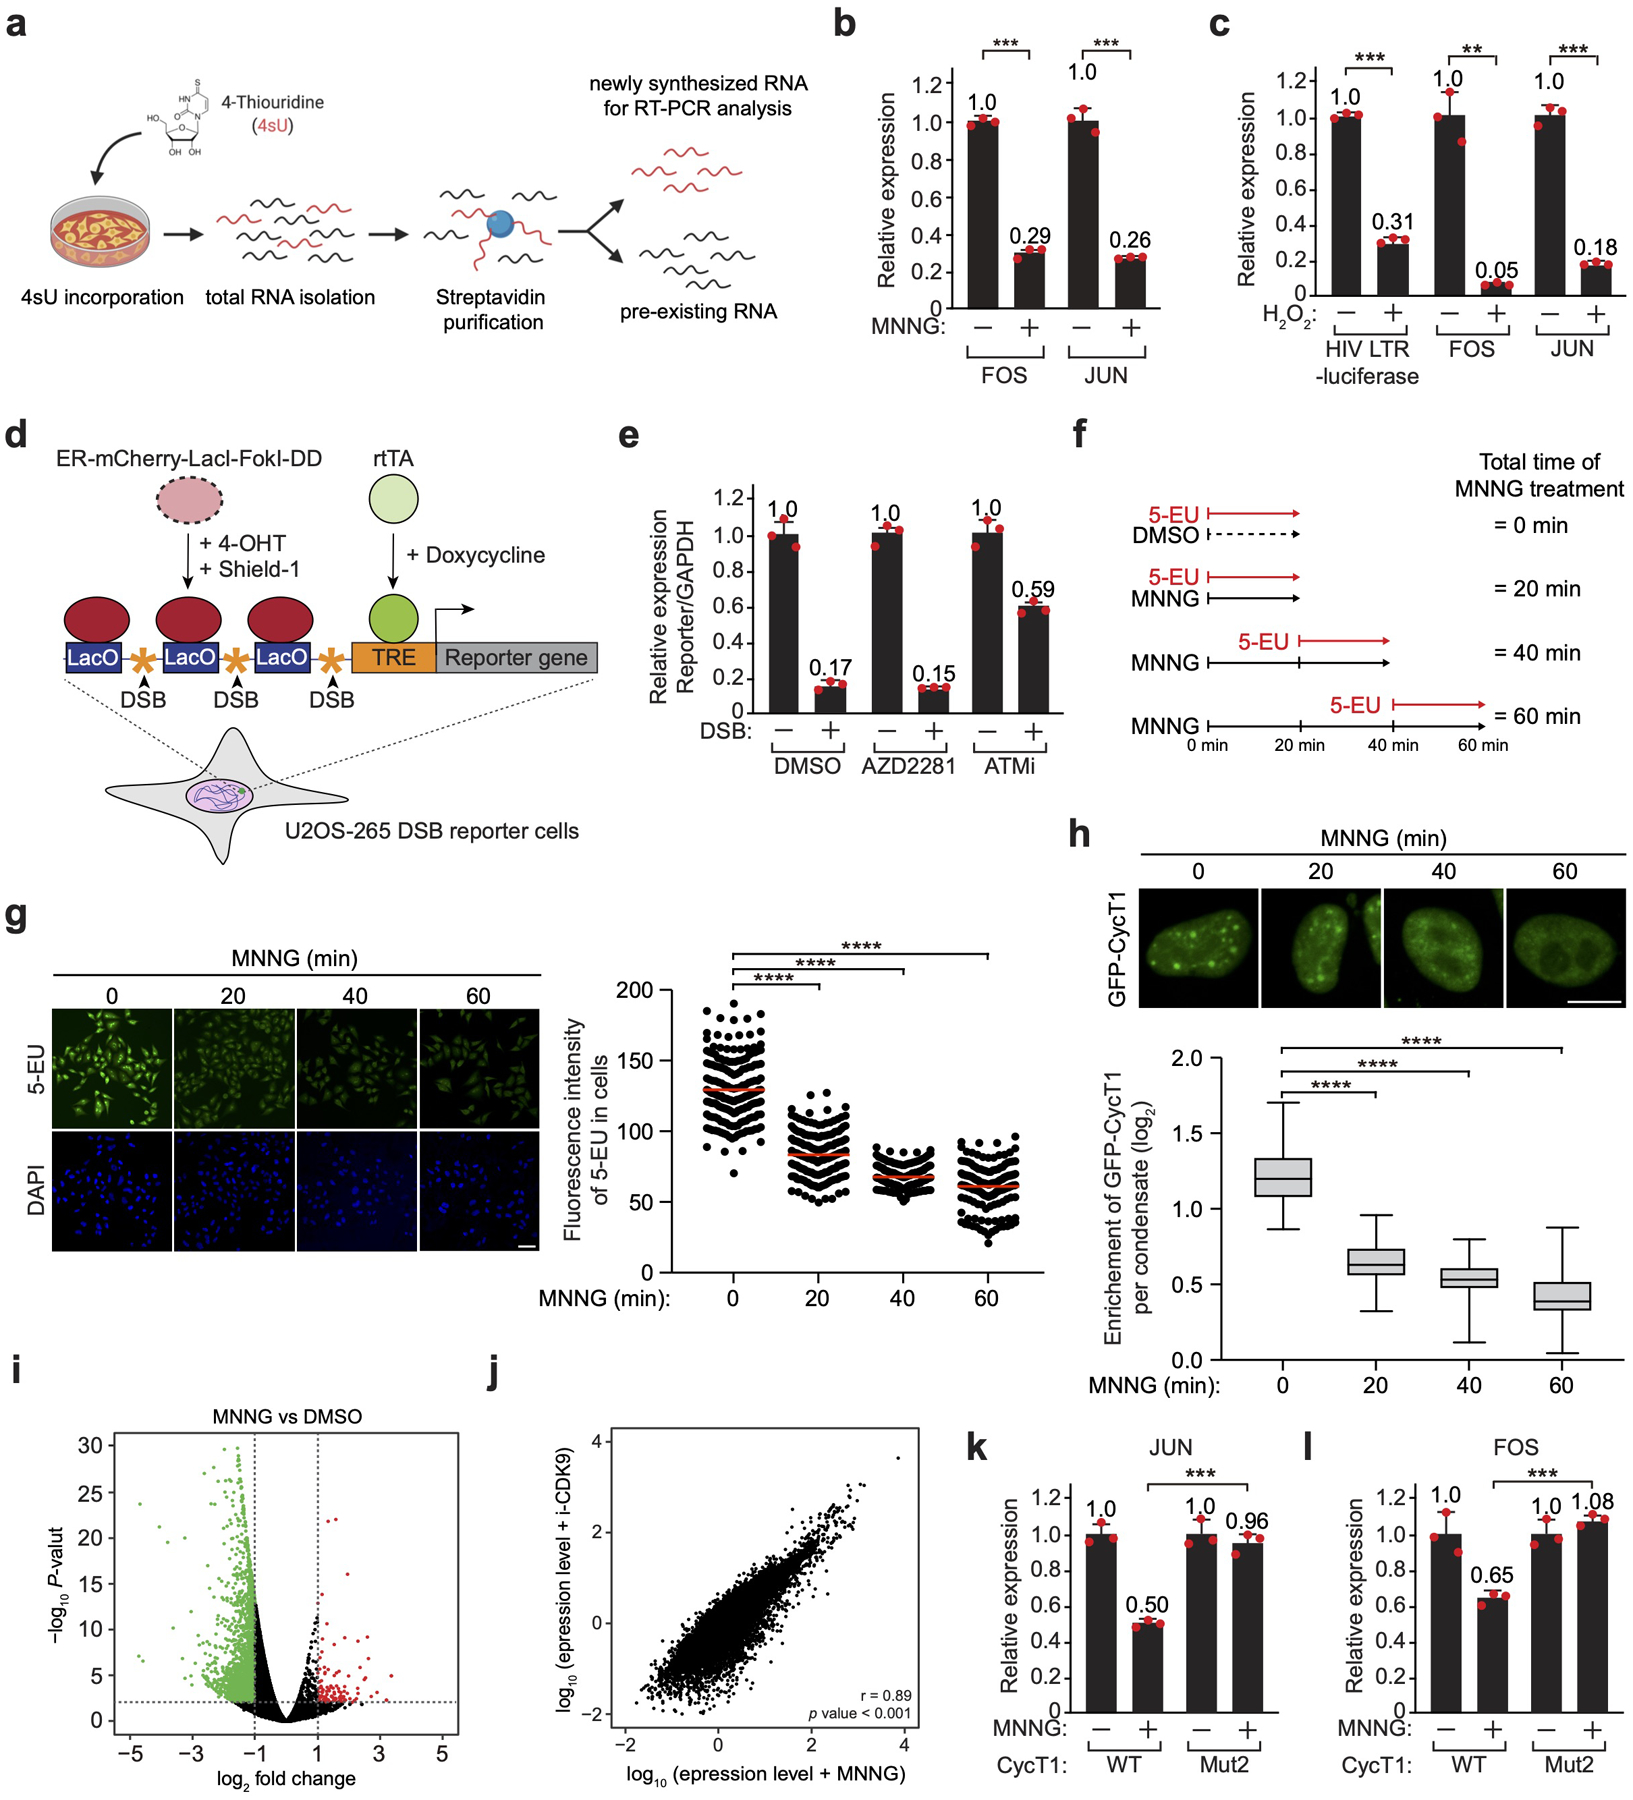
a, A procedure for isolating newly synthesized, 4-thiouridine (4sU)-labeled RNA for subsequent analysis by real-time RT-PCR. b, Transcription from the cellular FOS and JUN gene promoters in untreated or MNNG-treated cells was investigated by 4sU-labeling followed by qRT-PCR. The mRNA levels in untreated cells were artificially set to 1.0. The error bars indicate mean ± s.d. with n = 3 biologically independent samples; statistical analysis was performed using two-tailed unpaired t-tests; ***P < 0.001. c, Transcription from the promoters of HIV-1, FOS and JUN in untreated or H2O2-treated cells was analyzed as in b. The error bars indicate mean ± s.d. with n = 3 biologically independent samples; statistical analysis was performed using two-tailed unpaired t-tests; ***P < 0.001; **P = 0.0085. d, A diagram of double strand break (DSB) induction in U2OS-265 cells. ER-mCherry-LacI-FokI-DD is stabilized and directed to LacO repeats to introduce DSBs by the addition of Shield-1 and 4-OH. Transcription of the reporter gene is induced with Doxycycline after DSB induction. e, Transcription from the reporter and GAPDH gene promoters in untreated or DSB-induced cells was measured by qRT-PCR (mean ± s.d., n = 3 biologically independent samples) and the ratios of “Reporter gene vs. GAPDH” are shown. The signals were normalized to non-DSB conditions, which were set to 1.0. f, A diagram illustrating the experimental design involving the incubation with MNNG for the indicated periods of time with the last 20 min of the incubation performed also in the presence of 5-EU to label the newly synthesized. g, HeLa cells were untreated or treated with MNNG for the indicated time periods. Newly synthesized RNA was labeled with 5-EU following the scheme in d and then detected using Alexa fluor 488. Scale bar = 50 μM. Right: Quantification of the 5-EU fluorescence intensity per cell. Red lines indicate the mean 5-EU intensity in each group. n represents the number of cells examined in a representative assay out of 3 independent experiments: MNNG 0 min (n=181), MNNG 20 min (n=181), MNNG 40 min (n=180), MNNG 60 min (n=183); statistical analysis was performed using two-tailed unpaired t-tests; ****P < 0.0001. h, HeLa cells expressing GFP-CycT1 were treated with MNNG for the indicated time periods and examined by fluorescence microscopy. Scale bar = 10 μM. Bottom: Quantification of the enrichment of GFP-CycT1, which is calculated as the ratio of mean fluorescence intensity per nuclear condensate versus the mean fluorescence intensity of the entire cell nucleus. The box plots show the minimum, first quartile, median, third quartile and maximum with n represents the number of cells examined in a representative assay out of 3 independent experiments: MNNG 0 min (n=71), MNNG 20 min (n=84), MNNG 40 min (n=67), MNNG 60 min (n=65); statistical analysis was performed using two-tailed unpaired t-tests; ****P < 0.0001. i, Volcano plot showing differential gene expression based on genome-wide sequencing of 4sU-labeled RNA in DMSO- or MNNG-treated cells. The negative log10 p-values test the significance of enrichment (y axis) and are plotted against the average log2 fold changes in expression (x axis). Genes not differentially expressed are displayed as black dots. Colored dots are genes showing at least 2-fold changes (red indicates increase and green decrease) in expression with p-values less than 0.01. p-values were determined using Fisher's exact test. j, Scatterplot of log10 fold changes in the expression of genes in MNNG- versus i-CDK9-treated cells. The r value denotes the Pearson correlation coefficient; and the p value (< 2.2e-16) displays statistical significance of the correlation as calculated by two-tailed test. k, & l, HeLa cells were depleted of CycT1 and reconstituted with WT or Mut2 CycT1. Transcription from the JUN (k) and FOS (l) gene promoters in untreated or MNNG-treated cells was investigated by 4sU-labeling followed by qRT-PCR analysis. The mRNA levels in untreated cells were artificially set to 1.0. The error bars indicate mean ± s.d. with n = 3 biologically independent samples; statistical analysis was performed using two-tailed unpaired t-tests; ***P < 0.001.
Extended Data Fig. 8. NELF-E, NuRD, ATM, and DNA-PK are not involved in transcriptional silencing induced by MNNG.
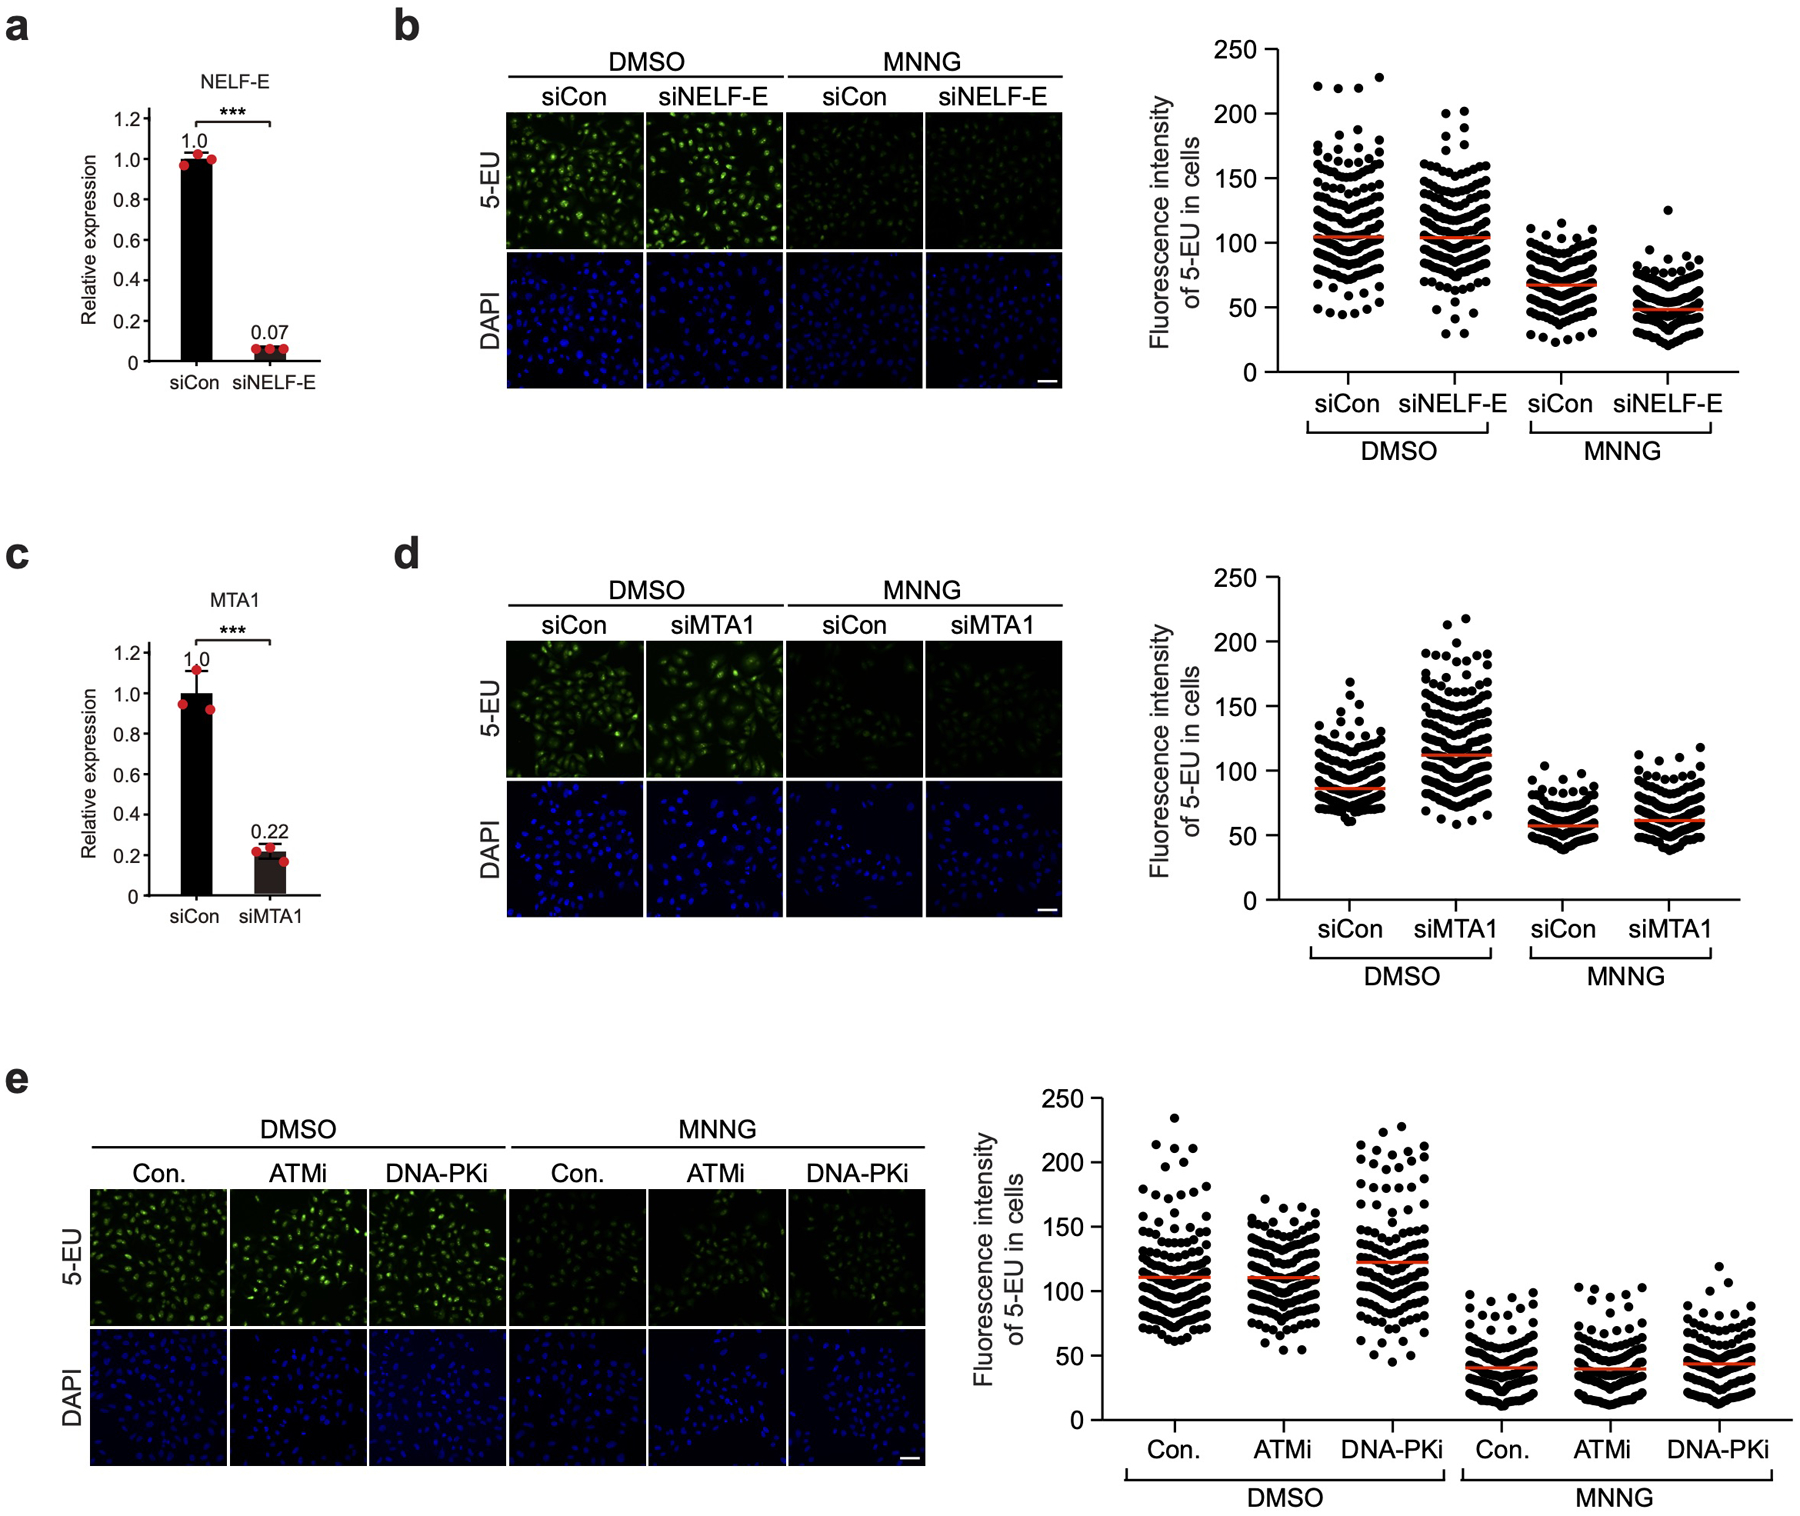
a, & c, HeLa cells were transfected with the siRNA targeting NELF-E (a) or MTA1 (a NuRD subunit, c) and harvested at 72 hr post-transfection to examine the mRNA levels of NELF-E (a) and MTA1 (c) by qRT-PCR analysis. The error bars indicate mean ± s.d. with n = 3 biologically independent samples; statistical analysis was performed using two-tailed unpaired t-tests; ***P < 0.001. b, & d, HeLa cells were transfected with control siRNA (siCon) or a specific siRNA targeting NELF-E (b) or MTA1 (d) and then treated with DMSO or MNNG as indicated. Newly synthesized RNA was labeled with 5-EU and detected using Alexa fluor 488. Scale bar = 50 μM. Right: Quantification of the 5-EU fluorescence intensity per cell. Red lines indicate the mean 5-EU intensity in each group. n represents the number of cells examined in a representative assay out of 3 independent experiments: DMSO siCon in b (n=189), DMSO siNELF-E (n=170), MNNG siCon in b (n=157), MNNG siNELF-E (n=190), DMSO siCon in d (n=203), DMSO siMTA1 (n=205), MNNG siCon in d (n=198), MNNG siMTA1 (n=193). e, HeLa cells were untreated or pre-treated with ATMi or DNA-PKi and then treated with DMSO or MNNG as indicated. Newly synthesized RNA was detected and quantified as in b. Scale bar = 50 μM. Right: Quantification of the 5-EU fluorescence intensity per cell. Red lines indicate the mean 5-EU intensity in each group. n represents the number of cells examined in a representative assay out of 3 independent experiments: DMSO-Control (n=158), DMSO-ATMi (n=160), DMSO-DNAPKi (n=133), MNNG-Control (n=152), MNNG-ATMi (n=144), MNNG- DNAPKi (n=149).
Extended Data Fig. 9. PARP1 activity is required to promote DNA repair and cell survival upon DNA damage.
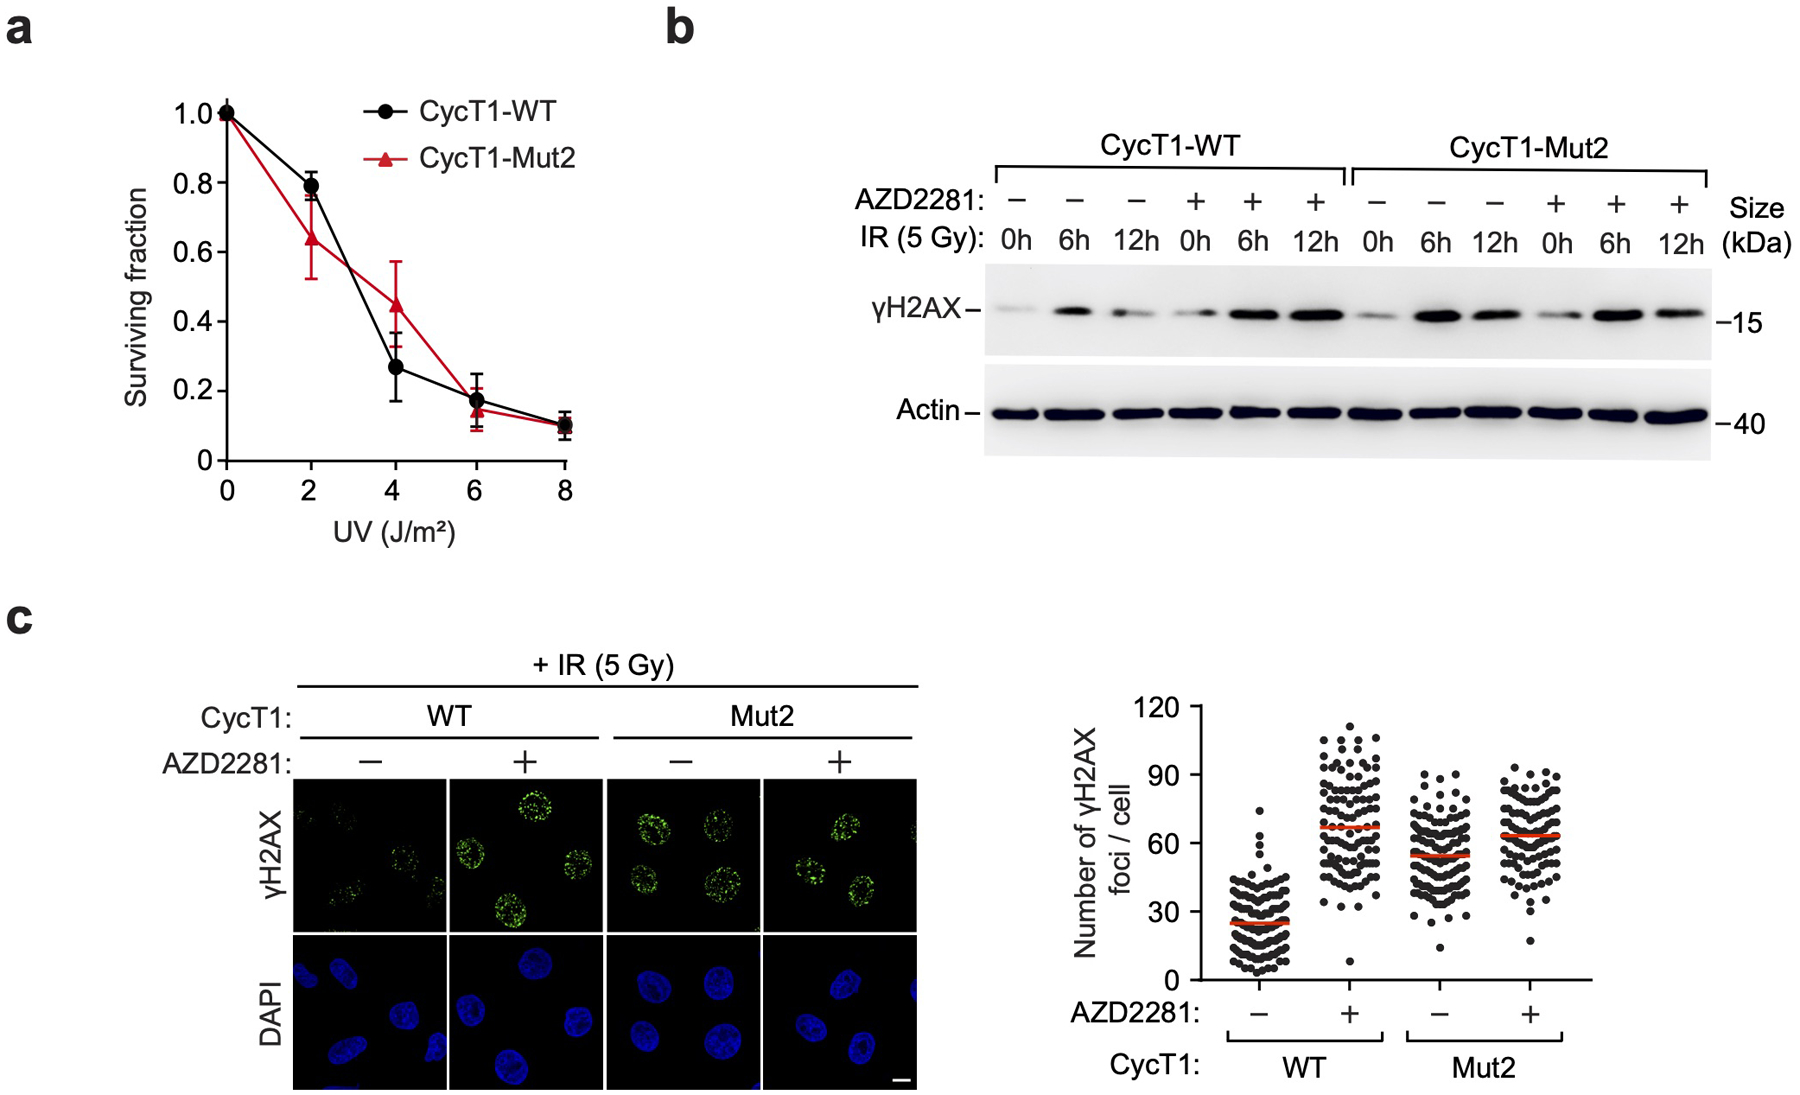
a, HeLa cells were depleted of CycT1 and reconstituted with WT or Mut2 CycT1. Cell viability was measured before or after the exposure to the indicated doses of UV. The error bars indicate mean ± s.d. with n = 3 biologically independent samples. b, Control or AZD2281-treated HeLa cells depleted of CycT1 and reconstituted with WT or Mut2 CycT1 were either mock treated or treated with IR (5Gy) and allowed to recover for the indicated time periods. WCE was examined by WB to detect γH2AX and actin. c, Control or AZD2281-treated HeLa cells depleted of CycT1 and reconstituted with WT or Mut2 CycT1 were analyzed by immunofluorescence staining at 12 hr after IR (5Gy) treatment with the anti-γH2AX antibody. DNA was counterstained by DAPI. Scale bar = 10 μM. Right: Quantification of the number of γH2AX foci per cell. Red lines indicate the mean γH2AX foci in each cell populations. n represents the number of cells examined in a representative assay out of 3 independent experiments: CycT1-WT-DMSO (n=148), CycT1-WT-AZD2281 (n=110), CycT1-Mut2-DMSO (n=138), CycT1-Mut2-AZD2281 (n=110). All Western blots are representative of three independent experiments. Gel source data are available online.
Extended Data Fig. 10. A working model.
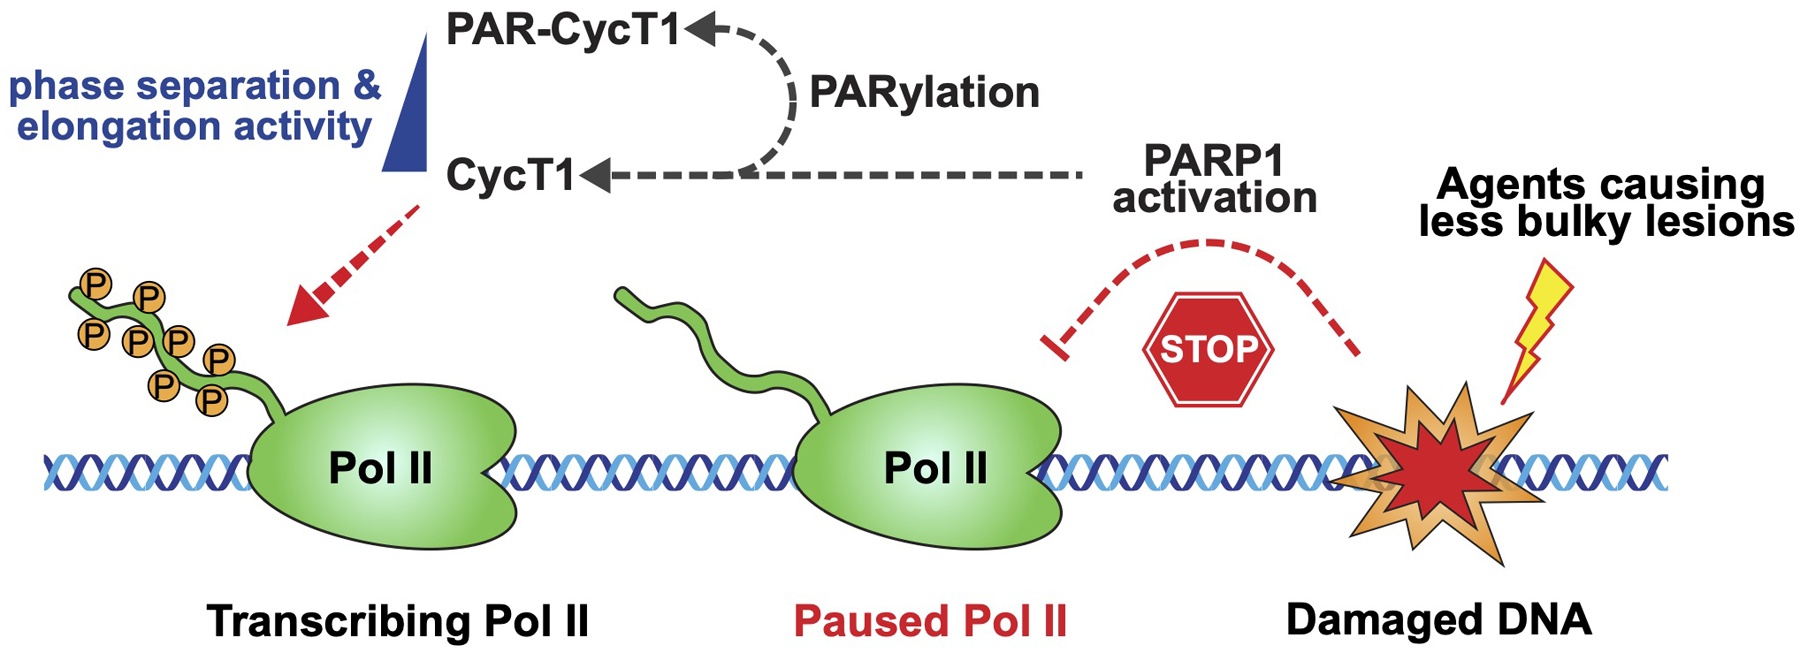
A model illustrating how the PARP1-CycT1 signaling pathway senses base lesions or strand breaks caused by certain DNA damaging agents and induces CycT1 PARylation to inhibit P-TEFb phase separation and P-TEFb-dependent Pol II elongation.
Supplementary Material
Acknowledgements
We thank Drs. R. Greenberg, E. Song, D. Yin, D. Xu and their colleagues for kindly providing the DSB reporter cell line and other valuable reagents, and L. Li, B. Yang and K. Yuan for excellent suggestions, discussions, and technical assistance. This work was supported in part by the National Natural Science Foundation of China (grants 92053114, 32070632 to H.L. and 81672955 to Y.X.), Zhejiang Provincial Natural Science Foundation of China (grant LR21C060002) to H.L., the Xiamen Southern Oceanographic Center (grant 17GYY002NF02) to X.G., and the National Institutes of Health (grant R01AI41757) to Q.Z.
Footnotes
Competing interests
The authors declare no competing interests.
Data availability
Source data are provided with this study. The raw sequencing data generated in this study have been deposited in the Genome Sequence Archive of The National Genomics Data Center, China National Center for Bioinformation / Beijing Institute of Genomics, Chinese Academy of Sciences (accession number: HRA000946) that are publicly accessible at https://ngdc.cncb.ac.cn/gsa-human. Mass spectrometry data have been deposited in ProteomeXchange with the dataset identifier PXD031109. All other data supporting the findings of this study are available from the corresponding author on reasonable request.
References
- 1.Kwak H & Lis JT Control of transcriptional elongation. Annu Rev Genet 47, 483–508 (2013). [DOI] [PMC free article] [PubMed] [Google Scholar]
- 2.Zhou Q, Li T & Price DH RNA polymerase II elongation control. Annu Rev Biochem 81, 119–143 (2012). [DOI] [PMC free article] [PubMed] [Google Scholar]
- 3.Cramer P Organization and regulation of gene transcription. Nature 573, 45–54 (2019). [DOI] [PubMed] [Google Scholar]
- 4.Banani SF, Lee HO, Hyman AA & Rosen MK Biomolecular condensates: organizers of cellular biochemistry. Nat Rev Mol Cell Biol 18, 285–298 (2017). [DOI] [PMC free article] [PubMed] [Google Scholar]
- 5.Shin Y & Brangwynne CP Liquid phase condensation in cell physiology and disease. Science 357 (2017). [DOI] [PubMed] [Google Scholar]
- 6.Hnisz D, Shrinivas K, Young RA, Chakraborty AK & Sharp PA A Phase Separation Model for Transcriptional Control. Cell 169, 13–23 (2017). [DOI] [PMC free article] [PubMed] [Google Scholar]
- 7.Chong S et al. Imaging dynamic and selective low-complexity domain interactions that control gene transcription. Science 361 (2018). [DOI] [PMC free article] [PubMed] [Google Scholar]
- 8.Guo YE et al. Pol II phosphorylation regulates a switch between transcriptional and splicing condensates. Nature 572, 543–548 (2019). [DOI] [PMC free article] [PubMed] [Google Scholar]
- 9.Sabari BR et al. Coactivator condensation at super-enhancers links phase separation and gene control. Science 361 (2018). [DOI] [PMC free article] [PubMed] [Google Scholar]
- 10.Plys AJ et al. Phase separation of Polycomb-repressive complex 1 is governed by a charged disordered region of CBX2. Genes Dev 33, 799–813 (2019). [DOI] [PMC free article] [PubMed] [Google Scholar]
- 11.Lu Y et al. Phase separation of TAZ compartmentalizes the transcription machinery to promote gene expression. Nat Cell Biol 22, 453–464 (2020). [DOI] [PMC free article] [PubMed] [Google Scholar]
- 12.Lu H et al. Phase-separation mechanism for C-terminal hyperphosphorylation of RNA polymerase II. Nature 558, 318–323 (2018). [DOI] [PMC free article] [PubMed] [Google Scholar]
- 13.Jackson SP & Bartek J The DNA-damage response in human biology and disease. Nature 461, 1071–1078 (2009). [DOI] [PMC free article] [PubMed] [Google Scholar]
- 14.Gregersen LH & Svejstrup JQ The Cellular Response to Transcription-Blocking DNA Damage. Trends Biochem Sci 43, 327–341 (2018). [DOI] [PMC free article] [PubMed] [Google Scholar]
- 15.Lans H, Hoeijmakers JHJ, Vermeulen W & Marteijn JA The DNA damage response to transcription stress. Nat Rev Mol Cell Biol 20, 766–784 (2019). [DOI] [PubMed] [Google Scholar]
- 16.Saxowsky TT & Doetsch PW RNA polymerase encounters with DNA damage: transcription-coupled repair or transcriptional mutagenesis? Chem Rev 106, 474–488 (2006). [DOI] [PubMed] [Google Scholar]
- 17.Oh J, Xu J, Chong J & Wang D Structural and biochemical analysis of DNA lesion-induced RNA polymerase II arrest. Methods 159–160, 29–34 (2019). [DOI] [PMC free article] [PubMed] [Google Scholar]
- 18.Shanbhag NM, Rafalska-Metcalf IU, Balane-Bolivar C, Janicki SM & Greenberg RA ATM-dependent chromatin changes silence transcription in cis to DNA double-strand breaks. Cell 141, 970–981 (2010). [DOI] [PMC free article] [PubMed] [Google Scholar]
- 19.Ui A, Nagaura Y & Yasui A Transcriptional elongation factor ENL phosphorylated by ATM recruits polycomb and switches off transcription for DSB repair. Mol Cell 58, 468–482 (2015). [DOI] [PubMed] [Google Scholar]
- 20.Pankotai T, Bonhomme C, Chen D & Soutoglou E DNAPKcs-dependent arrest of RNA polymerase II transcription in the presence of DNA breaks. Nat Struct Mol Biol 19, 276–282 (2012). [DOI] [PubMed] [Google Scholar]
- 21.Kakarougkas A et al. Requirement for PBAF in transcriptional repression and repair at DNA breaks in actively transcribed regions of chromatin. Mol Cell 55, 723–732 (2014). [DOI] [PMC free article] [PubMed] [Google Scholar]
- 22.Caron P et al. WWP2 ubiquitylates RNA polymerase II for DNA-PK-dependent transcription arrest and repair at DNA breaks. Genes Dev 33, 684–704 (2019). [DOI] [PMC free article] [PubMed] [Google Scholar]
- 23.Beli P et al. Proteomic investigations reveal a role for RNA processing factor THRAP3 in the DNA damage response. Mol Cell 46, 212–225 (2012). [DOI] [PMC free article] [PubMed] [Google Scholar]
- 24.Awwad SW, Abu-Zhayia ER, Guttmann-Raviv N & Ayoub N NELF-E is recruited to DNA double-strand break sites to promote transcriptional repression and repair. EMBO Rep 18, 745–764 (2017). [DOI] [PMC free article] [PubMed] [Google Scholar]
- 25.Chaudhuri AR & Nussenzweig A The multifaceted roles of PARP1 in DNA repair and chromatin remodelling. Nat Rev Mol Cell Bio 18, 610–621 (2017). [DOI] [PMC free article] [PubMed] [Google Scholar]
- 26.Langelier MF, Planck JL, Roy S & Pascal JM Structural basis for DNA damage-dependent poly(ADP-ribosyl)ation by human PARP-1. Science 336, 728–732 (2012). [DOI] [PMC free article] [PubMed] [Google Scholar]
- 27.Bai P Biology of Poly(ADP-Ribose) Polymerases: The Factotums of Cell Maintenance. Mol Cell 58, 947–958 (2015). [DOI] [PubMed] [Google Scholar]
- 28.Petesch SJ & Lis JT Activator-induced spread of poly(ADP-ribose) polymerase promotes nucleosome loss at Hsp70. Mol Cell 45, 64–74 (2012). [DOI] [PMC free article] [PubMed] [Google Scholar]
- 29.Slade D et al. The structure and catalytic mechanism of a poly(ADP-ribose) glycohydrolase. Nature 477, 616–620 (2011). [DOI] [PMC free article] [PubMed] [Google Scholar]
- 30.Gupte R, Liu Z & Kraus WL PARPs and ADP-ribosylation: recent advances linking molecular functions to biological outcomes. Genes Dev 31, 101–126 (2017). [DOI] [PMC free article] [PubMed] [Google Scholar]
- 31.Yu SW et al. Mediation of poly(ADP-ribose) polymerase-1-dependent cell death by apoptosis-inducing factor. Science 297, 259–263 (2002). [DOI] [PubMed] [Google Scholar]
- 32.Holton NW, Andrews JF & Gassman NR Application of Laser Micro-irradiation for Examination of Single and Double Strand Break Repair in Mammalian Cells. J Vis Exp (2017). [DOI] [PMC free article] [PubMed] [Google Scholar]
- 33.Marsischky GT, Wilson BA & Collier RJ Role of glutamic acid 988 of human poly-ADP-ribose polymerase in polymer formation. Evidence for active site similarities to the ADP-ribosylating toxins. J Biol Chem 270, 3247–3254 (1995). [DOI] [PubMed] [Google Scholar]
- 34.Gibson BA, Conrad LB, Huang D & Kraus WL Generation and Characterization of Recombinant Antibody-like ADP-Ribose Binding Proteins. Biochemistry 56, 6305–6316 (2017). [DOI] [PMC free article] [PubMed] [Google Scholar]
- 35.Chen R et al. PP2B and PP1alpha cooperatively disrupt 7SK snRNP to release P-TEFb for transcription in response to Ca2+ signaling. Genes Dev 22, 1356–1368 (2008). [DOI] [PMC free article] [PubMed] [Google Scholar]
- 36.Rogakou EP, Pilch DR, Orr AH, Ivanova VS & Bonner WM DNA double-stranded breaks induce histone H2AX phosphorylation on serine 139. J Biol Chem 273, 5858–5868 (1998). [DOI] [PubMed] [Google Scholar]
- 37.Yu D, Liu R, Yang G & Zhou Q The PARP1-Siah1 Axis Controls HIV-1 Transcription and Expression of Siah1 Substrates. Cell Rep 23, 3741–3749 (2018). [DOI] [PMC free article] [PubMed] [Google Scholar]
- 38.Hottiger MO Nuclear ADP-Ribosylation and Its Role in Chromatin Plasticity, Cell Differentiation, and Epigenetics. Annu Rev Biochem 84, 227–263 (2015). [DOI] [PubMed] [Google Scholar]
- 39.Daniels CM, Ong SE & Leung AK The Promise of Proteomics for the Study of ADP-Ribosylation. Mol Cell 58, 911–924 (2015). [DOI] [PMC free article] [PubMed] [Google Scholar]
- 40.Cervantes-Laurean D, Jacobson EL & Jacobson MK Preparation of low molecular weight model conjugates for ADP-ribose linkages to protein. Methods Enzymol 280, 275–287 (1997). [DOI] [PubMed] [Google Scholar]
- 41.Rosenthal F et al. Macrodomain-containing proteins are new mono-ADP-ribosylhydrolases. Nat Struct Mol Biol 20, 502–507 (2013). [DOI] [PubMed] [Google Scholar]
- 42.Leung AKL PARPs. Curr Biol 27, R1256–R1258 (2017). [DOI] [PubMed] [Google Scholar]
- 43.Suskiewicz MJ et al. HPF1 completes the PARP active site for DNA damage-induced ADP-ribosylation. Nature 579, 598–602 (2020). [DOI] [PMC free article] [PubMed] [Google Scholar]
- 44.Luo X et al. PARP-1 Controls the Adipogenic Transcriptional Program by PARylating C/EBPbeta and Modulating Its Transcriptional Activity. Mol Cell 65, 260–271 (2017). [DOI] [PMC free article] [PubMed] [Google Scholar]
- 45.Lu H et al. Compensatory induction of MYC expression by sustained CDK9 inhibition via a BRD4-dependent mechanism. Elife 4, e06535 (2015). [DOI] [PMC free article] [PubMed] [Google Scholar]
- 46.Yang Z, Zhu Q, Luo K & Zhou Q The 7SK small nuclear RNA inhibits the CDK9/cyclin T1 kinase to control transcription. Nature 414, 317–322 (2001). [DOI] [PubMed] [Google Scholar]
- 47.Nguyen VT, Kiss T, Michels AA & Bensaude O 7SK small nuclear RNA binds to and inhibits the activity of CDK9/cyclin T complexes. Nature 414, 322–325 (2001). [DOI] [PubMed] [Google Scholar]
- 48.Bugai A et al. P-TEFb Activation by RBM7 Shapes a Pro-survival Transcriptional Response to Genotoxic Stress. Mol Cell 74, 254–267 e210 (2019). [DOI] [PMC free article] [PubMed] [Google Scholar]
- 49.He N et al. A La-related protein modulates 7SK snRNP integrity to suppress P-TEFb-dependent transcriptional elongation and tumorigenesis. Mol Cell 29, 588–599 (2008). [DOI] [PMC free article] [PubMed] [Google Scholar]
- 50.Ott M, Geyer M & Zhou Q The control of HIV transcription: keeping RNA polymerase II on track. Cell Host Microbe 10, 426–435 (2011). [DOI] [PMC free article] [PubMed] [Google Scholar]
- 51.AJ CQ, Bugai A & Barboric M Cracking the control of RNA polymerase II elongation by 7SK snRNP and P-TEFb. Nucleic Acids Res 44, 7527–7539 (2016). [DOI] [PMC free article] [PubMed] [Google Scholar]
- 52.Tang J et al. Acetylation limits 53BP1 association with damaged chromatin to promote homologous recombination. Nat Struct Mol Biol 20, 317–325 (2013). [DOI] [PMC free article] [PubMed] [Google Scholar]
- 53.Hu K et al. ATM-Dependent Recruitment of BRD7 is required for Transcriptional Repression and DNA Repair at DNA Breaks Flanking Transcriptional Active Regions. Adv Sci (Weinh) 7, 2000157 (2020). [DOI] [PMC free article] [PubMed] [Google Scholar]
- 54.Chou DM et al. A chromatin localization screen reveals poly (ADP ribose)-regulated recruitment of the repressive polycomb and NuRD complexes to sites of DNA damage. Proc Natl Acad Sci U S A 107, 18475–18480 (2010). [DOI] [PMC free article] [PubMed] [Google Scholar]
- 55.Lavigne MD, Konstantopoulos D, Ntakou-Zamplara KZ, Liakos A & Fousteri M Global unleashing of transcription elongation waves in response to genotoxic stress restricts somatic mutation rate. Nat Commun 8, 2076 (2017). [DOI] [PMC free article] [PubMed] [Google Scholar]
- 56.Hanawalt PC & Spivak G Transcription-coupled DNA repair: two decades of progress and surprises. Nat Rev Mol Cell Biol 9, 958–970 (2008). [DOI] [PubMed] [Google Scholar]
- 57.Wei H & Yu X Functions of PARylation in DNA Damage Repair Pathways. Genomics Proteomics Bioinformatics 14, 131–139 (2016). [DOI] [PMC free article] [PubMed] [Google Scholar]
- 58.Robu M et al. Poly(ADP-ribose) polymerase 1 escorts XPC to UV-induced DNA lesions during nucleotide excision repair. Proc Natl Acad Sci U S A 114, E6847–E6856 (2017). [DOI] [PMC free article] [PubMed] [Google Scholar]
- 59.Pines A et al. PARP1 promotes nucleotide excision repair through DDB2 stabilization and recruitment of ALC1. J Cell Biol 199, 235–249 (2012). [DOI] [PMC free article] [PubMed] [Google Scholar]
- 60.Studniarek C et al. The 7SK/P-TEFb snRNP controls ultraviolet radiation-induced transcriptional reprogramming. Cell Rep 35, 108965 (2021). [DOI] [PubMed] [Google Scholar]
- 61.Singatulina AS et al. PARP-1 Activation Directs FUS to DNA Damage Sites to Form PARG-Reversible Compartments Enriched in Damaged DNA. Cell Rep 27, 1809–1821 e1805 (2019). [DOI] [PubMed] [Google Scholar]
- 62.Patel A et al. A Liquid-to-Solid Phase Transition of the ALS Protein FUS Accelerated by Disease Mutation. Cell 162, 1066–1077 (2015). [DOI] [PubMed] [Google Scholar]
- 63.Altmeyer M et al. Liquid demixing of intrinsically disordered proteins is seeded by poly(ADP-ribose). Nat Commun 6, 8088 (2015). [DOI] [PMC free article] [PubMed] [Google Scholar]
- 64.Ryu KW et al. Metabolic regulation of transcription through compartmentalized NAD(+) biosynthesis. Science 360 (2018). [DOI] [PMC free article] [PubMed] [Google Scholar]
- 65.Gibson BA et al. Chemical genetic discovery of PARP targets reveals a role for PARP-1 in transcription elongation. Science 353, 45–50 (2016). [DOI] [PMC free article] [PubMed] [Google Scholar]
- 66.Slade D PARP and PARG inhibitors in cancer treatment. Genes Dev 34, 360–394 (2020). [DOI] [PMC free article] [PubMed] [Google Scholar]
Associated Data
This section collects any data citations, data availability statements, or supplementary materials included in this article.
Supplementary Materials
Data Availability Statement
Source data are provided with this study. The raw sequencing data generated in this study have been deposited in the Genome Sequence Archive of The National Genomics Data Center, China National Center for Bioinformation / Beijing Institute of Genomics, Chinese Academy of Sciences (accession number: HRA000946) that are publicly accessible at https://ngdc.cncb.ac.cn/gsa-human. Mass spectrometry data have been deposited in ProteomeXchange with the dataset identifier PXD031109. All other data supporting the findings of this study are available from the corresponding author on reasonable request.


