

Abstract
Exosomes/small extracellular vesicles (sEV) provide a unique mode of cell-to-cell communication in which miRNAs produced and released from one cell are taken up by cells at a distance where they can lead to changes in gene expression1–3. However, the mechanism by which miRNAs get sorted into exosomes/sEV or retained in cells remains largely unknown. Here, we demonstrate that miRNAs possess sorting sequences that determine their sEV secretion or cellular retention and that different cell-types, including white and brown adipocytes, endothelium, liver and muscle, make preferential use of specific sorting sequences, thus defining the sEV miRNA profile of that cell-type. Insertion or deletion of these CELLmotifs or EXOmotifs into a miRNA increases or decreases their retention in the cell of production or secretion into sEV/exosomes. Two RNA-binding proteins, Alyref and Fus, are involved in the export of miRNAs carrying one of the strongest EXOmotifs, CGGGAG. Increased miRNA delivery mediated by EXOmotifs leads to enhanced inhibition of target genes in distant cells. Thus, this miRNA code not only provides important insights in linking circulating exosomal miRNAs to tissue-of-origin, it also provides an approach to improved targeting in RNA-mediated therapies.
Keywords: miRNAs, exosomes, extracellular vesicles, metabolism, cellular trafficking, miRNA binding proteins, tissue communication
Introduction
miRNAs are released from cells into the circulation bound to proteins, in microvesicles and in small extracellular vesicles (sEV), including exosomes4–7. sEV/exosomes have been recently shown to form a novel mode of cell-to-cell communication, in which their cargo is transferred from a donor to a recipient cell, leading to changes in gene expression and cellular function in health and disease1–3,8–10. Importantly, sEV are filled with particular subsets of miRNAs2,3,11–15, however, what determines which miRNAs are secreted and thus may serve this messenger function remains largely unknown, although some tetranucleotide sequences have been found in one or two cell types16–18. Similarly, even less well understood is what, if any, sequences are present in miRNAs which allow their concentration in the cell of origin, where they could have their action potentiated.
Results
Cell-Specific Selection of sEV miRNAs
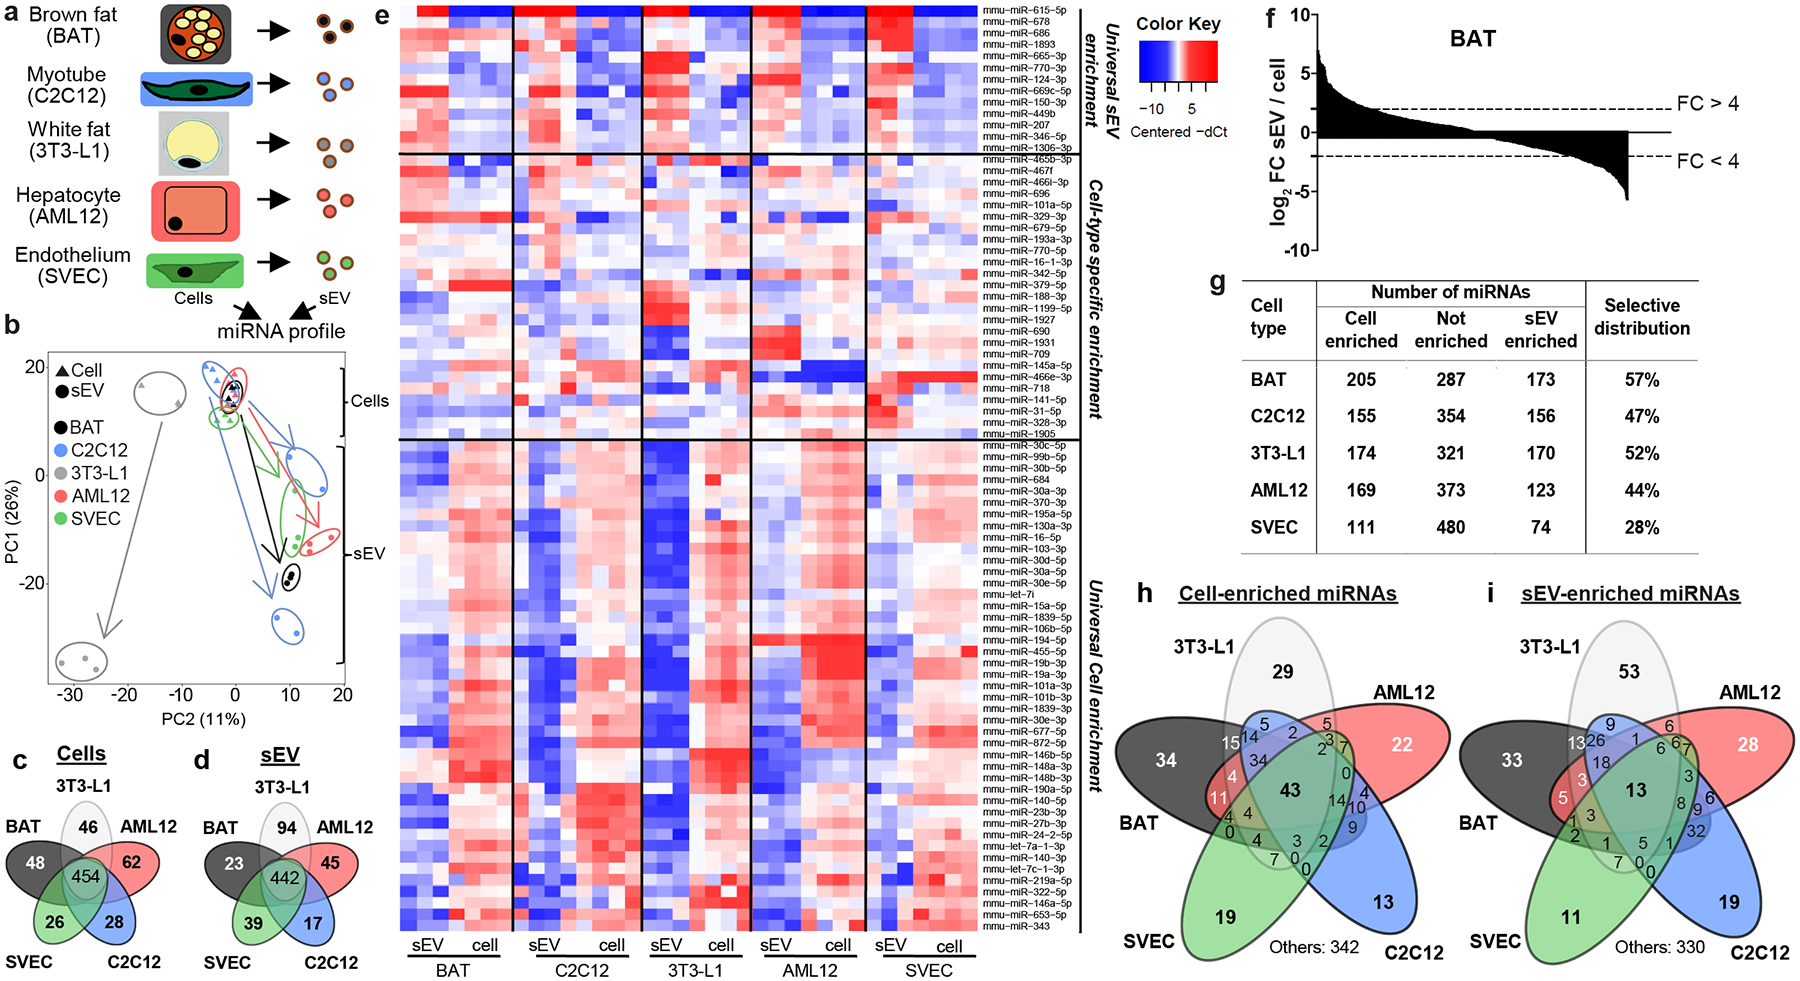
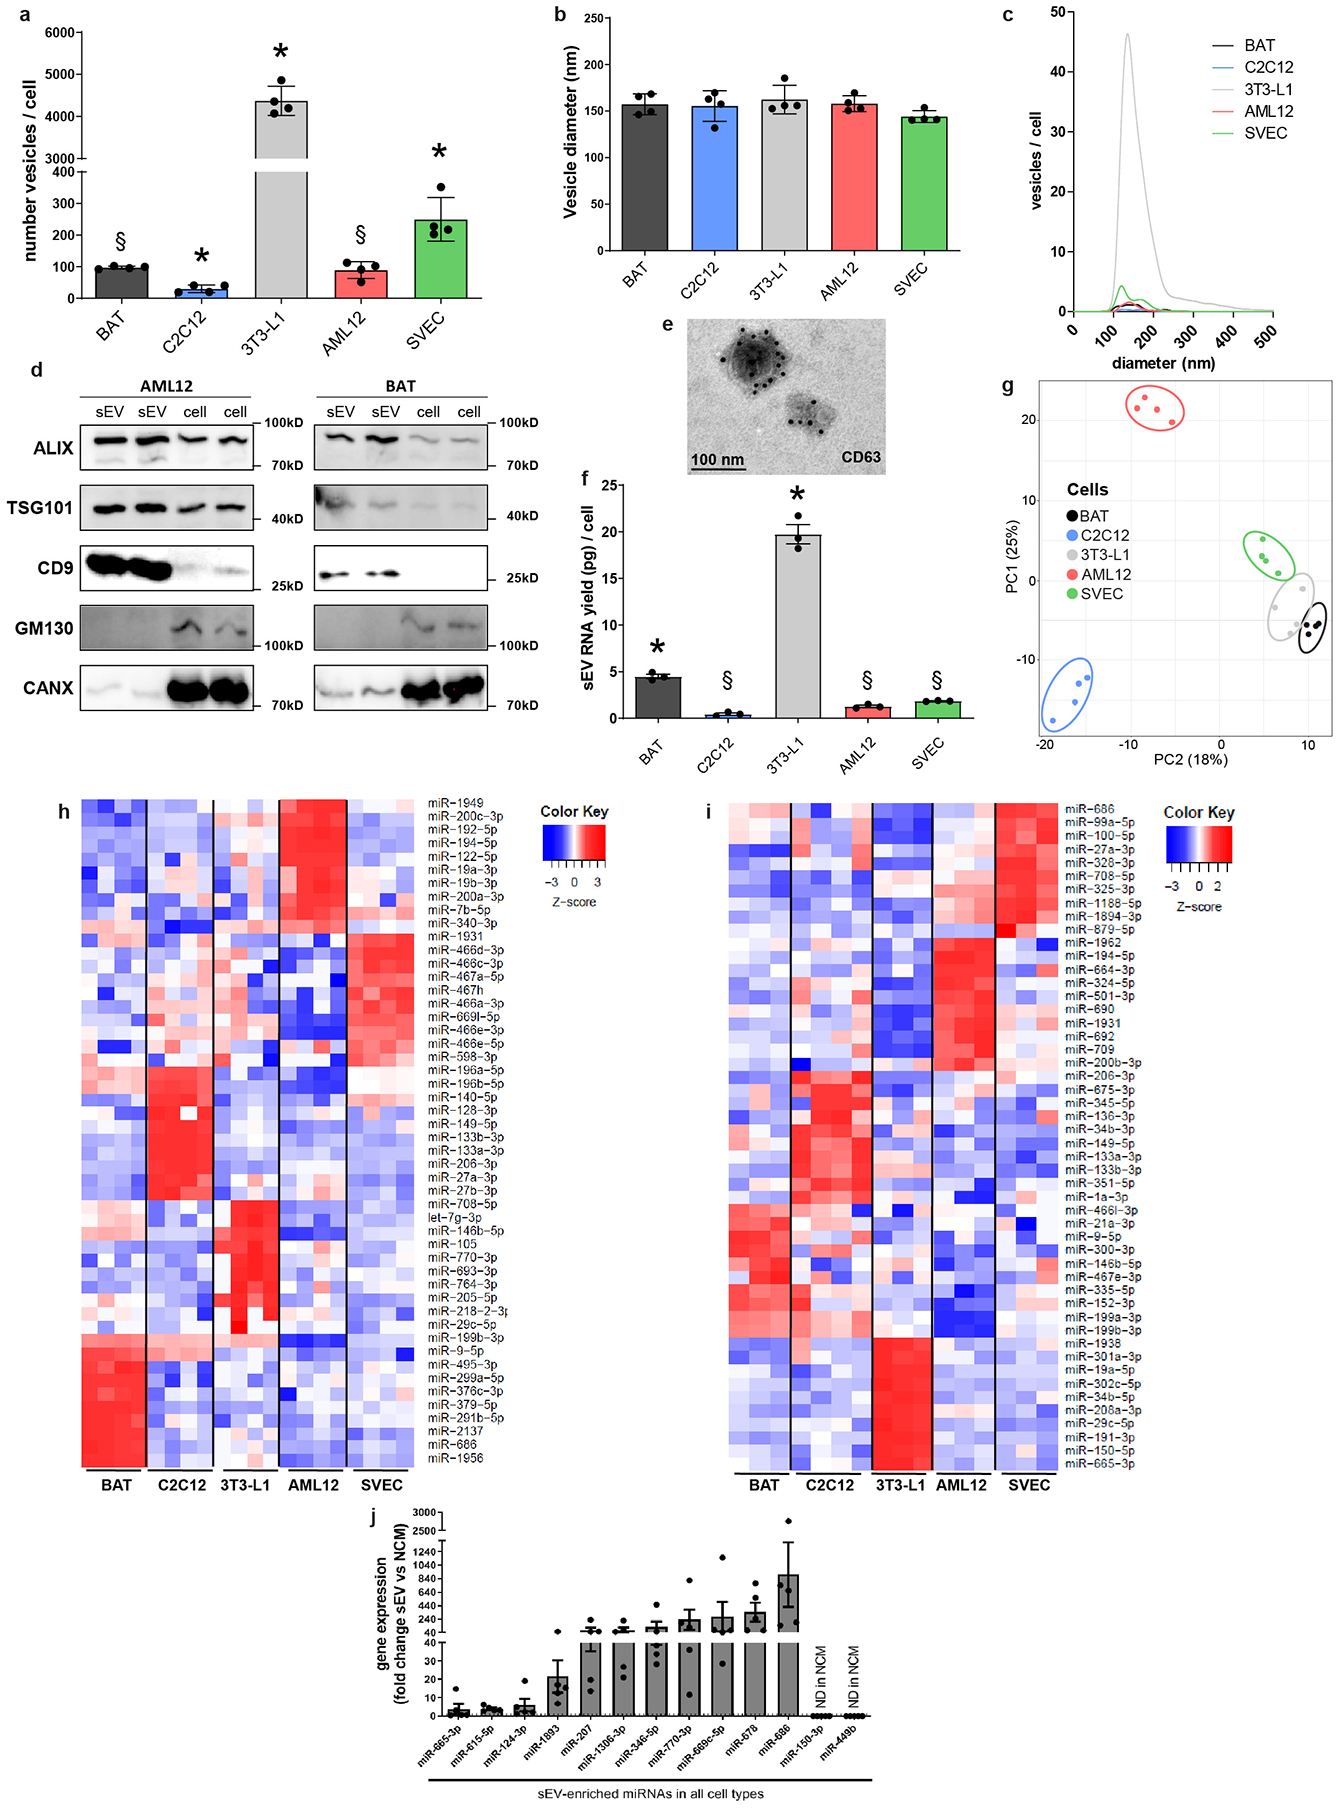
To investigate the specific features of miRNA cellular retention and sEV/exosomal release, exosomes/sEV were isolated from the media of cell lines representing five important tissues involved in the regulation of metabolism: differentiated 3T3-L1 cells (white adipocytes), immortalized differentiated brown adipocytes, differentiated C2C12 (skeletal muscle), SVEC (endothelial cells), and AML12 cells (hepatocytes) (Fig. 1a). Different cell types released different amounts of sEV with 3T3-L1 adipocytes having the highest production/release rate per cell and C2C12 myotubes the lowest (Extended Data Fig 1a), consistent with the observation that adipose tissue is a major contributor to circulating exosomal/sEV miRNAs in vivo1. In all cases, the sEV were between 50–200 nm, enriched in classical exosomal markers ALIX, TSG101, CD9 and CD63 and depleted from cellular markers GM130 and CANX19 (Extended Data Fig. 1b–1e). The RNA content of these sEV paralleled the total vesicle released (Extended Data Fig. 1f).
Figure 1.
Cell type-specific miRNAs in sEV and cells, and selectivity of sEV versus cellular distribution of certain miRNAs.
a) The experimental setup and cell lines used in this study.
b) Principal Component Analysis (PCA) showing cellular (triangles) and sEV (circles) miRNA profiles for each cell type (n=3–4).
c) Venn diagram showing the number of miRNAs with specific expression in cell bodies of each cell type. The number in the center refers to those miRNAs with no specific expression in the cell body of any of the five cell lines studied.
d) Venn diagram for miRNAs with specific expression in the sEV of each cell type.
e) Heatmap showing the abundance of the indicated miRNAs in sEV and cell bodies for each cell type studied. High expression based on normalized Ct is shown in red and low expression in blue.
f) Waterfall diagram showing sEV enrichment for all expressed miRNAs in brown adipocytes as log2 fold difference for relative abundance in sEV versus relative abundance for the same miRNA in cell body. The dashed lines indicate a four-fold difference.
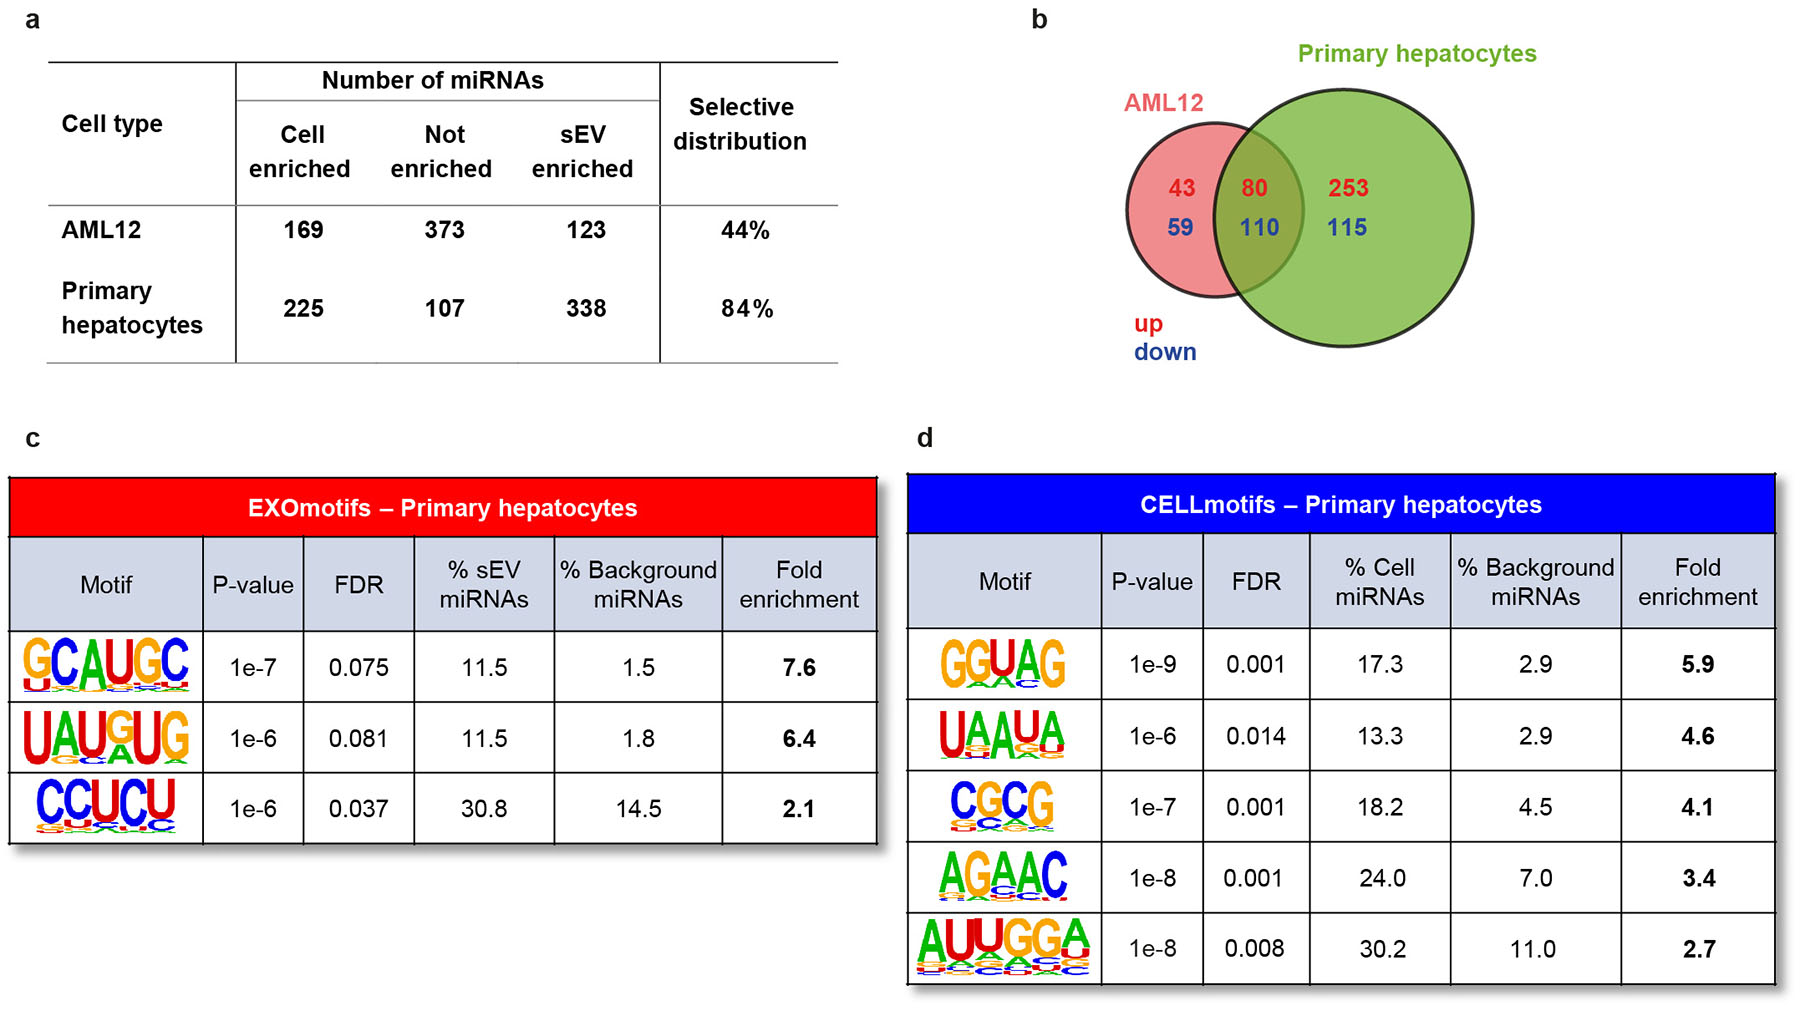
g) Table indicating the number of miRNAs showing significant cellular- or sEV-enrichment (FDR<0.1) or no enrichment for each cell type. The last column indicates the percentage of miRNAs with a selective distribution as the ratio between the sum of sEV and cellular enriched miRNAs divided by the total number of measured miRNAs.
h) Venn diagram indicating the number of miRNAs significantly enriched in the cell bodies compared to their respective sEV for the indicated cell-types and the different combinations among them.
i) Venn diagram indicating the number of miRNAs significantly enriched in the sEV compared to their respective cell body of each cell type and their combinations.
The miRNA composition of the secreted sEV and the cells from which they were derived was assessed using a qPCR-based array (Fig. 1a). As expected, principal component analysis (PCA) of cellular miRNAs showed that each cell type had a distinct miRNA profile, although brown and white adipocytes and endothelial cells clustered together, while hepatocytes and myocytes were more distinct (Extended Data Fig 1g). However, when the PCA was performed including both cellular and sEV miRNAs, the sEV miRNAs were quite distinct from each other and from their cells of origin (Fig. 1b), highlighting the specific nature of miRNA secretion2,3,12–15.
We then compared levels of each miRNA in each cell- or sEV-type with respect to the others. Of the 664 miRNAs assessed in the cell bodies, 210 miRNAs (32%) were significantly more highly expressed in one cell-type compared to the other four, i.e., showed cell-type specificity, in line with in vivo data20–22 (Fig. 1c and Supplementary Tables 2–3). Similarly, about one-third of sEV miRNAs assessed (218/660) were enriched in the vesicles from one cell-type as compared to the vesicles of the others (Fig. 1d; Supplementary Tables 4–5) and could be used to predict tissue-of-origin in situations of mixed sEV from different organs such as in blood. Some of the sEV-specific miRNAs reflected the cell-specific nature of the miRNA, for example miR-133a/b for C2C12 myotubes. However, for each cell-type, 73%−92% of the sEV miRNAs considered specific for that given cell type were also expressed in the cell bodies of other cell-types at similar or even higher levels (Supplementary Table 2–5), suggesting a cell-specific sorting mechanism. Likewise, a miRNA that was equally abundant in sEV of two different cell types may have considerably different levels of expression in the two secreting cells. Thus, determining the tissue-of-origin of an sEV miRNA is not as simple as knowing in which tissue that miRNA is highly expressed.
sEV versus cellular sorting of miRNAs
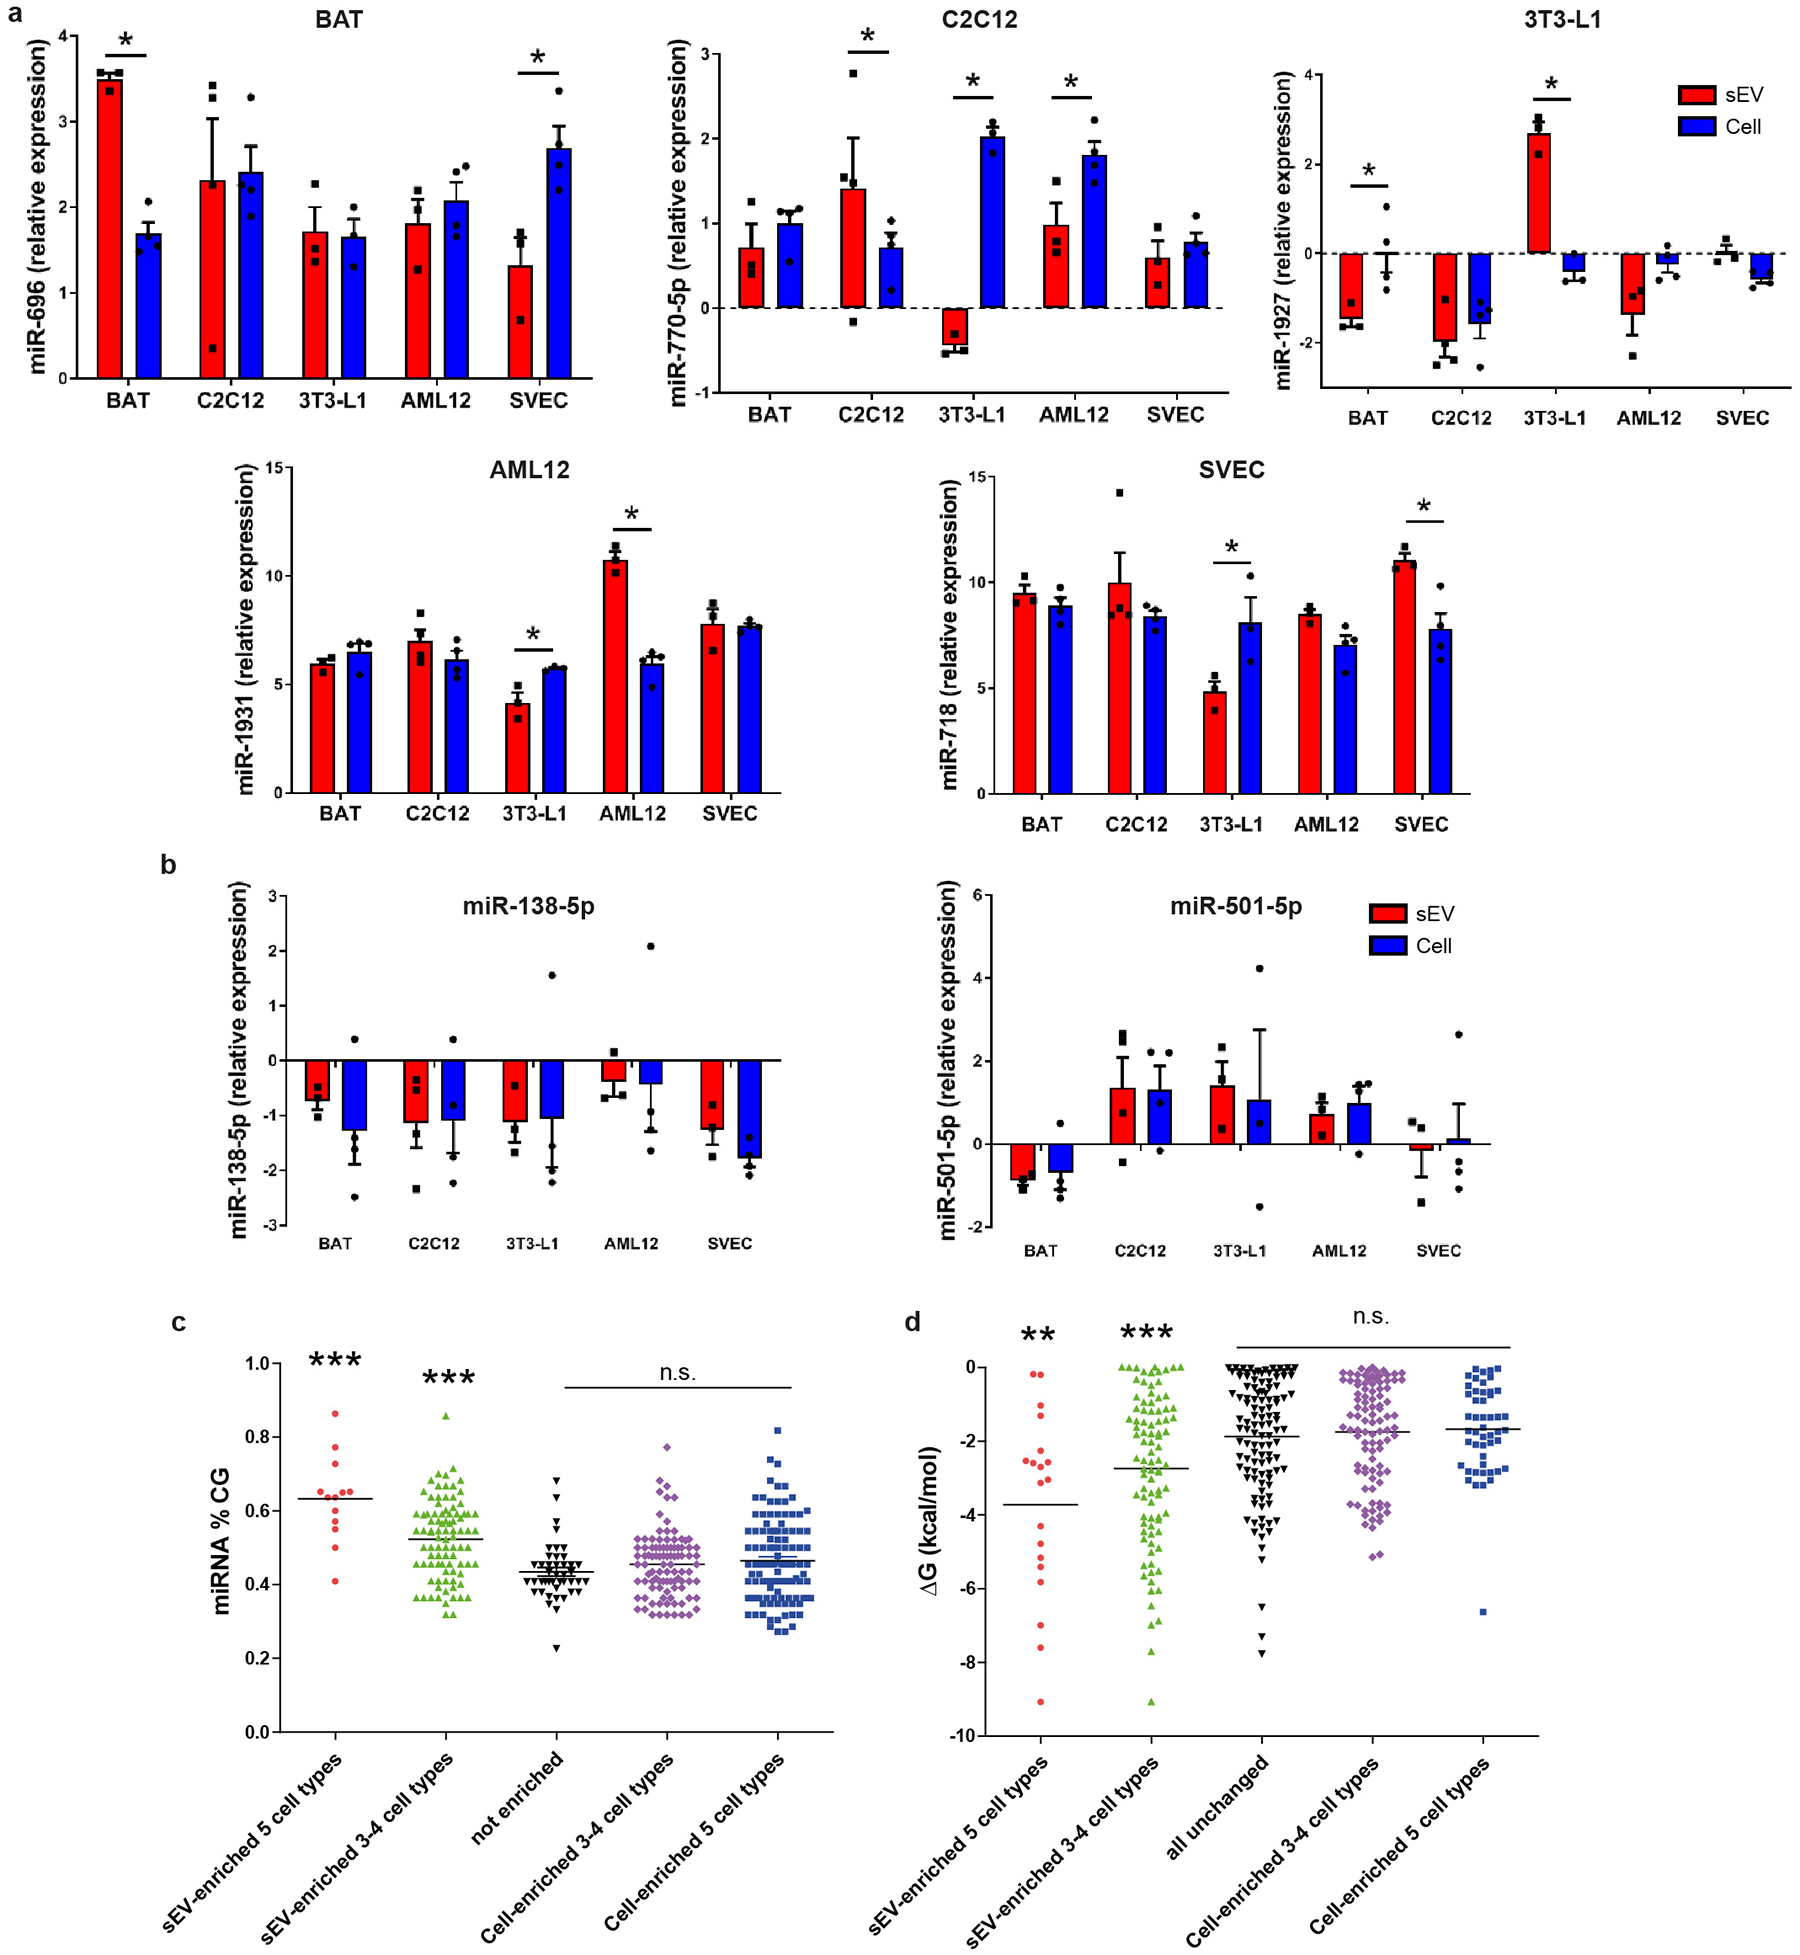
Comparison of the relative levels for each miRNA in the cell-body versus the sEV revealed unique patterns of miRNAs secretion/retention. For example, some miRNAs were enriched in sEV of all five cell types compared to their cell-bodies, whereas others showed selective enrichment in the sEV of only one or two cell-types, and still others were rarely or not found in sEV despite being present in the cell-bodies (Fig. 1e and Extended Data Fig. 1h–i and 2a). Finally, some miRNAs, such as miR-138b-5p and miR-501-5p, showed nearly the same relative expression in sEV and cell bodies in all cell types (Extended Data Fig. 2b), and thus could be used as reference miRNAs when comparing sEV versus cell-bodies. Enrichment of miRNAs in sEV was not due to contamination of sEV from culture medium, as their levels were much higher in the conditioned than in non-conditioned media (Extended Data Fig. 1h).
Dividing the relative abundance of a miRNA in the sEV by its relative abundance in the cell-body (sEV enrichment) demonstrates that miRNAs display a large range of differential sorting between sEV and cells, with some miRNAs showing a marked enrichment in sEV and others marked enrichment (retention) in the cell-body (Figure 1f and Supplementary Table 6). Using a FDR<0.1 for relative enrichment (corresponding to >1.44 for sEV enrichment and <−1.48 fold for cellular retention), between 28% and 57% of the expressed miRNAs displayed selective enrichment in either the sEV or cell-body depending on the cell type (Fig. 1g). Forty-three miRNAs were significantly retained in the body of all cell-types, while 13 miRNAs were significantly enriched in the sEV of all cell types (Fig. 1e, 1h–i). However, many miRNAs were significantly enriched in cell-bodies or sEV of only a single or limited number of cell-types (Fig. 1e, 1h–i), suggesting the existence of finely-tuned, cell-type specific mechanisms for cellular retention and sEV secretion.
Role of miRNA sequence in miRNA sorting
To identify potential mechanisms of miRNA sorting, the miRNA sequence and structure were analyzed for those miRNAs showing either sEV- or cell-body enrichment. There was no generalized enrichment of 5p versus 3p miRNAs (Supplementary Table 6). However, miRNA sequences that displayed higher levels of sEV enrichment did have higher CG content and lower Gibbs free energy (ΔG) compared to those retained in cells (Extended Data Fig. 2c–d).
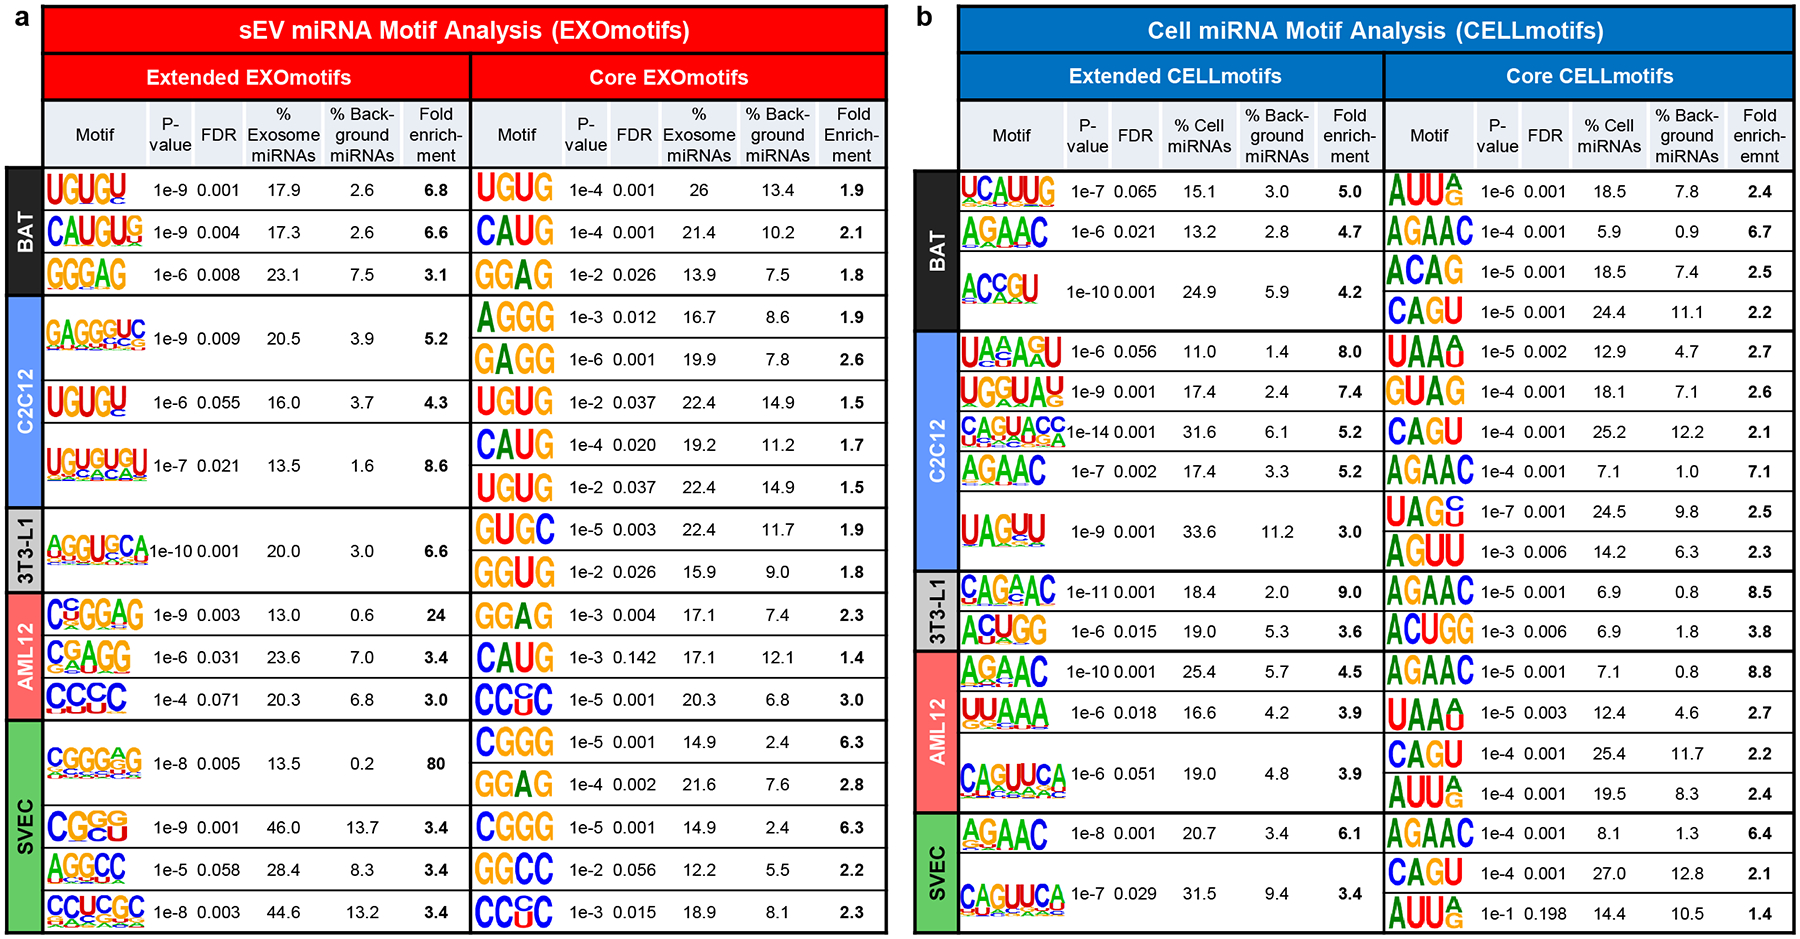
To identify potential sequences in the miRNAs which account for differential sorting, we performed in-silico sequence analysis of the miRNAs that were enriched in the sEV or in the cell bodies for each cell-type and compared to miRNAs not showing preferential sEV sorting or having cellular retention. For each cell-type, we could identify one to four motifs of 4–7 nucleotides, most with high GC content, that were significantly associated with enrichment in sEV; we termed these EXOmotifs (Fig. 2a, left half). For example, for SVEC, four motifs were identified, each of which could be identified in 13.5% to 46% of sEV-enriched miRNAs and showed a 3.4- to 80-fold enrichment in the sEV-enriched miRNAs compared to other miRNAs in the cell. Some EXOmotifs were specific for a single cell-type: NGGUNCA in 3T3-L1 and CG[G/C][G/U] in SVEC. In contrast, other motifs were found in two or more cell-types, albeit sometimes with slight variation such as CNGGAG and CGGGNG in hepatocytes and SVEC which produced 24- and 80-fold enrichment, respectively, and GAGGGUC in reverse orientation in C2C12 with a 5.2-fold enrichment, suggesting a common motif of CNGGNG. Another example is UGUG[U/C] in sEV miRNAs from BAT and C2C12 myotubes (Fig. 2a, left and Extended Data Fig. 3a).
Figure 2.
Motifs over-represented in miRNAs preferentially sorted into sEV/exosomes (EXOmotifs) or cell retained (CELLmotifs) for each cell type.
a) Table showing the sEV/exosomal motifs (EXOmotifs) identified for each cell type in their extended version (left) and core version (right). For each motif, the P-value, false discovery rate (FDR), the percentage of miRNAs significantly enriched in exosomes/sEV that contain the motif, the percentage of miRNAs not enriched in exosomes/sEV containing the motif (background) and the fold-enrichment as the ratio between the previous two columns are displayed.
b) Table showing the cell retention-associated motifs (CELLmotifs) identified for each cell type in their extended version (left) and core version (right). Calculated are as in panel a.
A similar analysis identified two to five 4–5 nucleotide motifs in the cell-enriched miRNAs (CELLmotifs) for each cell type (Figure 2b). These motifs showed 3- to 9-fold enrichment and were low in GC content. Again, some motifs strongly associated to cellular retention of a miRNA in more than one or even all cell types such as AGAAC (and the extended version CAGAAC in 3T3-L1) with a 4.5- to 9-fold enrichment. Most CELLmotifs, however, were restricted to one or two cell-types (Fig. 2b, left panel and Extended Data Fig. 3b).
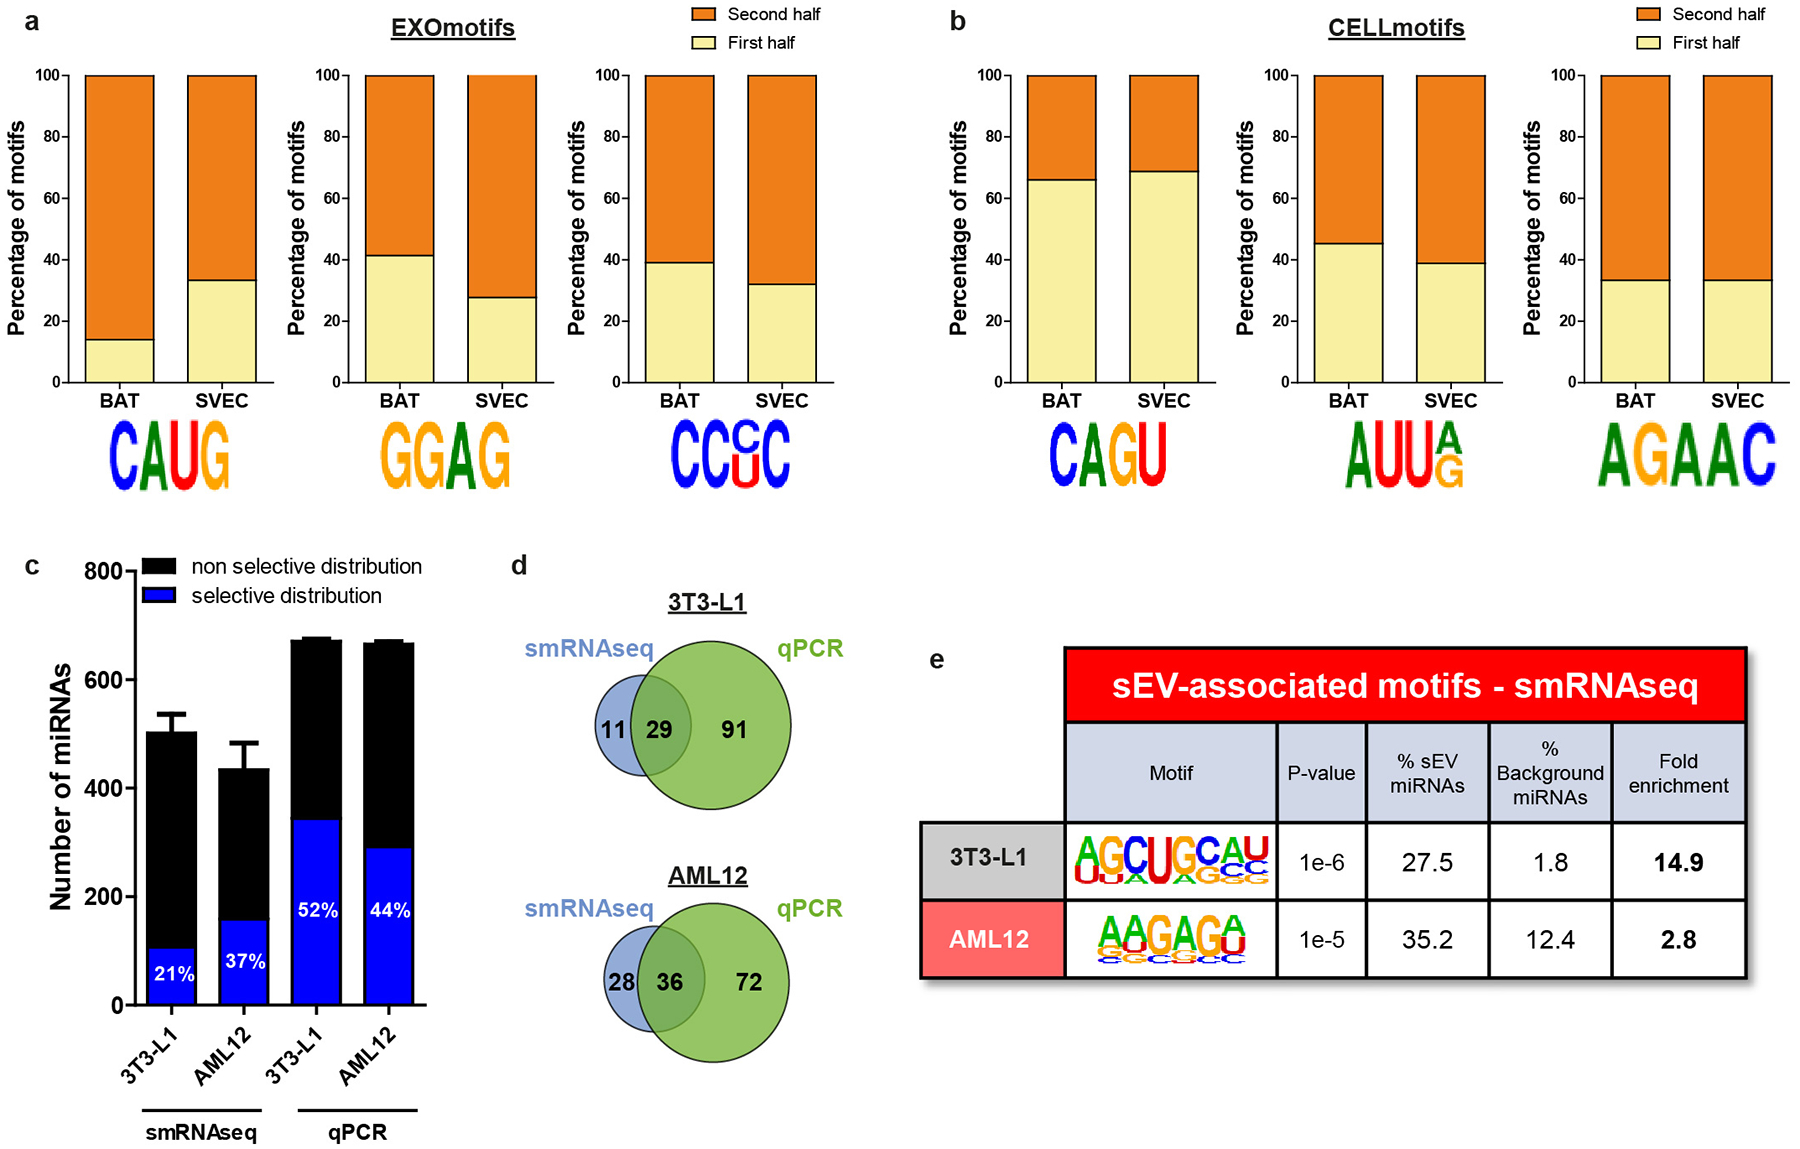
Although motif identification analysis tends to favor longer motifs which give higher enrichment scores16,23, shorter four-nucleotide motifs, often in the core of the longer motifs, could be repeatedly identified in sEV and cell-enriched miRNAs from different cell types. For example, the EXOmotifs CAUGUG in sEV miRNAs from BAT and C[A/G][U/A]GG in AML12 cells contained the same four nucleotide sequence: CAUG. Likewise, the motifs GGGAG in sEV miRNAs from BAT, CUGGGAG (inverted) in C2C12, CNGGAG in AML12 and CGGGNG in SVEC contained a common core motif GGAG. This motif was also found over-represented in sEV/exosomal miRNAs from T-cells18. Indeed, repeating the motif analysis focusing on a four-nucleotide mode, we were able to identify families of shorter motifs. We named these Core-EXOmotifs and Core-CELLmotifs (Fig. 2a–b, right halves). These had lower enrichment than extended EXOmotifs, but showed more abundance and commonality among cell-types (Fig. 2a–b and Extended Data Fig. 3a–b). Taken together, these Core-EXOmotifs and Core-CELLmotifs covered a large proportion of miRNAs: 62% of sEV-enriched miRNAs and 65% of cell-enriched miRNAs (Supplementary Table 6). Interestingly, the effect of these motifs seems to be additive: the 13 miRNAs significantly enriched in sEV from all cell-types and the 43 miRNAs significantly enriched in all cell-bodies (Fig. 1e,1h–i) contained an average of 2.4 and 1.8 motifs per miRNA, respectively. Importantly, Core and Extended EXOmotifs and CELLmotifs were usually located in the 3’ half of the miRNA, i.e., away from the seed sequence24 (Extended Data Fig. 4a–b).
Identification of these motifs was not due to sequence-bias of the qPCR method used for miRNA quantification. Comparing small RNA sequencing (smRNAseq) for miRNA analysis using 3T3-L1 and AML12 cells, however, we did find that the qPCR method identified more unique miRNAs and was thus better discriminate miRNAs with a selective distribution than smRNAseq (Extended Data Fig. 4c–d). Nonetheless, motif analysis of the smRNAseq data yielded similar results as qPCR (i.e. AGCUGCAU ≈ AGGUGCA in 3T3-L1 and [A/G][A/U/G]GAG[A/U/C] contains part of the CNGGAG motif from AML12) (Extended Data Fig. 4e). Interestingly, comparison of AML12 hepatocytes to primary murine hepatocytes revealed an even higher percentage of sEV-enriched or cell-enriched miRNAs in primary hepatocytes that in the cultured lines (Extended Data Fig. 5a), suggesting that primary cells may have even more functional sEV sorting machinery. Importantly, there was a high correspondence of the sEV- and cell-enriched miRNAs in AML-12 and primary hepatocytes (Extended Data Fig. 5b). Most of the EXO- and CELLmotifs identified in primary hepatocytes had an Extended or Core counterpart motif in AML12, such as CAUG, CC[C/U]C for EXOmotifs and AGAAC, UUAAA and AUU[A/G] for CELLmotifs (Extended Data Fig. 5c–d). These data indicate that our vitro model of hepatocytes closely resembles the miRNA sorting features of primary cells.
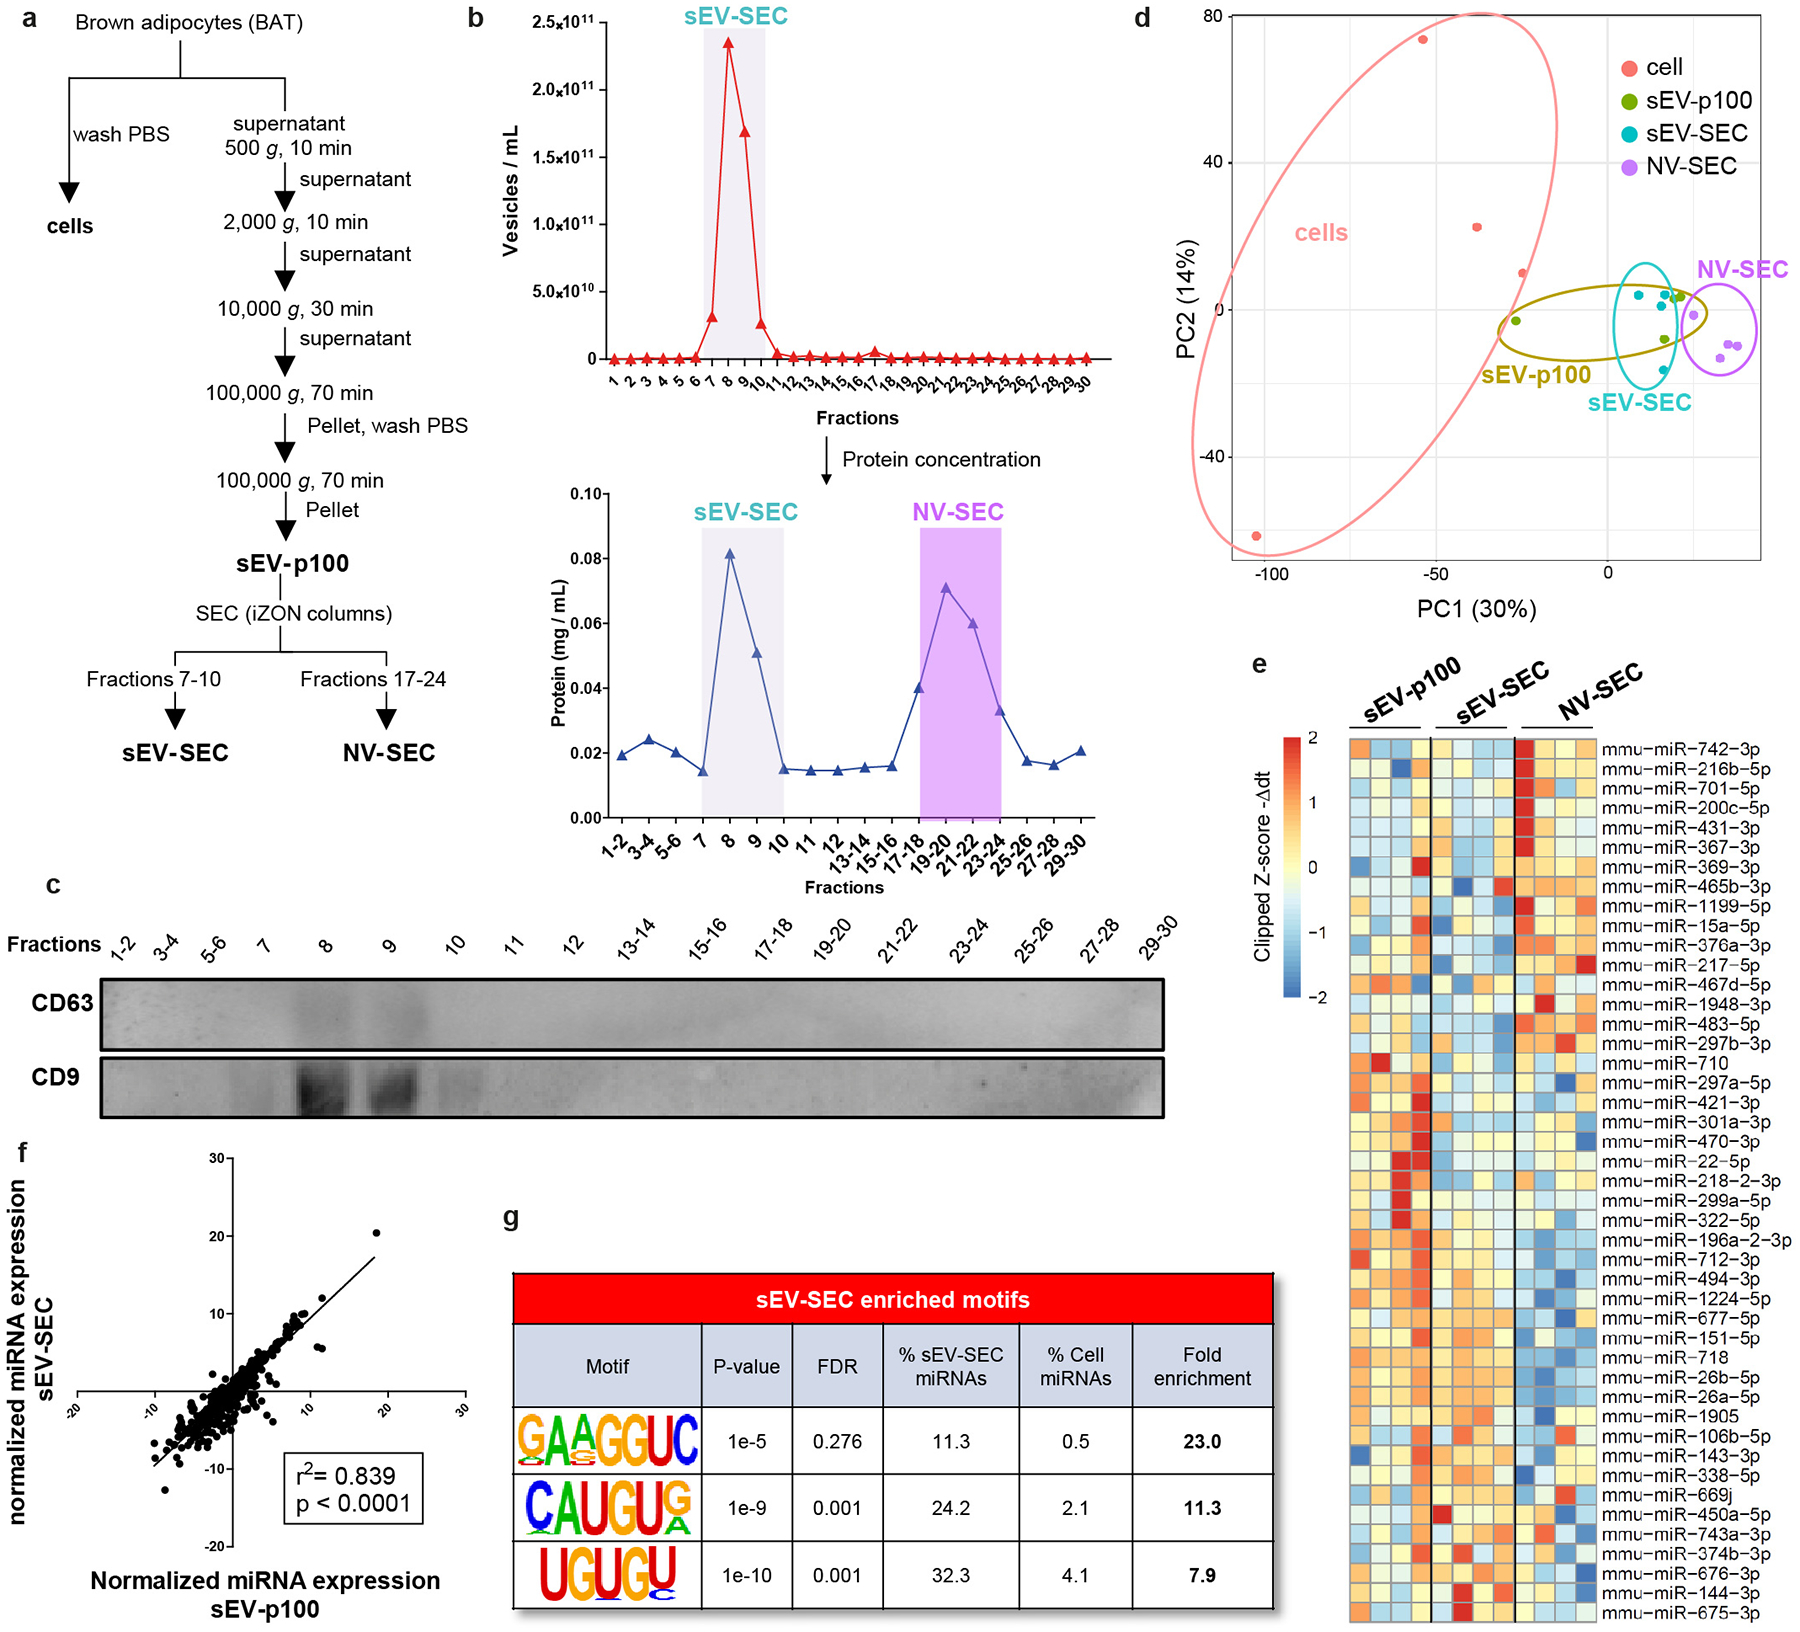
As some non-vesicular components may co-precipitate with sEV during ultracentrifugation, we subjected the sEV-pellet derived from ultracentrifugation (sEV-p100) to further purification using size exclusion chromatography (Extended Data Fig. 6a). Fractions 7–10 contained a high density of vesicles that were positive for CD63 and CD9 (sEV-SEC); fractions 17–24 were depleted from vesicles and negative for CD63 and CD9, i.e., contained non-vesicular (NV-SEC) miRNAs (Extended Data Fig. 6b–c). miRNA profiling, PCA, top differentially expressed miRNAs and correlation analysis revealed a high overlap between the sEV-p100 and sEV-SEC samples, with both being distinct from the NV-SEC and the cellular samples (Extended Data Fig. 6d–f). Motif enrichment analysis of the sEV-SEC-enriched miRNAs revealed identical or very similar motifs to the EXOmotifs found in the ultracentrifugation-derived sEV, i.e. identical UGUG[U/C], almost identical CAUGU[G/A], and GA[A/G/U]GGUC, which contains the motif GGGAG in reverse orientation, all with enrichments of 7.9- to 23-fold (Extended Data Fig. 6g and Fig. 2a). Thus, ultracentrifugation results in a quite pure exosomal/sEV pellet15, with non-vesicular extracellular fractions having only minor contributions. What controls miRNA sorting into the non-vesicular fraction remains to be determined.
CELL and EXOmotifs mediate miRNA sorting
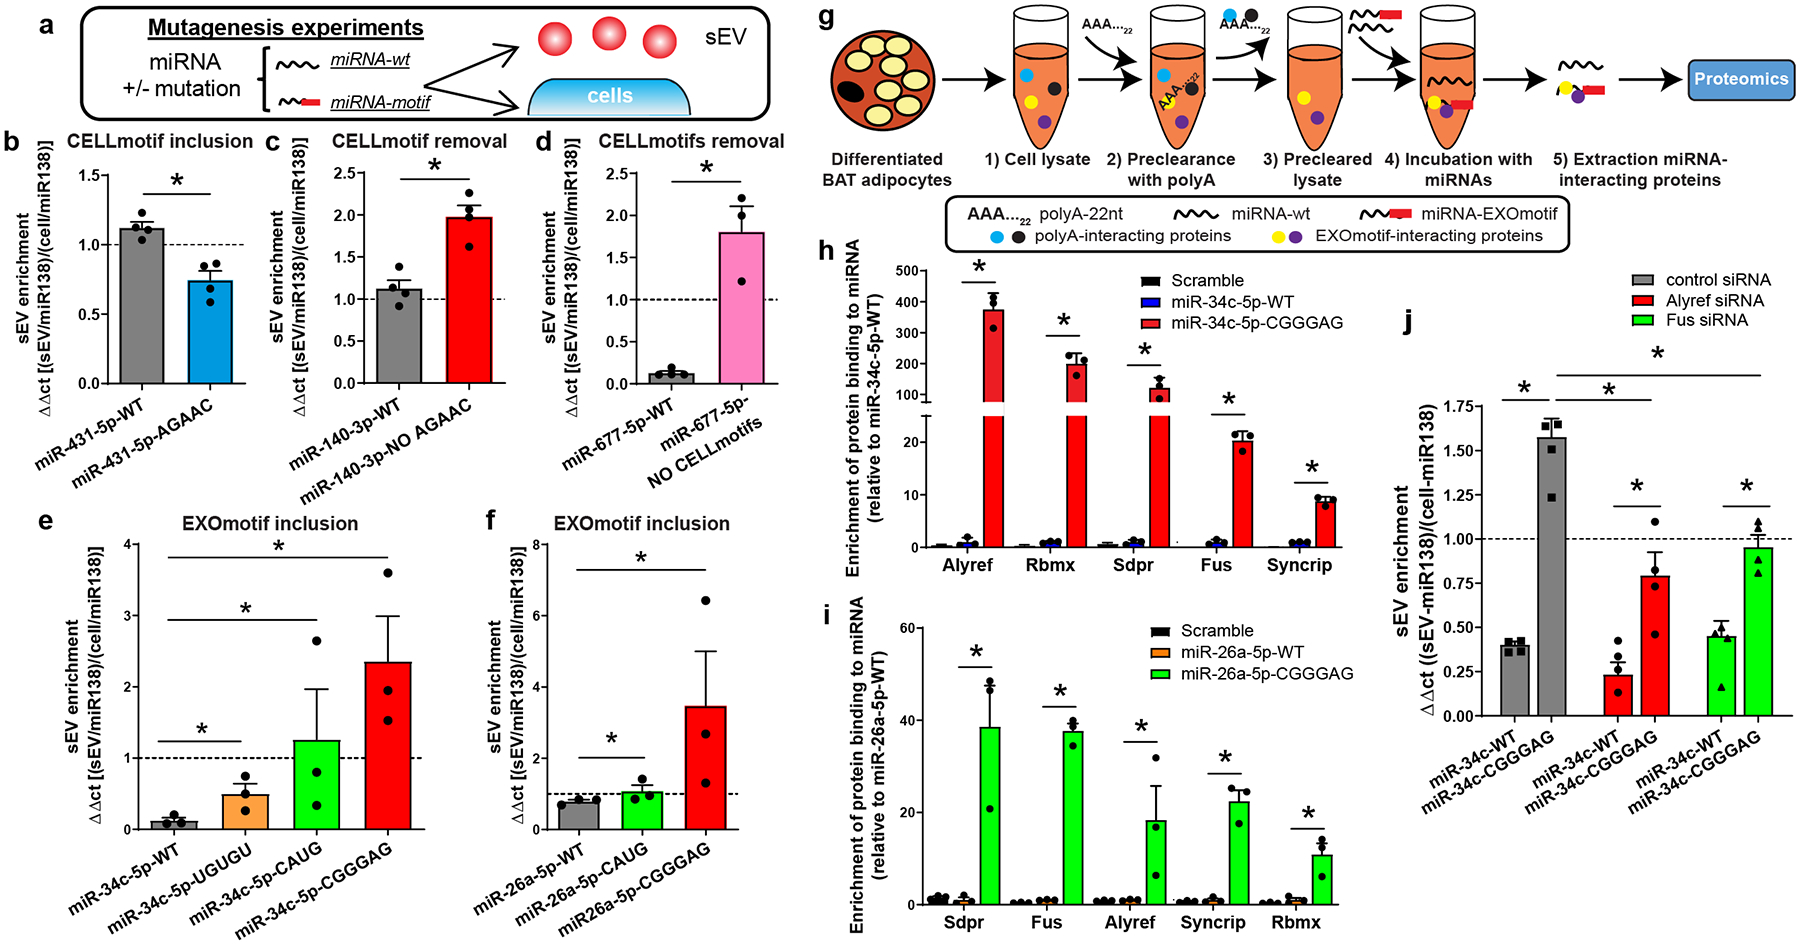
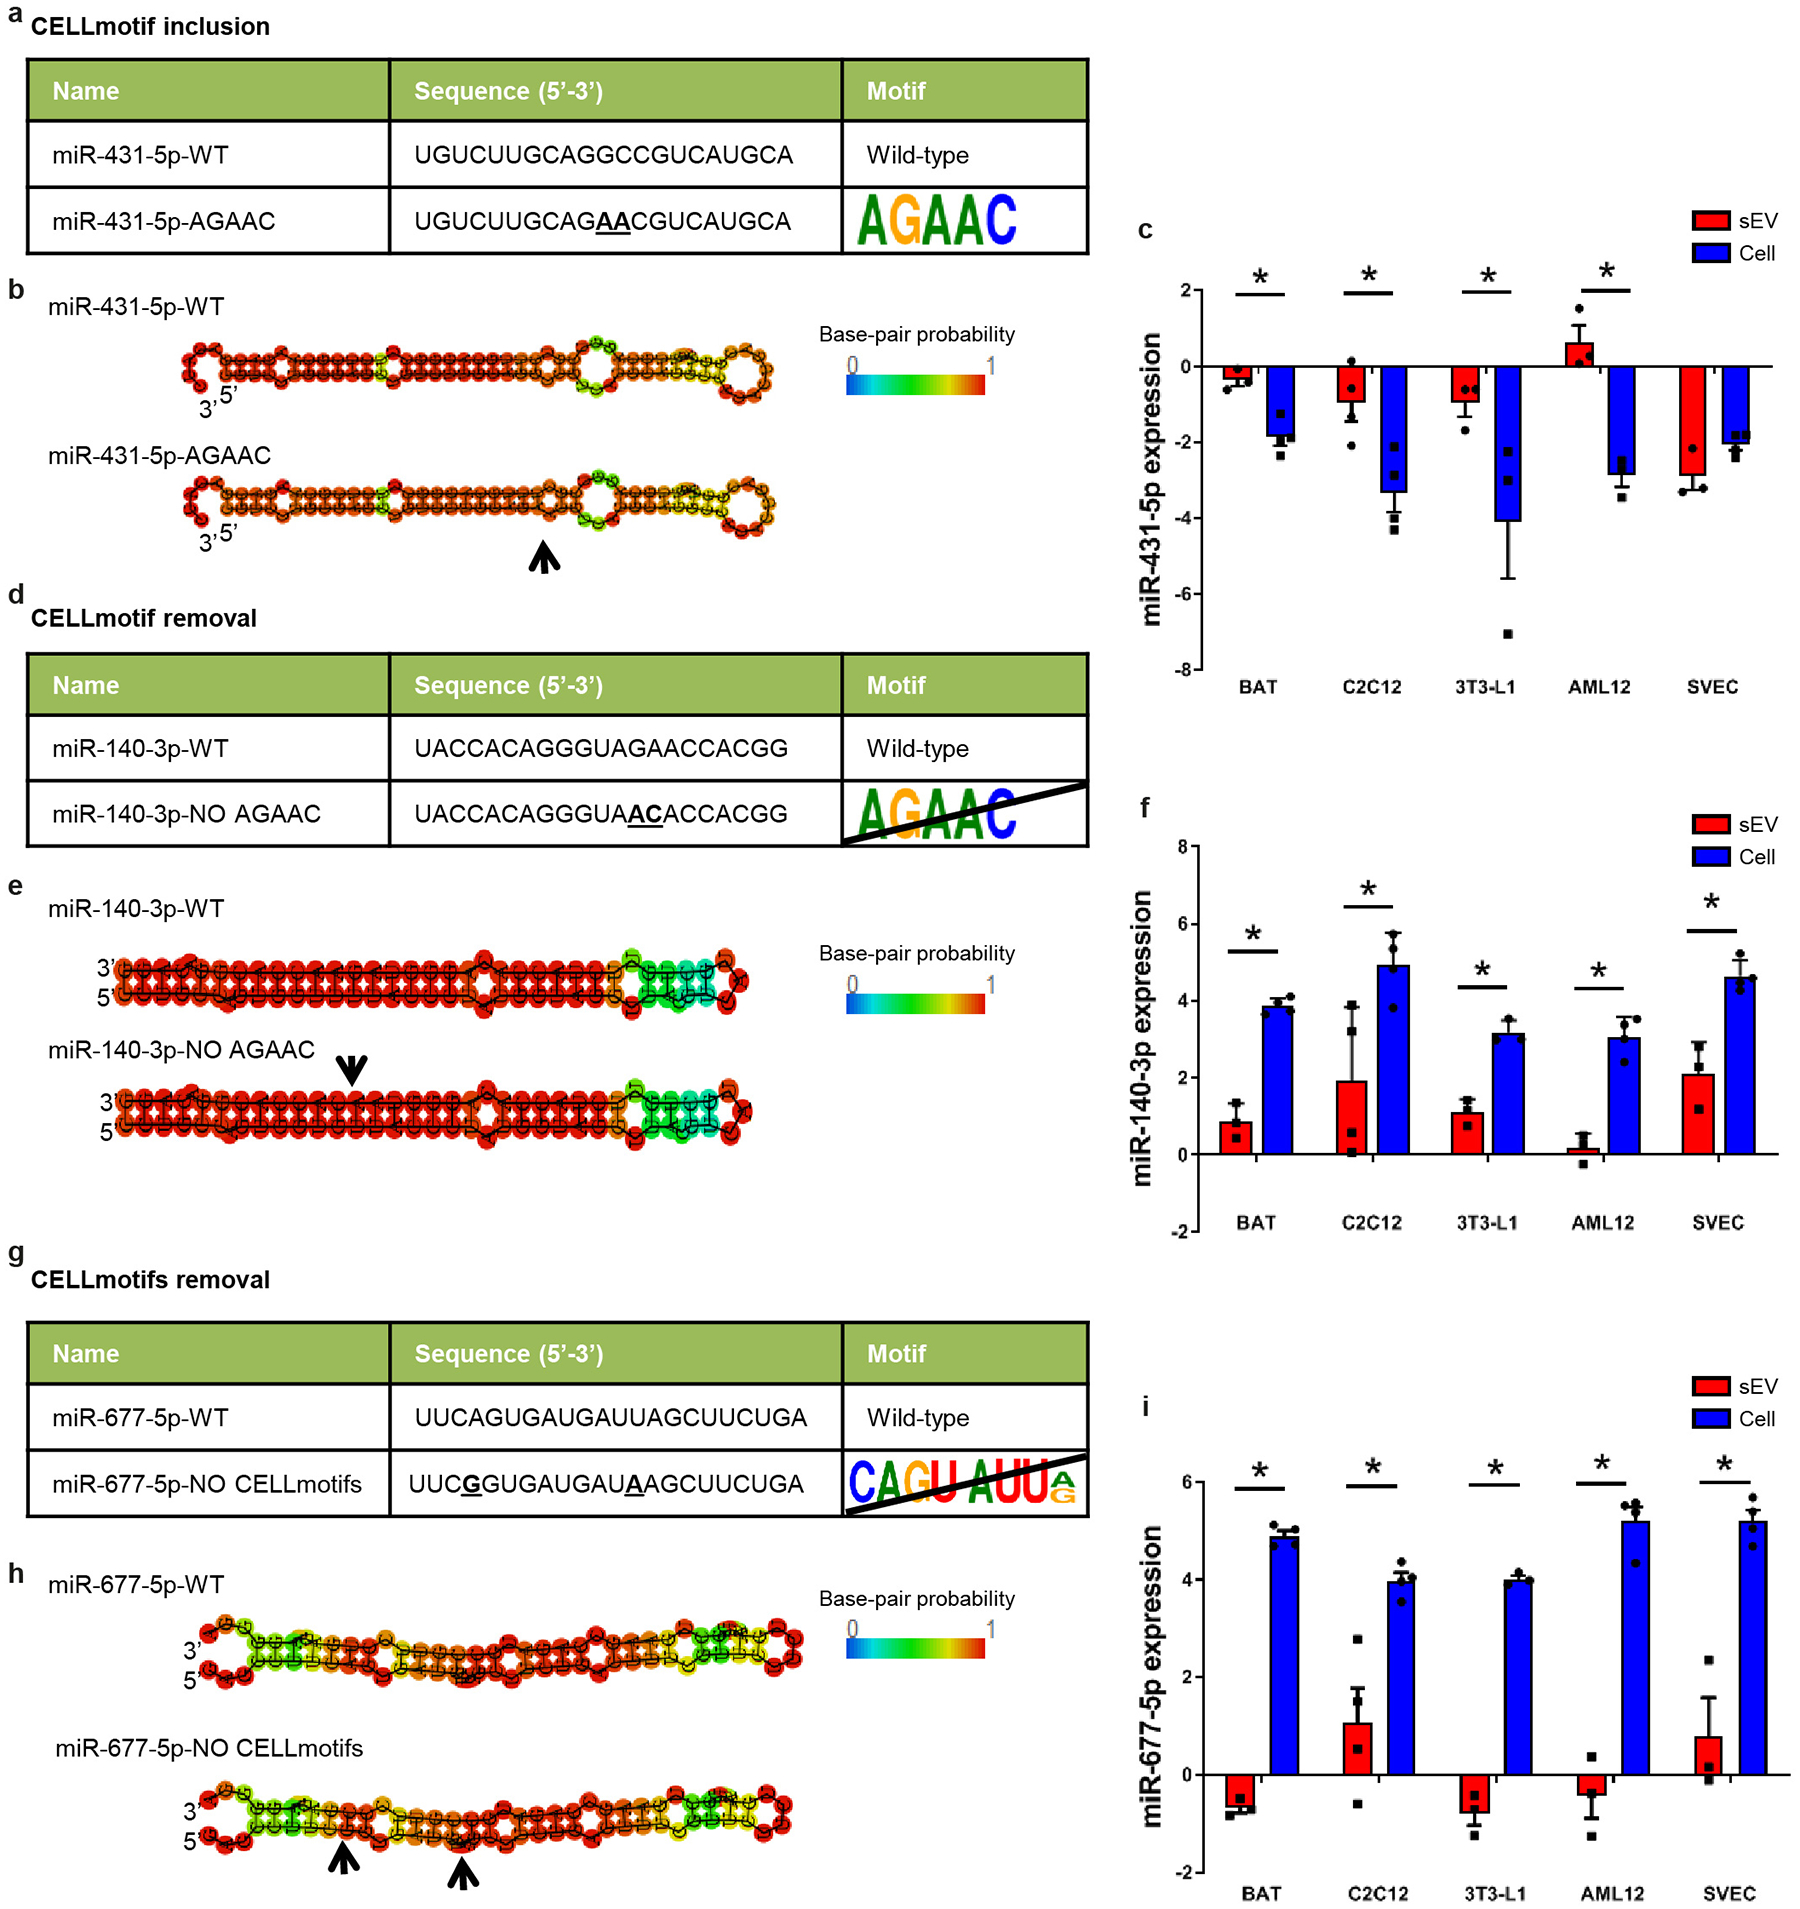
To determine whether these sorting motifs are sufficient to modify miRNA distribution between cells and sEV, using mutagenesis we either introduced or removed motifs from a miRNA (Fig. 3a). For example, introduction of the CELLmotif AGAAC into the sequence of the somewhat sEV-enriched miR-431-5p, resulted in a 35% decrease in its sEV enrichment (Fig. 3b and Extended Data Fig. 7a–c). When the same AGAAC CELLmotif in miR-140-3p was mutated, there was a doubling of sEV export (Fig. 3c and Extended Data Fig. 7d–f). Even more striking, disruption of the two Core-CELLmotifs (CAGU and AUUA) present in miR-677-5p led to 14-fold increase in sEV enrichment (Fig. 3d and Extended Data Fig. 7g–i)
Figure 3.
CELLmotifs and EXOmotifs regulate miRNA distribution. Alyref and Fus participate in sorting of miRNAs containing CNGGNG-EXOmotif.
a) Experimental setup for interrogating motif functionality.
b) sEV enrichment calculated as the ratio of sEV expression divided by cellular expression in AML12 hepatocytes for either miR-431-5p wild-type (miR-431-5p-WT) or its version containing the CELLmotif AGAAC (miR-431-5p-AGAAC).
c) The same motif AGAAC was removed from miR-140-3p (miR-140-3p NO AGAAC) in brown adipocytes and the sEV enrichment was calculated for it as for the wild-type version (miR-140-3p-WT).
d) Core-CELLmotifs CAGU and AUU[A/G] were removed from miR-677-5p (miR-677-5p-NO CELLmotifs) in AML12 hepatocytes and its sEV enrichment was calculated as for the wild-type version (miR-677-5p-WT).
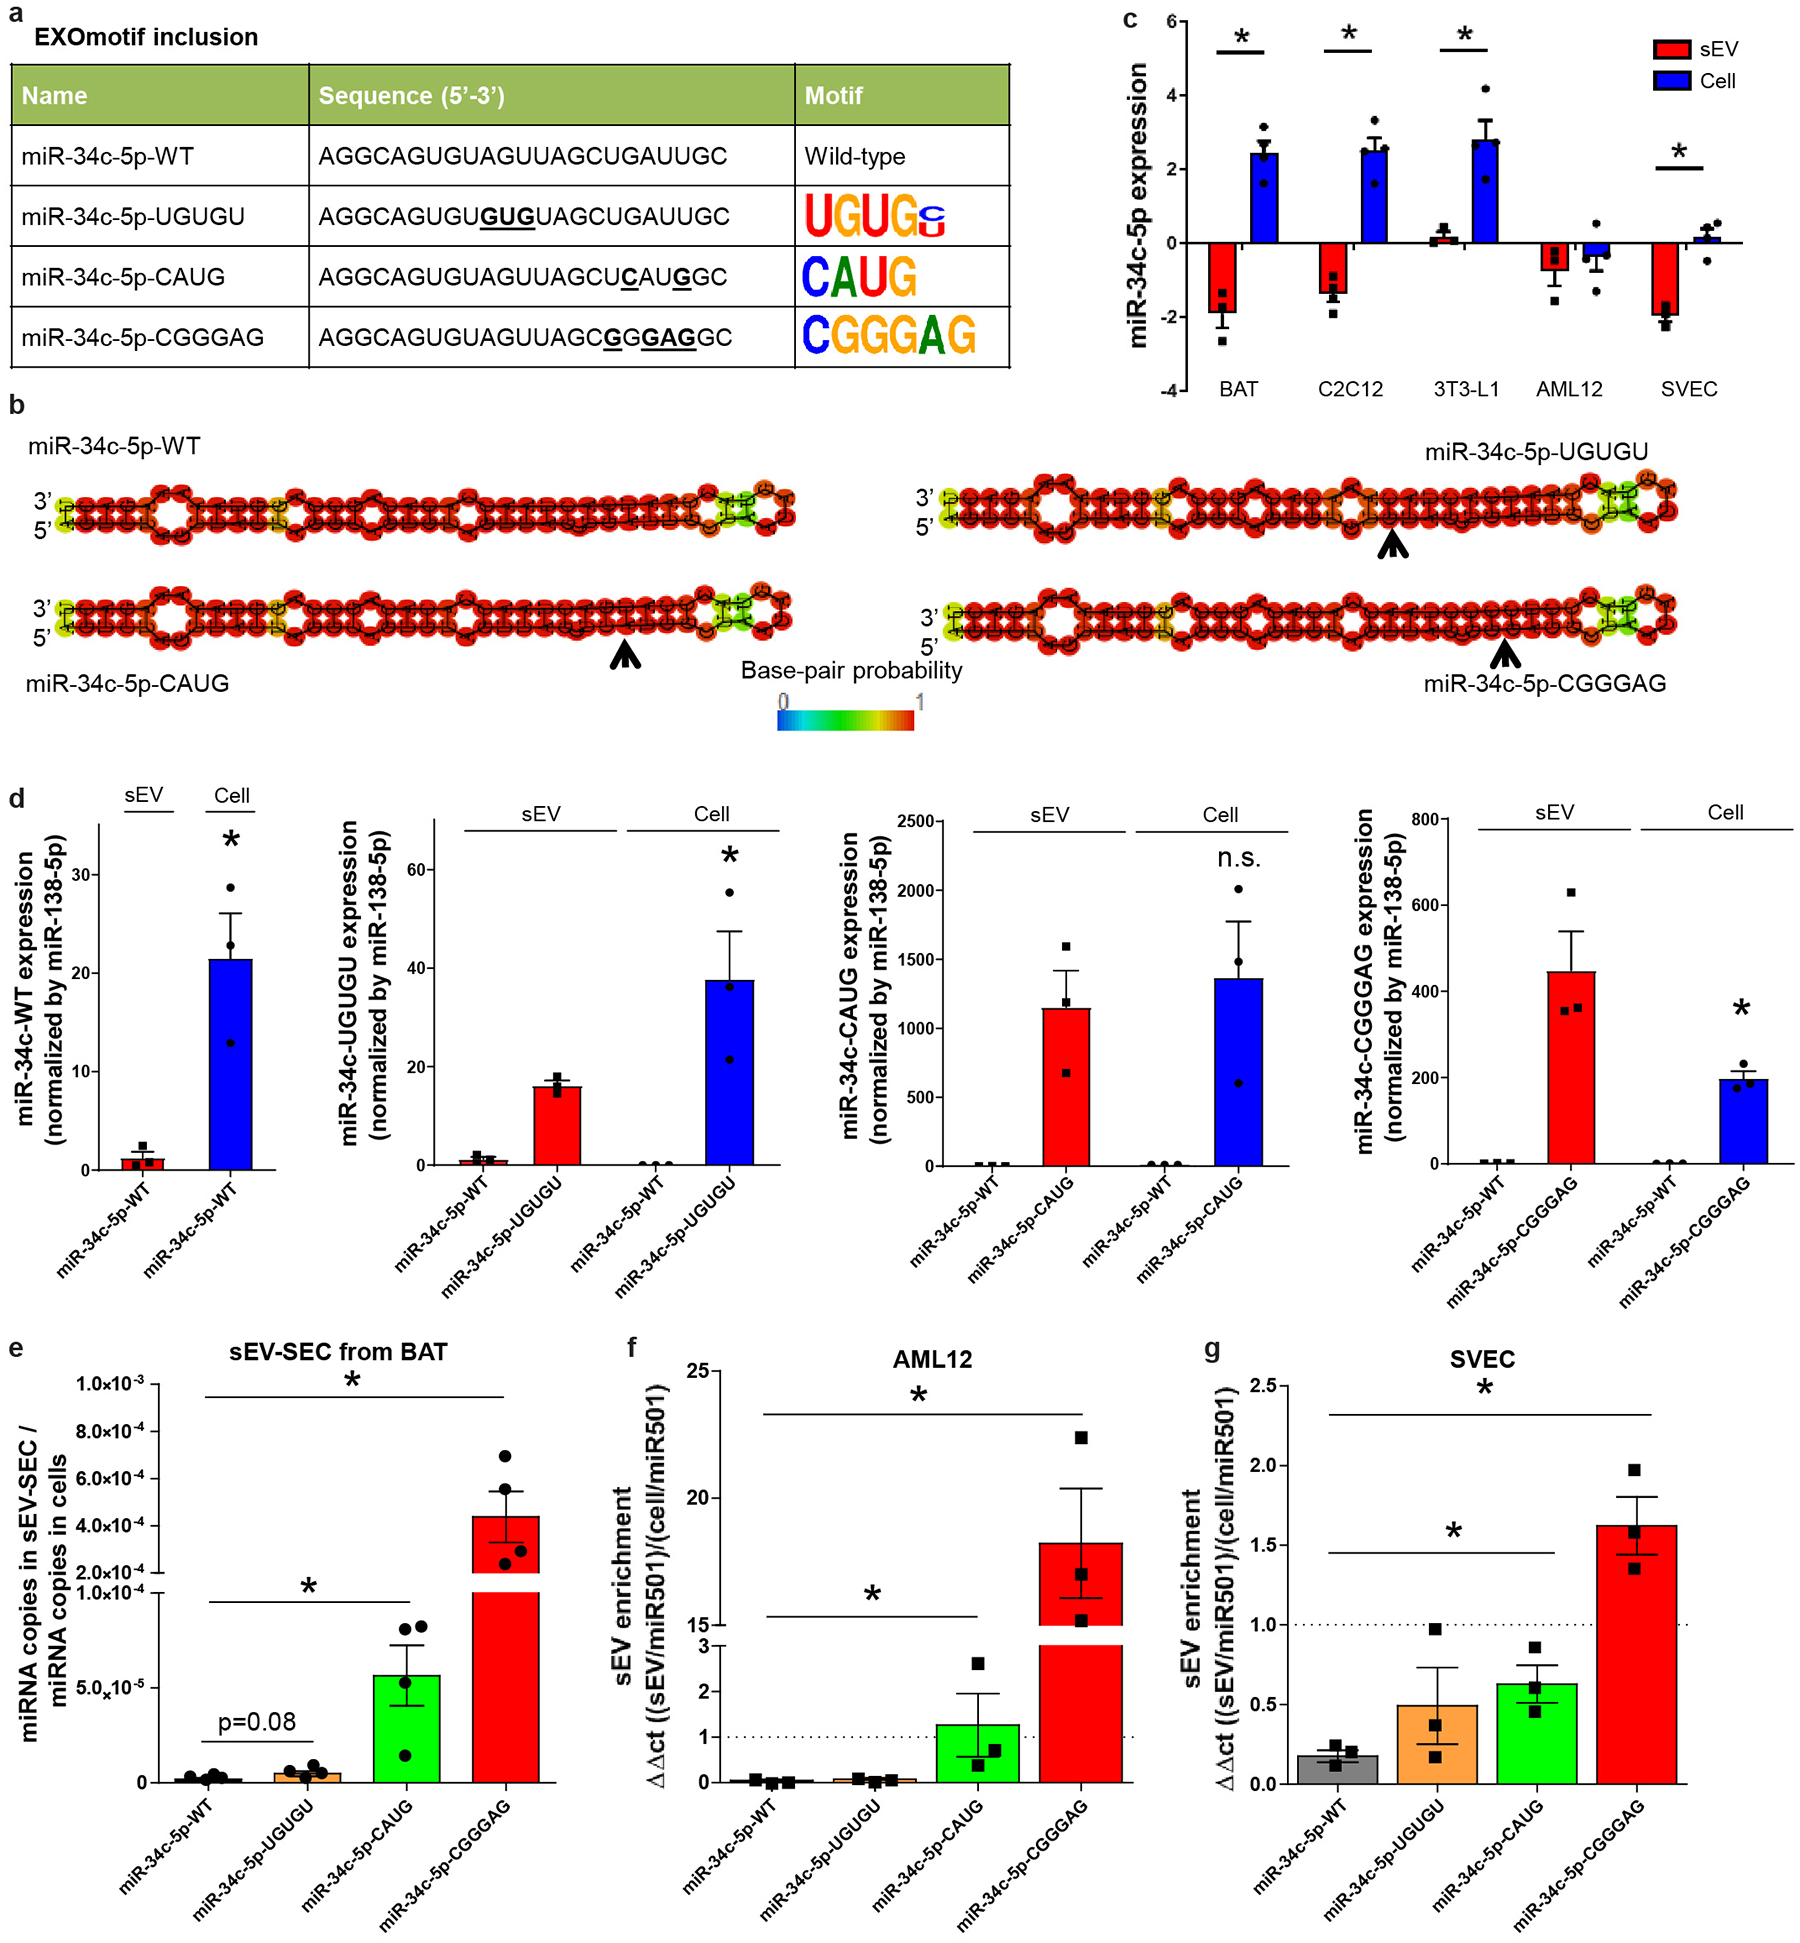
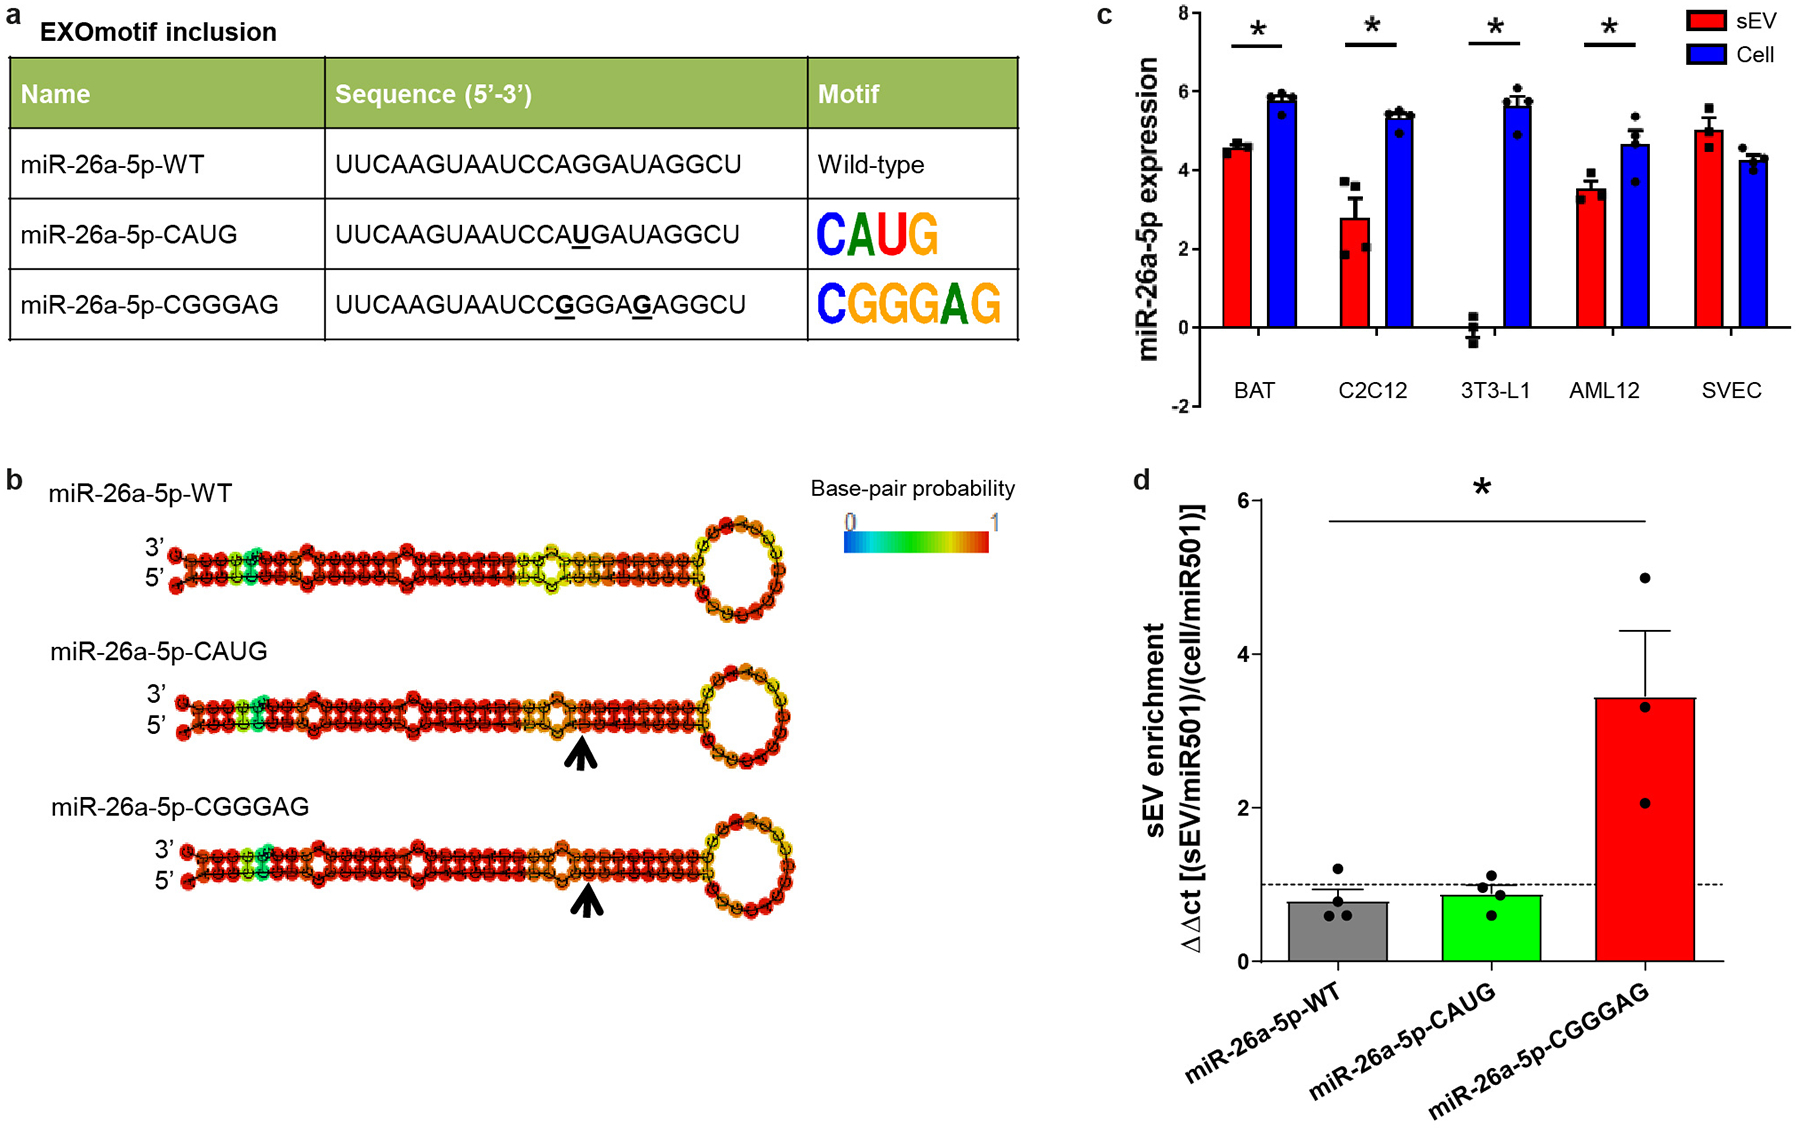
e) sEV enrichment for wild-type miR-34c-5p (miR-34c-WT) or the miR-34c versions containing UGUGU, CAUG or CGGGAG EXOmotifs expressed in brown adipocytes (BAT).
f) sEV enrichment for wild-type miR-26a-5p and its versions containing EXOmotifs CAUG and CGGGAG expressed in BAT.
g) Experimental setup for the miRNA pulldown experiments.
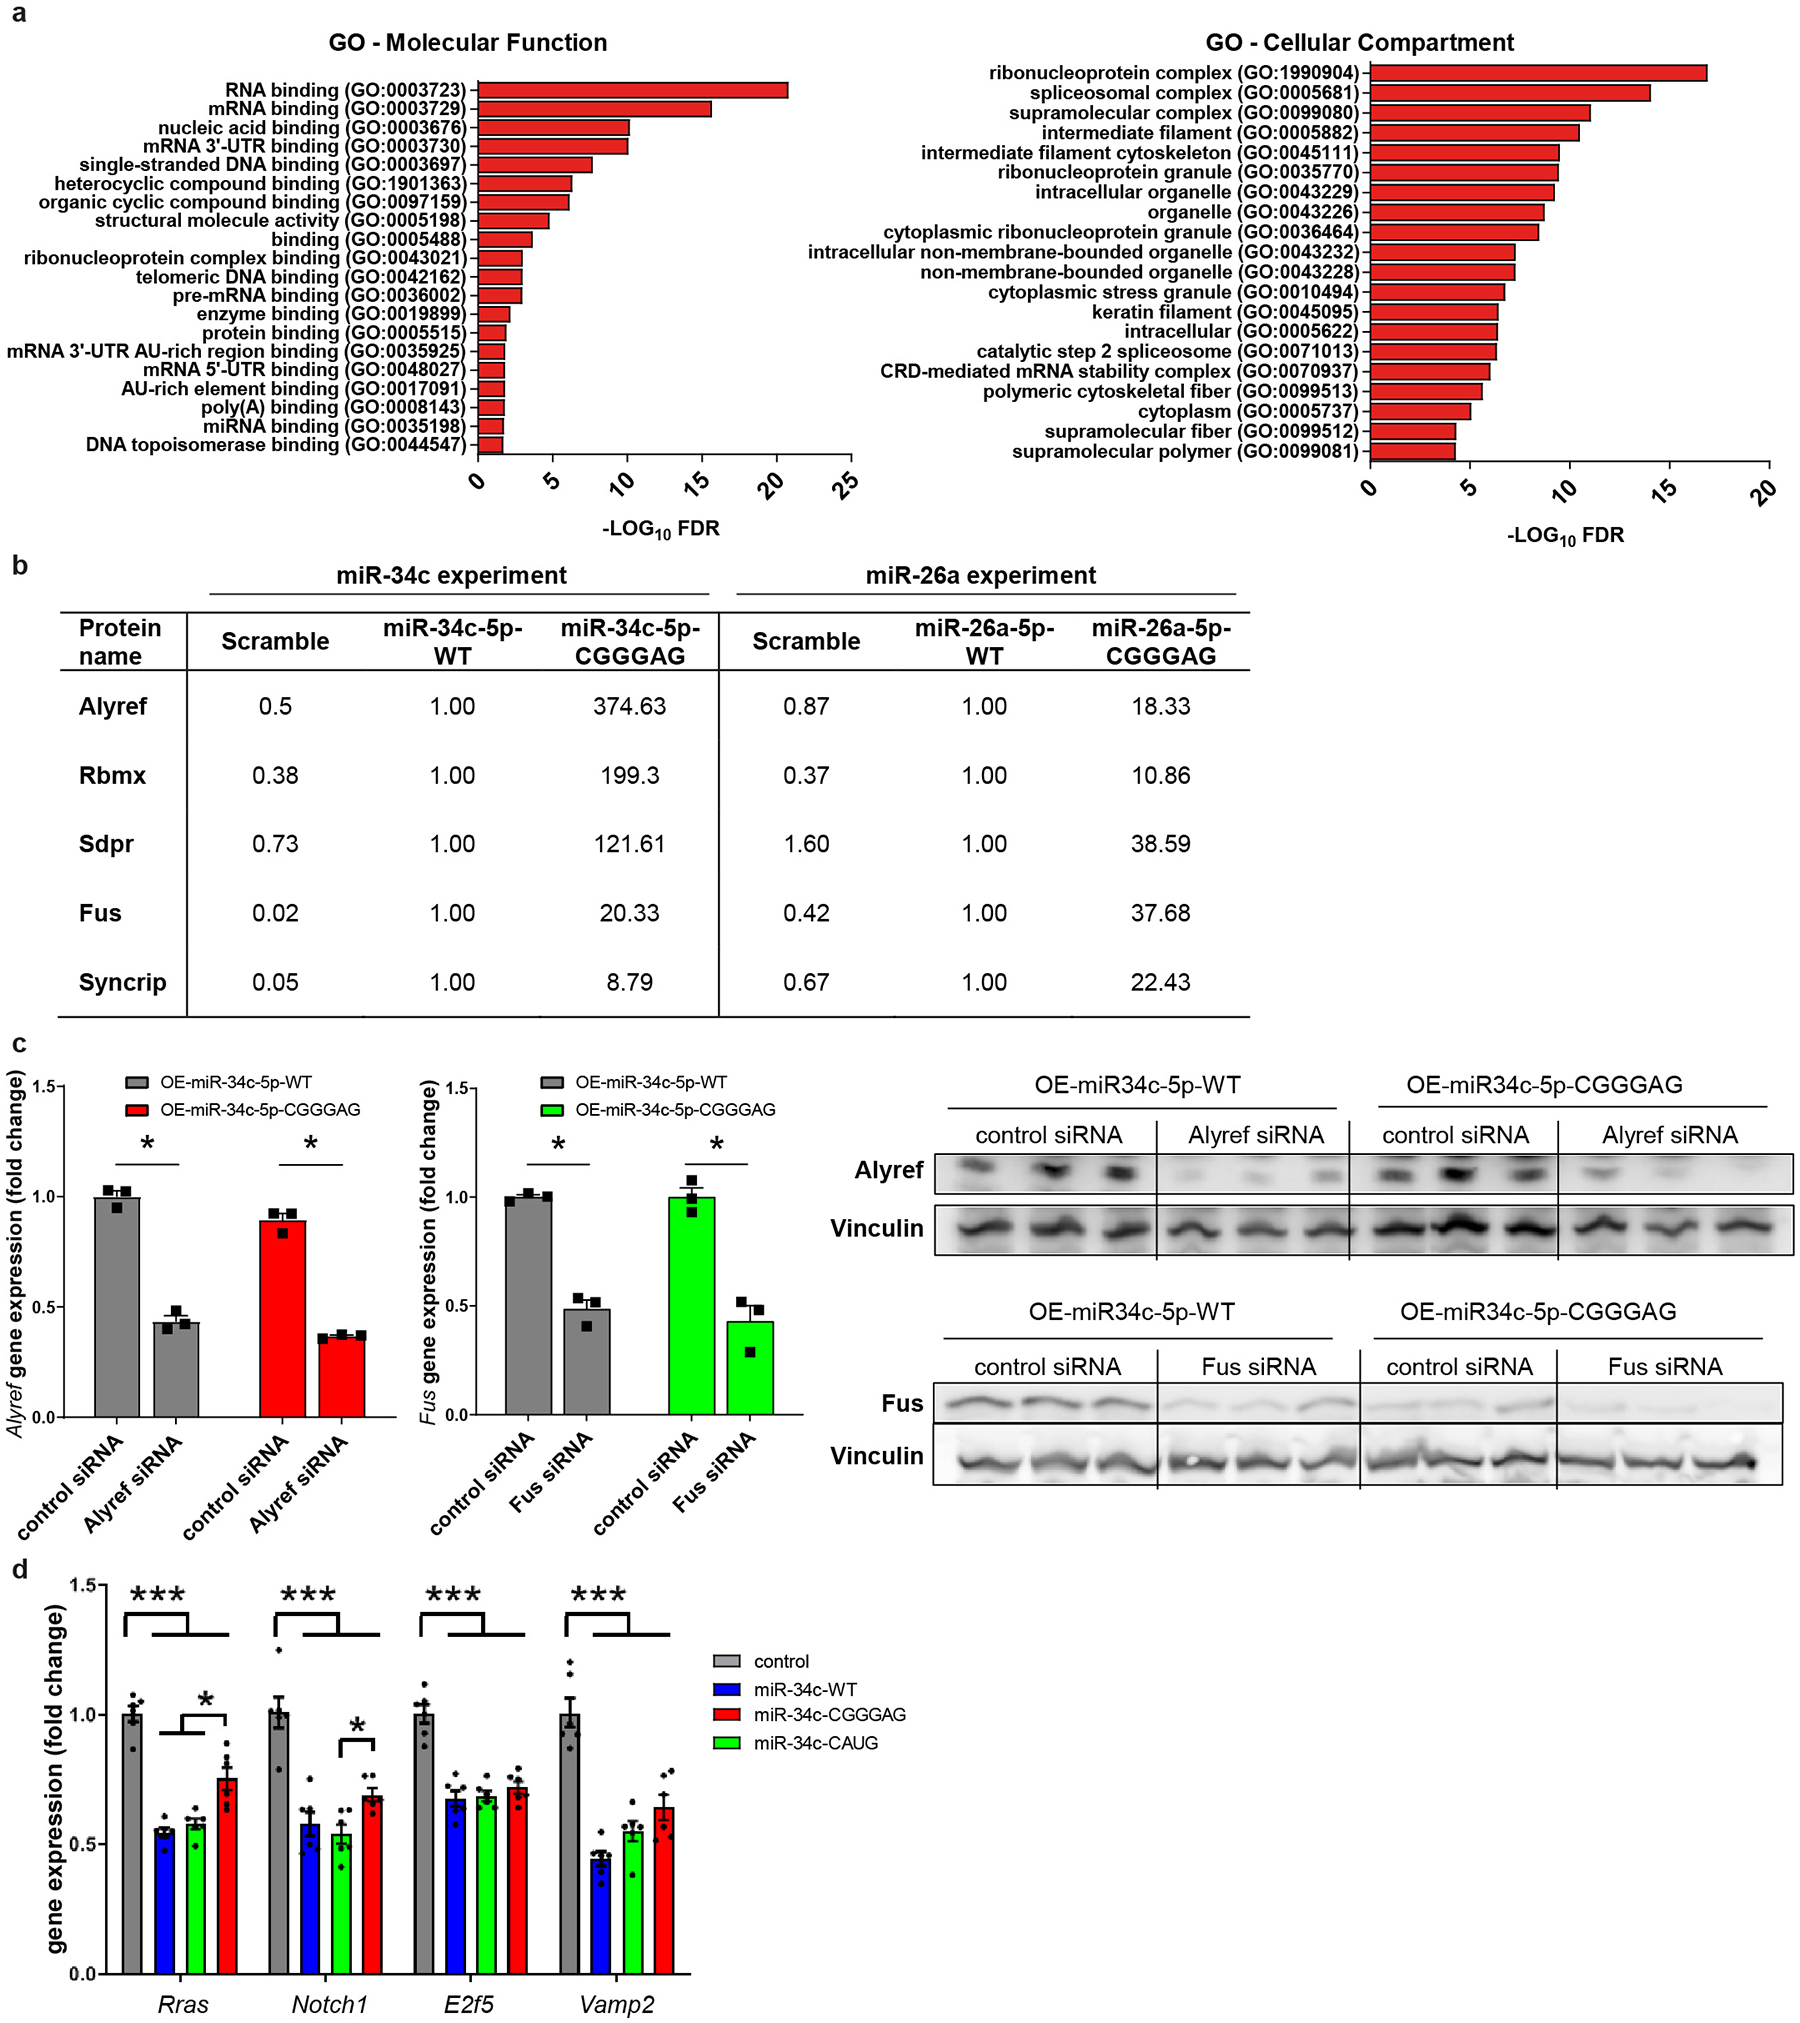
h and i) Proteins displaying at least 8-fold better (log2 > 3) binding to the EXOmotif-containing version relative to its wild-type counterpart. h) Binding to miR-34c-WT was set as 1, and the binding to scrambled miRNA and miR-34c-CGGGAG were calculated relative to miR-34c-WT (n=3). i) Similar to h, but relative to miR-26a-WT (n=3). *P≤0.05 Motif-containing vs WT miRNA (paired T-test with Storey’s method for group-wise correction).
j) sEV enrichment for miR-34c-WT and miR-34c-CGGGAG in BAT treated with Alyref, Fus or non-targeting control siRNAs.
In panels b-f and j, the dashed line separates sEV enrichment (above line) versus cellular enrichment (below line). The data are from 3–4 independent experiments, i.e., biological replicates, with each replicate being the average of duplicate/triplicate qPCR reactions. Expression was normalized to miR-138-5p. Data are expressed as mean ± SEM, *P≤0.05 (Kruskal-Wallis followed by Mann-Whitney-U test).
Trafficking of miRNAs could also be changed by introduction of EXOmotifs. Thus, when the extended EXOmotif UGUG[U/C], Core EXOmotif CAUG or extended EXOmotif CNGGNG (in the form of CGGGAG) were introduced into a highly cell-enriched miRNA in brown adipocytes, miR-34c-5p, there were 4-, 10- and 20-fold enhancements in the sEV/cell ratio with a shift in distribution from predominantly cell-enriched to predominantly sEV-enriched (Fig. 3e and Extended Data Fig. 8a–e). The same effect was seen in other cell types, such as AML12 and SVEC (Extended Data Fig. 8f–g). To confirm that this effect could be extrapolated to other miRNAs, we introduced the same last two EXOmotifs in miR-26a again showing an increase in miR-26a export to sEV in BAT and SVEC cells (Fig. 3f and Extended Data Fig. 9a–d). Thus, the CELL- and EXOmotifs identified participate in miRNA retention versus secretion, and their introduction or removal can serve as a tool to dramatically change miRNA distribution.
Alyref and Fus participate in sorting
Based on the above data, we hypothesized that EXO- and CELL-motifs interact with specific miRNA-binding proteins as part of a sorting mechanism. To explore this, we performed pull-down experiments using cell lysates incubated with biotinylated miR-34c or miR-26a, either in their wild-type form or after introduction of a CNGGNG-EXOmotif (CGGGAG), that showed the highest sEV enrichment among the different motifs identified. The proteins bound to the various miRNAs were then subjected to LC-MS/MS proteomic analysis (Fig. 3g). A scrambled miRNA was used as a control. Among the 67 proteins identified, there was a clear enrichment in known RNA-binding proteins (Extended Data Fig. 10a). Focusing on those proteins which showed at least an 8-fold enrichment in relative binding of the EXOmotif containing-miRNA compared to its wild-type counterpart for both miR-34c and −26a, five proteins were identified: Alyref, Rbmx, Sdpr, Fus and Syncrip (Fig. 3h–i, and Extended Data Fig. 10b). Only Syncrip was previously linked to miRNA sorting24, while other proteins previously-reported as potentially involved in miRNA sorting, including hnRNPA2B1, Lupus La, KRAS, MVP and YBX112,14,17,18,25, were either not detected or bound in equal amounts to both miRNA versions (Supplementary Table 9).
To explore the participation of these proteins, we focused on Alyref and Fus, since Alyref was the top-binding protein to miR-34c-CGGGAG and has a role in RNA export out of the nucleus26, and Fus, which has been shown to interact with AGO2 and miRNAs27. Indeed, lowering the levels of either Alyref or Fus proteins by ~50% by siRNA knockdown (Extended Data Fig. 10c) resulted in a ~50% reduction in CGGGAG-containing miRNA sorting (Fig. 3j). Thus, Alyref and Fus are at least two of the proteins required for miRNA motif recognition and export into sEV.
EXOmotifs enhance miRNA delivery
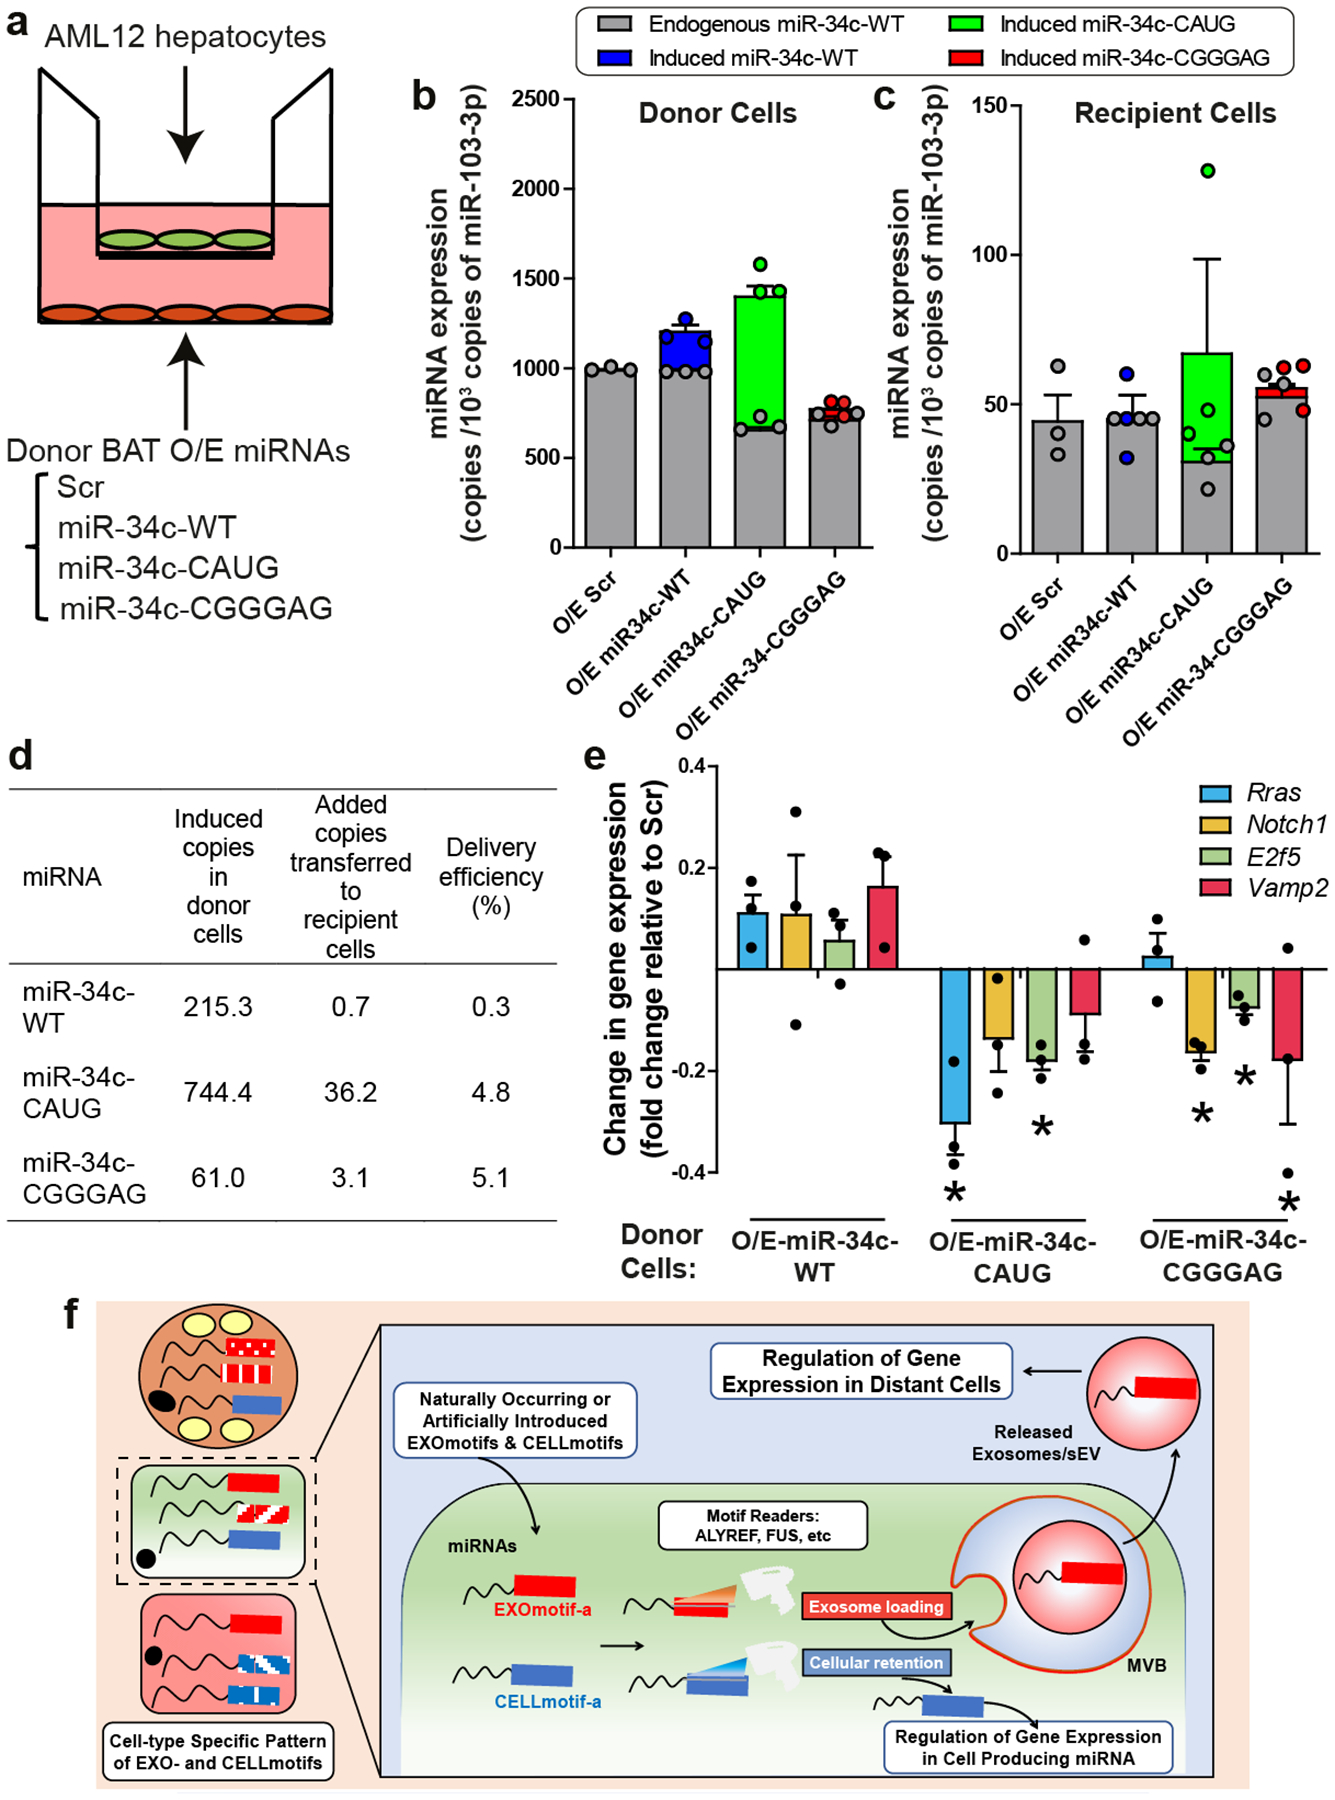
To determine whether introducing EXOmotifs could be used to manipulate miRNA secretion and enhance sEV miRNA delivery to target cells, we developed a transwell system in which brown adipocytes expressing either control/scrambled miRNA, wild-type miR-34c or miR-34c harboring EXOmotifs CAUG or CNGGNG (CGGGAG) were cocultured with AML12 hepatocytes (Fig. 4a). Using ddPCR and sequence-specific PCR primers, we quantitated the number of copies of each miRNA in the donor and recipient cells (Fig. 4b–c). This revealed a minimal increase of miR-34c-WT in recipient cells co-cultured with donors overexpressing the wild-type miR-34c. Comparison of donor versus recipient copy number revealed that only 0.3% of donor copies of miR-34c-WT were transferred to the recipient cells (Fig. 4d). In contrast, more than 16-fold higher relative amounts of miR-34-CAUG (4.8%) and miR-34c-CGGGAG (5.1%) could be detected in recipient cells co-incubated with the donors overexpressing these EXOmotif-containing miRNA versions (Fig. 4d), indicating much more efficient delivery to the target cells and consistent with their increased sEV enrichment. This improved delivery led to enhanced down-regulation of miR-34c targets28–31 in the recipient cells (Fig. 4e). This was not due to a change in the affinity of the miRNAs for their targets as judged by direct transfection with mimetics of these miRNAs (Extended Data Fig. 10d). Thus, addition of EXOmotifs to miRNAs can enhance both sEV secretion and the ability of the secreted miRNAs to inhibit target genes in recipient cells.
Figure 4.
Incorporation of EXOmotifs enhances miRNA delivery and target inhibition.
a) Diagram illustrating the transwell experiment.
b) miRNA expression for endogenous basal miR-34c (grey bar), induced wild-type miR-34c over the basal (blue), miR-34c-CAUG (green) and miR-34c-CGGGAG (red) in the donor cells and expressed as the number of copies of each miRNA per 103 copies of miR-103-3p as an endogenous control.
c) miRNA expression for basal miR-34c (grey bar), induced wild-type miR-34c over the basal (blue), miR-34c-CAUG (green) and miR-34c-CGGGAG (red) in the recipient cells after co-incubation with the donor cells overexpressing these miRNAs respectively, as indicated in the x-axis and normalized per 103 copies of miR-103-3p.
d) Average number of copies of each miRNA induced in the donor cells above the levels measured in control Scr cells (second column) and the number of copies in the recipient cells over the levels in cells cocultured with the O/E-Scr donors (third column). Values are normalized per 103 copies of miR-103-3p. The last column represents the ratio between the second and third columns.
e) Change in gene expression for miR-34c targets in the recipient cells induced by the coculture with miR-34c-WT, miR-34c-CAUG or miR-34c-CGGGAG donor cells as indicated in the x-axis and relative to recipient cells co-incubated with O/E-Scr donors. n=3; Data are expressed as mean ± SEM. *P≤0.05 motif-containing vs WT-miR-34c for each gene (Kruskal-Wallis followed by Mann-Whitney-U test).
f) Proposed model for the sEV/exosomal sorting and cellular retention of miRNAs mediated by the cell-specific repertoire of EXO- and CELLmotifs. In this, “reader” proteins (i.e., Alyref and Fus for motif CGGGAG) recognize the miRNA motifs that promote sorting of EXOmotif-harboring miRNAs into exosomes/multivesicular bodies (MVB) or cellular retention (CELLmotif). The released exosomes then deliver their miRNA cargo to nearby or distal cells leading to changes in gene expression and cellular function.
Discussion
Using a robust system of five metabolically-important cell types and miRNA-profiling, we show that the miRNA population released in sEV/exosomes for each cell type is clearly distinct from the population present in the cell of origin, and that what miRNAs are sEV-enriched different for each cell-type. Sequence analysis shows that this strongly correlates with the presence of sEV export (EXOmotifs) versus cellular retention (CELLmotifs) sequences. Indeed, some EXOmotifs are enriched up to 80-fold in sEV miRNAs. While previous publications have observed single tetranucleotide motifs that correlate with export for a small fraction of miRNAs in a single cell type16–18, our data indicate this is a more complex, integrated system involving multiple motifs which contribute to sEV sorting and cellular retention in a cell-specific manner (Figure 4f). Introduction of miRNA sorting motifs can improve sEV miRNA transfer or cellular retention dramatically and lead to enhanced transfer to target cells and reduction in the expression of target genes, thereby demonstrating the potential to enhance effectiveness of miRNA delivery13,32.
While the full mechanism of sorting remains to be determined, it appears that multiple miRNA-binding proteins are involved. We find that Alyref and Fus are two proteins participating in the sorting of the EXOmotif providing highest sEV enrichment [CGGGAG] (Figure 4f). Defining the full miRNA sorting machinery involved in cellular retention versus exosomal/sEV secretion will not only help better relate circulating miRNAs to their tissue of origin and understand how circulating miRNAs change in disease, but also open the possibility of regulating miRNA retention or secretion for therapeutic benefit.
Methods
Cell culture
3T3-L1 cells (ATCC, catalog nr CL-173) were grown in DMEM-high glucose (Thermofisher catalog nr 11965) supplemented with 10% fetal bovine serum (Atlas Biologicals), 1% penicillin/streptomycin (Thermofisher) and 0.2 % normocin (Invivogen) to prevent mycoplasma contamination. The absence of mycoplasma in cell culture samples was tested repeatedly in the curse of this study. For the experiments, 3T3-L1 cells were grown to confluence and differentiated using a cocktail containing 0.5 mM isobutylmethylxanthine (IBMX), 5 μg/mL insulin and 0.25 μM dexamethasone in growth medium for 72h. Thereafter, cells were maintained in growth medium supplemented with 5 μg/mL insulin for 8 additional days. Immortalized brown pre-adipocytes (BAT) were generated as described previously33 and grown in DMEM-high glucose, 20 % fetal bovine serum, 1 % penicillin/streptomycin and 0.2% normocin. For the experiments, cells were grown to confluence and differentiated by supplementing growth medium with 0.5 mM IBMX, 0.125 mM indomethacin, 1 μM dexamethasone, 20 nM insulin, 1 μM Rosiglitazone and 1 nM T3 for 2 days. After that, cells were grown in culture medium only supplemented with 20 nM insulin and 1 nM T3 for 9 more days, leading to massive accumulation of multilocular lipid droplets and upregulation of multiple brown fat markers33. AML12 hepatocytes were purchased from ATCC (catalog nr CRL-2254) and grown in DMEM/F12 high glucose (Thermofisher catalog nr 10565), 10% fetal bovine serum, 1% penicillin/streptomycin and 0.2% normocin supplemented with insulin-transferrin-selenium-sodium pyruvate mixture (ITS-A, Thermofisher), 15 mM HEPES (Millipore-Sigma) and 40 ng/mL dexamethasone. SVEC endothelial cells and C2C12 myoblasts were purchased from ATCC (catalog nr CRL-2181 and CRL-1772, respectively) and cultured in the same growth medium as 3T3-L1 adipocytes. Upon confluence, C2C12 myoblasts were differentiated by culturing the cells in DMEM-high glucose supplemented with 2% horse serum, 1% penicillin/streptomycin and 0.2% normocin for 6 additional days. All reagents above were purchased from Millipore-Sigma unless otherwise stated.
sEV isolation
All cell lines were grown to full confluence and differentiated as described above. To collect sEV, cells were washed with PBS and incubated for 48 hours in DMEM-high glucose medium supplemented with 10% exosome-free fetal calf serum (System Biosciences) and 1% penicillin/streptomycin. The medium was then collected, and sEV were isolated by standard differential centrifugation protocol34. Briefly, medium was successively centrifuged at 500 g for 10 min, 2,000 g for 10 min and 10,000 g for 30 min to remove floating cells, cellular debris and large vesicles, respectively. The supernatant was then ultracentrifuged at 100,000 g for 70 min using a SW-28 rotor (Beckman Coulter). sEV pellets/exosomes were washed with PBS, centrifuged again at 100,000 g for additional 70 min and resuspended in TRIzol reagent (Thermofisher) for RNA isolation, in PBS for nanoparticle tracking analysis (NTA) and electron microscopy or in RIPA buffer for immunoblotting. For non-conditioned medium (NCM) analysis, the same volume of cell culture medium containing exosome-free fetal calf serum as for cell-derived exosome isolation was subjected to the sEV/exosome isolation protocol described above and resuspended in TRIzol for further RNA isolation.
For some experiments, sEV samples were subjected to an additional isolation step using size exclusion chromatography. Briefly, the sEV pellet obtained after the second ultracentrifugation at 100,000 g was resuspended in 0.5 mL PBS and loaded into a resin column (70 nm pore size, iZON). The flow-through was collected in 30 fractions of 0.5 mL each. An aliquot of each fraction was used for particle concentration determination by nanoparticle tracking analysis (NTA). For protein determination, some fractions were pooled and concentrated using Amicon centrifugal filter (> 3 KDa), as protein concentrations were low. All samples were also subjected to immunoblotting for CD63 and CD9. Two peaks of protein were identified: one (namely sEV-SEC) corresponding to the fractions 7–10, where most of the vesicles were identified by NTA and samples were positive for CD63 and CD9; and another one (namely non vesicular, NV-SEC) from fractions 17 to 24 having no vesicles by NTA and no CD63/CD9 signal by immunoblotting. sEV-SEC and NV-SEC fractions were concentrated by using Amicon 100K and Amicon 3K centrifugal units (Millipore), respectively, and subjected to RNA isolation and miRNA profiling as described below.
RNA isolation, miRNA profile and miRNA qPCRs
Cells, sEV (also called sEV-p100), sEV-SEC and NV-SEC samples were resuspended in TRIzol. Upon addition of chloroform, samples were centrifuged at 12,000 g for 15 min. The upper phase was collected and mixed with isopropanol, 250 mM ammonium acetate and 1 μg/mL RNA-grade glycogen (Thermofisher) and incubated overnight at −20°C. Samples were then centrifuged at 12,000 g for 30 min, washed twice with 75% ethanol and resuspended in nuclease-free water. The RNA concentration was assessed by Nanodrop, and equal amounts of RNA for each cell type were used for miRNA profile analysis. This was accomplished using a quantitative real-time PCR (qPCR)-based kit (RA670A-1, System Biosciences) following manufacturer’s instructions. To calculate sEV enrichment, the ratio of the average Ct in the sEV versus the averaged Ct in the cell lysate was calculated for each miRNA and for each replicate pair. A FDR<0.1 was used as cut-off to determine statistically significant sEV or cellular enrichment. As control, we performed miRNA profiling on RNA isolated from non-conditioned medium (NCM) versus the same volume of sample as used for cell-secreted sEV, to determine how much of the original PCR signal might be ascribed to NCM-containing miRNAs.
For experiments using miRNA mutations, RNA was subjected to reverse transcription using miRCURY LNA miRNA Kit (339320, Qiagen), and individual miRNAs were quantitated by real-time PCR (qPCR) using highly specific Locked Nucleic Acid (LNA) primer assays (Qiagen). miR-138-5p and miR-501-5p were used to normalize sEV versus cellular content since the miRNA profile showed equal distribution of these two miRNAs in the sEV and cells of all cell types. sEV enrichment was determined as the ratio between sEV and cellular expressions by the ΔΔct method after normalization using either miR-138-5p or miR-501-5p. Each sEV enrichment value shown in this study is from an independent biological replicate, with each independent biological replicate being the average of duplicate or triplicate qPCR reactions.
For gene expression analysis different from miRNAs, RNA was reverse transcribed using a high-capacity complementary DNA reverse transcription kit (Applied Biosystems) according to the manufacturer’s instructions. cDNA was mixed with SYBR Green PCR Master Mix (Applied Biosystems) and 400 nM primers (Integrated DNA Technologies), and the reactions were run on a C1000 Thermal Cycler (Bio-Rad, catalog CFX384) using TATA-Box Biding Protein (Tbp) as internal control. CFX Manager software (Bio-Rad) was used to collect qPCR data.
Small RNA sequencing (smRNAseq)
RNA isolation was performed from sEV and cell lysates of AML12 and differentiated 3T3-L1 cells as described above. cDNA library preparation and sequencing were performed at the Harvard Biopolymers Facility (Harvard University). Briefly, the Total-RNA samples were quantified using an Agilent Bioanalyzer 2100 instrument, with a corresponding Agilent Bioanalyzer RNA Nano assay. The resulting RIN (RNA Integrity Number) scores and concentrations were taken into account for qualifying samples to proceed. The samples were normalized to 1 ng of input in 5 μL (200 pg/μL), and the smRNA was prepped using the Qiagen miRNAseq workflow (Qiagen 331502). cDNA synthesis, adapter ligation, and amplification were conducted as part of the same workflow. Following amplification, residual primers were eluted away using QiaSeq Beads in a SPRI-based cleanup. The resulting purified libraries were run on an Agilent 4200 Tapestation instrument, with a corresponding Agilent High Sensitivity D1000 ScreenTape assay to visualize the libraries and check that the size and concentrations of the libraries matched the expected product. Molarity values obtained from this assay were used to normalize all samples in equimolar ratio for one final pool. The pool was denatured and loaded onto an Illumina MiSeq instrument with a Nano V2 kit, to test adaptor ligation and pooling balance for each of the samples. The verified pool was then loaded onto a NextSeq 500 instrument, with a High-Output 75-cycle kit to obtain Single-End 75 bp reads. The pool was loaded at 1.8 pM, with 5% PhiX spiked in as a sequencing control. The base-call files were demultiplexed through the Harvard BPF Genomics Core’s pipeline, and the resulting fastq files were used in subsequent analysis. Expression data for the smRNAseq experiment can be found in Supplementary Table 10.
Primary hepatocyte isolation
All animal studies were conducted in compliance with the regulations and ethics guidelines of the NIH and were approved by the IACUC of the Joslin Diabetes Center. Wild-type C57Bl/6J male mice (8 weeks old) were purchased from Jackson mice (reference 00664) and anesthetized with avertin. Liver was perfused with PBS-EDTA 0.5 mM at a rate of 5 mL/min for 4 minutes followed by a solution of 1.2 mg/mL collagenase type I (Thermofisher) in DMEM high glucose medium at 5 mL/min for 8 min through the inferior vena cava. Portal vein was cut to allow exit of the solutions. After that, liver pieces were shaken in a Petri dish to allow cell release. Hepatocytes were then pelleted by centrifugating twice in FBS-containing DMEM high glucose at 50 g for 1min 30sec and filtered through a 100 μm strainer. Cell viability was assessed by counting number of cells stained with trypan blue (>90% viability). One million live cells/well were seeded in collagen pre-coated [overnight, 4°C in collagen-from calf skin (Sigma)] 6-well plates (4 plates per sample). Next days, cells were washed and incubated in DMEM-high glucose containing 10% exosome-free FBS and 1% penicillin/streptomycin for 48 h for sEV isolation as described above.
Droplet Digital PCR (ddPCR)
To assess miRNA true copy number, we used ddPCR technique. PCR mixes containing EvaGreen Supermix (Bio-Rad), specific LNA primers (Qiagen) and cDNA obtained using miRCURY LNA miRNA Kit (Qiagen) as described above were mixed with droplet generation oil (Bio-Rad) prior generating droplets using aQX200 Droplet Generator (Bio-Rad). Droplets were run in a C1000 Touch Thermal Cycler (Bio-Rad) using miRCURY PCR protocol (Qiagen), i.e. 2 min at 95 C followed by 40 cycles of 10 sec at 95 C and 60 sec at 56 C. Droplets were later transferred to a QX200 Droplet Reader (Bio-Rad). Data analysis was performed using QuantaSoft software (Bio-Rad) with auto-threshold determination. miR-103-3p, a ubiquitously, abundantly and stably expressed miRNA35, was used as endogenous control for the miRNA transfer experiment. Other widely used housekeeping RNAs35 such as U6 snRNA and miR-191-5p were measured in the recipient cells and significantly correlated with miR-103-3p levels (r = 0.834, p=0.0001 for U6 snRNA; r = 0.64, p=0.008 for miR-191-5p). In the transwell experiment, the background, i.e. non-specific, signals for the expression of miRNAs miR-34c-CAUG and miR-34c-CGGGAG in Scr and miR-34c-WT overexpressing donors were only 3.0% and 0.4%, respectively, of the amounts detected in the cells overexpressing these modified miRNAs and subtracted from each value in all samples. In recipient cells, the background signals were 12% for miR-34c-CAUG and 20% for miR-34c-CGGGAG, respectively, of the total amounts detected in the recipient cells being cocultured with cells overexpressing these two modified miRNAs and subtracted from each sample. For the calculation of the abundance of wild-type and mutated versions of miR-34c in sEV-SEC derived from brown adipocytes, for each sEV sample the total miRNA copy number was calculated by multiplying the copy number/ng RNA by the total amount of RNA isolated from that sample sEV and normalized by the calculated miRNA copy number in all cells producing the sEV of that sample.
Generation of miRNA mutations
Sequences for murine pre-miR-34c, pre-miR-26a, pre-miR-431, pre-miR-140 and pre-miR-677 and their flanking genomic 100 bp upstream and downstream were obtained from Ensembl database and synthesized by Integrated DNA Technologies. For mutations, the sequences were modified to introduce or remove EXOmotifs and CELLmotifs by changing the indicated nucleotides in both the guide strand and the passenger strand to maintain the same pre-miRNA structure, as predicted by RNAfold WebServer (University of Wien). The sequence of the mature miRNAs can be found in the tables displayed in Extended Data Figures 7–9. The sequences of the wild-type and mutated pre-miRNAs showing the mutations in both guide and passenger strands can be found in Supplementary Table 11. The sequences were cloned into the backbone lentiviral vector containing GFP and puromycin resistance cassettes (CD513, System Biosciences). A scramble non-targeting stem-loop precursor miRNA cassette into the same backbone lentiviral vector (MMIR000-PA-1, System Biosciences) was used as expression control. Plasmids were used to transfect BAT pre-adipocytes, AML12 hepatocytes and SVEC endothelial cells as indicated and expressing cells were selected 6 days later by puromycin resistance or by Flow Cytometry (FACS) (MoFlo Legacy, Beckman Coulter) for GFP signal at the Joslin Flow Cytometry Core (Joslin Diabetes Center).
miRNA transfer experiments
Donor brown adipocytes (5×10⁵ cells) overexpressing either wild-type or mutated versions of miR-34c-5p were FACS sorted by positive GFP fluorescence and seeded in 6-well plates. The same GFP gating strategy (top 20% brightest cells in miR-34-CAUG overexpressing cells) was applied to all samples so that all of them expressed the same intensity of GFP and, therefore the same degree of expression of the miRNA transgene. Cells were allowed to attach and grow to confluence for additional 48 hours. After that, cells were differentiated for 7 days, washed with PBS and added exosome-free medium. 2 × 10⁴ AML12 cells were seeded in transwell inserts (polyethylene terephthalate, 1 μm pore size, Thermofisher). Both cell types were co-cultured for 24h after which recipient and donor cells were washed and processed for RNA isolation as described above.
Mimic miRNA transfection experiments
AML12 hepatocytes grown in 24-well plates were transfected with 66 nM (40 pmol/well) of either non-targeting negative control, mimic wild-type miR-34c, miR-34c-CAUG or miR-34c-CGGGAG (Horizon Discovery) using lipofectamine RNAiMAX (Thermofisher). After 24 hours, cells were washed with PBS and TRIzol was added for RNA isolation.
miRNA pulldown and RNA-binding proteomics
Brown adipocytes were cultured and differentiated as described above. They were scrapped and incubated in hypotonic lysis (HL) buffer [10 mM Tris, 20 mM KCl, 1.5 mM MgCl2, 0.5 mM DTT, 0.5 ethylene glycol-bis(β-aminoethyl ether)-N,N,N′,N′-tetraacetic Acid (EGTA), 5% glycerol, 0.5% NP-40, and protease inhibitor cocktail (Biotool), pH 7.5] for 30 min on ice, followed by centrifugations at 2,000 g and 10,000 g. In parallel, 25 μL avidin beads/sample (V2011, Promega) were washed twice in HL buffer and conjugated with 22nt-polyA. To do so, they were incubated with 5 nmol 22nt-polyA (IDT), 1 mg/mL yeast tRNA (Sigma), 5 mg/mL ultrapure BSA (Thermofisher) and 1 μL/mL RNasin ribonuclease inhibitor (Promega) in hypotonic lysis buffer for 2 h 30min. Cell lysates were incubated with the polyA-conjugated avidin beads for 6 h at 4°C in continuous rotation, after which they were centrifuged at 1,500 g twice to remove the beads. Precleared lysates were incubated overnight at 4°C in continuous rotation with avidin beads conjugated to one of the following miRNAs: wild-type miR-34c, CGGGAG-miR-34c, wild-type miR-26a, CGGGAG-miR-26a, scramble miRNA (5’-UCUAGUCGACUUACGACCAG-3’) and 22-nt-polyA (IDT) in the presence of 1 μL/mL RNasin ribonuclease inhibitor. All constructs, including 22nt-polyA and scramble miRNA, had a 5’-biotin group followed by Spacer9 sequence. For the conjugation, 25 μl avidin beads/sample were incubated with 5 nmol of one of each construct mentioned above, 1 mg/mL yeast tRNA (Sigma), 5 mg/mL ultrapure BSA (Thermofisher) and RNasin ribonuclease inhibitor (Promega) in hypotonic lysis buffer for 6h at 4°C followed by two washes in HL buffer.
After overnight incubation, beads were collected by centrifugation at 1,500 g and successively washed in the following buffers: once in HL buffer, once in HL buffer containing 100 mM KCl, three times in HL buffer containing 200 mM KCl and once in PBS. RNasin inhibitor was added to the buffers in all steps. For elution of proteins bound to miRNA-conjugated beads, beads were incubated with 5 mM biotin solution for 45 min in continuous rotation. Supernatants were collected and subjected to trichloroacetic acid (TCA) precipitation.
For the mass spectrometry, sample processing was performed as follows. Briefly each sample was re-suspended in a lysis buffer containing 5% SDS and 50 mM triethylammonium bicarbonate (TEAB). The samples were reduced in 20 mM dithiothreitol (DTT) and alkylated with 40 mM iodoacetamide (IAA). Samples were acidified with a final concentration of 1.2% phosphoric acid. Subsequently, 90% methanol in 100 mM TEAB was added. The entire sample volume was spun through the micro S-Trap columns (Protifi) collecting the flow through and binding the samples to the S-Trap column. Subsequently, the S-Trap columns were washed with 90% methanol in 100 mM TEAB. S-Trap columns were placed in a clean elution tube and incubated with trypsin digestion buffer (50 mM TEAB, pH ~8) at a 1:25 ratio (protease:protein, wt:wt) overnight. Peptides were eluted from the S-Trap column with 50 mM TEAB and 0.5% formic acid, and then with 50% acetonitrile in 0.5% formic acid. These pooled elution solutions were dried in a speed vac and then re-suspended in 0.2% formic acid. The re-suspended peptide samples were desalted, concentrated and re-suspended in aqueous 0.2% formic acid containing “Hyper Reaction Monitoring” indexed retention time peptide standards (iRT, Biognosys).
Samples were analyzed by reverse-phase HPLC-ESI-MS/MS using an Eksigent Ultra Plus nano-LC 2D HPLC system (Dublin, CA) directly connected to a quadrupole time-of-flight (QqTOF) TripleTOF 6600 mass spectrometer (SCIEX, Concord, CAN). After injection, peptide mixtures were loaded onto a C18 pre-column chip and washed at 2 μL/min for 10 min with the loading solvent (H2O/0.1% formic acid) for desalting. Subsequently, peptides eluted at a flow rate of 300 nL/min with a 3 h gradient using aqueous and acetonitrile solvent buffers.
For data-dependent acquisitions (DDA, for spectral library building) of peptides and proteins, the 30 most abundant precursor ions from the survey MS1 scan (250 msec) were isolated at 1 m/z resolution for collision induced dissociation tandem mass spectrometry using the Analyst 1.7 (build 96) software as previously described. For data-independent acquisitions (DIA), all peptide samples were analyzed using 64 variable-width isolation windows, adjusted according to the complexity of the typical MS1 ion current. The DIA cycle time of 3.2 sec included a 250 msec precursor ion scan followed by 45 msec accumulation time for each of the 64 variable SWATH segments36,37. Mass spectrometric data-dependent acquisitions (DDA) were analyzed using the database search engine ProteinPilot (SCIEX 5.0 revision 4769) using the Paragon algorithm generating a MS/MS spectral library in Spectronaut v14 (Biognosys). The DIA/SWATH data was processed for relative quantification comparing peptide peak areas from various different time points during the cell cycle. The DIA/SWATH MS2 data sets quantification was based on XICs of 6–10 MS/MS fragment ions, typically y- and b-ions, matching to specific peptides present in the spectral libraries. Peptides were identified at Q< 0.01%, significantly changed proteins were accepted at a 5% FDR (q-value < 0.01).
Nanoparticle tracking analysis (NTA)
Vesicle concentration and size distribution was determined by the dynamic light scattering technology using a Nanosight LM10 (Malvern Panalytical) at the Nanosight Nanoparticle Sizing & Quantification Facility at Massachusetts General Hospital (Charlestown, MA). The script was programmed to take 4 videos for 30 sec each for each sample. The final size and concentrations were determined as the average of the 4 measurements. Upon the second ultracentrifugation at 100,000 g, the sEV pellets from the different cell types were resuspended in the same volume of PBS (100 μL). Given that NTA system (Nanosight LM10) requires the samples to be diluted to a range from 106 to 109 vesicles/mL and that the sEV samples from different cell types were found to have different concentrations of sEV on initial measurement, all samples were diluted to fit within this concentration range. The dilutions were as follows: BAT~24x (33μL sample / 767 μL filtered PBS); C2C12 ~100x (8.15 μL / 791.85 μL PBS); 3T3-L1 ~160x (5 μL sample / 795 μL PBS); AML12 ~100x (8.125 μL sample / 791.85 μL PBS) and SVEC ~100x (8.15 μL sample / 791.85 μL PBS). For the samples isolated by ultracentrifugation + SEC, the dilutions ranged from 20-fold (25 μL sample / 475 μL PBS) to 6-fold (50 μL sample / 250 μL PBS). These dilution factors were taken into account for the calculations of the number of vesicles in the original samples displayed in the graphs.
Electron microscopy
CD63 immunogold staining of sEV preparations was performed at Electron Microscopy Facility at Harvard Medical School (Boston, MA). sEV were isolated by ultracentrifugation as described above and adsorbed to a hydrophilic carbon coated grid. After blocking with BSA, grids were incubated with 5 μL of antibody against the exosome marker CD63 (Biolegend 143901) and later an IgG secondary antibody (Abcam ab6709). The antibody complex was detected using Protein A-gold (10 nm). The grids were examined in a JEOL 1200EX transmission electron microscope, and images were recorded with an AMT 2k CCD camera.
Immunoblotting
sEV and cells were resuspended in RIPA lysis buffer (50 mM Tris-HCl, 150 mM NaCl, 0.25% deoxycholic acid, 1 % NP-40, 1 mM EDTA, pH 7.4, purchased from Millipore Sigma) supplemented with SDS 0.1% and protease and phosphatase inhibitors (Biotool), and incubated on ice for 20 min prior to centrifugation at 12,000 g for 10 min. Supernatants were used for western blotting in SDS-PAGE electrophoresis. sEV-SEC and NV-SEC samples were mixed with 10% RIPA buffer. Protein concentration was determined by a BCA kit (Thermofisher) in an Eon microplate controlled by Gen5 software (Biotek). The following antibodies were used: ALG-2-Interacting Protein X (ALIX) (ab186429, Abcam), TSG101 (sc-7964, Santa Cruz), CD9 (ab92726, Abcam), CD63 (ab68418), GM130 (sc-55590, Santa Cruz), Calnexin (CANX) (ab22595, Abcam), Alyref (also named THOC4, 12655 Cell Signaling), Fus (4885, Cell Signaling), Vinculin (MAB3574, Millipore-Sigma), goat anti-rabbit IgG (H+L)-HRP conjugate secondary antibody (1706515, Bio-Rad) and sheep anti-mouse- HRP conjugate (NA931V, Amersham). All antibodies from abcam, Cell Signaling and Millipore-Sigma were used at a 1/1000 dilution, while those from Santa Cruz were at 1/250. Anti-rabbit and anti-mouse secondary antibodies were used at a 1/5,000 and 1/3,000 dilution, respectively.
Bioinformatic analysis
Gene expression data for miRNA expression was normalized to the mean Ct of all miRNA for each sample. All samples displayed a similar Ct distribution. miRNAs nomenclature was based on miR-Base database version 22 (www.mirbase.org). All miRNA sequences showed in this manuscript are from mouse. To discover differential miRNA in sEV and lysate, we use Limma, an R package for linear modeling that powers differential expression analyses38. Values for Limma t-statistic > 1.6 was used as cut-off. To discover cell type-specific enrichment, we compare the t-statistics of each cell type to the largest t-statistics of other 4 cell types. To calculate sEV enrichment, the ratio of the average Ct in the sEV versus the averaged Ct in the cell lysate was calculated for each miRNA and for each replicate pair. A FDR<0.1 was used as cut-off to determine statistically significant sEV or cellular enrichment. In the case of individual detection of miRNAs by LNA primers and qPCR, exosomal enrichment was determined as the ratio between sEV/exosomal and cellular expressions by the ΔΔct method after normalization using either miR-138-5p or miR-501-5p.
Comparisons between two or more groups were performed using Mann-Whitney U and Kruskal-Wallis non-parametric tests, respectively when group size n<6. For larger group sizes, normal distribution of the data was confirmed by Shapiro-Wilk Normality test and statistical comparisons were performed by ANOVA followed by Bonferroni post-hoc test. SPSS statistical software (IBM) was used for statistical analysis of all data except proteomics. For the statistical analysis of the proteomics study, a paired t-test and further performed group-wise testing correction (Storey method)39 was applied using Spectronaut software (Biognosys). The corrected q-values were used to evaluate the significance of differences in the relative protein abundances between EXOmotifs and wild-type from the study cohorts. Proteins with q-values ≤ 0.01; and an absolute Fold Change ≥ 1.5 were considered to be statistically significant.
For experiments using cell lines, biological replicates were considered cells growing and being treated/differentiated in different plates and their released exosomes/sEV isolated in different tubes and analyzed separately. For most of the experiments in this study, there were four biological replicates (each consisting in pools of three to twelve 15-cm dishes). In addition, many experimental procedures were performed and the different biological replicates collected on separate days or at different times of the day to assure reproducibility of results. For PCR of miRNAs in each biological replication, 2–3 technical replicates were performed and averaged, as indicated in figure legends.
Hypergeometric Optimization of Motif EnRichment (HOMER) de novo motif discovery algorithm40 was used for the identification of motifs with high coverage and explicitness (i.e., low nucleotide variability)23,41. EXOmotifs were identified by searching over-represented motifs found in the sequence of miRNAs with statistically significant sEV enrichment versus all others with a preferential cell retention distribution or with no preferential distribution (background). To identify the CELLmotifs, the sequence of the miRNAs showing statistically significant cellular retention was compared to miRNAs with exosomal distribution or no preferential distribution as background. Motif length was set from 4–7 nucleotides, and those motifs present in more than 10% of the miRNAs and having enrichment of at least 3-fold respect to background were selected. In addition, only motifs with high explicitness were selected23,41 based on the criteria that at least 2/3 of the positions of the motif display a nucleotide with ≥ 60% probability. Probability was assigned by HOMER to each nucleotide for each motif position40. In some few cases where motifs identified by HOMER for the same cell type were almost identical, with the only difference of one or two extra nucleotides added to the edges of a same central core, only the one with the highest enrichment foreground/background was selected. For statistical calculation, HOMER was run in false-discovery-rate (FDR) mode and only motifs with FDR<0.1 were selected. For the identification of Core-EXOmotifs and Core-CELLmotifs, HOMER software was run in a fixed-motif-length mode to search for the different 4 nt-length motif combinations that could be formed out of the extended motifs. We selected the Core motif that provided the best EV- or cell-enrichment, highest abundance and statistical significance obtained by FDR and p-value from Fisher Exact test. In regard to the calculations of the fold-enrichment and abundance of the EXO- and CELL-motifs in the other cell types different from the cell type where they were initially identified, for simplicity, we selected only the predominant nucleotide for a given position when there was ≥60% probability for that nucleotide. In the case of <60% probability for any given nucleotide position, the search was open for two, three of four possible nucleotides in that position on the condition that they had >20% probability.
To identify predicted miRNA gene targets, web-based microT-CDS (Diana Tools, www.microrna.gr/microT-CDS) software was used31.
All graphs were generated using GraphPad Prism and Adobe Illustrator, and data was processed using Microsoft Excel.
Extended Data
Extended Data Figure 1.
General features of sEV secretion among the five cell types studied.
a) Number of vesicles over 48 hours released by each cell type normalized by the number of cells in the tissue-culture plate (n=4). *P≤0.05 (indicated cell type versus all other cell types), § P≤0.05 (indicated cell type versus 3T3-L1, C2C12 and AML-12) (Kruskal-Wallis followed by Mann-Whitney U test).
b) Average vesicle size of the sEV as determined by Nanoparticle tracking analysis (NTA) for each cell type (n=4).
c) Average size distribution and number of vesicles released per cell for each of the five cell types.
d) Immunoblotting for the indicated sEV (ALIX, TSG101 and CD9) and cellular (GM130, CANX) markers in sEV and cell lysates from AML12 hepatocytes and BAT brown adipocytes.
e) Electron micrograph showing CD63 gold immunostaining of sEV isolated from C2C12 cells.
f) RNA yield obtained from sEV isolated from each cell type and normalized by the number of cells in the tissue-culture plate (n=3). *P≤0.05 (indicated cell type versus all other cell types); § P≤0.05 (indicated cell type versus 3T3-L1 and BAT) (Kruskal-Wallis followed by Mann-Whitney U test).
g) Principal component analysis showing cellular miRNA profiles for each cell type.
h) Heatmap showing the top 10 representative cellular miRNAs of each cell type.
i) Heatmap showing the top 10 representative sEV miRNAs of each cell type.
j) Comparative miRNA profile between cell-derived sEV and non-conditioned medium (NCM). Same volume of NCM as in cell-conditioned medium was processed for sEV isolation by differential ultracentrifugation. RNA was isolated and a miRNA profiling was performed for NCM. The miRNA expressions for the 13 miRNAs found sEV-enriched in all 5 cell types were compared to the NCM average Ct by ΔΔct method and represented as fold change. Each dot is the relative average value of each of the five cell types.
Data are expressed as mean ± SEM.
Extended Data Figure 2.
Cell-type specific sEV enrichment of miRNAs and sEV versus cell housekeeping miRNAs. Effect of percentage of CG and Gibbs free energy (ΔG) in miRNA sorting or cellular retention.
a) Normalized gene expression of representative miRNAs showing cell-type specific sEV enrichment: miR-696 (BAT), miR-770-5p (C2C12), miR-1927 (3T3-L1), miR-1931 (AML12) and miR-718 (SVEC). Average Ct from the whole miRNA profile was used for normalization for each sample (n=3–4). *P≤0.05 (Limma t-test)
b) Normalized gene expression of two representative miRNAs (miR-138-5p and miR-501-5p) showing similar sEV and cellular expression for each cell type. Average Ct from the whole miRNA profile was used for normalization for each sample (n=3–4).
c) Percentage of CG content in the sequence of the miRNAs: those sorted into the sEV in all cells are shown in red (n=13); those sorted into sEV in 3 or 4 of the five cell types are shown in green (n=90); those not enriched in either sEV or cells are shown in black (n=109); those retained in 3 or 4 cell types are shown in pink (n=97); and those retained in the cell bodies of all cell types are shown in blue (n=43).
d) The calculated Gibbs free energy (ΔG) for each of the miRNA in each of the five groups described in panel c.
For c and d lines indicate mean value, **P≤0.01, *** P≤0.001 between the indicated group and the other four groups (ANOVA followed by Bonferroni post-hoc test in c and d).
Data are expressed as mean ± SEM.
Extended Data Figure 3.
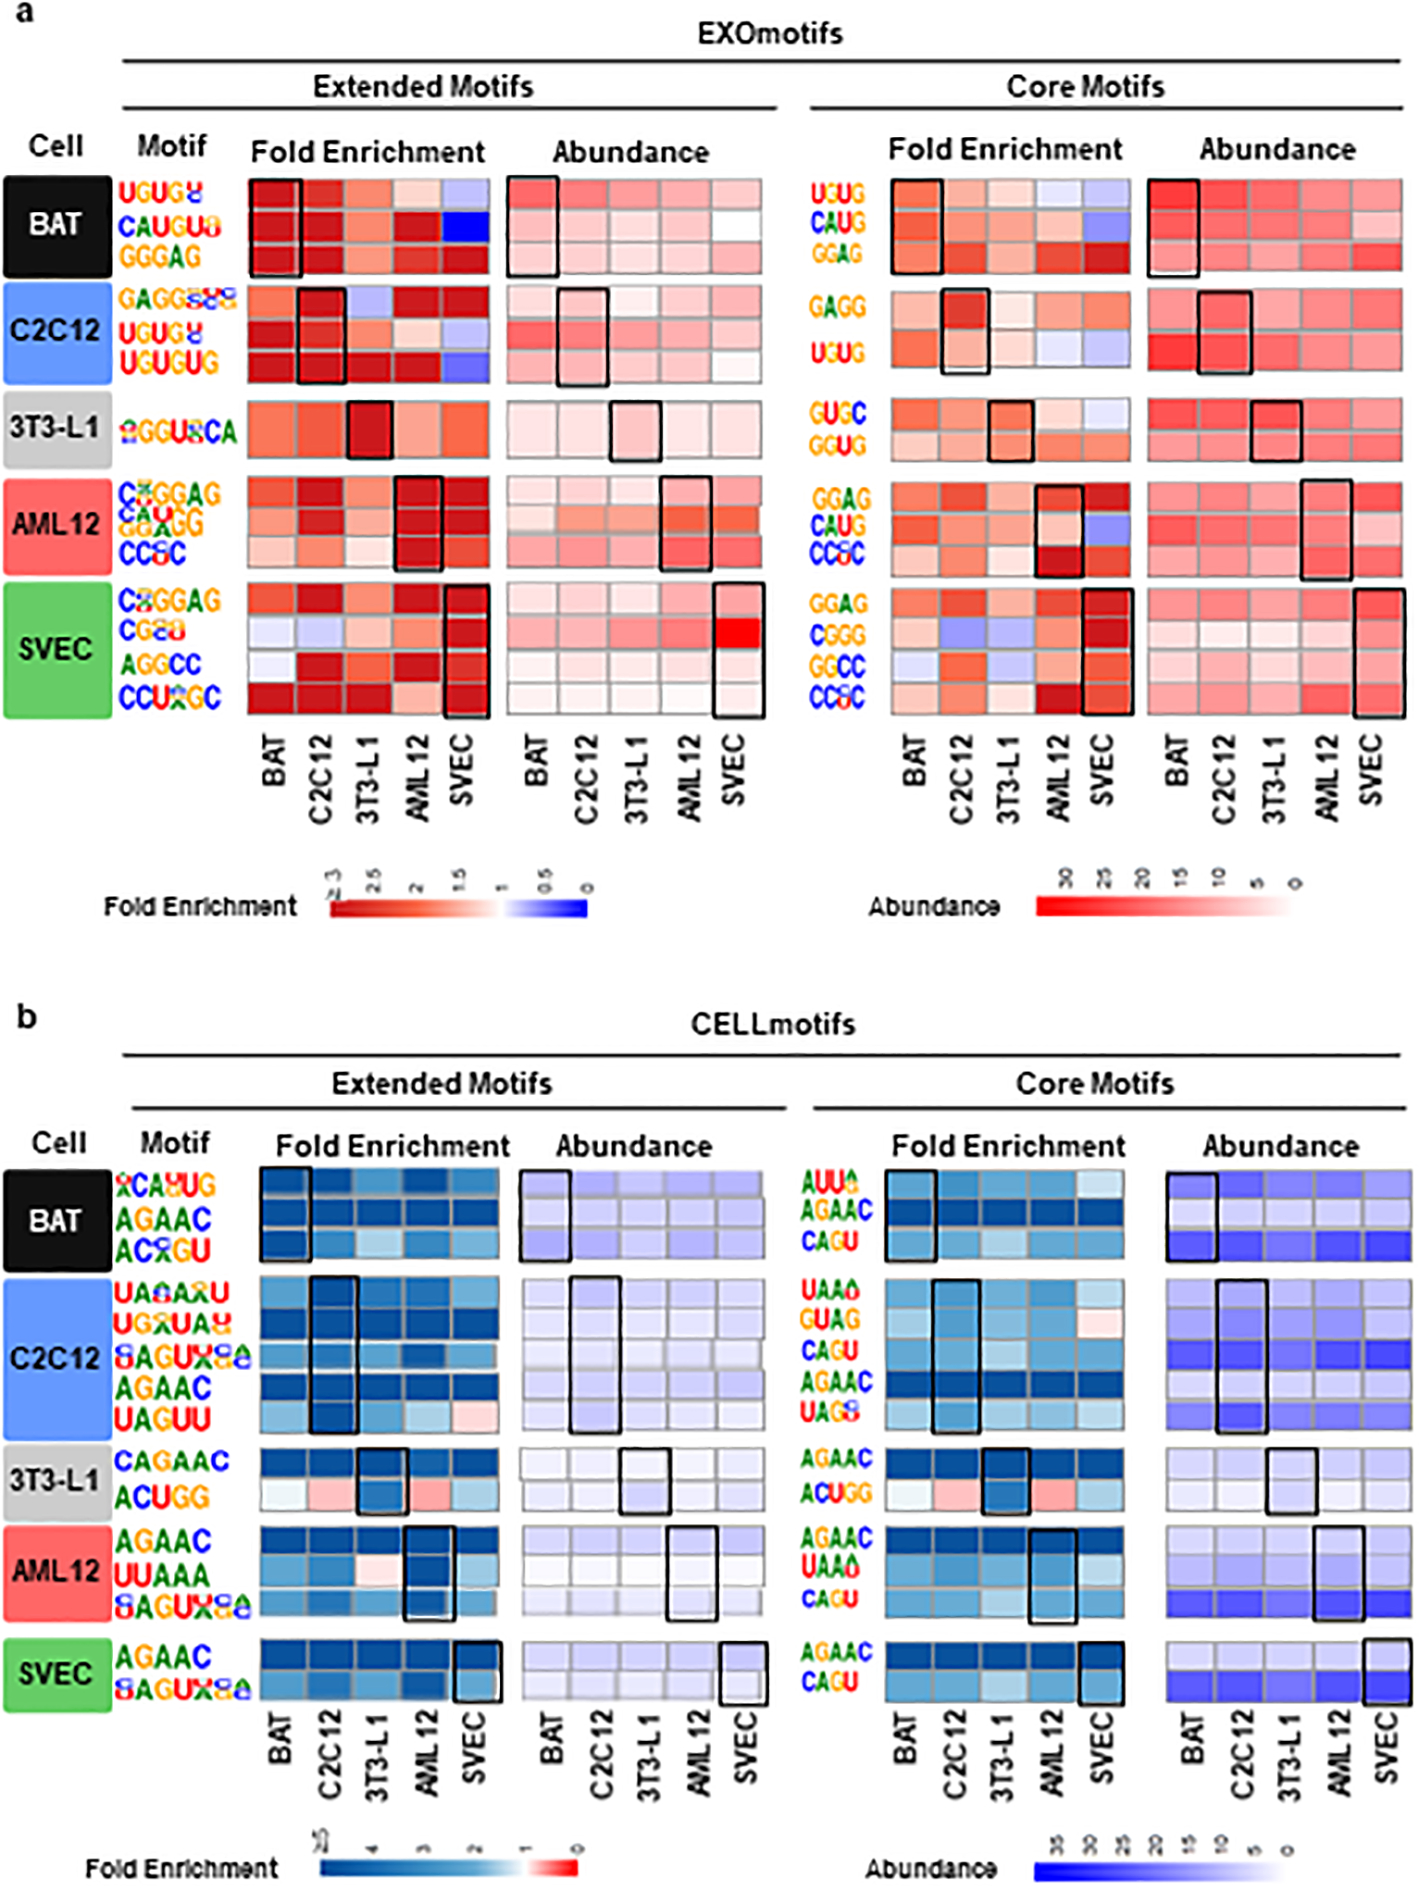
Comparison of all identified Extended and Core EXOmotifs (a) and CELLmotifs (b) among the five different cell types.
a) Fold enrichment (left half) and abundance (right half, as percentage of sEV-enriched miRNAs) containing the sEV-associated miRNA motifs. The first column indicates the cell type where these motifs were originally identified (see Main Figure 2a) and here shown in its predominant form in the second column (Extended motifs) and fifth column (Core motifs). The fold enrichment is shown in a red (high sEV enrichment)-white (neutral)-blue (cell enrichment) color gradient for indicated cell types displayed below. The abundance is shown in a red (high)-white (low) color gradient. The rectangles highlight the enrichment and presence of the motifs in the cell types where they were originally identified.
b) Fold enrichment (left half) and abundance (right half, as percentage of cell-enriched miRNAs) containing the Cell-associated miRNA motifs. As in a), the first column indicates the cell type where these motifs were originally identified (see Main Figure 2b) and here shown in its predominant form in the second column (Extended motifs) and fifth column (Core motifs). The fold enrichment is shown in a blue (high cell enrichment)-white (neutral)-blue (red sEV enrichment) color gradient for indicated cell types displayed below. The abundance is shown in a blue (high)-white (low) color gradient. The rectangles highlight the enrichment and presence of the motifs in the cell types where they were originally identified.
Extended Data Figure 4.
Location of EXO and CELLmotifs and comparison between small miRNAseq (smRNAseq) and qPCR-based miRNA profiling.
a-b) Percentage of miRNAs showing indicated EXOmotifs (a) or CELLmotifs (b) either in the 5’ half (nucleotides 1–9, light yellow bars) or 3’ half (from nucleotide 10 to the 3’ end, orange bars) of the miRNA sequence.
c) sEV and cell lysates from differentiated 3T3-L1 white adipocytes and AML12 hepatocytes were subjected to smRNAseq or qPCR-based profiling (n=4 for each cell type and compartment). Detected miRNAs by each method in each cell type is displayed in black bars. Selective distribution (either sEV-enriched or cell-enriched) was calculated for each miRNA using both methods and the number of miRNAs displaying significant selective distribution is shown in blue bars. The percentages in the blue bars refers to the ratio between the number of selectively distributed miRNA and the total number of detected miRNAs for each method and cell type.
d) Venn diagrams indicating the number of miRNAs with a selective distribution in sEV or cells detected by smRNAseq (blue circles) and qPCR (green circles) in 3T3-L1 (above) or AML12 (below). The total number of miRNAs detected simultaneously by these two methods was 180.
e) Table depicting the top EXOmotif found by HOMER software in sEV-enriched miRNAs from 3T3-L1 and AML12 detected by smRNAseq. Fold enrichment refers to the ratio between presence in the sEV-enriched miRNAs and presence in the rest of miRNAs (background).
Extended Data Figure 5.
Comparison of miRNA profiling of AML12 and primary hepatocytes. Primary hepatocytes were isolated from C57Bl/6J wild-type mice (n=4) and cultured for 48 h in exosome-free medium to collect sEV and cell lysates, which were later subjected to RNA isolation and miRNA profiling for comparison to AML12 hepatocytes.
a) Number of miRNAs showing selective cellular retention, non-selective distribution or selective sEV sorting in AML12 and primary hepatocytes. The selective distribution column is the sum of sEV- and cell-enriched miRNAs divided by the total number of miRNAs detected as percentage. FDR < 0.1
b) Venn-diagram showing the number of sEV- (red) and cell-enriched miRNAs (blue) in AML12 and primary hepatocytes and the overlap between them.
c-d) Motifs associated to sEV (c) and cell (d) enrichment in primary hepatocytes. The table shows the significance of the enrichment (P-value), false discovery rate (FDR), the percentage of miRNAs significantly enriched in sEV (in c) or cell (in d) that contain the motif, the percentage of miRNAs not enriched in the background miRNAs containing the motif and the fold-enrichment as the ratio between the previous two columns.
Extended Data Figure 6.
Isolation of sEV and NV using an additional step of size exclusion chromatography.
a) Diagram of the isolation method used to obtain cellular, sEV-p100 pellet, sEV-SEC and NV-SEC samples using two rounds of ultracentrifugation followed by size exclusion chromatography (SEC). (n=4).
b) NTA analysis for EV concentration (top graph) of the 30 fractions obtained from SEC. These fractions were pooled in pairs in some cases and concentrated using Amicon centrifugal 3 KDa filter prior assessing protein concentration (bottom graph).
c) Immunoblot for classical exosomal markers CD63 and CD9 for the concentrated fractions shown in b, bottom graph.
d) PCA plot for the miRNA profile from the cells, sEV-p100, sEV-SEC and NV-SEC samples.
e) Heatmap of the top differentially expressed miRNAs among sEV-p100, sEV-SEC and NV-SEC. High expression is shown in red and low expression in blue.
f) Pearson correlation between averaged normalized miRNA expression levels in sEV-p100 and sEV-SEC. Expression levels were first normalized to average ct of each sample.
g) Motifs found overrepresented in sEV-SEC enriched-miRNAs compared to cellular-enriched miRNAs.
Extended Data Figure 7.
Additional information about mutations in miR-431-5p, miR-140-3p and miR-677-5p.
a) Table depicting the name and sequence of the CELLmotif AGAAC incorporated in miR-431-5p. Bold underlying text in the sequence indicated changed nucleotides in the guide strand of the miRNA used to introduce the CELLmotif AGAAC. Nucleotides in the passenger strand were also modified to maintain miRNA structure.
b) Predicted structure for the hairpin miRNA for the constructs shown in a. Red means high probability of pairing, while blue indicates low probability calculated by RNAfold WebServer software. Arrow indicates the location of the mutated nucleotides.
c) Normalized gene expression for miR-431-5p wild-type in cells and sEV for each cell type. Average Ct from the whole miRNA profile was used for normalization for each sample.
d) Table depicting the name and sequence of the wild-type miR-140-3p and mutated version without CELLmotif AGAAC. Bold underlying text in the sequence indicated changed nucleotides in the guide strand of the miRNA used to remove the CELLmotif AGAAC. Nucleotides in the passenger strand were also modified to maintain miRNA structure.
e) Predicted structure for the hairpin miRNA for the constructs shown in d. Red means high probability of pairing, while blue indicates low probability. Arrow indicates the location of the mutated nucleotides.
f) Normalized gene expression for miR-140-3p wild-type in cells and sEV for each cell type. Average Ct from the whole miRNA profile was used for normalization for each sample.
g) Table showing the name and sequence of the wild-type miR-677-5p and the version in which CELLmotifs were mutated. Bold underlined text in the sequence indicated mutated nucleotides in the guide strand of the miRNA to remove CELLmotifs CAGU and AUU[A/G]. Nucleotides in the passenger strand were also modified accordingly to maintain miRNA structure.
h) Predicted structure for the hairpin miRNA for the constructs shown in g. Red means high probability of pairing while blue indicates low probability. Arrows indicate the location of the mutated nucleotides.
i) Normalized gene expression for miR-677-5p wild-type in cells and exosomes for each cell type. Average Ct from the whole miRNA profile was used for normalization for each sample.
Data are expressed as mean ± SEM. n=3–4. *P≤0.05 (Limma t-test).
Extended Data Figure 8.
Additional information about mutations in miR-34c.
a) Table depicting the name and sequence of the different EXOmotifs introduced in miR-34c-5p. Bold underlying text in the sequence indicates changed nucleotides in the guide strand of the miRNA. Nucleotides in the passenger strand were also modified accordingly to maintain miRNA structure.
b) Predicted structure for the hairpin miRNA for each of the constructs shown in a. Red means high probability of pairing while blue indicates low probability calculated by RNAfold WebServer software. Arrows indicate the location of the mutated nucleotides.
c) Normalized expression for miR-34c-5p wild-type in cells and sEV for each cell type. Average Ct from the whole miRNA profile was used for normalization for each sample. *P≤0.05 (Limma t-test).
d) To visualize the changes in the sEV and cell content of each miRNA construct before sEV enrichment calculation, normalized expression of miR-34c wild-type (WT) or its EXOmotif-containing versions miR-34-UGUGU, miR-34-CAUG and miR-34-CGGGAG are displayed for the cells overexpressing each of the miR-34c versions. miR-138-5p was used to normalize expression in sEV versus cells as we previously showed that the levels of this miRNA are equivalent in both compartments.*P≤0.05 (Mann-Whitney U test comparing sEV and cell expression for the same miRNA version, i.e. red versus blue bars).
e) Absolute copy number of the miRNAs displayed in the x-axis overexpressed in brown adipocytes were quantified in sEV isolated by ultracentrifugation followed by size exclusion chromatography and normalized by the miRNA copy number in all producing cells for each sample.
f) sEV enrichment calculated as the ratio of sEV expression divided by cellular expression for each of the constructs expressed in and secreted from AML12 hepatocytes.
g) sEV enrichment calculated as the ratio of sEV expression divided by cellular expression for each of the constructs expressed in and secreted from SVEC endothelial cells.
In both panels e and f, the dashed line separates preferential sEV enrichment (above line) versus preferential cellular enrichment (below line). Expression was normalized to the expression of miR-501-5p, which is to be equally abundant in sEV and cells for each cell type. Data are expressed as mean ± SEM. n=3, *P≤0.05, Kruskal-Wallis followed by Mann-Whitney U tests.
Extended Data Figure 9.
Additional information about mutations in miR-26a.
a) Table depicting the name and sequence of the different EXOmotifs introduced in miR-26a-5p. Bold underlying text in the sequence indicates changed nucleotide/s in the guide strand of the miRNA. Nucleotides in the passenger strand were also modified accordingly to maintain miRNA structure.
b) Predicted structure for the hairpin miRNA for each of the constructs shown in a. Red means high probability of pairing while blue indicates low probability calculated by RNAfold WebServer software. Arrows indicate the location of the mutated nucleotide/s.
c) Normalized expression for miR-26a-5p wild-type in cells and sEV for each cell type. Average Ct from the whole miRNA profile was used for normalization for each sample. *P≤0.05 (Limma t-test).
d) sEV enrichment calculated as the ratio of sEV expression divided by cellular expression for each of the constructs expressed in and secreted from SVEC endothelial cells. The dashed line separates preferential sEV enrichment (above line) versus preferential cellular enrichment (below line). Expression was normalized to the expression of miR-501-5p. *P≤0.05 (Kruskal-Wallis followed by Mann-Whitney U test), n=3–4.
Extended Data Figure 10.
Further information miRNA pulldown and direct transfection of AML12 cells.
a) Analyses for Molecular Function (left) and Cellular Component Gene Ontology (right) of the 67 proteins identified in the proteomic study.
b) Table showing average values for relative binding enrichment of the proteins listed in the first column to the miRNA constructs shown in the top row. The columns 2–5 refer to miR-34c and its CGGGAG-containing version, while columns 6–8 refer to miR-26a and its CGGGAG-containing version. In both cases, binding to wild-type miRNAs was set as 1, and the binding of the other miRNA constructs (scramble and CGGGAG-containing version) was normalized respect to that. Only those proteins showing a log2 Fold Enrichment of CGGGAG-containing miRNA version versus wild-type miRNA >3 (>8 fold) were included.
c) Brown adipocytes overexpressing wild type miR-34c (OE-miR-34c-5p-WT) or CGGGAG-containing miR-34c (OE-miR-34c-5p-CGGGAG) were transfected with either control siRNA (grey bars), Alyref siRNA (red bars) or Fus siRNA (green bars) and analyzed for knockdown efficiency by qPCR (left) and immunoblotting (right). *P≤0.05 (Kruskal-Wallis followed by Mann-Whitney U test), n=3.
d) EXOmotif-containing miR-34c versions have the same efficiency in reducing target gene expression than wild-type miR-34c. AML12 hepatocytes were directly transfected with mimic miR-34c wild-type or its mutant versions miR-34-UGUGU, miR-34-CAUG and miR-34-CGGGAG or non-targeting miRNA (control) for 24 hours and expression of predicted and experimentally-validated miR-34c target genes were analyzed. TATA-box binding protein (Tbp) was used as housekeeping gene. n=6. *P≤0.05, ***P≤0.001 (ANOVA followed by Bonferroni post-hoc test).
Data are expressed as mean ± SEM.
Supplementary Material
Acknowledgements
This work was supported by NIH grants (R01DK082659 to C.R. K.). RGM was supported by a Deutsche Forschungsgemeinschaft fellowship (GA 2426/1-1, Germany). GW was supported by a T32 grant (DK007260). TMZ was supported by a FAPESP fellowship (2017/10179-9, Brazil). We also received support from the Joslin DRC (P30DK036836). SS, SP and BS were supported by a Shared Instrumentation Grant S10 OD016281 to Buck Institute. SP was supported by a fellowship from Glenn Foundation. We thank Ashley M. Ciulla and the BPF Genomics Core Facility at Harvard Medical School for their expertise and instrument availability that supported this work. We thank Maria Ericsson from the Electron Microscopy Facility at the Harvard Medical School for assistance with electron microscopy experiments. We thank Jonathan M. Dreyfuss and Hui Pan from Joslin Bioinformatics and Biostatistics Core for assistance with data analysis, and Angela Wood from Joslin Flow Cytometry Core for assistance with experiments.
Footnotes
Competing interest declaration
The authors declare no competing interests. A patent submitted by RGM and CRK (US Patent US2021171949A1) covers the data and applications of the findings described in this manuscript.
Additional Information
Materials from this manuscript can be requested to the corresponding author, CRK.
Data Availability Availability
The authors declare that the data supporting the findings of this study are available within the paper and its supplementary information files. miRNA profile raw data-set can be found as Supplementary Table 1 as negative Delta Ct normalized by average Ct of each corresponding sample. Average normalized raw values for each cell type and the statistics for each miRNA in cell bodies and exosomes/sEV are shown in Supplementary Tables 2 and 4, respectively. Significance tables for comparisons between each cell type and the other four in cell bodies and sEV can be found in Supplementary Tables 3 and 5, respectively. sEV and cellular enrichment table for each miRNA can be found in Supplementary Table 6. Primary hepatocyte miRNA profile is shown in Supplementary Table 7. miRNA profile from UC+SEC experiment is shown in Supplementary Table 8. smRNAseq data can be found as Supplementary Table 10. Pre-miRNA sequences of the expressed miRNAs used in this study can be found as Supplementary Table 11 and their mature forms are displayed in Extended Data Figures 7–9. Ensembl and miRBase databases are publicly available in www.ensembl.org and www.mirbase.org, respectively. Experimental procedures have also been uploaded to EV-TRACK42 with references EV200052 and EV210287. The mass spectrometric analysis can be found in Supplementary Table 9 and the raw data are deposited with the MassIVE ID MSV000086780 and also available at ProteomeXchange with the ID PXD023895. Additional mass spectrometric details from DIA and DDA acquisitions, such as protein identification and quantification details are available at the repositories (including all generated Spectronaut and Protein Pilot search engine files).
References
- 1.Thomou T et al. Adipose-derived circulating miRNAs regulate gene expression in other tissues. Nature 542, 450–455, doi: 10.1038/nature21365 (2017). [DOI] [PMC free article] [PubMed] [Google Scholar]
- 2.Valadi H et al. Exosome-mediated transfer of mRNAs and microRNAs is a novel mechanism of genetic exchange between cells. Nat.Cell Biol 9, 654–659 (2007). [DOI] [PubMed] [Google Scholar]
- 3.Skog J et al. Glioblastoma microvesicles transport RNA and proteins that promote tumour growth and provide diagnostic biomarkers. Nat.Cell Biol 10, 1470–1476 (2008). [DOI] [PMC free article] [PubMed] [Google Scholar]
- 4.Mori MA, Ludwig RG, Garcia-Martin R, Brandao BB & Kahn CR Extracellular miRNAs: From Biomarkers to Mediators of Physiology and Disease. Cell Metab 30, 656–673, doi: 10.1016/j.cmet.2019.07.011 (2019). [DOI] [PMC free article] [PubMed] [Google Scholar]
- 5.Tosar JP et al. Assessment of small RNA sorting into different extracellular fractions revealed by high-throughput sequencing of breast cell lines. Nucleic Acids Res 43, 5601–5616, doi: 10.1093/nar/gkv432 (2015). [DOI] [PMC free article] [PubMed] [Google Scholar]
- 6.Arroyo JD et al. Argonaute2 complexes carry a population of circulating microRNAs independent of vesicles in human plasma. Proc Natl Acad Sci U S A 108, 5003–5008, doi: 10.1073/pnas.1019055108 (2011). [DOI] [PMC free article] [PubMed] [Google Scholar]
- 7.Hunter MP et al. Detection of microRNA expression in human peripheral blood microvesicles. PLoS One 3, e3694, doi: 10.1371/journal.pone.0003694 (2008). [DOI] [PMC free article] [PubMed] [Google Scholar]
- 8.Crewe C et al. An Endothelial-to-Adipocyte Extracellular Vesicle Axis Governed by Metabolic State. Cell 175, 695–708.e613, doi: 10.1016/j.cell.2018.09.005 (2018). [DOI] [PMC free article] [PubMed] [Google Scholar]
- 9.Zomer A et al. In Vivo imaging reveals extracellular vesicle-mediated phenocopying of metastatic behavior. Cell 161, 1046–1057, doi: 10.1016/j.cell.2015.04.042 (2015). [DOI] [PMC free article] [PubMed] [Google Scholar]
- 10.Abels ER et al. Glioblastoma-Associated Microglia Reprogramming Is Mediated by Functional Transfer of Extracellular miR-21. Cell reports 28, 3105–3119 e3107, doi: 10.1016/j.celrep.2019.08.036 (2019). [DOI] [PMC free article] [PubMed] [Google Scholar]
- 11.Kosaka N et al. Secretory mechanisms and intercellular transfer of microRNAs in living cells. J Biol Chem 285, 17442–17452, doi: 10.1074/jbc.M110.107821 (2010). [DOI] [PMC free article] [PubMed] [Google Scholar]
- 12.Shurtleff MJ, Temoche-Diaz MM, Karfilis KV, Ri S & Schekman R Y-box protein 1 is required to sort microRNAs into exosomes in cells and in a cell-free reaction. eLife 5, doi: 10.7554/eLife.19276 (2016). [DOI] [PMC free article] [PubMed] [Google Scholar]
- 13.Wei Z et al. Coding and noncoding landscape of extracellular RNA released by human glioma stem cells. Nat Commun 8, 1145, doi: 10.1038/s41467-017-01196-x (2017). [DOI] [PMC free article] [PubMed] [Google Scholar]
- 14.Cha DJ et al. KRAS-dependent sorting of miRNA to exosomes. eLife 4, e07197, doi: 10.7554/eLife.07197 (2015). [DOI] [PMC free article] [PubMed] [Google Scholar]
- 15.Jeppesen DK et al. Reassessment of Exosome Composition. Cell 177, 428–445 e418, doi: 10.1016/j.cell.2019.02.029 (2019). [DOI] [PMC free article] [PubMed] [Google Scholar]
- 16.Santangelo L et al. The RNA-Binding Protein SYNCRIP Is a Component of the Hepatocyte Exosomal Machinery Controlling MicroRNA Sorting. Cell reports 17, 799–808, doi: 10.1016/j.celrep.2016.09.031 (2016). [DOI] [PubMed] [Google Scholar]
- 17.Temoche-Diaz MM et al. Distinct mechanisms of microRNA sorting into cancer cell-derived extracellular vesicle subtypes. eLife 8, doi: 10.7554/eLife.47544 (2019). [DOI] [PMC free article] [PubMed] [Google Scholar]
- 18.Villarroya-Beltri C et al. Sumoylated hnRNPA2B1 controls the sorting of miRNAs into exosomes through binding to specific motifs. Nat Commun 4, 2980, doi: 10.1038/ncomms3980 (2013). [DOI] [PMC free article] [PubMed] [Google Scholar]
- 19.Thery C et al. Minimal information for studies of extracellular vesicles 2018 (MISEV2018): a position statement of the International Society for Extracellular Vesicles and update of the MISEV2014 guidelines. Journal of extracellular vesicles 7, 1535750, doi: 10.1080/20013078.2018.1535750 (2018). [DOI] [PMC free article] [PubMed] [Google Scholar]
- 20.Lagos-Quintana M et al. Identification of tissue-specific microRNAs from mouse. Curr Biol 12, 735–739, doi: 10.1016/s0960-9822(02)00809-6 (2002). [DOI] [PubMed] [Google Scholar]
- 21.Jopling C Liver-specific microRNA-122: Biogenesis and function. RNA Biol 9, 137–142, doi: 10.4161/rna.18827 (2012). [DOI] [PMC free article] [PubMed] [Google Scholar]
- 22.Horaka M, N. J; Bienertova-Vaskuac J Muscle-specific microRNAs in skeletal muscle development. Developmental Biology 410, 1–13, doi: 10.1016/j.ydbio.2015.12.013 (2016). [DOI] [PubMed] [Google Scholar]
- 23.Gao T, Shu J & Cui J A systematic approach to RNA-associated motif discovery. BMC genomics 19, 146, doi: 10.1186/s12864-018-4528-x (2018). [DOI] [PMC free article] [PubMed] [Google Scholar]
- 24.Bartel DP Metazoan MicroRNAs. Cell 173, 20–51, doi: 10.1016/j.cell.2018.03.006 (2018). [DOI] [PMC free article] [PubMed] [Google Scholar]
- 25.Statello L et al. Identification of RNA-binding proteins in exosomes capable of interacting with different types of RNA: RBP-facilitated transport of RNAs into exosomes. PLoS One 13, e0195969, doi: 10.1371/journal.pone.0195969 (2018). [DOI] [PMC free article] [PubMed] [Google Scholar]
- 26.Shi M et al. ALYREF mainly binds to the 5’ and the 3’ regions of the mRNA in vivo. Nucleic Acids Res 45, 9640–9653, doi: 10.1093/nar/gkx597 (2017). [DOI] [PMC free article] [PubMed] [Google Scholar]
- 27.Zhang T et al. FUS Regulates Activity of MicroRNA-Mediated Gene Silencing. Mol Cell 69, 787–801 e788, doi: 10.1016/j.molcel.2018.02.001 (2018). [DOI] [PMC free article] [PubMed] [Google Scholar]
- 28.Bae Y et al. miRNA-34c regulates Notch signaling during bone development. Hum Mol Genet 21, 2991–3000, doi: 10.1093/hmg/dds129 (2012). [DOI] [PMC free article] [PubMed] [Google Scholar]
- 29.Hu S et al. MicroRNA-34c Downregulation Ameliorates Amyloid-beta-Induced Synaptic Failure and Memory Deficits by Targeting VAMP2. Journal of Alzheimer’s disease : JAD 48, 673–686, doi: 10.3233/JAD-150432 (2015). [DOI] [PubMed] [Google Scholar]
- 30.Ngalame NN, Tokar EJ, Person RJ, Xu Y & Waalkes MP Aberrant microRNA expression likely controls RAS oncogene activation during malignant transformation of human prostate epithelial and stem cells by arsenic. Toxicol Sci 138, 268–277, doi: 10.1093/toxsci/kfu002 (2014). [DOI] [PMC free article] [PubMed] [Google Scholar]
- 31.Paraskevopoulou MD et al. DIANA-LncBase: experimentally verified and computationally predicted microRNA targets on long non-coding RNAs. Nucleic Acids Res 41, D239–245, doi: 10.1093/nar/gks1246 (2013). [DOI] [PMC free article] [PubMed] [Google Scholar]
- 32.Chevillet JR et al. Quantitative and stoichiometric analysis of the microRNA content of exosomes. Proc Natl Acad Sci U S A 111, 14888–14893, doi: 10.1073/pnas.1408301111 (2014). [DOI] [PMC free article] [PubMed] [Google Scholar]
Methods References
- 33.Fasshauer M et al. Essential role of insulin receptor substrate-2 in insulin stimulation of Glut4 translocation and glucose uptake in brown adipocytes. J Biol Chem 275, 25494–25501, doi: 10.1074/jbc.M004046200 (2000). [DOI] [PubMed] [Google Scholar]
- 34.Thery C, Amigorena S, Raposo G & Clayton A Isolation and characterization of exosomes from cell culture supernatants and biological fluids. Curr Protoc Cell Biol Chapter 3, Unit 3 22, doi: 10.1002/0471143030.cb0322s30 (2006). [DOI] [PubMed] [Google Scholar]
- 35.Peltier HJ & Latham GJ Normalization of microRNA expression levels in quantitative RT-PCR assays: identification of suitable reference RNA targets in normal and cancerous human solid tissues. RNA 14, 844–852, doi: 10.1261/rna.939908 (2008). [DOI] [PMC free article] [PubMed] [Google Scholar]
- 36.Collins BC et al. Multi-laboratory assessment of reproducibility, qualitative and quantitative performance of SWATH-mass spectrometry. Nat Commun 8, 291, doi: 10.1038/s41467-017-00249-5 (2017). [DOI] [PMC free article] [PubMed] [Google Scholar]
- 37.Schilling B, Gibson BW & Hunter CL Generation of High-Quality SWATH((R)) Acquisition Data for Label-free Quantitative Proteomics Studies Using TripleTOF((R)) Mass Spectrometers. Methods Mol Biol 1550, 223–233, doi: 10.1007/978-1-4939-6747-6_16 (2017). [DOI] [PMC free article] [PubMed] [Google Scholar]
- 38.Ritchie ME et al. Empirical array quality weights in the analysis of microarray data. BMC Bioinformatics 7, 261, doi: 10.1186/1471-2105-7-261 (2006). [DOI] [PMC free article] [PubMed] [Google Scholar]
- 39.Burger T Gentle Introduction to the Statistical Foundations of False Discovery Rate in Quantitative Proteomics. Journal of proteome research 17, 12–22, doi: 10.1021/acs.jproteome.7b00170 (2018). [DOI] [PubMed] [Google Scholar]
- 40.Heinz S et al. Simple combinations of lineage-determining transcription factors prime cis-regulatory elements required for macrophage and B cell identities. Mol Cell 38, 576–589, doi: 10.1016/j.molcel.2010.05.004 (2010). [DOI] [PMC free article] [PubMed] [Google Scholar]
- 41.Kullback S & Leibler RA., On information and sufficiency, Ann Math Stat, No1 vol 22, 79–86 (1951); available at https://projecteuclid.org/journals/annals-of-mathematical-statistics/volume-22/issue-1/On-Information-and-Sufficiency/10.1214/aoms/1177729694.full. [Google Scholar]
- 42.Consortium E-T et al. EV-TRACK: transparent reporting and centralizing knowledge in extracellular vesicle research. Nat Methods 14, 228–232, doi: 10.1038/nmeth.4185 (2017). [DOI] [PubMed] [Google Scholar]
Associated Data
This section collects any data citations, data availability statements, or supplementary materials included in this article.
Supplementary Materials
Data Availability Statement
The authors declare that the data supporting the findings of this study are available within the paper and its supplementary information files. miRNA profile raw data-set can be found as Supplementary Table 1 as negative Delta Ct normalized by average Ct of each corresponding sample. Average normalized raw values for each cell type and the statistics for each miRNA in cell bodies and exosomes/sEV are shown in Supplementary Tables 2 and 4, respectively. Significance tables for comparisons between each cell type and the other four in cell bodies and sEV can be found in Supplementary Tables 3 and 5, respectively. sEV and cellular enrichment table for each miRNA can be found in Supplementary Table 6. Primary hepatocyte miRNA profile is shown in Supplementary Table 7. miRNA profile from UC+SEC experiment is shown in Supplementary Table 8. smRNAseq data can be found as Supplementary Table 10. Pre-miRNA sequences of the expressed miRNAs used in this study can be found as Supplementary Table 11 and their mature forms are displayed in Extended Data Figures 7–9. Ensembl and miRBase databases are publicly available in www.ensembl.org and www.mirbase.org, respectively. Experimental procedures have also been uploaded to EV-TRACK42 with references EV200052 and EV210287. The mass spectrometric analysis can be found in Supplementary Table 9 and the raw data are deposited with the MassIVE ID MSV000086780 and also available at ProteomeXchange with the ID PXD023895. Additional mass spectrometric details from DIA and DDA acquisitions, such as protein identification and quantification details are available at the repositories (including all generated Spectronaut and Protein Pilot search engine files).