

Abstract
The impact of genetic variants on cells challenged in biologically relevant contexts has not been fully explored. Here, we activated CD4+ T cells from 89 healthy subjects and performed a single-cell RNA-seq assay with > 1 million cells to examine cell-type-specific and activation-dependent effects of genetic variants. Single-cell expression quantitative trait loci (sc-eQTL) analysis of 19 distinct CD4+ T cell subsets showed that the expression of over 4,000 genes is significantly associated with common genetic polymorphisms, and that the majority of these genes show their most prominent effects in specific cell types. These genes included many that encode for molecules important for activation, differentiation and effector functions of T cells. We also discovered new gene associations for disease-risk variants identified from genome-wide association studies and highlighted the cell types in which their effects are most prominent. We found that biological sex has a major influence on activation-dependent gene expression in CD4+ T cell subsets. Sex-biased transcripts were significantly enriched in several pathways that are essential for the initiation and execution of effector functions by CD4+ T cells like TCR signaling, cytokines, cytokine receptors, co-stimulatory, apoptosis and cell-cell adhesion pathways. Overall, this DICE (Database of Immune Cell Expression, eQTLs, and Epigenomics) subproject highlights the power of sc-eQTL studies for simultaneously exploring the activation and cell-type-dependent effects of common genetic variants on gene expression (https://dice-database.org).
One-Sentence Summary
Genetic variants associated with disease-risk manifest activation and cell-type-dependent effects on gene expression in immune cells.
Introduction
Single-nucleotide changes in non-coding DNA sequences can influence gene expression by modulating the activity of underlying cis-regulatory DNA regions (1, 2). Because cis-regulatory DNA regions control gene expression in both a cell-type-specific and a context-dependent manner, the effects of non-coding genetic variants on gene expression are likely to be manifested only in certain cell types or contexts (3). Cell-type-specific effects of genetic variants on gene expression have been captured by large-scale expression quantitative trait loci (eQTL) studies in a wide range of tissues and cell types (3, 4). However, the context-dependent effects of genetic variants have not been extensively studied, with only a few eQTL studies exploring the effects of perturbation by extrinsic/environmental triggers (5–9).
Context-dependent gene regulation is important for the optimal functioning of various organ systems, especially the immune system, which needs to respond rapidly to environmental perturbations. As such, activation of immune cells increases the transcription of genes important for mediating their effector functions. This transcriptional response results in the enhancement of the functional properties of immune cells when they are challenged by extrinsic factors such as pathogens or pathogen-associated molecules. Understanding how common genetic variants may influence the function of immune cells during infections will require eQTL studies that examine gene expression in contexts that mimic infectious challenge. Furthermore, when exploring such context-dependent effects in specific cell types, it is important to assess the effects in homogenous cell populations. Single-cell gene expression studies have revealed substantial heterogeneity even in cell populations considered to be relatively homogeneous, making it the preferred analysis approach for classifying homogeneous cell populations in an unbiased manner (10). Thus, eQTL studies using single-cell instead of bulk gene expression data of stimulated immune cell types are likely to provide simultaneous assessment of the cell-type-specific and activation-dependent effects of genetic variants (11, 12). Herein, we present the results of single-cell eQTL (sc-eQTL) analysis of nearly 1 million activated CD4+ T cells from 89 subjects enrolled in the Database of Immune Cell Expression, eQTLs and Epigenomics (DICE) study; https://dice-database.org (3).
Results
Single-cell transcriptomes of activated CD4+ T cell subsets
CD4+ T cells are key orchestrators of adaptive immune responses. Distinct CD4+ T cell subsets carry out specialized functions; for example, following pathogen exposure, naïve CD4+ T cells that are generated in the thymus differentiate into memory subsets like TH1, TH1/17, TH17 and TH2 cells, which play important roles in defense against viral, parasitic, fungal, and mycobacterium tuberculosis infections, respectively (13, 14). Follicular helper T cells (TFH cells), which represents a distinct CD4+ T cell subset, provide help to B cells for generating robust antibody responses (15), and regulatory T cells (TREG cells) dampen unwanted immune responses to self-antigens and prevent autoimmunity (16). In the first release of the results of the DICE project (3), we reported on eQTLs in resting conditions for 8 ‘predefined’ subsets of CD4+ T cells: naïve CD4+ T cells, TH1 cells, TH1/17 cells, TH17 cells, TH2 cells, TFH cells, and naïve and memory TREG cells, which were sorted based on the expression of surface markers. To explore how genetic variants impact activation-dependent gene expression in these cell types, we stimulated CD4+ T cells by engaging the T cell receptor (TCR) and the co-stimulatory molecule CD28, and then sorted equal numbers of cells (n~1,000) from every subject (n=89) for each of the eight ‘predefined’ CD4+ T cell subsets (Fig. 1A, Fig. S1, Fig. S2 and Table S1). This approach allowed us to isolate relatively equal numbers of cells from each ‘predefined’ CD4+ T cell subset across all study subjects (Fig. S3 and Table S1). In total, we generated single-cell transcriptomes for > 1 million activated CD4+ T cells and utilized ~735,000 cells (after doublet removal and additional quality controls, see Material and Methods) for downstream single-cell transcriptomic and eQTL analysis (Fig. 1A, Fig. S3 and Table S1).
Fig. 1. Single-cell transcriptomes of activated CD4+ T cell subsets.

(A) Study overview. (B) Single-cell transcriptomes of FACS-sorted activated CD4+ T cells are displayed by uniform manifold approximation and projection (UMAP) based on Seurat-based clustering. The pie chart shows the fraction of cells in the indicated 19 CD4+ T cell subsets. (C) Plot shows average expression (color scale) and percent of expressing cells (dot size scale) for selected marker transcripts in each of the indicated cell clusters.
As expected, TCR activation with co-stimulation significantly increased the expression of over 2,500 transcripts (log2 fold change > 0.25 and adj. P value < 0.05) across the 8 ‘predefined’ CD4+ T cell subsets (Fig. S4A and Table S2), highlighting the scale of activation-dependent gene regulation in immune cells. Nearly 500 transcripts also showed cell-type-specific differences in their expression patterns (Fig. S4B and Table S3). To define subsets of CD4+ T cells that display distinct transcriptional profiles following activation, we performed unbiased clustering analysis of all the activated cells (Fig. 1B; n=735,147). Uniform manifold approximation and projection (UMAP) analysis showed 19 distinct clusters of activated CD4+ T cells, with the majority of cells from the ‘predefined’ CD4+ T cell subsets present in one of the 7 largest clusters (Fig. S5). These clusters are hereafter referred to as: naïve TREG cells (cluster 1), TH1 cells (cluster 2), TH17 cells (cluster 3), TFH cells (cluster 4), TH2 cells (cluster 5), naïve CD4+ T cells (cluster 6) and memory TREG cells (cluster 7) (Fig. 1B,C, Fig. S4C, Fig. S5 and Table S4). Cells from the ‘predefined’ TH1/17 subset were present in relatively equal proportions in the TH1 and TH17 clusters (clusters 2 and 3), suggesting marked transcriptional heterogeneity among cells in this ‘predefined’ subset (Fig. S5). We found several smaller clusters that were readily defined, such as follicular regulatory T cells (TFR cells, cluster 13), cytotoxic CD4+ T cells (CD4-CTLs, cluster 15) (10), the recently described interferon-response signature cells (THIFNR cells, cluster 17) (17) and other subsets that have not been characterized in detail (Fig. 1B,C, Fig. S4C, Fig. S5 and Table S4). In summary, our single-cell transcriptome analysis of activated CD4+ T cells revealed significant cell-type-specific and activation-dependent gene expression patterns. Because of marked heterogeneity in the predefined CD4+ T cell subsets, we decided to perform sc-eQTL analysis on these 19 distinct CD4+ T cell subsets.
Single-cell eQTL analysis of activated CD4+ T cell subsets
To identify genes that show genotype-dependent changes in their expression (eGenes), we utilized genotype information (~5.8 million SNPs) from the DICE study subjects (n=89) (3) and performed independent sc-eQTL analysis for each of the 19 distinct CD4+ T cell clusters. In total, we found 4,308 eGenes across all the activated CD4+ T cell clusters (range 158 to 1,008 eGenes/cluster; median = 533) (Fig. 2A and Table S5A), and a substantial fraction (31.5%) of these were replicated in other eQTL studies (Table S5B). 12.9% of these eGenes (n=639) were associated with disease-risk or trait-associated variants identified from genome-wide association studies (GWAS) (Fig. 2B and Table S6A). Transcriptome-wide association study (TWAS) and colocalization analysis of genetic variants linked to common immune-mediated diseases (n=19) identified significant associations with expression of 261 eGenes in activated CD4+ T cell subsets (Table S6B–E). When compared to the eGenes previously reported in resting CD4+ T cell subsets (3), over 1,900 eGenes displayed more prominent genotype-dependent association with expression in activated conditions (Fig. 2C). Furthermore, the expression of several hundred eGenes that had been detected in both resting and activated conditions, showed stronger associations and effect sizes with genotype (lower adjusted association P values and higher effect sizes) in activated conditions (Fig. 2C, Fig. S6A–C and Table S5). Together, these results highlight that the effects of many common genetic variants on gene expression are strongly manifested only in certain cell types in an activation-dependent manner (Fig. 2D).
Fig. 2. Single-cell eQTL analysis of activated CD4+ T cell subsets.

(A) Total number of eGenes identified in each cell cluster by analysis of single-cell RNA-seq data from 735,147 cells (details in Table S1); number of cells analyzed in each cluster is also shown. (B) Fraction of eGenes overlapping with significant SNPs (PGWAS < 5 × 10⁻⁸) that emerged from the catalogue of GWAS studies (GWAS SNPs) comprising 846 unique human diseases and traits (see Material and Methods). (C) eGenes identified in resting CD4+ T cell types (n=8) identified previously (3) or in activated CD4+ T cell subsets (n=19) from this study. Venn diagram indicates overlap of eGenes from resting CD4+ T cell types with eGenes from activated CD4+ T cell subsets (left panel). The XY plot shows the most significant adj. association P value for a given eGene across all resting cell types or activated cell cluster, color coded by eGene category (right panel). (D) eGenes identified in resting CD4+ T cell types (n=8) identified previously (3) or in activated CD4+ T cell subsets (n=19) from this study. The heatmaps show the most significant adj. association P value (left panels) and absolute effect sizes (right panels) for selected eGenes across all resting or activated CD4+ T cell subsets. (E) Expression levels of selected eGenes in the indicated cell cluster from subjects categorized based on the genotype at the indicated peak cis-eQTL; each symbol represents the aggregated mean expression of the indicated gene from an individual subject; adj. association P value *P < 0.05, **P < 0.001, and ***P < 0.00001. (F) Volcano plot of single-cell differential gene expression analysis (DGEA) shows statistical significance (-log10 adjusted P value) and log2 fold change (LFC) comparing the gene expression of cells after knockdown with control siRNA or IRF7 siRNA pools (see Material and Methods). The color scale indicates the average expression (log2(CPM+1)) and dot size is the fraction of cells expressing a given gene (CPM > 0), both metrics derived from the condition with increased gene expression. The gray dotted lines represent the threshold values for LFC and adjusted P value. (G) UCSC Genome Browser tracks for the IRF7 locus, adj. association P value for cis-eQTLs (showing the most significant peak cis-eQTL across all cell clusters) linked to the expression of IRF7, recombination rate track (96), H3K27ac ChIP-seq track, and H3K27ac HiChIP chromatin interaction maps in naïve CD4+ T cells (2). (H) UCSC Genome Browser tracks for the locus harboring the genes IFITM1, IFITM2 and IFITM3, adj. association P value for cis-eQTLs (showing the most significant peak cis-eQTL across all cell clusters) linked to the expression of the indicated transcripts, recombination rate track (96), H3K27ac ChIP-seq track, and H3K27ac HiChIP chromatin interaction maps in naïve CD4+ T cells (2). (I) Expression levels of the eGenes P2RX4 and PDCD1 in the indicated cell cluster from subjects categorized based on the genotype at the indicated peak cis-eQTL; each symbol represents the aggregated mean expression of the indicated gene from an individual subject; adj. association P value *P < 0.05, **P < 0.001, and ***P < 0.00001.
For instance, the expression of several genes in the interferon pathway (IRF7, IFITM1, IFITM2, IFITM3, MX1, JAK1 and GBP7) was significantly associated with genotype, mainly in activated CD4+ T cell subsets (Fig. 2D,E and Fig. S6D). Given the importance of interferon pathway genes in antiviral immunity and the pathogenesis of autoimmune disease (18, 19), such genotype-dependent changes in their expression levels are likely to have important functional consequences. For example, severe influenza and COVID-19 illness have been linked to loss-of-function mutations in IRF7, an upstream transcription factor that amplifies type 1 interferon responses by increasing the transcription of type 1 interferons and interferon target genes (20, 21). Here, we found that genetic variants linked to the risk of systemic lupus erythematosus (SLE) (peak SLE-eQTL rs1061502T/T) were associated with increased expression of IRF7 in activated CD4+ T cells (Fig. 2D,E), a finding supported by colocalization analysis (Fig. S6E and Table S6B,C). To determine the function of IRF7 in human T cells, we knocked down IRF7 expression in memory CD4+ T cells and examined the genome-wide effects on activation-induced gene expression profiles at single-cell resolution (Fig. 2F, Fig. S6F,G and Table S7). The expression of several transcripts in the IL-2 depended JAK-STAT signaling pathway (e.g., IL2RA, IL2RB, JAK1, STAT5A, STAT5B) and T cell activation pathways (e.g., TNFRSF9 (4-1BB), TNFRSF4 (OX-40), TNFRSF18 (GITR)) were increased following IRF7 knockdown (Fig. 2F and Table S8A,B), suggesting that IRF7 is likely to be a negative regulator of T cell activation.
Due to strong linkage disequilibrium (LD), over 300 cis-eQTLs were associated with the expression of IRF7. The eQTLs identified in the IRF7 promoter region are likely to be functionally important (Fig. 2G); however, H3K27ac ChIP-seq and HiChIP-based chromatin interaction maps (2) in the extended ~300 kb IRF7 locus showed that the IRF7 promoter interacts with distal cis-regulatory regions (neighboring gene promoter and enhancer regions) harboring several other SLE-risk eQTLs, suggesting that these distal eQTLs may also regulate IRF7 expression. This finding is consistent with our recent report showing that promoters can physically interact with neighboring gene promoters and regulate their expression in cis (2). As another example, promoter eQTLs for eGenes (BET1L, RIC8A and PSMD13) were also found to be associated with expression of the neighboring interferon-response genes IFITM1 and IFITM2 (~100 kb away, also eGenes) by physically interacting with their promoters (Fig. 2H), suggesting that eQTLs that modulate promoter activity can also influence the expression of neighboring genes through long-range chromatin interactions (Fig. 2E and Fig. S6D). Notably, the peak eQTLs for IFITM1 and IFITM2 are located in the same haploblock and are in strong linkage disequilibrium (r2>0.90) with the peak eQTLs for BET1L, RIC8A and PSMD13, thus this haploblock of eQTLs harbors the primary signal for both sets of eGenes.
Other examples of genotype-dependent gene expression patterns emerging after activation of CD4+ T cells include genes encoding members of the integrin family (ITGB2, ITGA2 and ITGAE) and a purinergic receptor (P2RX4) that play important roles in T cell adhesion and migration (22, 23) (Fig. 2D,I and Fig. S7A). Another eGene, ORAI1 encodes for the calcium release-activated calcium (CRAC) channel that is essential for triggering proper activation of T cells following TCR engagement (24) (Fig. 2D and Fig. S7A). The eGene FASN encodes for fatty acid synthase, which has recently been shown to regulate the apoptosis of effector T cells by altering metabolic pathways (25) (Fig. 2D and Fig. S7B,C). Two genes encoding for the cancer immunotherapy targets PD-1 and CTLA-4 also showed strong eQTL effects in activated cells (Fig. 2D,I and Fig. S7A), with CTLA4 expression being specifically modulated in TREG cells, the key cellular target of anti-CTLA-4 therapies. Notably, our TWAS analysis linked thyroid disease with decreased expression of CTLA-4 in naïve TREG cells and TFR cells (Fig. S7A and Tables S6B,D,E). In addition to protein coding genes, the expression of several long non-coding RNAs (RP11–298J20.3, RP5–1042K10.10, RP1–140A9.1, RP1–3J17.3 and CTC-524C5.2) also displayed a strong association with genotype, specifically in activated CD4+ T cell subsets (Fig. 2D and Fig. S7D). In summary, our sc-eQTL analysis of activated CD4+ T cells highlighted the scale and magnitude of the effects of genetic variants on activation-dependent gene expression.
Activation-dependent effects of genetic variants are most prominent in specific cell types
Because non-coding genetic variants modulate gene expression by perturbing the activity of underlying cis-regulatory elements, their effects on gene expression are likely to be most prominent in cell types where the cis-regulatory region is active and necessary for gene expression (2, 3). Therefore, it is important to survey multiple cell types to capture the full spectrum of effects of genetic variants on gene expression. Our single-cell transcriptomic approach allowed us to first define a wide range of transcriptionally distinct CD4+ T cell subsets in an unbiased manner and then explore the impact of genetic variants in each of these subsets (Fig. 1B,C, Fig. 3A and Fig. S8A–D). As expected, we found that the majority of eGenes showed a prominent association with genetic variants only in specific CD4+ T cell subsets (Fig. 3A,B and Fig. S8A–D). The strong associations with specific cell types were not always linked to cell-specific gene expression patterns, as significant cell-type-restricted associations were observed even in instances where the eGenes were expressed in multiple (unaffected/weakly associated) cell subsets (Fig. 3A, Fig. S8A–D and Table S5A).
Fig. 3. Activation-dependent effects of genetic variants are highly cell-type restricted.

(A) Cluster-specific eGene analysis, showing row-wise z-scores of the adj. association P values (left panel) and expression levels (right panel) for identified eGenes (one per row) in the indicated cell cluster. (B) Overlap of eGenes identified in the indicated CD4+ T cell subsets (n=19). The pie chart shows the fraction of eGenes identified in varying numbers of activated CD4+ T cell subsets. (C) eGenes identified in resting CD4+ T cell types (n=8) identified previously (3) or in activated CD4+ T cell subsets (n=19) from this study. The heatmaps show the most significant adj. P value (left panels) and absolute effect sizes (right panels) for selected eGenes across all resting or activated CD4+ T cell subsets. (D-F) Expression levels of selected eGenes in the indicated cell cluster from subjects categorized based on the genotype at the indicated peak cis-eQTL; each symbol represents the aggregated single-cell data (mean expression) from an individual subject; adj. association P value *P < 0.05, **P < 0.001, and ***P < 0.00001. (G) Volcano plot of single-cell differential gene expression analysis (DGEA) shows statistical significance (-log10 adjusted P value) and log2 fold change (LFC) comparing the gene expression of cells after knockdown with control siRNA and LSP1 siRNA pools (see Material and Methods). The color scale indicates the average expression (log2(CPM+1)) and dot size is the fraction of cells expressing a given gene (CPM > 0), both metrics derived from the condition with increased gene expression. The gray dotted lines represent the threshold values for LFC and adjusted P value. (H) Expression levels of selected eGenes in the indicated cell cluster from subjects categorized based on the genotype at the indicated peak cis-eQTL; each symbol represents the aggregated single-cell data (mean expression) from an individual subject; adj. association P value *P < 0.05, **P < 0.001, and ***P < 0.00001.
We observed strong effects in specific cell types for a number of activation-induced eGenes that encode for important T cell effector molecules (Fig. 3C). For example, the eGenes CCL4 and CCL20 showed the most significant eQTLs in the TH1 and TH17 subsets, respectively (Fig. 3C,D). CCL4 encodes for the chemokine (C-C motif) ligand 4 (CCL4), also known as macrophage inflammatory protein-1β (MIP-1β), which primarily recruits CCR5-expressing immune cells (26). This TH1 cell-driven CCL4-CCR5 chemotactic axis has been shown to be important for the recruitment of CD8+ T cells, NK cells, dendritic cells and myeloid cells to lymph nodes and tissues during infections (26, 27). Whereas CCL20, encoded by CCL20, plays an important role in immune responses by recruiting CCR6-expressing T cell subsets, such as TH17, TH1/17 and TREG cells, to sites of infection (26, 28). Another identified activation-induced eGene was TGFB1, which encodes for the immunoregulatory cytokine TGF-β (29). Although TGFB1 was expressed in most activated CD4+ T cell subsets, the most significant genotype-dependent effect was observed in the TH2 subset (Fig. 3C,D). However, the expression of one pro-inflammatory cytokine-encoding eGene (IL32) showed a significant association with genetic variants in multiple CD4+ T cell subsets (30) (Fig. 3C and Fig. S8E).
Several activation-induced eGenes (SGK1, HOPX, DAP and TMEM41B) that encode molecules involved in the differentiation and survival of CD4+ T cell subsets showed prominent cell-type-restricted effects (Fig. 3C,E and Fig. S8F). Serum- and glucocorticoid-induced kinase 1 (SGK1) was initially shown to regulate the differentiation of TH17 cells (31), and later studies showed that it regulates the balance between TH1 and TH2 differentiation in vivo (32); it is precisely these cell types (TH1, TH17 and TH2 cells) that are most susceptible to the effects of genetic variants associated with SGK1 expression (eQTLs with lowest adjusted association P value). The eGenes HOPX and DAP showed cell-type-restricted effects specifically in TH1 and TH17 cells. HOPX is a transcription factor that has been shown to influence the survival of effector TH1 cells by regulating the expression of apoptotic genes (33), and DAP1, encoded by DAP, has also been shown to be a key regulator of apoptosis and autophagy (34). Another gene involved in autophagy, TMEM41B, displayed strong eQTLs in TH1 cells (Fig. 3C,E), and notably, TMEM41B was recently shown to be a critical host factor that is required for infection and replication of flaviviruses and SARS-CoV-2 (35, 36). Although T cells are not the primary cellular target of SARS-CoV-2 infection, our finding suggesting that TMEM41B expression can be modulated by common genetic variants is significant because such variants may also alter expression in viral target cell types, like epithelial or myeloid cell types, to influence viral replication in the host and potentially affect clinical outcomes. A recent single-cell transcriptome study showed that airway T cells from patients with severe COVID-19 illness harbor SARS-CoV-2 transcripts (37), suggesting that changes in TMEM41B expression may also influence viral replication even in T cells.
Another activation-induced eGene of relevance in T cells is LSP1 (Fig. 3C,F), encoding for leukocyte-specific protein 1, which is a calcium-activated actin-binding protein that has been shown to negatively regulate T cell migration and dampen T cell-dependent inflammation in mouse models of arthritis and delayed-type hypersensitivity (38). Knockdown studies in primary human T cells showed that LSP1 modulates the expression of genes encoding for products involved on TH17 differentiation (SGK1) (31), co-inhibitory signals (CD200) (39), cell migration (RAC2) (40), cytotoxicity (CST7) (41), cell proliferation and cytokine production (JAK1) (42) (Fig. 3G, Fig. S6F,G, Table S7 and Table S8). These functional studies suggest that LSP1 may play important roles in T cell differentiation and effector functions, and genetic variants modulating its expression levels may have important functional consequences.
Several eGenes (e.g., ENTPD1, FCRL3 and UBA6) showed prominent genotype dependency only in the TREG subsets. ENTPD1 and FCRL3 were previously shown to be eGenes in resting TREG cells (3), and here, we found that their cell-specific effects were maintained even following activation (Fig. 3C,H). On the other hand, the eGene UBA6 showed prominent eQTLs only in the activated memory TREG subset, highlighting the importance of activation-dependent gene regulation. UBA6, encodes for a recently characterized non-canonical ubiquitin-activating enzyme whose function in TREG cells has not been described (43). Given the importance of ubiquitinating enzymes in TREG cell function (44), UBA6 may also have a significant role in TREG cells. INPP5A is another noteworthy example of a cell-specific eGene that showed genotype dependency only in cytotoxic CD4+ T cells, a relatively small CD4+ T cell subset (cluster 16) (Fig. 1B, Fig. 3C and Fig. S8G). The eQTL (rs11101659) associated with INPP5A expression was located in the promoter region of a gene located > 700 kb away that directly interacted with the INPP5A promoter in naïve CD4+ T cells, suggesting potential long-distance cis-regulation by this eQTL (Fig. S8H).
Disease-risk variants linked to activation-induced eGenes
One of the major goals of eQTL studies is to find the target genes and cell types most susceptible to the effects of variants identified by genome-wide association studies (GWAS) of diseases and traits. By overlapping the sc-eQTLs discovered in our study with published GWAS variants (PGWAS < 5 × 10⁻⁸, see Material and Methods), we found that over 600 eGenes were significantly associated with GWAS variants (see Material and Methods) (Fig. 4A, Fig. S9 and Table S6A). Importantly, nearly half of these eGenes were not detected in our previous eQTL study of resting CD4+ T cell subsets (3) (Fig. 4A), suggesting that in susceptible cell types, activation per se can reveal the effects of many disease-risk variants on gene expression. For genetic variants associated with common immune-mediated diseases, we highlighted the activation-dependent eGenes that were identified by only sc-eQTL analysis of activated CD4+ T cell subsets (Fig. S9 and Table S6A). Additional colocalization and TWAS analysis of genetics variants linked to certain immune-mediated diseases further prioritized putative causal GWAS eGenes (n=261) in activated CD4+ T cell subsets (Tables S6B–E).
Fig. 4. Disease-risk variants linked to activation-induced eGenes.
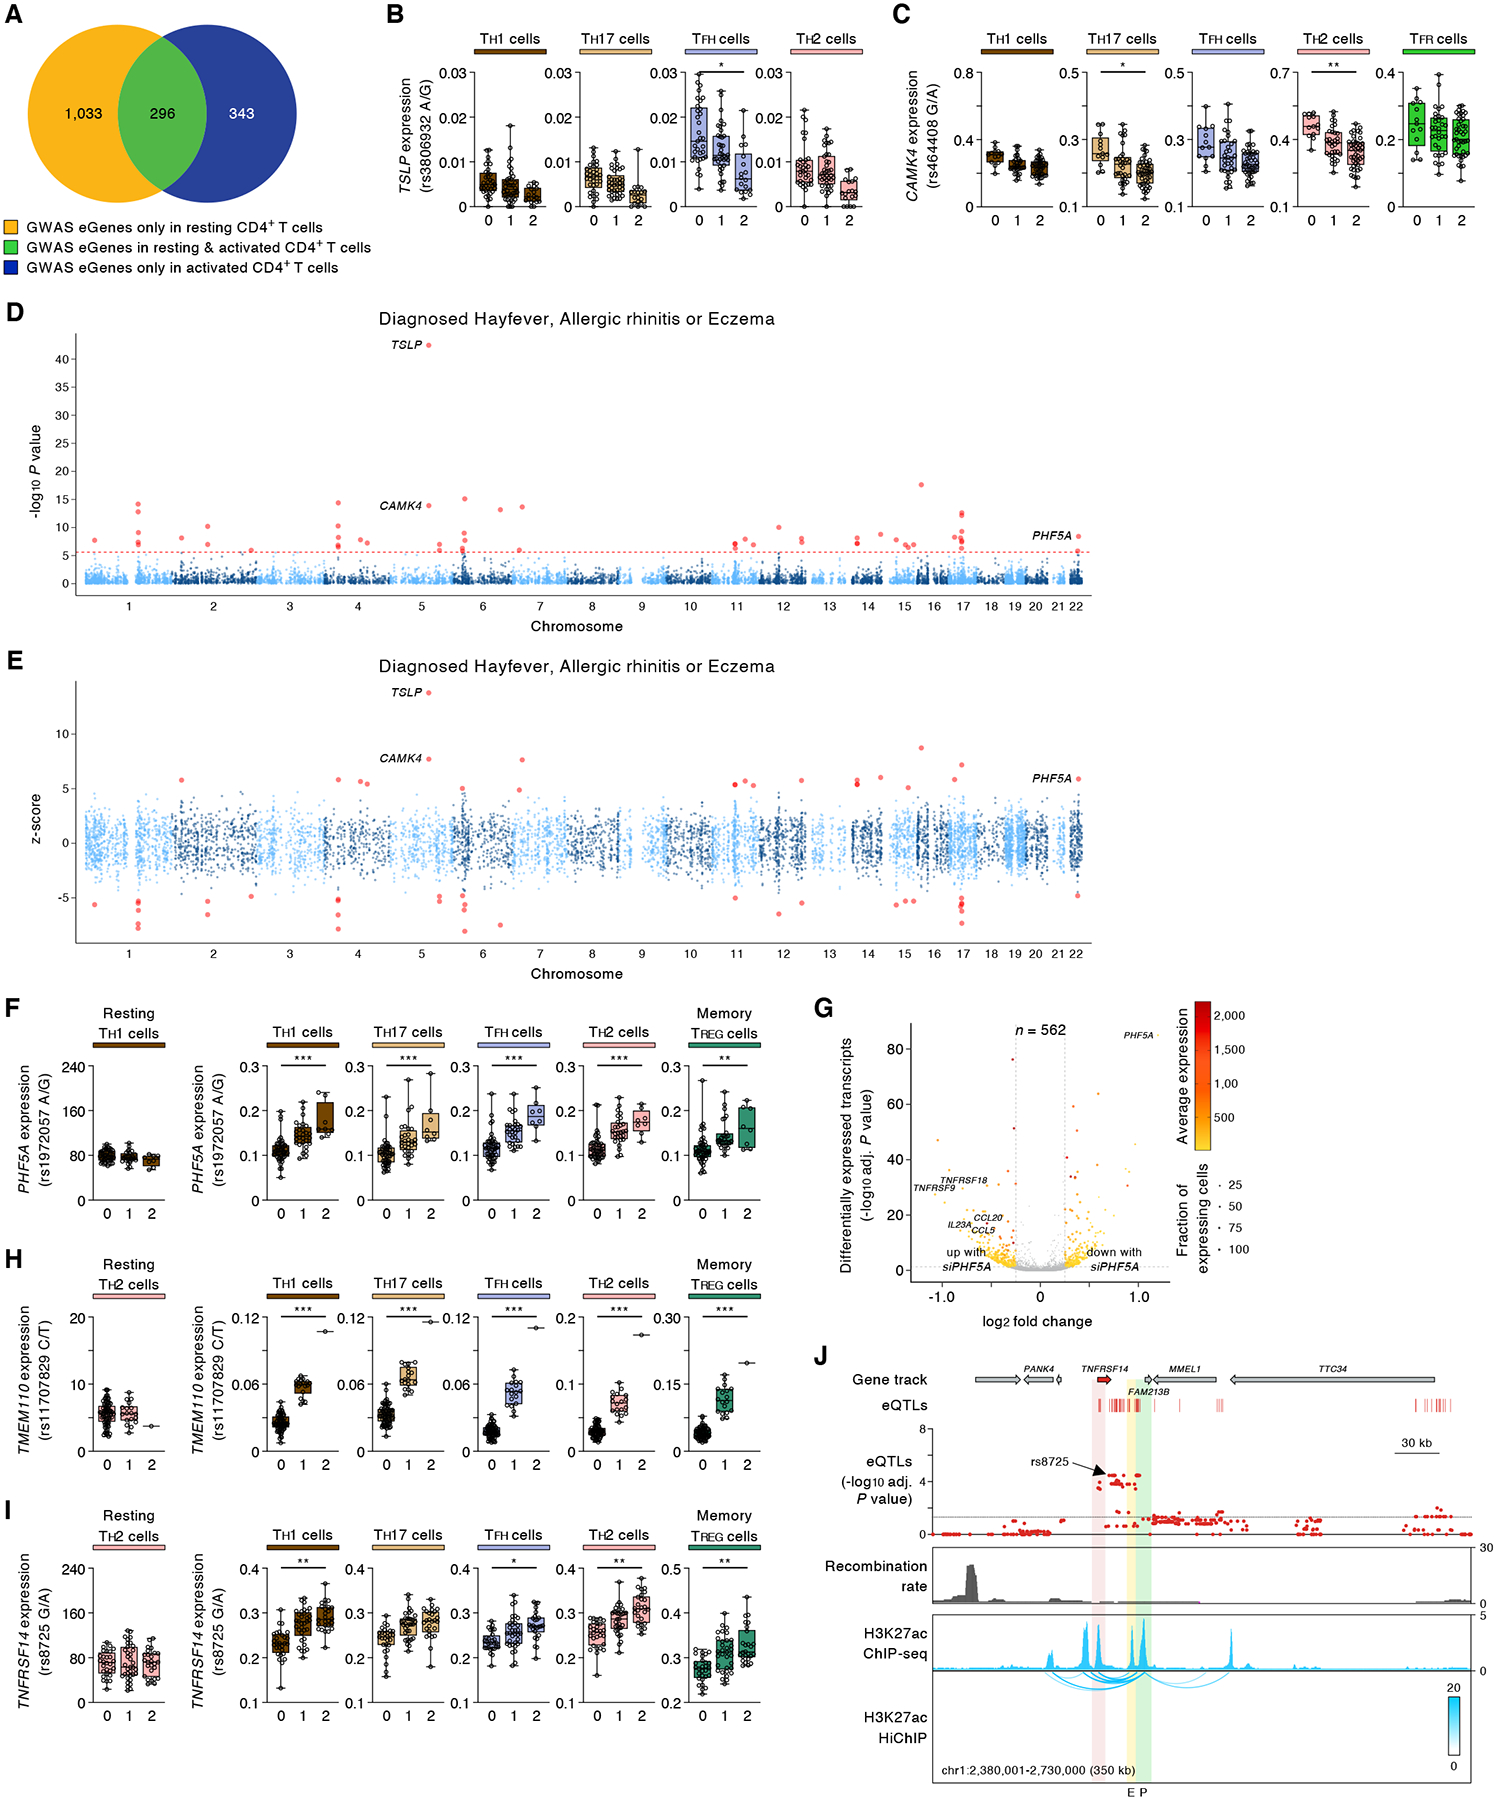
(A) Venn diagram indicates overlap of GWAS eGenes from resting CD4+ T cell types (n=8) identified previously (3) with GWAS eGenes from activated CD4+ T cell subsets (n=19) from this study. (B,C) Expression levels of selected eGenes in the indicated cell cluster from subjects categorized based on the genotype at the indicated peak cis-eQTL; each symbol represents the aggregated single-cell data (mean expression) from an individual subject; adj. association P value *P < 0.05, **P < 0.001, and ***P < 0.00001. (D) Single-tissue TWAS (S-PrediXcan (89)): Gene-level Manhattan plots showing the association P value (-log10) for gene expression with allergic diseases (hay fever, allergic rhinitis or eczema); results across 19 activated CD4+ T cell subsets is shown (see Material and Methods). The red horizontal line shows gene-level Bonferroni corrected genome-wide significant P value threshold (P < 2.47 × 10⁻⁶). (E) Single-tissue TWAS (S-PrediXcan (89)): Z scores showing the direction of effect for the genotype-inferred expression of transcripts that encode protein-coding genes in activated CD4+ T cell subsets. Red circles indicate genes with Bonferroni corrected genome-wide significant P value threshold (P < 2.47 × 10⁻⁶). (F) Expression levels of PHF5A in the indicated cell cluster from subjects categorized based on the genotype at the indicated peak cis-eQTL; each symbol represents the aggregated single-cell data (mean expression) from an individual subject; adj. association P value *P < 0.05, **P < 0.001, and ***P < 0.00001. (G) Volcano plots of single-cell differential gene expression analysis (DGEA) show statistical significance (-log10 adjusted P value) and log2 fold change (LFC) comparing the gene expression of cells after knockdown with control siRNA and PHF5A siRNA pools (see Material and Methods). The color scale indicates the average expression (log2(CPM+1)) and dot size is the fraction of cells expressing a given gene (CPM > 0), both metrics derived from the condition with increased gene expression. The gray dotted lines represent the threshold values for LFC and adjusted P value. (H,I) Expression levels of selected eGenes in the indicated cell subsets (left panel, bulk gene expression data of resting cells as previously published (3); expression levels are shown in TPM, transcripts per million) or activated CD4+ T cell subsets (right panel) from subjects categorized based on the genotype at the indicated peak cis-eQTL; each symbol represents the aggregated single-cell data (mean expression) from an individual subject; adj. association P value *P < 0.05, **P < 0.001, and ***P < 0.00001. (J) UCSC Genome Browser tracks for the TNFRSF14 locus, adj. association P value for cis-eQTLs (showing the most significant peak cis-eQTL across all cell cluster) linked to the expression of TNFRSF14, recombination rate track (96), H3K27ac ChIP-seq track, and H3K27ac HiChIP chromatin interaction maps in naïve CD4+ T cells (2). (F) Expression levels of selected eGenes in the indicated cell subsets (left panel, bulk gene expression data of resting cells as previously published (3); expression levels are shown in TPM, transcripts per million) or activated CD4+ T cell subsets (right panel) from subjects categorized based on the genotype at the indicated peak cis-eQTL; each symbol represents the aggregated single-cell data (mean expression) from an individual subject; adj. association P value *P < 0.05, **P < 0.001, and ***P < 0.00001.
Noteworthy examples of activation-dependent eGenes linked to allergic diseases (hay fever, allergic rhinitis, eczema and asthma) by TWAS include TSLP, CAMK4 and PHF5A (Fig. 4B,C,F). TSLP encodes for thymic stromal lymphopoietin (TSLP) that has been shown to promote TH2 cell responses and play a role in allergic diseases (45). Our TWAS analysis implicates increased expression of TSLP in TFH cells to risk of allergic diseases (Fig. 4D,E and Fig. S10). TWAS studies also show that increased expression of CAMK4, which encodes a multifunctional calcium/calmodulin-dependent kinase IV (CaMK4), in TH17 cells, TH2 cells and TFR cells is linked to risk of allergy and asthma (Fig. 4D,E, Fig. S10 and Tables S6B–E).
The association of PHF5A to allergic diseases is a novel finding. PHF5A encodes for PHD finger protein 5A, which has recently been shown to function as a histone reader that regulates splicing and suppresses apoptosis in tumor cells (46). To further explore the role of this eGene in the function of CD4+ T cells, we knocked down PHF5A expression in memory CD4+ T cells and examined the genome-wide effects on activation-induced gene expression pattern by analysis of their single-cell transcriptomes (Fig. 4G, Fig. S6F,G and Table S7). Knockdown studies in primary human T cells resulted in increased expression of genes encoding for T cell activation markers (TNFRSF9 (4-1BB), TNFRSF18 (GITR)) and cytokines/chemokines (IL23A, CCL5, CCL20) that have been implicated in asthma and allergic inflammation (47–49) (Fig. 4G, Table S7 and Table S8). These functional studies in primary human CD4+ T cells suggest that PHF5A may play important roles in T cell differentiation and effector functions, thus genetic variants modulating its expression levels may have important functional consequences in allergic diseases. However, further investigation in model organisms will be required to define the role of these eGenes in disease pathogenesis.
A genetic variant (rs11707829T/T) linked to vaccine potency showed an association with increased expression of TMEM110 in only activated CD4+ T cell subsets (Fig. 4H and Fig. S9). TMEM110 was recently identified in an RNAi screen as an important positive regulator of calcium signaling in activated T cell lines (Jurkat T cells) (50), thus, genetic variants modulating the levels of TMEM110 are likely to impact the functional activity of T cells. Another notable example is an autoimmune-disease variant that showed an association with the expression of TNFRSF14 only in activated CD4+ T cell subsets (Fig. 4I and Fig. S9). TNFRSF14 encodes for herpesvirus entry mediator (HVEM), a member of the TNF receptor superfamily, which can function as a co-stimulatory or co-inhibitory molecule in T cells depending on the ligand that engages the receptor (51). In mouse models, HVEM-deficient T cells displayed an enhanced response to TCR stimulation in vitro and exaggerated inflammation in disease models (52). Notably, this autoimmune-risk haploblock (peak SNP rs8725G/G) was associated with reduced expression of TNFRSF14, which suggested that this risk-variant could impact the function of T cells and modulate disease pathogenesis. Genetic variants in this autoimmune-risk haploblock overlap with the TNFRSF14 promoter region as well as the promoter of the neighboring gene FAM213B and an intergenic cis-regulatory region, which both strongly interact with the TNFRSF14 promoter and likely regulate TNFRSF14 expression in cis (Fig. 4J). Thus, our activation-dependent sc-eQTL analysis has identified several new genes and cell types in which the effects of disease-risk variants are most prominent.
Sex has a major influence on activation-induced gene expression patterns
Biological sex is known to influence the risk of autoimmune diseases as well as the outcomes of vaccinations and infections (53). For example, males have a higher risk (> 3-fold) of developing severe illness following SARS-CoV-2 illness (54), and females have a higher risk of developing several autoimmune diseases, like SLE (53). The mechanisms by which the biological sex of an individual influences immune responses have not been fully explored (3, 55). To determine how sex influences the functional properties of activated CD4+ T cells, we examined transcripts that were differentially expressed between males and females (sex-biased transcripts) in each of the CD4+ T cell subsets. We found that 960 transcripts displayed sex-biased expression (Fig. 5A and Table S9), with the majority of the transcripts showing sex-biased expression in a highly cell-type-specific manner (Fig. 5B). Most importantly, > 90% of the sex-biased transcripts were only observed in CD4+ T cell subsets following activation but not in resting states (3) (Fig. 5C). These findings suggest that sex has a major influence on activation-dependent gene expression in CD4+ T cell subsets.
Fig. 5. Sex has a major influence on activation-induced gene expression patterns.

(A) Analysis of differentially expressed transcripts (sex-biased transcripts, each dot) in all activated CD4+ T cell subsets from females (n=35) versus male (n=54) subjects (see Material and Methods). Right panel, fractions of sex-biased transcripts in autosomes and sex chromosomes. (B) Overlap of sex-biased transcripts. The pie chart shows the relative cell specificity of the transcripts in the indicated CD4+ T cell subsets (n=19). (C) Venn diagram indicates overlap of sex-biased transcripts from resting CD4+ T cell types (n=8) reported previously (3) with sex-biased transcripts from activated CD4+ T cell subsets (n=19) in this study. (D) ConsensusPathDB (CPBD) gene term enrichment analysis showing the biological pathways enriched for sex-biased transcripts. (E) DAVID pathway analysis showing the biological pathways enriched for sex-biased transcripts in activated CD4+ T cell subsets.
We next performed gene-annotation enrichment analysis to explore the biological effects of sex-biased gene expression patterns on the function of activated CD4+ T cells. Sex-biased transcripts were significantly enriched in several pathways that are essential for the initiation and execution of effector functions by CD4+ T cells like TCR signaling, cytokines (e.g., TNF, IL2, IL4, IFNG, IL23A and CSF2), cytokine receptors, co-stimulatory, apoptosis and cell-cell adhesion pathways (Fig. 5D,E and Table S9). Other significantly enriched pathways were linked to transcription factors such as signal transducer and activator of transcription (STAT), Janus kinases (JAKs), activator protein 1 (AP-1), nuclear factor of activated T cells (NFAT), nuclear factor-κB (NF-κB) and mitogen-activated protein kinase (MAPK) signaling, which play key roles in driving the effector functions of CD4+ T cells (Fig. 5E). Notable examples of genes that showed highly significant sex-biased expression across most CD4+ T cell subsets include CD99, which encodes for a molecule (CD99) involved in the co-stimulation of T cells (56), and BATF, which encodes a transcription factor involved in differentiation of certain T cell subsets (57) (Table S9). Overall, the profound changes in the expression of key molecules involved in the effector function of CD4+ T cells may explain the large impact of sex on immune responses in infections and autoimmune diseases.
Discussion
The COVID-19 pandemic highlights how disease susceptibility and clinical outcomes can show profound interindividual and population-specific variation (58). GWAS in COVID-19 illness (59), other infections and immune-mediated diseases have aided the identification of genetic risk factors (common genetic variants) that are associated with disease susceptibility. However, it has been challenging to find the causal genes and susceptible immune cell types in which the effects of disease-risk variants are prominent, partly due to the lack of studies that systematically examine cell-type-specific and activation-dependent effects of genetic variants on gene expression. Although eQTL studies of potentially heterogeneous cell types/tissues in resting conditions provide a good starting point (4), studies that explore the effects of genetic variants in biologically relevant contexts are essential for fully uncovering the genes and pathways modulated by disease-risk variants. Because immune cells are quiescent in the absence of extrinsic stimulation, it is not possible to examine the effects of genetic variants on functionally relevant effector genes and their upstream signaling pathways in resting states.
To mimic physiological conditions that lead to the activation of T cells by antigen-presenting cells, we stimulated CD4+ T cells ex vivo by engaging the TCR and the co-stimulatory molecule CD28, and then performed a single-cell RNA-seq assay on > 1 million cells. The single-cell RNA-seq platform (10x Genomics) has a high dropout rate and hence lower sensitivity compared to bulk RNA-seq assay (60, 61). To mitigate this issue, we aggregated single-cell data (~500 to 1000 cells) from each donor per cell type to generate pseudo-bulk profiles. In addition, to ensure that established CD4+ T cell subsets were equally represented across our study subjects (n=89), we sorted equal numbers of cells from each of the 8 ‘predefined’ CD4+ T cell subsets for downstream sc-eQTL analysis. Because the proportions of the CD4+ T cell subsets among different subjects varied substantially (3), equalizing the number of cells in each CD4+ T cell subset helped us to utilize data from all study subjects across multiple subsets. To compare our sc-eQTL results with our previously published eQTL datasets obtained by bulk RNA-seq, we applied the same analysis pipeline and comparable thresholds to identify eGenes (3), and found lesser numbers of eGenes in activated T cells (single-cell RNA-seq) compared to resting T cells (bulk RNA-seq). However, in our previous report (3), using the same RNA-seq platform (bulk RNA-seq) and donors, we detected a smaller number of eGenes upon activation of FACS-purified naïve CD4+ T cells (2,811 in resting condition versus 1,793 upon activation). This suggested that activation per se reduces the number of discoverable eGenes rather than a technical issue with the single-cell RNA-seq approach, which itself offers the advantage of assessing cellular heterogeneity as well as rare cell populations. The sc-eQTL analysis provided an unbiased framework to simultaneously assess activation-dependent and cell-type-specific effects of genetic variants. Our analysis revealed many eGenes that showed prominent effects in activated conditions and specific CD4+ T cell subsets. Several hundred activation-induced eGenes were also strongly associated with disease-risk variants in specific cell types, thus implicating these genes and cell types in disease pathogenesis.
Because TCR engagement activates the pathways driving the effector functions of T cells, our sc-eQTL analysis revealed several eGenes encoding numerous key molecules involved in T cell activation, differentiation, survival and effector functions. By simultaneously studying multiple cell types, we were able to discover a number of eQTLs that displayed prominent effects in one or a few cell types, which could have been missed if the analysis was restricted to only a few CD4+ T cell subsets. We identified TNFRSF14, encoding for HVEM, as an important gene that is associated with an autoimmune disease-risk variant in activated CD4+ T cells. For > 300 eGenes, we showed prominent associations with disease-risk variants in only activated CD4+ T cells, thus expanding the list of genes that are potentially linked to disease risk. Further experimental studies are required to clarify the role of these new GWAS eGenes in disease pathogenesis. Finally, we found that biological sex has profound effects on the expression of many genes involved in TCR activation, downstream TCR signaling and effector functions. Overall, our study highlights the power of sc-eQTL studies in stimulated cell types for uncovering new genes and pathways linked to common genetic variants and disease risk.
Materials and Methods
Study design
CD4+ T cells are key orchestrators of adaptive immune responses. In the first release of the results of the DICE (Database of Immune Cell Expression, eQTLs and Epigenomics) project (3), we reported on eQTLs in resting conditions for 8 ‘predefined’ subsets of CD4+ T cells: naïve CD4+ T cells, TH1 cells, TH1/17 cells, TH17 cells, TH2 cells, TFH cells, and naïve and memory TREG cells, which were sorted based on the expression of surface markers. To explore how genetic variants impact activation-dependent gene expression in these cell types, we stimulated CD4+ T cells by engaging the T cell receptor (TCR) and the co-stimulatory molecule CD28, and then sorted equal numbers of cells (n=~1,000) from every subject (n=89) for each of the eight ‘predefined’ CD4+ T cell subsets. We then performed single-cell transcriptomic and eQTL (sc-eQTL) analysis of nearly 1 million activated CD4+ T cells to identify genes that show genotype-dependent changes in their expression (eGenes). Colocalization and TWAS analysis of genetics variants linked to certain immune-mediated diseases further prioritized putative causal GWAS eGenes in activated CD4+ T cell subsets.
Human subject details
The Institutional Review Board (IRB) of the La Jolla Institute for Immunology (LJI; IRB protocol no. SGE-121-0714) approved the study. A total of 91 healthy volunteers were recruited in the San Diego area, who provided leukapheresis samples at the San Diego Blood Bank (SDBB) after written informed consent. The cohort consisted of 37 female and 54 male study subjects with a median age of 27 years (range 18 to 61 years). In this study, samples of 35 female and 54 male study subjects (n=89) were utilized. All study subjects self-reported ethnicity and race details, and tested negative for hepatitis B, hepatitis C and human immunodeficiency virus (HIV), as previously described (3).
Sample processing and CD4+ T cell stimulation assay
Peripheral blood mononuclear cells (PBMC) were obtained from leukapheresis samples by density gradient centrifugation and cryopreserved in liquid nitrogen. For the isolation of immune cell types of interest, cryopreserved PBMCs of 10–12 donors were thawed for each experimental batch (Table S1A,B), washed and pre-enriched for total CD4+ T cells using the ‘Human CD4+ T Cell Isolation Kit’ (Miltenyi Biotec), following the manufacturer’s instructions. For each sample, 5 × 10⁶ total CD4+ T cells of a given donor were stained with Hashtag TotalSeq™-B antibodies and fluorescence-labeled surface antibodies for FACS panel I (Table S10A). After washing, the cells were resuspended in 1 mL of pre-warmed IMDM medium, supplemented with 5% (vol/vol) heat-inactivated fetal bovine serum (FBS) and 2% (vol/vol) human AB serum (Cellgro), left untreated or activated ex vivo with Dynabeads™ Human T-Activator CD3/CD28 (Thermo Fisher Scientific) at a bead-to-cell ratio of 1:1 for 4 hours at 37°C. The Dynabeads were magnetically removed, the CD4+ T cells were washed, stained with fluorescence-labeled surface antibodies for FACS panel II (Table S10A) and sorted on a FACSAria Fusion Cell Sorter (Becton Dickinson) using the gating strategy shown in Fig. S2. For each experimental batch (n=10), resting or activated cells of 8 ‘predefined’ cell types from 12 samples, labeled with Hashtag TotalSeq™-B antibodies, were pooled by FACS sorting into 3–8 collection tubes (Table S1A,B). All flow cytometry data were analyzed using FlowJo software (version 10).
Cell isolation and preparation of single-cell RNA-seq libraries
For each experimental batch (n=10), 3–8 tubes with pooled cells from 12 samples were utilized to prepare single-cell RNA-seq libraries (10x Genomics). For each sequencing library (n=70), about 50,000 CD4+ T cells from 12 samples were pooled by FACS sorting into low retention 1.5 mL collection tubes (Thermo Fisher Scientific), containing 0.5 mL of a 1:1 solution of PBS:FBS supplemented with RNase inhibitor (1:100; Takara Bio). Following FACS sorting, the cells were washed with ice-cold PBS, centrifuged for 5 minutes (600 g at 4°C), gently resuspended in ice-cold PBS, supplemented with 0.04% ultra-pure bovine serum albumin (Sigma-Aldrich), and processed following the manufacturer’s instructions (10x Genomics). Single-cell RNA-sequencing library preparation was performed following the manufacturer’s recommendations for the 10x Genomics 3’ Tag v3.0 chemistry kit with feature barcoding technology for cell surface proteins. The amplification of cDNA was carried out with 11 cycles of amplification; the 3’ Tag gene expression libraries and the corresponding hashtag libraries were generated separately with 12 and 9 cycles of amplification, respectively. The libraries were quantified and pooled in equivalent molar concentrations and sequenced on Illumina NovaSeq 6000 sequencing platform with the following read lengths: read 1 – 101 cycles; read 2 – 101 cycles; and i7 index - 8 cycles.
Single-cell transcriptome analysis
The reads from each single-cell RNA-seq library were initially demultiplexed, aligned and collapsed into Unique Molecular Identifier (UMI) counts using the software Cell Ranger (v3.0.2) from 10x Genomics (modules mkfastq and count using standard parameter values) and the human genome reference GRCh37 (v1.2.0). UMI counts across genes and cells from multiple libraries were aggregated into different pooled datasets, either according to the identity of predefined CD4+ T cell subset or considering all of them (Table S1D), using Cell Ranger’s module aggr with default parameter values (v3.0.2). Merged data were transferred to the R statistical environment for analysis using the package Seurat (v3.1.1) (62). In R, predefined annotations for each cell (namely, CD4+ T cell type, FACS sorting batch and sequencing batch) were made, along with donor identity based on the joined hashtag oligonucleotide (HTO) data collected for the same cells. We filtered to keep only cells with an assigned donor ID (i.e., requiring HTO data for donor deconvolution), thus removing all cells classified as doublets or negatives at the donor deconvolution stage (see section below). To further minimize doublets and eliminate cells with low quality transcriptomes, we excluded cells that did not meet the following criteria: range of total UMI counts: 2,000–10,000; range of total unique genes counts: 500–3,000; and mitochondrial UMI percent < 15%. The summary statistics for the single-cell transcriptome libraries are provided in Table S1 and indicate good quality data for performing sc-eQTL analysis (12).
Two independent approaches were utilized to normalize raw UMI count data: (i) ‘Log-normalization’ and (ii) ‘SCTransform’, considering specific settings for each method as follows. First, using Seurat’s function ‘NormalizeData’ (norm.method=‘LogNormalize’ and scale.factor=10,000), we applied ‘log-normalization’ across cells and, in this case, only the most variable genes having a mean expression value across cells > 0.1 and accounting for 30% of the total standardized variance (as determined by the function ‘FindVariableFeatures’ with selection.method=‘vst’ -i.e., using the Variance Stabilizing Transformation method-) were taken into account for all downstream analyses. Furthermore, when scaling and centering gene expression values across cells, a step accomplished with the function ‘ScaleData’ (block.size=2,000), two variables calculated per cell, namely the total UMI content and mitochondrial UMI percent, were regressed out taking advantage of the argument ‘vars.to.regress’. Second, we used the regularized negative binomial regression method (‘SCTransform’, SCT) (63) as an alternative approach to normalize UMI count data through Seurat’s function ‘SCTransform’ while, for this method, regressing only the mitochondrial UMI percent variable and taking the top 2,000 most variable genes for downstream analyses.
Principal component analysis was performed using the variable genes selected for each method as described and the first 30 principal components (PCs) were picked for all further analyses (except when stated otherwise) based on the standard deviation of PCs in the ‘elbow plot’ and the selection of genes having a heavier weight for each PC. Cells were clustered using the FindNeighbors and FindClusters functions in Seurat with a resolution of 0.8. The analysis based on these settings identified 21 clusters, the two smallest ones were not considered for any further analyses due to them being too small (size = 2 cells for both clusters). The robustness of clustering was verified by modifying the number of PCs and variable genes utilized for this process. Analysis of clustering patterns across multiple transcriptome libraries and sequencing batches revealed no evidence for batch effects (Fig. S3). Calculation of Uniform Manifold Approximation and Projection (UMAP) embeddings was done with Seurat’s function ‘RunUMAP’ using the first 40 PCs, 15 neighboring points for local approximations of manifold structure and a minimum distance of 0.1 through arguments ‘dims’, ‘n.neighbors’ and ‘min.dist’, respectively.
Further visualizations of exported normalized data such as UMAP or ‘violin’ plots were generated using the Seurat package and custom R scripts. In violin plots, shape represents the distribution of cells expressing the transcript of interest (based on a Gaussian Kernel density estimation model) and color represents the percentage of cells expressing the transcript of interest.
Batch effect quantitative and qualitative assessment and data integration
Initial qualitative assessment of UMAP plots did not reveal any apparent batch effects when considering the major sources of technical variation in the dataset: (i) FACS-sorting batches (n=10), (ii) 10x sequencing libraries (n=70), and (iii) sequencing runs (n=5) (Fig. S3G).
Based on recommendations provided by the comprehensive benchmarking study of tools to assess and correct for batch effects in single-cell datasets (64), we utilized Harmony (65) to objectively assess potential batch effects. We integrated the scRNA-seq data within the Seurat workflow using Harmony’s function ‘RunHarmony’ (v.0.1.0) with default parameters (theta = 2.0, lambda = 1.0 and sigma = 0.1) (65). As recommended, we removed the sequencing batch variable (through argument ‘group.by.vars’) as this factor was the most unbalanced variable in our dataset (Table S1C). To examine the effects of Harmony-based integration on single-cell clustering, we inferred clusters and obtained the UMAP cell embeddings (through functions RunUMAP, FindNeighbors and FindClusters; R package Seurat (v3.1.1) (62)) using the same parameter values described above for the dataset without Harmony integration, except that the first 40 components from Harmony were used instead of the standard principal components. Data integration by Harmony tool resulted in no major differences in the clustering of cells when compared to clustering of cells without Harmony integration (Fig. S3H).
We next calculated the integration local inverse Simpson’s index (iLISI), a quantitative metric of integration and batch effect provided by the Harmony tool (65). iLISI score quantifies the effective number of batches (e.g., sequencing or FACS-sorting batch) around the neighborhood of every cell (66). iLISI score ranges from 1 to n, where n equals the total number of batches, and an index closer to n represents ideal mixing of cells across multiple batches. The accuracy of iLISI score is determined by the complementary metric cell-type LISI (cLISI), which estimates if different cell types cluster separately (cLISI index of 1) or together (cLISI index of n; n represents the number of cell types in the dataset). We calculated LISI scores for the cells in our dataset (independently with and without Harmony integration) by using the function ‘compute_lisi’ from the R package ‘lisi’ (v.1.0) (65) specifying the UMAP coordinates 1 and 2 (argument ‘meta_data’), the sequencing and FACS-sorting batches, and cell cluster identify of every cell (argument ‘label_colnames’). As recommended (66), cells from sequencing batch 5 were excluded for the calculation of the LISI scores, because this batch was highly unbalanced for cell types compared to the rest of the sequencing batches. LISI scores, represented as violin plots using ‘ggplot2’ in R (v.3.3.0) (67), showed that our scRNA-seq data set without Harmony integration displayed good LISI metrics, indicating no major batch effects (Fig. S3I). Notably, Harmony integration of our scRNA-seq data set showed similar metrics, suggesting that batch effect correction was not required.
We also calculated the cell-specific mixing score (cms), another metric for assessing potential batch effects (66). The cms metric assesses mixing of cells between different batches by using a statistical framework to test whether Euclidean distance (cell-to-cell) distributions in the neighborhood of a cell is batch-specific. The cms score of every cell is the P value (Anderson-Darling test) evaluating the null hypothesis that the Euclidean distance distribution in its neighborhood is not different between batches, such that a well-mixed dataset should show an even distribution of these P values across their cells (further details in (66)). Due to memory and time constraints, the cms scores were calculated for 10 independent random samples with size of 100,000 cells from our scRNA-seq data set with and without Harmony integration. The function ‘cms’ from the R package ‘CellMixS’ (v1.8.0) (66) was applied to every random sample (n=10) using: (i) a custom k size for every type of dataset (argument ‘k’) as described below, (ii) the variable listing the sequencing batches of every cell (argument ‘group’) and (iii) the first 2 PCs (as suggested by (66); argument ‘dim_red’) and the first 2 Harmony components for our scRNA-seq dataset without and with Harmony integration, respectively. K size was calculated as half the average of the cell size of the smallest cluster across the multiple samples, resulting in k=196 and k=223 for our scRNA-seq dataset without and with Harmony integration, respectively. The cms distribution, represented as histograms (bin=30) using ‘ggplot2’ in R (v.3.3.0) (67), showed that our scRNA-seq data set without Harmony integration displayed good cms metrics, indicating no major batch effects (Fig. S3I). Notably, Harmony integration showed similar metrics, further suggesting that batch effect correction was not required.
Hashtag oligonucleotide data processing and donor demultiplexing
Reads from single-cell hashtag oligonucleotide (HTO) data were demultiplexed into independent TotalSeq™-B antibody capture libraries using Cell Ranger’s module ‘mkfastq’ (v3.0.2) and further collapsed into HTO UMI counts across cells and hashtag identities using its module ‘count’ (adapted for feature barcoding analysis, v3.0.2). Up to 12 donors were multiplexed per transcriptome library (FACS sorting batch) (Table S1F) and hence required demultiplexing based on their HTO data. For the HTO data, barcodes were called as cells if their highest hashtag identity-specific UMI count was > 100. Donor identities (class singlet) were inferred per HTO library by Seurat’s function MULTIseqDemux (autoThresh = TRUE and maxiter = 10, v3.1.1) (68), allowing also for identification of ‘multiplet’ identities (class doublet) or negative enrichment of HTOs (class negative; ‘not assigned’ in Fig. S3D). For further stringency, cells were re-classified as doublets if the fold change of UMI counts between the top 2 hashtag identities was less than 3. Cells assigned either to the doublet or negative class were removed from downstream analyses.
Single-cell differential gene expression analysis
Single-cell differential gene expression analysis (DGEA) was performed using the package MAST in R (v1.10.0) (69). When comparing two groups of interest whose size addition was > 50,000 cells, the set was randomly downsampled to that count limit. For analysis, raw UMI count data was first converted to log2 counts per million (log2(CPM+1)) across genes per cell and, as specified below, one or more variables may have been considered in the DGEA formula for regression. A gene was considered as differentially expressed if Benjamini-Hochberg adj. P value < 0.05 and log2 fold change > 0.25.
To compare resting and stimulated conditions of the ‘predefined’ CD4+ T cell types (Fig. S4A), cells from five matched donors (donor IDs: 3, 12, 39, 49 and 67) were compared between both conditions for each cell type and the variables indicating the general donor ID and their biological sex were set to be disregarded in the formula for each comparison (i.e., for each subset). To find markers enriched in either ‘predefined’ CD4+ T cell type or inferred cell cluster, DGEA was applied through the function ‘FindAllMarkers’ from Seurat (v3.1.1).
To call sex-biased transcripts in each CD4+ T cell cluster, multiple pair-wise comparisons were made (one per cluster) between biological sexes and donors’ age and ethnicity information was regressed out.
Quantification and statistical analysis
Processing of data, applied methods and codes are described in the respective section in the Material and Methods. The number of subjects, samples and replicates analyzed, and the statistical test performed are indicated in the figure legends. Statistical analysis for comparison between two groups was assessed with Student’s paired two-tailed t test using GraphPad Prism 9.1.
Any samples failing established quality controls (QC) were eliminated from downstream analysis; assay details and QCs on single-cell RNA-seq samples included are provided in Table S1. Single-cell differential gene expression analysis (DGEA) was performed using the package MAST in R (v1.10.0) (69). A gene was considered as differentially expressed if Benjamini-Hochberg adj. P value < 0.05 and log2 fold change > 0.25. To compare resting and stimulated conditions, cells from matched donors were compared between both conditions for each cell type. DGEA was applied through the function ‘FindAllMarkers’ from Seurat (v3.1.1). To call sex-biased transcripts in each CD4+ T cell cluster, multiple pair-wise comparisons were made (one per cluster) between biological sexes, and donors’ age and ethnicity information was regressed out.
To identify eQTLs, the full set of SNPs (measured and imputed) was tested for association with the expression of sequenced genes using the Matrix eQTL package v2.1.1. For the determination of cis-acting eQTLs, affected transcripts (eGenes) and their comparison across cell populations the following thresholds were applied: raw P value < 0.0001, adj. P value (FDR) < 0.05 for transcripts expressed in > 1% of cells of > 5% of donors in this study. If not stated otherwise, the associated SNP (called as peak SNP) with the lowest raw P value and adj. P value (FDR) was chosen for a given transcript.
Supplementary Material
Acknowledgments
We thank the La Jolla Institute (LJI) Flow Cytometry, Clinical Studies and Sequencing Core.
Funding
This work was supported by the William K. Bowes, Jr. Foundation (PV), National Institutes of Health grant R24 AI108564 (PV, FA, BP), National Institutes of Health grant R35-GM128938 (FA), and National Institutes of Health grant S10OD025052 (Illumina NovaSeq 6000).
Footnotes
Competing interests
The authors declare no competing financial interests.
Data and materials availability
The DICE project provides anonymized data for public access at http://dice-database.org. Individual-specific single-cell sequencing and genotype data is available through the database of Genotypes and Phenotypes (dbGaP Accession number: phs001703.v4.p1). The code used for colocalization analysis, TWAS analysis and GWAS overlap analysis is available on Github at https://github.com/vijaybioinfo. The code used for HiChIP data analysis is available on GitHub at https://github.com/ay-lab. All data needed to evaluate the conclusions in the paper are present in the paper, in the Supplementary Materials (including the supplementary Excel spreadsheets designated Tables S1–S10), or at the designated online resources. Requests for reagents may be directed to the corresponding author/lead contact, Pandurangan Vijayanand (vijay@lji.org).
References and Notes
- 1.1000 Genomes Project Consortium, A global reference for human genetic variation. Nature 526, 68–74 (2015). [DOI] [PMC free article] [PubMed] [Google Scholar]
- 2.Chandra V et al. , Promoter-interacting expression quantitative trait loci are enriched for functional genetic variants. Nature genetics 53, 110–119 (2021). [DOI] [PMC free article] [PubMed] [Google Scholar]
- 3.Schmiedel BJ et al. , Impact of Genetic Polymorphisms on Human Immune Cell Gene Expression. Cell 175, 1701–1715 e1716 (2018). [DOI] [PMC free article] [PubMed] [Google Scholar]
- 4.GTEx Consortium, The GTEx Consortium atlas of genetic regulatory effects across human tissues. Science 369, 1318–1330 (2020). [DOI] [PMC free article] [PubMed] [Google Scholar]
- 5.Ye CJ et al. , Intersection of population variation and autoimmunity genetics in human T cell activation. Science 345, 1254665 (2014). [DOI] [PMC free article] [PubMed] [Google Scholar]
- 6.Nedelec Y et al. , Genetic Ancestry and Natural Selection Drive Population Differences in Immune Responses to Pathogens. Cell 167, 657–669 e621 (2016). [DOI] [PubMed] [Google Scholar]
- 7.Quach H et al. , Genetic Adaptation and Neandertal Admixture Shaped the Immune System of Human Populations. Cell 167, 643–656 e617 (2016). [DOI] [PMC free article] [PubMed] [Google Scholar]
- 8.Lee MN et al. , Common genetic variants modulate pathogen-sensing responses in human dendritic cells. Science 343, 1246980 (2014). [DOI] [PMC free article] [PubMed] [Google Scholar]
- 9.Fairfax BP et al. , Innate immune activity conditions the effect of regulatory variants upon monocyte gene expression. Science 343, 1246949 (2014). [DOI] [PMC free article] [PubMed] [Google Scholar]
- 10.Patil VS et al. , Precursors of human CD4(+) cytotoxic T lymphocytes identified by single-cell transcriptome analysis. Sci Immunol 3, (2018). [DOI] [PMC free article] [PubMed] [Google Scholar]
- 11.van der Wijst MGP et al. , Single-cell RNA sequencing identifies celltype-specific cis-eQTLs and co-expression QTLs. Nature genetics 50, 493–497 (2018). [DOI] [PMC free article] [PubMed] [Google Scholar]
- 12.Mandric I et al. , Optimized design of single-cell RNA sequencing experiments for cell-type-specific eQTL analysis. Nature Communications 11, 5504 (2020). [DOI] [PMC free article] [PubMed] [Google Scholar]
- 13.Zhu J, Paul WE, CD4 T cells: fates, functions, and faults. Blood 112, 1557–1569 (2008). [DOI] [PMC free article] [PubMed] [Google Scholar]
- 14.Arlehamn CL et al. , Transcriptional profile of tuberculosis antigen-specific T cells reveals novel multifunctional features. J Immunol 193, 2931–2940 (2014). [DOI] [PMC free article] [PubMed] [Google Scholar]
- 15.Crotty S, T Follicular Helper Cell Biology: A Decade of Discovery and Diseases. Immunity 50, 1132–1148 (2019). [DOI] [PMC free article] [PubMed] [Google Scholar]
- 16.Sakaguchi S et al. , Regulatory T Cells and Human Disease. Annual review of immunology 38, 541–566 (2020). [DOI] [PubMed] [Google Scholar]
- 17.Seumois G et al. , Single-cell transcriptomic analysis of allergen-specific T cells in allergy and asthma. Sci Immunol 5, (2020). [DOI] [PMC free article] [PubMed] [Google Scholar]
- 18.Hall JC, Rosen A, Type I interferons: crucial participants in disease amplification in autoimmunity. Nature Reviews Rheumatology 6, 40–49 (2010). [DOI] [PMC free article] [PubMed] [Google Scholar]
- 19.Theofilopoulos AN, Baccala R, Beutler B, Kono DH, TYPE I INTERFERONS (α/β) IN IMMUNITY AND AUTOIMMUNITY. Annual review of immunology 23, 307–335 (2005). [DOI] [PubMed] [Google Scholar]
- 20.Zhang Q et al. , Inborn errors of type I IFN immunity in patients with life-threatening COVID-19. Science 370, eabd4570 (2020). [DOI] [PMC free article] [PubMed] [Google Scholar]
- 21.Ciancanelli MJ et al. , Life-threatening influenza and impaired interferon amplification in human IRF7 deficiency. Science 348, 448–453 (2015). [DOI] [PMC free article] [PubMed] [Google Scholar]
- 22.Pribila JT, Quale AC, Mueller KL, Shimizu Y, Integrins and T Cell–Mediated Immunity. Annual review of immunology 22, 157–180 (2004). [DOI] [PubMed] [Google Scholar]
- 23.Ledderose C et al. , Purinergic P2X4 receptors and mitochondrial ATP production regulate T cell migration. J Clin Invest 128, 3583–3594 (2018). [DOI] [PMC free article] [PubMed] [Google Scholar]
- 24.Prakriya M et al. , Orai1 is an essential pore subunit of the CRAC channel. Nature 443, 230–233 (2006). [DOI] [PubMed] [Google Scholar]
- 25.Voss K, Luthers CR, Pohida K, Snow AL, Fatty Acid Synthase Contributes to Restimulation-Induced Cell Death of Human CD4 T Cells. Front Mol Biosci 6, 106 (2019). [DOI] [PMC free article] [PubMed] [Google Scholar]
- 26.Hughes CE, Nibbs RJB, A guide to chemokines and their receptors. FEBS J 285, 2944–2971 (2018). [DOI] [PMC free article] [PubMed] [Google Scholar]
- 27.Honey K, CCL3 and CCL4 actively recruit CD8+ T cells. Nature Reviews Immunology 6, 427–427 (2006). [Google Scholar]
- 28.Lee A, Eri R, Lyons A, Grimm M, Korner H, CC Chemokine Ligand 20 and Its Cognate Receptor CCR6 in Mucosal T Cell Immunology and Inflammatory Bowel Disease: Odd Couple or Axis of Evil? Frontiers in Immunology 4, (2013). [DOI] [PMC free article] [PubMed] [Google Scholar]
- 29.Batlle E, Massagué J, Transforming Growth Factor-β Signaling in Immunity and Cancer. Immunity 50, 924–940 (2019). [DOI] [PMC free article] [PubMed] [Google Scholar]
- 30.Ribeiro-Dias F, Saar Gomes R, de Lima Silva LL, Dos Santos JC, Joosten LA, Interleukin 32: a novel player in the control of infectious diseases. J Leukoc Biol 101, 39–52 (2017). [DOI] [PubMed] [Google Scholar]
- 31.Wu C et al. , Induction of pathogenic TH17 cells by inducible salt-sensing kinase SGK1. Nature 496, 513–517 (2013). [DOI] [PMC free article] [PubMed] [Google Scholar]
- 32.Heikamp EB et al. , The AGC kinase SGK1 regulates TH1 and TH2 differentiation downstream of the mTORC2 complex. Nat Immunol 15, 457–464 (2014). [DOI] [PMC free article] [PubMed] [Google Scholar]
- 33.Albrecht I et al. , Persistence of effector memory Th1 cells is regulated by Hopx. Eur J Immunol 40, 2993–3006 (2010). [DOI] [PubMed] [Google Scholar]
- 34.Yahiro K et al. , DAP1, a negative regulator of autophagy, controls SubAB-mediated apoptosis and autophagy. Infect Immun 82, 4899–4908 (2014). [DOI] [PMC free article] [PubMed] [Google Scholar]
- 35.Hoffmann HH et al. , TMEM41B Is a Pan-flavivirus Host Factor. Cell 184, 133–148.e120 (2021). [DOI] [PMC free article] [PubMed] [Google Scholar]
- 36.Schneider WM et al. , Genome-Scale Identification of SARS-CoV-2 and Pan-coronavirus Host Factor Networks. Cell 184, 120–132.e114 (2021). [DOI] [PMC free article] [PubMed] [Google Scholar]
- 37.Ren X et al. , COVID-19 immune features revealed by a large-scale single cell transcriptome atlas. Cell, (2021). [DOI] [PMC free article] [PubMed] [Google Scholar]
- 38.Hwang S-H et al. , Leukocyte-specific protein 1 regulates T-cell migration in rheumatoid arthritis. Proceedings of the National Academy of Sciences 112, E6535–E6543 (2015). [DOI] [PMC free article] [PubMed] [Google Scholar]
- 39.Rygiel TP et al. , CD200-CD200R signaling suppresses anti-tumor responses independently of CD200 expression on the tumor. Oncogene 31, 2979–2988 (2012). [DOI] [PubMed] [Google Scholar]
- 40.Faroudi M et al. , Critical roles for Rac GTPases in T-cell migration to and within lymph nodes. Blood 116, 5536–5547 (2010). [DOI] [PMC free article] [PubMed] [Google Scholar]
- 41.Perisic Nanut M, Sabotic J, Svajger U, Jewett A, Kos J, Cystatin F Affects Natural Killer Cell Cytotoxicity. Front Immunol 8, 1459 (2017). [DOI] [PMC free article] [PubMed] [Google Scholar]
- 42.Seif F et al. , The role of JAK-STAT signaling pathway and its regulators in the fate of T helper cells. Cell Commun Signal 15, 23 (2017). [DOI] [PMC free article] [PubMed] [Google Scholar]
- 43.Wang F, Zhao B, UBA6 and Its Bispecific Pathways for Ubiquitin and FAT10. Int J Mol Sci 20, 2250 (2019). [DOI] [PMC free article] [PubMed] [Google Scholar]
- 44.Layman AAK, Oliver PM, Ubiquitin Ligases and Deubiquitinating Enzymes in CD4+ T Cell Effector Fate Choice and Function. Journal of immunology (Baltimore, Md. : 1950) 196, 3975–3982 (2016). [DOI] [PMC free article] [PubMed] [Google Scholar]
- 45.Cianferoni A, Spergel J, The importance of TSLP in allergic disease and its role as a potential therapeutic target. Expert Rev Clin Immunol 10, 1463–1474 (2014). [DOI] [PMC free article] [PubMed] [Google Scholar]
- 46.Zheng Y-Z et al. , PHF5A Epigenetically Inhibits Apoptosis to Promote Breast Cancer Progression. Cancer Research 78, 3190–3206 (2018). [DOI] [PubMed] [Google Scholar]
- 47.Nakajima H, Hirose K, Role of IL-23 and Th17 Cells in Airway Inflammation in Asthma. Immune Netw 10, 1–4 (2010). [DOI] [PMC free article] [PubMed] [Google Scholar]
- 48.Koya T et al. , RANTES (CCL5) regulates airway responsiveness after repeated allergen challenge. Am J Respir Cell Mol Biol 35, 147–154 (2006). [DOI] [PMC free article] [PubMed] [Google Scholar]
- 49.Reibman J, Hsu Y, Chen LC, Bleck B, Gordon T, Airway epithelial cells release MIP-3alpha/CCL20 in response to cytokines and ambient particulate matter. Am J Respir Cell Mol Biol 28, 648–654 (2003). [DOI] [PubMed] [Google Scholar]
- 50.Quintana A et al. , TMEM110 regulates the maintenance and remodeling of mammalian ER-plasma membrane junctions competent for STIM-ORAI signaling. P Natl Acad Sci USA 112, E7083–E7092 (2015). [DOI] [PMC free article] [PubMed] [Google Scholar]
- 51.Shui JW, Kronenberg M, HVEM is a TNF Receptor with Multiple Regulatory Roles in the Mucosal Immune System. Immune Netw 14, 67–72 (2014). [DOI] [PMC free article] [PubMed] [Google Scholar]
- 52.Wang Y et al. , The role of herpesvirus entry mediator as a negative regulator of T cell-mediated responses. J Clin Invest 115, 711–717 (2005). [DOI] [PMC free article] [PubMed] [Google Scholar]
- 53.Klein SL, Flanagan KL, Sex differences in immune responses. Nature reviews. Immunology 16, 626–638 (2016). [DOI] [PubMed] [Google Scholar]
- 54.Takahashi T et al. , Sex differences in immune responses that underlie COVID-19 disease outcomes. Nature 588, 315–320 (2020). [DOI] [PMC free article] [PubMed] [Google Scholar]
- 55.Oliva M et al. , The impact of sex on gene expression across human tissues. Science 369, eaba3066 (2020). [DOI] [PMC free article] [PubMed] [Google Scholar]
- 56.Moffatt MF et al. , Genetic variants regulating ORMDL3 expression contribute to the risk of childhood asthma. Nature 448, 470–U475 (2007). [DOI] [PubMed] [Google Scholar]
- 57.Schraml BU et al. , The AP-1 transcription factor Batf controls T(H)17 differentiation. Nature 460, 405–409 (2009). [DOI] [PMC free article] [PubMed] [Google Scholar]
- 58.Zeberg H, Paabo S, The major genetic risk factor for severe COVID-19 is inherited from Neanderthals. Nature, (2020). [DOI] [PubMed] [Google Scholar]
- 59.Severe Covid G. G. et al. , Genomewide Association Study of Severe Covid-19 with Respiratory Failure. The New England journal of medicine 383, 1522–1534 (2020). [DOI] [PMC free article] [PubMed] [Google Scholar]
- 60.Kharchenko PV, Silberstein L, Scadden DT, Bayesian approach to single-cell differential expression analysis. Nature methods 11, 740–742 (2014). [DOI] [PMC free article] [PubMed] [Google Scholar]
- 61.Haque A, Engel J, Teichmann SA, Lönnberg T, A practical guide to single-cell RNA-sequencing for biomedical research and clinical applications. Genome Medicine 9, 75 (2017). [DOI] [PMC free article] [PubMed] [Google Scholar]
- 62.Stuart T et al. , Comprehensive Integration of Single-Cell Data. Cell 177, 1888–1902 e1821 (2019). [DOI] [PMC free article] [PubMed] [Google Scholar]
- 63.Hafemeister C, Satija R, Normalization and variance stabilization of single-cell RNA-seq data using regularized negative binomial regression. Genome Biol 20, 296 (2019). [DOI] [PMC free article] [PubMed] [Google Scholar]
- 64.Tran HTN et al. , A benchmark of batch-effect correction methods for single-cell RNA sequencing data. Genome Biol 21, 12 (2020). [DOI] [PMC free article] [PubMed] [Google Scholar]
- 65.Korsunsky I et al. , Fast, sensitive and accurate integration of single-cell data with Harmony. Nature methods 16, 1289–1296 (2019). [DOI] [PMC free article] [PubMed] [Google Scholar]
- 66.Lütge A et al. , CellMixS: quantifying and visualizing batch effects in single-cell RNA-seq data. Life Science Alliance 4, e202001004 (2021). [DOI] [PMC free article] [PubMed] [Google Scholar]
- 67.Villanueva RAM, Chen ZJ, ggplot2: Elegant Graphics for Data Analysis (2nd ed.). Measurement: Interdisciplinary Research and Perspectives 17, 160–167 (2019). [Google Scholar]
- 68.McGinnis CS et al. , MULTI-seq: sample multiplexing for single-cell RNA sequencing using lipid-tagged indices. Nature methods 16, 619–626 (2019). [DOI] [PMC free article] [PubMed] [Google Scholar]
- 69.Finak G et al. , MAST: a flexible statistical framework for assessing transcriptional changes and characterizing heterogeneity in single-cell RNA sequencing data. Genome Biol 16, 278 (2015). [DOI] [PMC free article] [PubMed] [Google Scholar]
- 70.Aguiar VRC, Cesar J, Delaneau O, Dermitzakis ET, Meyer D, Expression estimation and eQTL mapping for HLA genes with a personalized pipeline. PLoS Genet 15, e1008091 (2019). [DOI] [PMC free article] [PubMed] [Google Scholar]
- 71.Harrow J et al. , GENCODE: the reference human genome annotation for The ENCODE Project. Genome Res 22, 1760–1774 (2012). [DOI] [PMC free article] [PubMed] [Google Scholar]
- 72.Kerimov N et al. , A compendium of uniformly processed human gene expression and splicing quantitative trait loci. Nature genetics 53, 1290–1299 (2021). [DOI] [PMC free article] [PubMed] [Google Scholar]
- 73.Howie BN, Donnelly P, Marchini J, A flexible and accurate genotype imputation method for the next generation of genome-wide association studies. PLoS Genet 5, e1000529 (2009). [DOI] [PMC free article] [PubMed] [Google Scholar]
- 74.Shabalin AA, Matrix eQTL: ultra fast eQTL analysis via large matrix operations. Bioinformatics 28, 1353–1358 (2012). [DOI] [PMC free article] [PubMed] [Google Scholar]
- 75.Ramos EM et al. , Phenotype-Genotype Integrator (PheGenI): synthesizing genome-wide association study (GWAS) data with existing genomic resources. Eur J Hum Genet 22, 144–147 (2014). [DOI] [PMC free article] [PubMed] [Google Scholar]
- 76.Deng JE, Sham PC, Li MX, SNPTracker: A Swift Tool for Comprehensive Tracking and Unifying dbSNP rs IDs and Genomic Coordinates of Massive Sequence Variants. G3 (Bethesda) 6, 205–207 (2015). [DOI] [PMC free article] [PubMed] [Google Scholar]
- 77.COVID-19 Host Genetics Initiative, The COVID-19 Host Genetics Initiative, a global initiative to elucidate the role of host genetic factors in susceptibility and severity of the SARS-CoV-2 virus pandemic. Eur J Hum Genet 28, 715–718 (2020). [DOI] [PMC free article] [PubMed] [Google Scholar]
- 78.Purcell S et al. , PLINK: a tool set for whole-genome association and population-based linkage analyses. American journal of human genetics 81, 559–575 (2007). [DOI] [PMC free article] [PubMed] [Google Scholar]
- 79.Lambert JC et al. , Meta-analysis of 74,046 individuals identifies 11 new susceptibility loci for Alzheimer’s disease. Nature genetics 45, 1452–1458 (2013). [DOI] [PMC free article] [PubMed] [Google Scholar]
- 80.Liu JZ et al. , Association analyses identify 38 susceptibility loci for inflammatory bowel disease and highlight shared genetic risk across populations. Nature genetics 47, 979–986 (2015). [DOI] [PMC free article] [PubMed] [Google Scholar]
- 81.Paternoster L et al. , Multi-ancestry genome-wide association study of 21,000 cases and 95,000 controls identifies new risk loci for atopic dermatitis. Nature genetics 47, 1449–1456 (2015). [DOI] [PMC free article] [PubMed] [Google Scholar]
- 82.Bycroft C et al. , The UK Biobank resource with deep phenotyping and genomic data. Nature 562, 203–209 (2018). [DOI] [PMC free article] [PubMed] [Google Scholar]
- 83.Giambartolomei C et al. , Bayesian test for colocalisation between pairs of genetic association studies using summary statistics. PLoS Genet 10, e1004383 (2014). [DOI] [PMC free article] [PubMed] [Google Scholar]
- 84.Wallace C, Eliciting priors and relaxing the single causal variant assumption in colocalisation analyses. PLoS Genet 16, e1008720 (2020). [DOI] [PMC free article] [PubMed] [Google Scholar]
- 85.Kilpinen H et al. , Common genetic variation drives molecular heterogeneity in human iPSCs. Nature 546, 370–375 (2017). [DOI] [PMC free article] [PubMed] [Google Scholar]
- 86.Huang QQ et al. , Neonatal genetics of gene expression reveal potential origins of autoimmune and allergic disease risk. Nat Commun 11, 3761 (2020). [DOI] [PMC free article] [PubMed] [Google Scholar]
- 87.Jerber J et al. , Population-scale single-cell RNA-seq profiling across dopaminergic neuron differentiation. Nature genetics 53, 304–312 (2021). [DOI] [PMC free article] [PubMed] [Google Scholar]
- 88.Sun BB et al. , Genomic atlas of the human plasma proteome. Nature 558, 73–79 (2018). [DOI] [PMC free article] [PubMed] [Google Scholar]
- 89.Barbeira AN et al. , Exploring the phenotypic consequences of tissue specific gene expression variation inferred from GWAS summary statistics. Nat Commun 9, 1825 (2018). [DOI] [PMC free article] [PubMed] [Google Scholar]
- 90.Zhou D et al. , A unified framework for joint-tissue transcriptome-wide association and Mendelian randomization analysis. Nature genetics 52, 1239–1246 (2020). [DOI] [PMC free article] [PubMed] [Google Scholar]
- 91.Barbeira AN et al. , Integrating predicted transcriptome from multiple tissues improves association detection. PLoS Genet 15, e1007889 (2019). [DOI] [PMC free article] [PubMed] [Google Scholar]
- 92.Schmiedel BJ et al. , 17q21 asthma-risk variants switch CTCF binding and regulate IL-2 production by T cells. Nat Commun 7, 13426 (2016). [DOI] [PMC free article] [PubMed] [Google Scholar]
- 93.Kamburov A et al. , ConsensusPathDB: toward a more complete picture of cell biology. Nucleic acids research 39, D712–717 (2011). [DOI] [PMC free article] [PubMed] [Google Scholar]
- 94.Huang da W, Sherman BT, Lempicki RA, Systematic and integrative analysis of large gene lists using DAVID bioinformatics resources. Nature protocols 4, 44–57 (2009). [DOI] [PubMed] [Google Scholar]
- 95.Huang da W, Sherman BT, Lempicki RA, Bioinformatics enrichment tools: paths toward the comprehensive functional analysis of large gene lists. Nucleic acids research 37, 1–13 (2009). [DOI] [PMC free article] [PubMed] [Google Scholar]
- 96.Kong A et al. , Fine-scale recombination rate differences between sexes, populations and individuals. Nature 467, 1099–1103 (2010). [DOI] [PubMed] [Google Scholar]
- 97.Liu B, Gloudemans MJ, Rao AS, Ingelsson E, Montgomery SB, Abundant associations with gene expression complicate GWAS follow-up. Nat Genet 51, 768–769 (2019). [DOI] [PMC free article] [PubMed] [Google Scholar]
Associated Data
This section collects any data citations, data availability statements, or supplementary materials included in this article.
Supplementary Materials
Data Availability Statement
The DICE project provides anonymized data for public access at http://dice-database.org. Individual-specific single-cell sequencing and genotype data is available through the database of Genotypes and Phenotypes (dbGaP Accession number: phs001703.v4.p1). The code used for colocalization analysis, TWAS analysis and GWAS overlap analysis is available on Github at https://github.com/vijaybioinfo. The code used for HiChIP data analysis is available on GitHub at https://github.com/ay-lab. All data needed to evaluate the conclusions in the paper are present in the paper, in the Supplementary Materials (including the supplementary Excel spreadsheets designated Tables S1–S10), or at the designated online resources. Requests for reagents may be directed to the corresponding author/lead contact, Pandurangan Vijayanand (vijay@lji.org).