

Abstract
Monocarboxylate transporter 6 (MCT6; SLC16A5) is an orphan transporter protein with expression in multiple tissues. The endogenous function of MCT6 related to human health and disease remains unknown. Our previous transcriptomic and proteomic analyses in Mct6 knockout (KO) mice suggested that MCT6 may play a role in lipid and glucose homeostasis, but additional evidence is required. Thus, the objective of this study was to further explore the impact of MCT6 on metabolic function using untargeted metabolomic analysis in Mct6 KO mice. The plasma from male and female mice and livers from male mice were submitted for global metabolomics analysis to assess the relative changes in endogenous small molecules across the liver and systemic circulation associated with absence of Mct6. More than 782 compounds were detected with 101 and 51 metabolites significantly changed in plasma of male and female mice, respectively, and 100 metabolites significantly changed in the livers of male mice (p < .05). Significant perturbations in lipid metabolism were annotated in the plasma and liver metabolome, with additional alterations in the amino acid metabolism pathway in plasma samples from male and female mice. Elevated lipid diacylglycerol and altered fatty acid metabolite concentrations were found in liver and plasma samples of male Mct6 KO mice. Significant reduction of N‐terminal acetylated amino acids was found in plasma samples of male and female Mct6 KO mice. In summary, the present study confirmed the significant role of MCT6 in lipid and amino acid homeostasis, suggesting its contribution in metabolic diseases.
Keywords: amino acid homeostasis, lipid metabolism, MCT6, metabolomics, PPAR‐alpha, SLC16A5
Abbreviations
- CoA
coenzyme A
- HFD
high fat diets
- IPA
ingenuity pathway analysis
- KO
knockout
- LC
liquid chromatography
- MCT
monocarboxylate transporter
- MS
mass spectrometry
- NAT
N‐terminal acetyltransferase
- PC
phosphatidylcholines
- PE
phosphatidylethanolamines
- PGF2α
prostaglandin F2α
- Pparα
peroxisome proliferator‐activated receptor α
- WT
wildtype
Significance Statement.
The present study examines the physiological role of the Monocarboxylate transporter 6 (MCT6), which is an orphan transporter with limited information on its endogenous function. Using untargeted metabolomic analysis, the study provides evidence to support the endogenous function of MCT6 in lipid and amino acid homeostasis, supporting the design of in‐vitro/in‐vivo studies to confirm substrate specificity. The present finding also indicated the utility of MCT6 as a potential target and prognostic factor for metabolic disorders.
1. INTRODUCTION
Monocarboxylate transporters (MCTs) are members of the solute carrier 16 (SLC16) family composed of 14 isoforms. 1 MCTs 1–4 have been extensively characterized as proton‐dependent transporters and are essential for transporting monocarboxylate anions such as lactate and pyruvate, while other MCT isoforms are less well characterized. 2 One of these, monocarboxylate transporter 6 (MCT6; SLC16A5) is classified as an orphan transporter protein with limited information on its endogenous function related to human health and disease. 2 Gene expression data from our laboratory and other research groups show that MCT6 expressed in liver, intestine, and kidney. 3 , 4 , 5 Additional evidence suggests that its expression may be influenced by different dietary states in rodents, including upregulation in fasted mice 3 , 6 and in mice fed fenofibrate‐supplemented diets, 7 whereas reduced intestinal expression was observed in rats fed high fat diets (HFD) and in diabetic rats. 8 The cellular localization of MCT6 remains controversial and further investigation is necessary. MCT6 was suggested to be basolaterally localized in the human intestine by Gill et al. (note that MCT6 was presented as “MCT5” in the study due to previous differences in isoform nomenclature), 9 while Kohyama et al. observed its localization at the apical membrane of human villus epithelial cells. 10 The substrate specificity of MCT6 is distinct from other MCTs 1–4, as it does not transport lactate, but evidence suggests bumetanide, probenecid, nateglinide, and prostaglandin F2α (PGF2α) are substrates. 3 , 11 MCT6‐mediated transport can be inhibited by a wide range of drugs, including four loop diuretics: furosemide, piretanide, azosemide, and torasemide, and a series of dietary aglycone flavonoids. 11 , 12
MCT6 is suggested to play a role in lipid and glucose homeostasis based on our previous transcriptomic and proteomic analyses in Mct6 knockout (KO) mice. 13 Mct6 KO mice demonstrated increased plasma triglyceride concentrations and significant alterations in liver proteins related to cellular lipid metabolism, mitochondrion organization, and fatty acid metabolism; these findings are supported by the results of Zhang et al. suggesting the involvement of MCT6 in lipid metabolism. 6 , 13 Liver transcriptomic data further indicated peroxisome proliferator‐activated receptor α (Pparα) as the key regulator in hepatic lipid homeostasis with its decreased expression in Mct6 KO mice. 13 Additionally, changes in transporter proteins and metabolic enzymes were found via proteomics in Mct6 KO mice, including decreased organic anion transporting polypeptide 3a1 (Oatp3a1) in kidney, decreased Oatp2b1, cytochrome P450 4a10 (Cyp4a10), Cyp2c54, and sulfate anion transporter 1 (Sat1) in liver, and decreased proton‐coupled amino acid transporter 4 (Pat4) in colon. 13 Altered transporter and enzyme expression may further influence the fate of a wide range of endogenous compounds and xenobiotics. To further explore the metabolic function influenced by MCT6, untargeted, global metabolomic analysis has been employed in the present study to assess the relative changes in endogenous small molecules across the liver and systemic circulation. By comparing the metabolomic profiles in plasma and liver of Mct6 KO and wildtype (WT) mice, the potential endogenous function(s) and substrates of MCT6 were proposed. The gender differences for MCT6 were further assessed by comparing the plasma metabolomic profiles in male and female Mct6 KO mice.
2. MATERIALS AND METHODS
2.1. Animals and sample collection
Mct6 KO mice were generated using the CRISPR/Cas9 system with C57BL/6NCr mice and bred as described previously. 13 In brief, the Cas9 mRNA and guide RNAs targeting exon 2 in murine Slc16a5 were injected into the cytoplasm of fertilized C57BL/6NCr embryos followed by implanting the embryos bilaterally into the oviducts of CD‐1 pseudo‐pregnant females. Pups from CD‐1 females were genotyped to identify the founder mice. These founder mice with mutations were backcrossed three to four generations to wild‐type (WT) C57BL/6NCr mice (Charles River, Wilmington, MA, USA). The subsequent generations were genotyped, from which the Mct6 KO mice and aged‐matched WT littermates were identified and used in the study. Male and female Mct6 KO and WT mice were used in the study with 6 mice per group. All mice were housed under 12 h light/12 h dark cycle and were given ad libitum access to food and water. The experiments were conducted in accordance with the rules and recommendations of the Institutional Animal Care and Use Committee (IACUC), State University of New York at Buffalo (PROTO201800153, Approved: 18/01/2017).
Blood samples were collected via submandibular venous puncture from male and female Mct6 KO and WT mice (7–10 weeks). Plasma was isolated by centrifuging at 2000 g for 10 min at 4°C in heparinized tubes. To better integrate our previous proteomic and transcriptomic studies that have been done in the liver of male mice, 13 livers from male Mct6 KO and WT mice were extracted and snap frozen in liquid nitrogen prior to analysis. Liver tissue and plasma samples from both groups of mice were collected in the morning simultaneously under matched conditions. All samples were immediately stored at −80°C until shipped on dry ice for further metabolomic analysis.
2.2. Metabolomics measurements
Sample treatments and metabolomics measurements were performed by Metabolon according to their standardized protocols (Metabolon Inc.). All samples were prepared by protein precipitation with methanol followed by centrifugation. The resulting extracts were aliquoted into 5 fractions with 4 aliquots for 4 different detection methods and 1 sample for backup. The organic solvents were removed by TurboVap® (Zymark) and samples were reconstituted in solvents compatible for each of 4 methods. All methods utilized a Waters ACQUITY ultra‐performance liquid chromatograph (UPLC) and a Thermo Scientific Q‐Exactive high resolution/accurate mass spectrometer interfaced with a heated electrospray ionization source and Orbitrap mass analyzer operated at 35 000 mass resolution. One aliquot was analyzed by a method optimized for more hydrophilic compounds under acidic positive ion conditions following elution from a C18 column (Waters UPLC BEH C18‐2.1 × 100 mm, 1.7 µm) with gradient consisting of water and methanol, with 0.05% perfluoropentanoic acid (PFPA) and 0.1% formic acid (FA). Another aliquot was also analyzed under acidic positive ion conditions but optimized for more hydrophobic compounds using the same C18 column and was operated at an overall higher organic content using methanol, acetonitrile, water, 0.05% PFPA and 0.01% FA. The third aliquot was analyzed under basic negative ion optimized conditions using a mobile phase of methanol and water with 6.5 mM ammonium bicarbonate at pH 8. The fourth aliquot was analyzed under negative ionization conditions using a HILIC column (Waters UPLC BEH Amide 2.1 × 150 mm, 1.7 µm) with a gradient consisting of water and acetonitrile containing 10 mM ammonium formate at pH 10.8. The MS analysis alternated between full‐scan MS and data‐dependent MSn scans with the scan range generally covering 70–1000 m/z. Several types of control were also analyzed in concert with the experimental samples, including a cocktail of internal quality control (QC) standards (compounds listed in Table S1) that were spiked into every analyzed sample for monitoring instrument variability; pooled matrix samples created by taking a small volume of each experimental sample served as a technical replicate throughout the data set for determining overall process variability; and extracted water samples served as process blanks. The overall process variability was determined by calculating the RSD for all endogenous metabolites presented in pooled matrix samples, with mean and range of RSD of 8.3% (3.4%–10%) for plasma samples and 9.7% (3.6%–12.5%) for liver samples.
The detected compounds were identified by comparing the retention index, accurate mass, and the MS/MS forward and reverse scores between the experimental data and reference library based on over 3300 authentic standards. Peaks were quantified using area‐under‐the curve. The QC and curation processes were carried out to ensure accurate and consistent metabolite identification and to remove system artifacts, misassignments and background noise. These including using proprietary visualization and interpretation software to confirm the consistency of peak identification among the various samples and checking library matches for each compound from each sample.
2.3. Statistical and canonical pathway analysis
Statistical analyses were performed on log‐transformed data. The missing values were imputed to the minimum value for each metabolite. Welch's two‐sample t‐test was used to test the difference between Mct6 KO and WT mice. The tests were conducted for plasma samples from male and female mice and liver samples from male mice. Adjusted p‐value (p adj‐value) were further calculated using the Benjamini‐Hochberg false discovery rate method. The metabolite was considered significantly changed if p < .05 with fewer than 6 nonmissing values. The omu R package was utilized for metabolomics data analysis. 14 The canonical pathway analysis and network interaction were further performed using Ingenuity Pathway Analysis [(IPA); QIAGEN, Redwood City, CA, https://www.qiagenbioinformatics.com/ipa]. For pathway analysis, a right‐tailed Fisher's exact test was used to calculate the p‐value to determine the probability that the overlap between the altered metabolites from each sample and the canonical pathway is explained by chance alone. Adjusted p‐values were further calculated using the Benjamini‐Hochberg method.
2.4. Nomenclature of targets and ligands
Key protein targets and ligands in this article are hyperlinked to corresponding entries in http://www.guidetopharmacology.org, the common portal for data from the IUPHAR/BPS Guide to PHARMACOLOGY, 15 and are permanently archived in the Concise Guide to PHARMACOLOGY 2021/22. 16 , 17 , 18 , 19
3. RESULTS
3.1. Overview of metabolomic data in Mct6 KO mice
To determine the endogenous role of MCT6, mass spectrometry‐based untargeted metabolomics was conducted in Mct6 (Slc16a5) KO and WT mice. A total of 782 and 795 compounds were detected in the plasma and liver of male mice, and 784 compounds in the plasma of female mice. Following the Welch's two‐sample t‐test analysis, 101 and 100 metabolites were significantly changed (p < .05) in plasma and liver of male mice, and 51 metabolites were significantly changed in plasma of female mice. The altered metabolites were classified with the number of compounds in each super pathway shown in Figures 1A,C,E. In male plasma, the majority of altered metabolites were from the lipid pathway, with 46 metabolites increased and 3 metabolites decreased. The amino acid pathway had the second largest number of changed metabolites, among which 13 were significantly increased and 20 were decreased. Similar to plasma, lipid and amino acid pathways were the most significant super pathways altered in male liver samples, with the majority of them decreased (53 lipids and 11 amino acids decreased; 20 lipids and 3 amino acids increased). Unlike samples from male mice, the largest alterations were seen in the amino acid pathway for female mouse plasma from Mct6 KO mice, with 27 decreased and 2 increased metabolites. For lipids, there were only 5 increased and 7 decreased in plasma samples from female KO mice. Thus, gender differences between the plasma metabolomic profiles after Mct6 KO were observed. Volcano plots (Figures 1B,D,F) also demonstrated that metabolites from the lipid and amino acid super pathways represented the majority of significant changes (above the dotted line, p < .05) in all samples.
FIGURE 1.
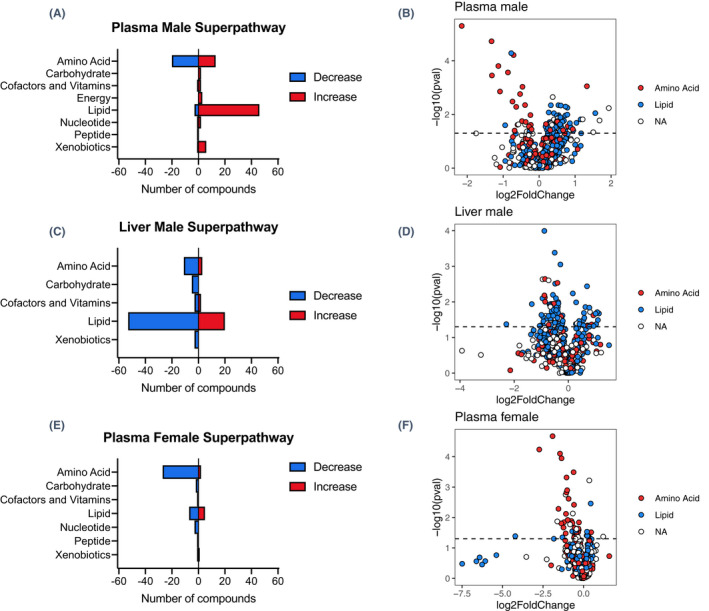
Number of metabolites significantly altered in super pathways in plasma (A) and liver (C) from male Mct6 KO mice and plasma from female Mct6 KO mice (E) compared to their respective control mice. Volcano plots with lipids in blue and amino acids in red from samples of male plasma (B), male liver (D) and female plasma (F) (dotted line represents p = .05, NA, metaolites that are not lipid or amino acid)
3.2. Major metabolites changed in plasma and liver samples of Mct6 KO mice
The top 20 metabolites significantly changed in male plasma and liver, and female plasma samples are summarized in Tables 1, 2, and 3, respectively. Lipid metabolites accounted for the majority of metabolites (in magnitude) that increased in male plasma and both increased and decreased in male liver. Of these metabolites, several diacylglycerols with C16 and C18 fatty acid structures were increased while pimeloylcarnitine was the only lipid that decreased in both liver and plasma samples. Most of the markedly decreased metabolites in male and female plasma were amino acids, among which 1‐carboxyethyltyrosine, N‐acetylmethionine, N‐acetyltyrosine, 1‐carboxyethylphenylalanine, N‐acetyltryptophan, N‐acetylphenylalanine, 1‐carboxyethylleucine, N‐acetylkynurenine, and N‐acetylleucine were decreased in both male and female Mct6 KO mice. In addition to lipids and amino acids, xylose from the carbohydrate super pathway was the second most increased metabolite in male plasma (3.20‐fold, p = 1.67E‐02, p adj = 3.11E‐01) but was decreased in female plasma (0.32‐fold, p = 1.34E‐02, p adj = 4.88E‐01). Since xylose is an indicator of intestinal absorption used clinically, the difference in xylose may suggest different intestinal absorption in male and female Mct6 KO mice. 20 Heme was the top metabolite increased in plasma of male Mct6 KO mice (3.83‐fold, p = 5.80E‐03, p adj = 2.16E‐01), which in high concentration can be cytotoxic via the formation of reactive oxygen species and intercalation with cell membranes, resulting in lipid and protein peroxidation. 21 The most decreased metabolite in plasma of female Mct6 KO mice was cholate (0.054‐fold, p = 4.10E‐02, p adj = 6.84E‐01), which is a primary bile acid metabolite from cholesterol catabolism and an important signaling molecule for lipid, glucose and energy metabolism. 22 However, cholate may be associated with a high false positive rate based on its adjusted p‐value, which warrants further validation. Thus, although there were differences in metabolomic profiles between female and male mice after Mct6 KO, altered lipid metabolism was associated with the observed changes in all samples in this analysis.
TABLE 1.
Top 20 significantly increased or decreased metabolites in plasma of male Mct6 KO mice compared to WT mice
| Rank | Metabolite | Super pathway | Subpathway | Ratio (KO/WT) | p‐value | p adj‐value b |
|---|---|---|---|---|---|---|
| Increased | ||||||
| 1 | heme | Cofactors and Vitamins | Hemoglobin and Porphyrin Metabolism | 3.83 | 5.80E−03 | 2.16E−01 |
| 2 | xylose | Carbohydrate | Pentose Metabolism | 3.20 | 1.67E−02 | 3.11E−01 |
| 3 | diacylglycerol (14:0/18:1, 16:0/16:1) [1] a | Lipid | Diacylglycerol | 2.95 | 8.98E−03 | 2.94E−01 |
| 4 | 2,3‐diphosphoglycerate | Carbohydrate | Glycolysis, Gluconeogenesis, and Pyruvate Metabolism | 2.84 | 4.60E−02 | 3.62E−01 |
| 5 | N‐methylproline | Amino Acid | Urea cycle; Arginine and Proline Metabolism | 2.51 | 8.90E−04 | 8.12E−02 |
| 6 | quinolinate | Cofactors and Vitamins | Nicotinate and Nicotinamide Metabolism | 2.31 | 1.53E−02 | 3.11E−01 |
| 7 | 1‐palmitoleoylglycerol (16:1) a | Lipid | Monoacylglycerol | 2.23 | 1.53E−02 | 3.11E−01 |
| 8 | N‐erucoyl‐sphingosine (d18:1/22:1) a | Lipid | Ceramides | 2.05 | 2.06E−02 | 3.11E−01 |
| 9 | 2‐palmitoleoyl‐GPC (16:1) a | Lipid | Lysophospholipid | 1.93 | 3.97E−02 | 3.58E−01 |
| 10 | N,N‐dimethylvaline | Amino Acid | Leucine, Isoleucine and Valine Metabolism | 1.91 | 3.54E−02 | 3.42E−01 |
| 11 | hexadecenedioate (C16:1‐DC) a | Lipid | Fatty Acid, Dicarboxylate | 1.85 | 3.06E−02 | 3.24E−01 |
| 12 | palmitoleate (16:1n7) | Lipid | Long Chain Monounsaturated Fatty Acid | 1.81 | 2.13E−02 | 3.11E−01 |
| 13 | 2‐amino‐p‐cresol sulfate | Xenobiotics | Benzoate Metabolism | 1.76 | 4.34E−02 | 3.61E−01 |
| 14 | 1‐methyl‐5‐imidazoleacetate | Amino Acid | Histidine Metabolism | 1.74 | 2.75E−02 | 3.11E−01 |
| 15 | 3‐hydroxystearate | Lipid | Fatty Acid, Monohydroxy | 1.72 | 5.62E−03 | 2.16E−01 |
| 16 | 1‐palmitoyl‐2‐palmitoleoyl‐GPC (16:0/16:1) a | Lipid | Phosphatidylcholine (PC) | 1.72 | 1.02E−02 | 2.95E−01 |
| 17 | palmitoleoyl‐linoleoyl‐glycerol (16:1/18:2) [1] a | Lipid | Diacylglycerol | 1.66 | 5.09E−03 | 2.15E−01 |
| 18 | glycosyl‐N‐erucoyl‐sphingosine (d18:1/22:1) a | Lipid | Hexosylceramides (HCER) | 1.66 | 4.26E−02 | 3.61E−01 |
| 19 | 1‐heptadecenoylglycerol (17:1) a | Lipid | Monoacylglycerol | 1.66 | 1.09E−02 | 2.95E−01 |
| 20 | palmitoyl‐oleoyl‐glycerol (16:0/18:1) [1] a | Lipid | Diacylglycerol | 1.61 | 1.73E−02 | 3.11E−01 |
| Decreased | ||||||
| 1 | 1‐carboxyethyltyrosine | Amino Acid | Tyrosine Metabolism | 0.22 | 5.04E−06 | 3.94E−03 |
| 2 | N‐acetylmethionine | Amino Acid | Methionine, Cysteine, SAM and Taurine Metabolism | 0.40 | 1.88E−05 | 7.35E−03 |
| 3 | N‐acetyltyrosine | Amino Acid | Tyrosine Metabolism | 0.40 | 3.54E−04 | 3.95E−02 |
| 4 | N2,N6‐diacetyllysine | Amino Acid | Lysine Metabolism | 0.46 | 1.57E−04 | 2.46E−02 |
| 5 | 1‐carboxyethylphenylalanine | Amino Acid | Phenylalanine Metabolism | 0.47 | 1.40E−03 | 1.09E−01 |
| 6 | pimeloylcarnitine/3‐methyladipoylcarnitine (C7‐DC) | Lipid | Fatty Acid Metabolism (Acyl Carnitine, Dicarboxylate) | 0.52 | 2.53E−02 | 3.11E−01 |
| 7 | N‐acetyltryptophan | Amino Acid | Tryptophan Metabolism | 0.55 | 2.72E−04 | 3.55E−02 |
| 8 | palmitoleoyl‐arachidonoyl‐glycerol (16:1/20:4) [2] a | Lipid | Diacylglycerol | 0.58 | 5.22E−05 | 1.20E−02 |
| 9 | (N(1) + N(8))‐acetylspermidine | Amino Acid | Polyamine Metabolism | 0.60 | 3.31E−03 | 1.99E−01 |
| 10 | N‐acetylphenylalanine | Amino Acid | Phenylalanine Metabolism | 0.61 | 6.13E−05 | 1.20E−02 |
| 11 | N,N,N‐trimethyl‐5‐aminovalerate | Amino Acid | Lysine Metabolism | 0.62 | 3.98E−02 | 3.58E−01 |
| 12 | N‐formylmethionine | Amino Acid | Methionine, Cysteine, SAM and Taurine Metabolism | 0.64 | 5.23E−03 | 2.15E−01 |
| 13 | 1‐carboxyethylleucine | Amino Acid | Leucine, Isoleucine and Valine Metabolism | 0.66 | 2.43E−02 | 3.11E−01 |
| 14 | phenylacetylglycine | Peptide | Acetylated Peptides | 0.67 | 2.34E−02 | 3.11E−01 |
| 15 | N‐acetylkynurenine | Amino Acid | Tryptophan Metabolism | 0.69 | 1.74E−03 | 1.24E−01 |
| 16 | N‐acetylleucine | Amino Acid | Leucine, Isoleucine and Valine Metabolism | 0.72 | 1.77E−02 | 3.11E−01 |
| 17 | N‐acetylalanine | Amino Acid | Alanine and Aspartate Metabolism | 0.73 | 9.35E−04 | 8.12E−02 |
| 18 | N6‐methyllysine | Amino Acid | Lysine Metabolism | 0.76 | 4.48E−03 | 2.15E−01 |
| 19 | methyl glucopyranoside (alpha + beta) | Xenobiotics | Food Component/Plant | 0.76 | 2.38E−02 | 3.11E−01 |
| 20 | N‐acetylputrescine | Amino Acid | Polyamine Metabolism | 0.77 | 1.91E−02 | 3.11E−01 |
No available standard for the metabolite; [1] [2] indicates isomers with 2 distinct peaks.
p adj‐value were adjusted p‐value using the Benjamini‐Hochberg false discovery rate method.
TABLE 2.
Top 20 significantly increased or decreased metabolites in liver of male Mct6 KO mice compared to WT mice
| Rank | Metabolite | Super pathway | Subpathway | Ratio (KO/WT) | p‐value | p adj‐value b |
|---|---|---|---|---|---|---|
| Increased | ||||||
| 1 | hexanoylglycine | Lipid | Fatty Acid Metabolism (Acyl Glycine) | 2.19 | 2.12E‐02 | 3.80E‐01 |
| 2 | diacylglycerol (14:0/18:1, 16:0/16:1) [1] a | Lipid | Diacylglycerol | 2.13 | 3.23E‐02 | 3.80E‐01 |
| 3 | N‐octanoylglycine | Lipid | Fatty Acid Metabolism (Acyl Glycine) | 2.10 | 1.95E‐02 | 3.80E‐01 |
| 4 | diacylglycerol (14:0/18:1, 16:0/16:1) [2] a | Lipid | Diacylglycerol | 2.04 | 4.25E‐02 | 3.80E‐01 |
| 5 | sphingomyelin (d18:2/21:0, d16:2/23:0) a | Lipid | Sphingomyelins | 2.01 | 2.13E‐02 | 3.80E‐01 |
| 6 | palmitoleoyl‐oleoyl‐glycerol (16:1/18:1) [2] a | Lipid | Diacylglycerol | 1.91 | 4.77E‐02 | 3.80E‐01 |
| 7 | guanidinosuccinate | Amino Acid | Guanidino and Acetamido Metabolism | 1.90 | 2.38E‐02 | 3.80E‐01 |
| 8 | N‐methylproline | Amino Acid | Urea cycle; Arginine and Proline Metabolism | 1.82 | 4.30E‐02 | 3.80E‐01 |
| 9 | gamma‐tocopherol/beta‐tocopherol | Cofactors and Vitamins | Tocopherol Metabolism | 1.74 | 1.92E‐02 | 3.80E‐01 |
| 10 | palmitoyl‐oleoyl‐glycerol (16:0/18:1) [1] a | Lipid | Diacylglycerol | 1.72 | 1.45E‐02 | 3.80E‐01 |
| 11 | palmitoyl‐palmitoyl‐glycerol (16:0/16:0) [1] a | Lipid | Diacylglycerol | 1.72 | 4.98E‐02 | 3.92E‐01 |
| 12 | 2‐hydroxy‐3‐methylvalerate | Amino Acid | Leucine, Isoleucine and Valine Metabolism | 1.65 | 4.78E‐02 | 3.80E‐01 |
| 13 | 1‐palmitoyl‐2‐oleoyl‐glycosyl‐GPE (16:0/18:1) a | Lipid | Glycosyl PE | 1.64 | 4.56E‐02 | 3.80E‐01 |
| 14 | palmitoyl‐linolenoyl‐glycerol (16:0/18:3) [2] a | Lipid | Diacylglycerol | 1.62 | 3.65E‐03 | 3.22E‐01 |
| 15 | oleoyl‐linolenoyl‐glycerol (18:1/18:3) [2] a | Lipid | Diacylglycerol | 1.55 | 1.39E‐02 | 3.80E‐01 |
| 16 | palmitoleoyl‐linoleoyl‐glycerol (16:1/18:2) [1] a | Lipid | Diacylglycerol | 1.51 | 2.81E‐02 | 3.80E‐01 |
| 17 | diacylglycerol (16:1/18:2 [2], 16:0/18:3 [1]) a | Lipid | Diacylglycerol | 1.49 | 2.05E‐02 | 3.80E‐01 |
| 18 | palmitoyl‐oleoyl‐glycerol (16:0/18:1) [2] a | Lipid | Diacylglycerol | 1.48 | 4.60E‐02 | 3.80E‐01 |
| 19 | 4‐methylhexanoylglycine | Lipid | Fatty Acid Metabolism (Acyl Glycine) | 1.47 | 3.25E‐02 | 3.80E‐01 |
| 20 | palmitoyl‐docosahexaenoyl‐glycerol (16:0/22:6) [2] a | Lipid | Diacylglycerol | 1.33 | 4.19E‐02 | 3.80E‐01 |
| Decreased | ||||||
| 1 | 3‐hydroxypalmitoylcarnitine | Lipid | Fatty Acid Metabolism (Acyl Carnitine, Hydroxy) | 0.20 | 4.23E‐02 | 3.80E‐01 |
| 2 | pimeloylcarnitine/3‐methyladipoylcarnitine (C7‐DC) | Lipid | Fatty Acid Metabolism (Acyl Carnitine, Dicarboxylate) | 0.39 | 1.15E‐02 | 3.80E‐01 |
| 3 | stearoylcarnitine (C18) | Lipid | Fatty Acid Metabolism (Acyl Carnitine, Long Chain Saturated) | 0.48 | 4.72E‐02 | 3.80E‐01 |
| 4 | acetylcarnitine (C2) | Lipid | Fatty Acid Metabolism (Acyl Carnitine, Short Chain) | 0.49 | 4.61E‐02 | 3.80E‐01 |
| 5 | N‐stearoyl‐sphingosine (d18:1/18:0) a | Lipid | Ceramides | 0.50 | 2.32E‐02 | 3.80E‐01 |
| 6 | ceramide (d18:1/17:0, d17:1/18:0) a | Lipid | Ceramides | 0.52 | 7.96E‐03 | 3.80E‐01 |
| 7 | 1‐methylnicotinamide | Cofactors and Vitamins | Nicotinate and Nicotinamide Metabolism | 0.52 | 2.32E‐03 | 3.07E‐01 |
| 8 | N‐(2‐hydroxypalmitoyl)‐sphingosine (d18:1/16:0(2OH)) | Lipid | Ceramides | 0.52 | 2.61E‐02 | 3.80E‐01 |
| 9 | hydroxypalmitoyl sphingomyelin (d18:1/16:0(OH)) a | Lipid | Sphingomyelins | 0.53 | 3.51E‐02 | 3.80E‐01 |
| 10 | 1‐linolenoylglycerol (18:3) | Lipid | Monoacylglycerol | 0.54 | 4.04E‐02 | 3.80E‐01 |
| 11 | linoleoylcarnitine (C18:2) a | Lipid | Fatty Acid Metabolism (Acyl Carnitine, Polyunsaturated) | 0.54 | 1.02E‐04 | 8.08E‐02 |
| 12 | N‐acetylaspartate (NAA) | Amino Acid | Alanine and Aspartate Metabolism | 0.54 | 6.58E‐03 | 3.80E‐01 |
| 13 | beta‐hydroxyisovalerate | Amino Acid | Leucine, Isoleucine and Valine Metabolism | 0.55 | 7.51E‐03 | 3.80E‐01 |
| 14 | N,N,N‐trimethyl‐5‐aminovalerate | Amino Acid | Lysine Metabolism | 0.55 | 2.28E‐03 | 3.07E‐01 |
| 15 | guanidinoacetate | Amino Acid | Creatine Metabolism | 0.55 | 9.92E‐03 | 3.80E‐01 |
| 16 | galactonate | Carbohydrate | Fructose, Mannose and Galactose Metabolism | 0.56 | 2.46E‐02 | 3.80E‐01 |
| 17 | 3‐hydroxypalmitate | Lipid | Fatty Acid, Monohydroxy | 0.57 | 3.16E‐02 | 3.80E‐01 |
| 18 | 3‐hydroxyoleate a | Lipid | Fatty Acid, Monohydroxy | 0.57 | 3.47E‐02 | 3.80E‐01 |
| 19 | tartronate (hydroxymalonate) | Xenobiotics | Food Component/Plant | 0.59 | 4.02E‐02 | 3.80E‐01 |
| 20 | N‐palmitoyl‐sphinganine (d18:0/16:0) | Lipid | Dihydroceramides | 0.60 | 2.46E‐02 | 3.80E‐01 |
No available standard for the metabolite; [1] [2] indicates isomers with 2 distinct peaks.
p adj‐value were adjusted p‐value using the Benjamini‐Hochberg false discovery rate method.
TABLE 3.
Significantly increased and top 20 significantly decreased metabolites in plasma of female Mct6 KO mice compared to WT mice
| Rank | Metabolite | Super pathway | Subpathway | Ratio (KO/WT) | p‐value | padj ‐value b |
|---|---|---|---|---|---|---|
| Increased | ||||||
| 1 | dihydrocaffeate sulfate | Xenobiotics | Food Component/Plant | 2.32 | 4.25E‐02 | 6.84E‐01 |
| 2 | N,N,N‐trimethyl‐5‐aminovalerate | Amino Acid | Lysine Metabolism | 1.39 | 3.05E‐02 | 6.37E‐01 |
| 3 | 2‐aminooctanoate | Lipid | Fatty Acid, Amino | 1.36 | 3.47E‐03 | 2.09E‐01 |
| 4 | glucuronide of C14H22O4 a | Partially Characterized Molecules | Partially Characterized Molecules | 1.28 | 6.05E‐04 | 5.93E‐02 |
| 5 | 1‐arachidonoyl‐GPA (20:4) | Lipid | Lysophospholipid | 1.27 | 4.44E‐02 | 6.84E‐01 |
| 6 | 1‐palmitoleoyl‐GPC (16:1) a | Lipid | Lysophospholipid | 1.21 | 3.92E‐02 | 6.84E‐01 |
| 7 | sphingomyelin (d18:1/22:2, d18:2/22:1, d16:1/24:2) a | Lipid | Sphingomyelins | 1.17 | 4.01E‐02 | 6.84E‐01 |
| 8 | tetradecanedioate (C14‐DC) | Lipid | Fatty Acid, Dicarboxylate | 1.16 | 2.93E‐02 | 6.37E‐01 |
| 9 | 3‐methylhistidine | Amino Acid | Histidine Metabolism | 1.14 | 3.93E‐02 | 6.84E‐01 |
| Decreased | ||||||
| 1 | cholate | Lipid | Primary Bile Acid Metabolism | 0.05 | 4.10E‐02 | 6.84E‐01 |
| 2 | 1‐carboxyethyltyrosine | Amino Acid | Tyrosine Metabolism | 0.15 | 5.81E‐05 | 1.52E‐02 |
| 3 | N‐acetylmethionine | Amino Acid | Methionine, Cysteine, SAM and Taurine Metabolism | 0.27 | 2.12E‐05 | 8.32E‐03 |
| 4 | xylose | Carbohydrate | Pentose Metabolism | 0.32 | 1.34E‐02 | 4.88E‐01 |
| 5 | 1‐carboxyethylphenylalanine | Amino Acid | Phenylalanine Metabolism | 0.34 | 5.19E‐03 | 2.71E‐01 |
| 6 | N‐acetyltyrosine | Amino Acid | Tyrosine Metabolism | 0.36 | 7.93E‐05 | 1.55E‐02 |
| 7 | 1‐carboxyethylleucine | Amino Acid | Leucine, Isoleucine and Valine Metabolism | 0.39 | 1.56E‐02 | 4.88E‐01 |
| 8 | N‐acetyltryptophan | Amino Acid | Tryptophan Metabolism | 0.39 | 1.13E‐04 | 1.77E‐02 |
| 9 | hyodeoxycholate | Lipid | Secondary Bile Acid Metabolism | 0.41 | 4.50E‐02 | 6.84E‐01 |
| 10 | ophthalmate | Amino Acid | Glutathione Metabolism | 0.42 | 2.14E‐02 | 6.18E‐01 |
| 11 | 1‐carboxyethylisoleucine | Amino Acid | Leucine, Isoleucine and Valine Metabolism | 0.44 | 1.42E‐02 | 4.88E‐01 |
| 12 | biotin | Cofactors and Vitamins | Biotin Metabolism | 0.46 | 1.77E‐03 | 1.26E‐01 |
| 13 | 1‐carboxyethylvaline | Amino Acid | Leucine, Isoleucine and Valine Metabolism | 0.47 | 3.33E‐02 | 6.67E‐01 |
| 14 | N‐acetylleucine | Amino Acid | Leucine, Isoleucine and Valine Metabolism | 0.47 | 7.57E‐03 | 3.49E‐01 |
| 15 | N‐acetylphenylalanine | Amino Acid | Phenylalanine Metabolism | 0.48 | 1.50E‐03 | 1.18E‐01 |
| 16 | N‐acetylcitrulline | Amino Acid | Urea cycle; Arginine and Proline Metabolism | 0.48 | 4.83E‐04 | 5.41E‐02 |
| 17 | N2,N5‐diacetylornithine | Amino Acid | Urea cycle; Arginine and Proline Metabolism | 0.50 | 1.27E‐03 | 1.10E‐01 |
| 18 | N‐acetylisoleucine | Amino Acid | Leucine, Isoleucine and Valine Metabolism | 0.51 | 1.20E‐02 | 4.88E‐01 |
| 19 | N‐acetylkynurenine | Amino Acid | Tryptophan Metabolism | 0.53 | 2.43E‐03 | 1.58E‐01 |
| 20 | xanthosine | Nucleotide | Purine Metabolism, (Hypo)Xanthine/Inosine containing | 0.56 | 1.69E‐02 | 5.10E‐01 |
No available standard for the metabolite; [1] [2] indicates isomers with 2 distinct peaks.
p adj‐value were adjusted p‐value using the Benjamini‐Hochberg false discovery rate method.
3.3. Metabolomic canonical pathway analysis
The top five canonical pathways in each sample were identified by Ingenuity Knowledge Base in IPA and summarized in Table 4. Ingenuity Target Explorer (https://targetexplorer.ingenuity.com) was used to gather pathway information. Pathways associated with amino acid metabolism, such as glutamate degradation (p = 4.15E‐03) and tyrosine degradation (p = 9.65E‐03) were among the top five pathways identified in plasma in male Mct6 KO mice. In male mouse liver samples, top pathways were mostly involved in lipid metabolism, including ceramide degradation (p = 5.39E‐03), sphingomyelin metabolism (p = 5.39E‐03) and sphingosine and sphingosine‐1‐phosphate metabolism (p = 1.12E‐02). Alterations observed in fatty acid‐derived liver endocannabinoids, with their known anticancer activity, also made endocannabinoid cancer inhibition one of the top pathways in liver (p = 1.41E‐04). 23 In plasma samples from female Mct6 KO mice, the farnesoid X receptor/retinoid X receptor (FXR/RXR) pathway was identified as one of the top canonical pathways (p = 2.18E‐03). Since FXR is a sensor of bile acid levels and a modulator of bile, lipid and glucose homeostasis, the altered FXR/RXR pathway also suggested the crucial role of MCT6 in linking bile acid regulation with lipoprotein, lipid and glucose metabolism.
TABLE 4.
Top five canonical pathways significantly enriched based on metabolomic change between Mct6 KO and WT mice
| Name | p‐value a | p adj‐value b |
|---|---|---|
| Plasma (male) | ||
| Renal Cell Carcinoma Signaling | 2.89E‐04 | 2.75E‐02 |
| Acute Myeloid Leukemia Signaling | 8.58E‐04 | 4.07E‐02 |
| Glutamate Degradation II | 4.15E‐03 | 1.32E‐01 |
| Glioma Signaling | 7.59E‐03 | 1.42E‐01 |
| Tyrosine Degradation I | 9.65E‐03 | 1.42E‐01 |
| Liver (male) | ||
| Endocannabinoid Cancer Inhibition Pathway | 1.41E‐04 | 1.00E‐02 |
| Ceramide Degradation | 5.39E‐03 | 1.26E‐01 |
| Sphingomyelin Metabolism | 5.39E‐03 | 1.26E‐01 |
| Sphingosine and Sphingosine−1‐phosphate Metabolism | 1.12E‐02 | 1.96E‐01 |
| Role of PKR in Interferon Induction and Antiviral Response | 1.67E‐02 | 2.18E‐01 |
| Plasma (female) | ||
| FXR/RXR Activation | 2.18E‐03 | 8.91E‐02 |
| Myc Mediated Apoptosis Signaling | 6.69E‐03 | 8.91E‐02 |
| Sonic Hedgehog Signaling | 6.69E‐03 | 8.91E‐02 |
| Apelin Pancreas Signaling Pathway | 6.69E‐03 | 8.91E‐02 |
| Dilated Cardiomyopathy Signaling Pathway | 1.33E‐02 | 8.91E‐02 |
p‐value were calculated using a Fisher's exact test.
p adj‐value were adjusted p‐value using the Benjamini‐Hochberg false discovery rate method.
3.4. Alteration of lipid metabolites in plasma and liver of male Mct6 KO mice
As the majority of compounds altered in plasma and liver samples of male Mct6 KO mice were lipid metabolites, further classification according to their subpathways was conducted and depicted in Figure 2 with detailed compound information listed in Table S2. Most diacylglycerols were increased in both plasma and liver, which may indicate an increased risk of insulin resistance. 24 Decreased phosphatidylcholines (PC) and phosphatidylethanolamines (PE) were found in liver, which may have resulted from the decreased phosphoethanolamine (0.76‐fold, p = 2.81E‐02, p adj = 3.80E‐01) and choline phosphate (0.71‐fold, p = 2.24E‐02, p adj = 3.80E‐01) concentrations in liver. On the contrary, PC species were increased in plasma, which may be the result of increased lysophosphatidylcholine acyltransferase 1 (Lpcat1) present in the colon of Mct6 KO mice (1.67‐fold, p adj = 2.91E‐02), as reported in our previous proteomic data, leading to increased formation of PC. 13 , 24 A number of sphingolipids, including ceramides, dihydroceramides, sphingomyelins, and dihydrosphingomyelins, were decreased in liver. However, increased ceramides and sphingomyelins were present in plasma. In addition, elevated sphingosines were observed in liver, which may relate to the increased sphingosine‐1‐phosphate phosphatase (SGPP1) in kidney proteomics in Mct6 KO mice (1.69‐fold, p adj = 3.88E‐02) that augmented the formation of sphingosines from sphingosine‐1‐phosphate. 13 , 25 In accordance with the increased plasma triglyceride concentrations in Mct6 KO mice in our previous study, increased levels of long‐chain fatty acids were found in plasma, such as palmitoleate (1.81‐fold, p = 2.13E‐02, p adj = 3.11E‐01), myristoleate (1.56‐fold, p = 3.55E‐02, p adj = 3.38E‐01), and myristate (1.52‐fold, p = 4.68E‐03, p adj = 2.15E‐01). Under a normal physiological state, long‐chain fatty acids need to be converted to long‐chain acylcarnitines for transport into mitochondria and further oxidation. 26 In liver samples, decreased acylcarnitines were found, indicating Mct6 KO may result in incomplete fatty acid oxidation. Although PGF2α was identified as a MCT6 substrate in our previous study, it was decreased but not to a significant level in liver metabolomic data (0.77‐fold, p = 5.13E‐02, p adj = 3.96E‐01). However, other eicosanoids were significantly decreased in liver, including 15‐hydroxyeicosatetraenoic acid (15‐HETE) (0.77‐fold, p = 3.92E‐02, p adj = 3.80E‐01), 12‐HETE (0.76‐fold, p = 4.20E‐02, p adj = 3.80E‐01), 12‐hydroxyheptadecatrenoic acid (12‐HHTrE) (0.72‐fold, p = 3.09E‐03, p adj = 3.07E‐01) and 6‐keto PGF1α (0.68‐fold, p = 6.36E‐03, p adj = 3.80E‐01). Two endocannabinoids, anandamide (arachidonoyl ethanolamide) (0.66‐fold, p = 2.31E‐02, p adj = 3.80E‐01) and 2‐arachidonoylglycerol (0.62‐fold, p = 1.18E‐02, p adj = 3.80E‐01), were both significantly decreased in liver. Carrier‐mediated transport of these two endocannabinoids has been suggested but not yet identified 27 ; thus, the contribution of MCT6 in their membrane transport deserves to be further evaluated. In addition, using both metabolomic and transcriptomic data, a network depiction of the most significant lipid metabolic pathways in the liver of Mct6 KO male mice was generated via IPA (Figure 3). It is evident from the network that Pparα plays a key role in regulating the metabolic changes in hepatic lipid homeostasis.
FIGURE 2.
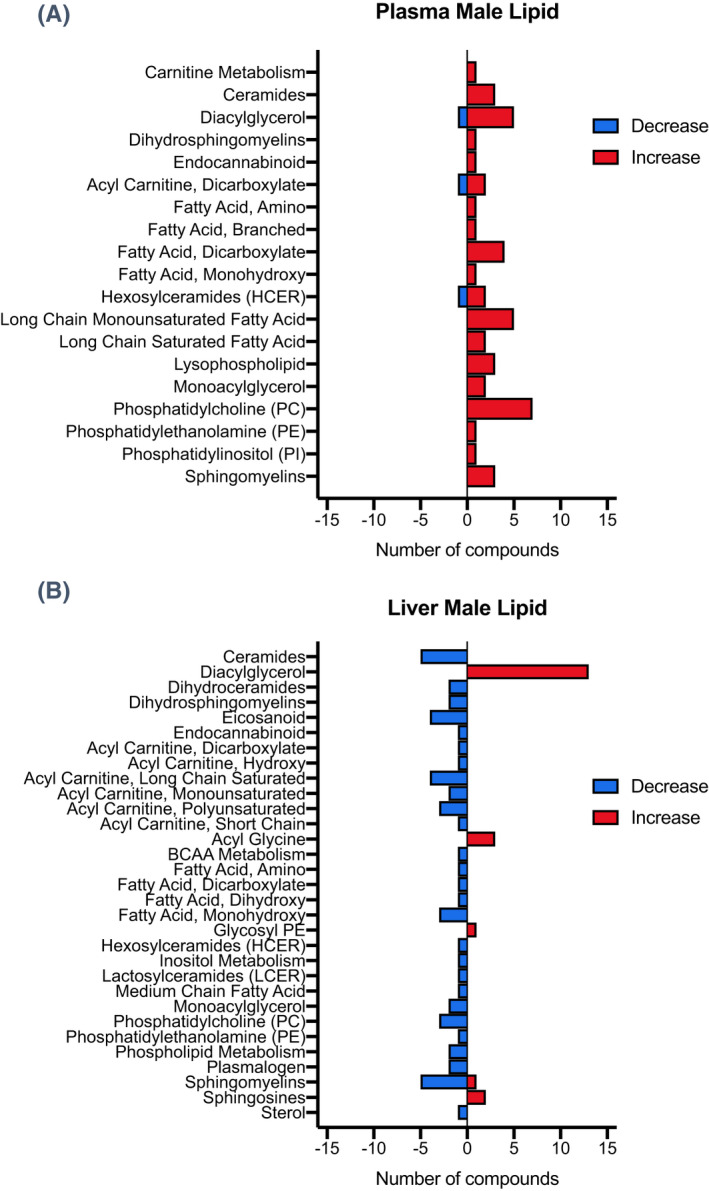
Number of lipid metabolites significantly altered in each subpathway in plasma (A) and liver (B) from male Mct6 KO mice compared to control mice
FIGURE 3.
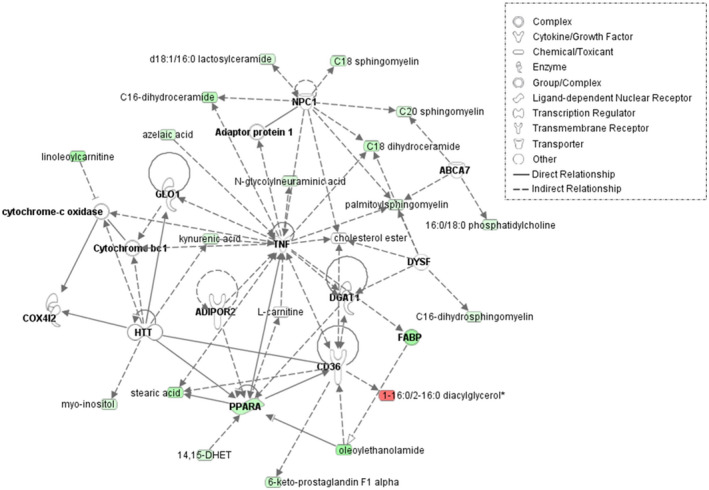
Overlay of transcriptomic and metabolomic network depiction of the most significant lipid metabolic pathways in the liver of Mct6 KO male mice compared with the WT male mice: lipid metabolism, molecular transport, and small molecule biochemistry. Genes (bold)/metabolites upregulated or downregulated in Mct6 KO mice are represented in red or green, respectively as log fold‐change (ABCA7, ATP binding cassette subfamily A member 7; ADIPOR2, adiponectin receptor 2; COX4I2, cytochrome c oxidase subunit 4I2; DGAT1, diacylglycerol O‐acyltransferase 1; DYSF, dysferlin; FABP, fatty acid‐binding protein; GLO1, glyoxalase I; HTT, huntingtin; NPC1, intracellular cholesterol transporter 1; PPARA, peroxisome proliferator‐activated receptor alpha; TNF, tumor necrosis factor). Solid lines represent direct interactions and dashed lines represent indirect interactions. The network was constructed using IPA (QIAGEN)
3.5. Alteration of amino acid metabolites in plasma of male and female Mct6 KO mice
As the largest super pathway decreased in plasma samples of both male and female Mct6 KO mice, the changes of amino acids in terms of subpathways were further explored and illustrated in Figure 4 with detailed metabolite information listed in Table S3. Branched‐chain amino acid metabolites (BCAAs) from leucine, isoleucine and valine metabolism were the top subpathway altered in female but not in male Mct6 KO mice. The gender difference in BCAA catabolism has also been described in rats 28 and humans. 29 A significant number of N‐terminal acetylated amino acids were decreased in plasma samples, including 16 in female mice and 10 in male mice. Many of them demonstrated high significance with low false positive rates, such as N‐acetylmethionine, N‐acetyltyrosine, N‐acetyltryptophan, which were significantly decreased in both male and female plasma samples with adjusted p‐value less than .05. The reduction may be related to reduced N‐terminal acetyltransferase (NAT) enzymatic activity, leading to impairment of mitochondrial degradation. 30 , 31 N‐formylmethionine, another marker of mitochondrial protein turnover, 32 was also decreased in plasma of male (0.64‐fold, p = 5.23E‐03, p adj = 2.15E‐01) and female (0.67‐fold, p = 3.82E‐03, p adj = 2.14E‐01) Mct6 KO mice. Several tryptophan metabolites were increased in male Mct6 mice, including indolepropionate (1.58‐fold, p = 1.87E‐02, p adj = 3.11E‐01), indolepropionylglycine (1.57‐fold, p = 1.67E‐02, p adj = 3.11E‐01), and picolinate (1.42‐fold, p = 1.86E‐02, p adj = 3.11E‐01). Increased circulating tryptophan metabolites were also observed in OAT1 or OAT3 KO mice, suggesting that OAT1 and OAT3 may coordinate regulation of kidney tryptophan metabolism. 33 MCT6 may work similarly to OAT1 and OAT3 in regulating tryptophan metabolism as inferred from the elevated tryptophan metabolites observed in the present plasma metabolome. Phenol sulfate, a tyrosine metabolite and a protein‐bound uremic solute, was increased in male Mct6 mice (1.59‐fold, p = 3.88E‐02, p adj = 3.57E‐01). Although it has been identified as an OATP substrate, 34 the contribution of MCT6 to its transport remains to be further explored.
FIGURE 4.
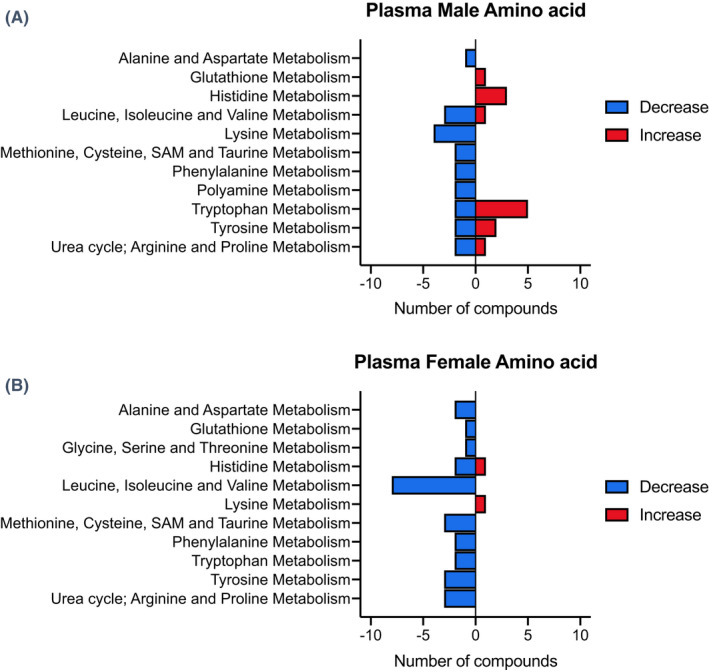
Number of amino acid metabolites significantly altered in each subpathway in plasma from male (A) and female (B) Mct6 KO mice compared to their respective control mice
4. DISCUSSION
To supplement the previous data supporting the top associated functions of Mct6 in metabolic processes, 13 an untargeted metabolomic analysis was performed in the present study. Again, the perturbation in lipid metabolism was annotated in the plasma and liver metabolome, with additional alterations in amino acid metabolism in plasma samples of male and female mice. The present study confirmed the significant role of MCT6 in lipid and energy homeostasis.
4.1. Increased diacylglycerol levels and insulin resistance risk in Mct6 KO mice
In the metabolomic profile of male Mct6 KO mice, numerous diacylglycerols were elevated in plasma and liver samples compared to WT mice. Diacylglycerol is an important class of neutral lipids involved in multiple metabolic processes and signaling pathways. 24 Its elevation in plasma may be the result of the increased plasma concentration of triacylglycerol in Mct6 KO mice, 13 as triacylglycerol is a metabolic precursor of diacylglycerol. 24 In addition to formation from triacylglycerol, diacylglycerol can be derived from phospholipids by phospholipase C or indirectly by phospholipase D, 35 with diacylglycerol generated from phospholipase D‐generated phosphatidates catalyzed by phosphatidate phosphatases (LPIN). 36 Our previous proteomics study revealed increased expression of Lpin1 in the liver (1.90‐fold) and Lpin3 in the colon (1.34‐fold) of Mct6 KO mice, 13 which may contribute to the increased diacylglycerols in metabolomic profiles. Proteomics in Mct6 KO mice also showed that diacylglycerol kinase zeta (Dgkz), a kinase that converts diacylglycerol back into phosphatidate, 37 was decreased in kidney (0.63‐fold) and this may also contribute to the elevated diacylglycerol levels. Increased diacylglycerols were observed in the liver and muscle of obese rats 38 ; and in mice fed a high‐fat, ketogenic diet causing insulin resistance. 39 In fact, diacylglycerol affects insulin signaling by activating protein kinase C, leading to subsequent phosphorylation of insulin receptor substrate, thereby inhibiting downstream signaling for glucose uptake. 24 Thus, accumulated diacylglycerols in Mct6 KO mice may adversely affect insulin signaling and cause potential insulin resistance. Although we have not observed different glucose levels in the Mct6 KO mice versus the WT mice under normal chow or overnight fasting, the potential relationship to insulin resistance requires further exploration under different dietary status.
4.2. Alteration of sphingolipids and association with hepatic steatosis in Mct6 KO mice
Sphingolipids, including ceramides, dihydroceramides, sphingomyelins and sphingosines, which play important roles in insulin resistance and hepatic metabolism, 40 were significantly altered in liver and plasma samples of male Mct6 KO mice. IPA also revealed that the top canonical pathways associated with the metabolic changes observed in liver were ceramide degradation, and sphingomyelin, sphingosine and sphingosine‐1‐phosphate metabolism pathways. Increased plasma ceramides have been observed in obese children and adolescents with type 2 diabetes and correlate with plasma triglycerides and insulin resistance. 41 Ceramides were also increased in plasma of male Mct6 KO mice, which further corroborated the suggested role of Mct6 in glucose/lipid metabolism. 6 , 13 In addition, since MCT1 is suggested to play a role in energy homeostasis and in diet‐induced obesity, MCT1and MCT6 may also share a similar role in the regulation of energy balance.
4.3. Change of fatty acids and acylcarnitines in Mct6 KO mice
The critical role of MCT6 in lipid metabolism is also evident in the changes of fatty acids and their metabolites in liver and plasma samples of Mct6 KO mice. Increased saturated fatty acids, including myristate and palmitate, were found in plasma, which may increase the risk of metabolic diseases and insulin resistance. 42 , 43 As essential mediators of mitochondrial fatty acid oxidation, acylcarnitines were significantly decreased in livers of Mct6 KO mice; these changes involved predominantly long‐chain acylcarnitines. Unlike medium‐chain fatty acids that can freely diffuse into mitochondria, long‐chain fatty acids need to be first activated to acyl‐coenzyme A (‐CoA) esters followed by esterification with carnitine to form acylcarnitines in order to be imported into mitochondria, a process known as the carnitine shuttle. 26 The reduced liver acylcarnitine may lead to acyl‐CoA trapping and prevent further CoA‐dependent lipid oxidation processes. Genome‐wide association studies also identified SLC16A9 (MCT9) as a pH‐independent carnitine efflux transporter, possibly responsible for carnitine efflux from absorptive epithelia into the blood. 44 Thus, the involvement of MCT6 in the carnitine shuttle in mitochondria and/or at the plasma membranes is highly plausible and remains to be further evaluated. The recent finding of the presence of MCT2 at peroxisomes in prostate cancer also suggests the overlapping function of MCT2 with MCT6 in the regulation of fatty acid oxidation. 45
4.4. Decreased liver eicosanoids and endocannabinoids in Mct6 KO mice
As a transporter of PGF2α, MCT6 may also be involved in the regulation of other eicosanoids, as some were decreased in the liver of Mct6 KO mice. The cyclooxygenase‐derived prostaglandin metabolite, 6‐keto PGF1α, and the thromboxane metabolite, 12‐HHTrE, were decreased in liver. The potential regulatory role of MCT6 in the transport of 6‐keto PGF1α and 12‐HHTrE requires further investigation. 12‐HETE and 15‐HETE were decreased in liver; these eicosanoids are stable arachidonic acid (AA) metabolites formed by lipoxygenase or CYP450 enzymes. 46 Since members of the CYP2C and CYP4A subfamilies are predominantly involved in AA metabolism, 47 reductions in Cyp4a10 (0.68‐fold) and Cyp2c54 (0.69‐fold) observed in liver proteomics of Mct6 mice may contribute to the decreases in 12‐HETE and 15‐HETE.
The fatty acid‐derived endocannabinoids, anandamide and 2‐arachidonoylglycerol, are well‐studied cannabinoid receptor agonists that were decreased in livers of Mct6 KO mice. The endocannabinoid system has been implicated in pathophysiological aspects associated with liver diseases and metabolic disorders. 48 Obese individuals display increased circulating anandamide and 2‐arachidonoylglycerol. 48 , 49 Thus, the influence of MCT6 in lipid metabolism may be related to its regulatory role in the endocannabinoid system. Although the transmembrane protein transporter for anandamide and 2‐arachidonoylglycerol has not been identified to date, fatty acid binding proteins (FABPs) can function as intracellular carriers for anandamide. 50 , 51 Previous liver transcriptomics showed significantly decreased Fabp2 (0.51‐fold) in Mct6 KO mice, 13 which may contribute to the change in anandamide levels. However, the mechanism involved in regulating the transport of endocannabinoid by MCT6 needs further evaluation.
4.5. Reduction of N‐terminal acetylated amino acids and impaired mitophagy potential in Mct6 KO mice
A great number of N‐terminal acetylated amino acids were decreased in plasma samples of Mct6 KO mice. N‐terminal acetylation is the process of covalent attachment of an acetyl group to an amino group at the N‐terminal end of polypeptides, and is catalyzed by NATs. 52 Alteration of N‐terminal acetylation can impact various protein properties, including stability, folding, protein‐protein interactions, and subcellular targeting. 52 N‐terminal acetylation is also critical for mitophagy, an autophagy pathway that selectively degrades damaged mitochondria. 53 Loss of N‐terminal acetyltransferases A (NatA) enzymatic activity causes impairment of mitophagy, 30 while knockdown of NatC reduces the expression of mitochondrial proteins and induces loss of mitochondrial membrane potential and mitochondrial fragmentation. 31 Considering substrate specificity, the N‐terminal acetylated amino acids that can be formed by NatA or NatC, including N‐acetylalanine, N‐acetylleucine, N‐acetylmethionine, N‐acetylphenylalanine, and N‐acetyltryptophan, were decreased in both male and female plasma samples of Mct6 KO mice. 52 Thus, MCT6 may influence NAT function to result in reduced N‐terminal acetylated amino acids and more importantly, possibly induce impaired mitophagy and increase the risk of liver diseases.
4.6. Potential diseases associated with reduced MCT6 expression in human
As murine Mct6 and human MCT6 share similar amino acid sequence (~68% according to Clustal Omega), the metabolomic alterations in Mct6 KO mice may be observed in human with reduced MCT6 expression and result in physiological or pathological changes. For example, MCT6 downregulation may increase diacylglycerol levels and cause impaired insulin signaling responses and hepatic insulin resistance. Insufficient lipid oxidation may be found in those individuals with reduced MCT6 expression due to decreased acylcarnitine levels and deregulated mitophagy. Reduced expression of Pparα, which has been revealed in the principal network generated by previous transcriptomic data in Mct6 KO mice, may also contribute to decreased lipid oxidation. As a key regulator in intracellular lipid metabolism, the reduction of PPARα may downregulate the expression of enzymes involved in conversion of fatty acids to acyl‐CoA, and peroxisomal and mitochondrial fatty acid catabolism. 54 Therefore, reduced MCT6 expression in human may enhance the risk of insulin resistance and metabolic diseases, in part, via PPAR‐dependent pathway.
4.7. Conclusions and future directions
With untargeted metabolomic analysis, we identified metabolic changes in lipids and amino acids as a result of the absence of Mct6 in mice. These findings, in conjunction with our previous proteomic and transcriptomic data, implicated the unique role of MCT6 in metabolic diseases through its ability to influence the levels of key mediators of metabolic processes. However, the specific endogenous function of MCT6 may not be comprehensively explored in the current metabolomic analysis, which was limited by studies performed in only plasma and liver matrices under normal diet conditions. Therefore, additional tissue metabolic profiles, including muscle, another regulatory center of metabolic homeostasis, and colon, which has the highest MCT6 expression and the most significant changes in proteomic analysis, 13 need to be evaluated. In addition, these studies should be followed up with larger cohorts of KO and WT mice in order to strengthen the statistical power and inferences made in this study. Due to the fact that clinical indicators of perturbations in lipid oxidation can be provoked by many variables, such as fasting, illness, and prolonged exercise; the metabolic changes witnessed after Mct6 deactivation in mice can be further examined in different states of energy consumption. 26 Further in‐vitro studies are warranted to confirm the Mct6 substrate specificity of metabolites demonstrating significant changes between Mct6 KO and WT mice. The interactions of MCT6 with other members from the MCT and OAT families also require further investigation in order to assess whether these transporters possess shared biological functions. Additionally, based on the gender differences in plasma metabolic profiles in the current study, future ‘omics studies should be conducted in both sexes of mice to further evaluate the impact of gender on the regulation of MCT6 function. Taken together, the physiological role of MCT6 in lipid and amino acid homeostasis suggests its clinical utility as a potential target and prognostic factor for metabolic disorders.
CONFLICT OF INTEREST
The authors declare no conflict of interest.
AUTHOR CONTRIBUTIONS
Participated in research design: Jones, Morris. Conducted experiments: Jones. Contributed new reagents or analytic tools: Jones, Morris. Performed data analysis: Ren, Jones, Morris. Wrote or contributed to the writing of the manuscript: Ren, Jones, Morris.
Supporting information
Table S1‐S3
ACKNOWLEDGMENTS
Funding support was from the National Institutes of Health National Institute on Drug Abuse [Grant R01DA023223]. RSJ was supported in part by a PhRMA Pre‐Doctoral Graduate Fellowship.
Ren T, Jones RS, Morris ME. Untargeted metabolomics identifies the potential role of monocarboxylate transporter 6 (MCT6/SLC16A5) in lipid and amino acid metabolism pathways. Pharmacol Res Perspect. 2022;10:e00944. doi: 10.1002/prp2.944
DATA AVAILABILITY STATEMENT
The authors confirm that the data supporting the finding on this study are available from the corresponding author upon reasonable request.
REFERENCES
- 1. Halestrap AP. The SLC16 gene family–structure, role and regulation in health and disease. Mol Aspects Med. 2013;34(2–3):337‐349. [DOI] [PubMed] [Google Scholar]
- 2. Felmlee MA, Jones RS, Rodriguez‐Cruz V, Follman KE, Morris ME. Monocarboxylate transporters (SLC16): function, regulation, and role in health and disease. Pharmacol Rev. 2020;72(2):466‐485. [DOI] [PMC free article] [PubMed] [Google Scholar]
- 3. Jones RS, Parker MD, Morris ME. Monocarboxylate transporter 6‐mediated interactions with prostaglandin F(2α): in vitro and in vivo evidence utilizing a knockout mouse model. Pharmaceutics. 2020;12(3):201. 10.3390/pharmaceutics12030201 [DOI] [PMC free article] [PubMed] [Google Scholar]
- 4. Bonen A, Heynen M, Hatta H. Distribution of monocarboxylate transporters MCT1‐MCT8 in rat tissues and human skeletal muscle. Appl Physiol Nutr Metab. 2006;31(1):31‐39. 10.1139/h05-002%M16604139 [DOI] [PubMed] [Google Scholar]
- 5. Price TN, Jackson NV, Halestrap PA. Cloning and sequencing of four new mammalian monocarboxylate transporter (MCT) homologues confirms the existence of a transporter family with an ancient past. Biochem J. 1998;329(2):321‐328. [DOI] [PMC free article] [PubMed] [Google Scholar]
- 6. Zhang F, Xu X, Zhou B, He Z, Zhai Q. Gene expression profile change and associated physiological and pathological effects in mouse liver induced by fasting and refeeding. PLoS One. 2011;6(11):e27553. 10.1371/journal.pone.0027553 [DOI] [PMC free article] [PubMed] [Google Scholar]
- 7. Lu Y, Boekschoten MV, Wopereis S, Müller M, Kersten S. Comparative transcriptomic and metabolomic analysis of fenofibrate and fish oil treatments in mice. Physiol Genomics. 2011;43(23):1307‐1318. 10.1152/physiolgenomics.00100.2011 [DOI] [PubMed] [Google Scholar]
- 8. Xu F, Zhu L, Qian C, et al. Impairment of intestinal monocarboxylate transporter 6 function and expression in diabetic rats induced by combination of high‐fat diet and low dose of streptozocin. Involvement of butyrate‐PPARγ activation. Drug Metab Dispos. 2019;47(6):556‐566. 10.1124/dmd.118.085803 [DOI] [PubMed] [Google Scholar]
- 9. Gill RK, Saksena S, Alrefai WA, et al. Expression and membrane localization of MCT isoforms along the length of the human intestine. Am J Physiol Cell Physiol. 2005;289(4):C846‐C852. [DOI] [PubMed] [Google Scholar]
- 10. Kohyama N, Shiokawa H, Ohbayashi M, Kobayashi Y, Yamamoto T. Characterization of monocarboxylate transporter 6: expression in human intestine and transport of the antidiabetic drug nateglinide. Drug Metab Dispos. 2013;41(11):1883‐1887. [DOI] [PubMed] [Google Scholar]
- 11. Murakami Y, Kohyama N, Kobayashi Y, et al. Functional characterization of human monocarboxylate transporter 6 (SLC16A5). Drug Metab Dispos. 2005;33(12):1845‐1851. 10.1124/dmd.105.005264 [DOI] [PubMed] [Google Scholar]
- 12. Jones RS, Parker MD, Morris ME. Quercetin, morin, luteolin, and phloretin are dietary flavonoid inhibitors of monocarboxylate transporter 6. Mol Pharm. 2017;14(9):2930‐2936. 10.1021/acs.molpharmaceut.7b00264 [DOI] [PMC free article] [PubMed] [Google Scholar]
- 13. Jones RS, Tu C, Zhang M, Qu J, Morris ME. Characterization and proteomic‐transcriptomic investigation of monocarboxylate transporter 6 knockout mice: evidence of a potential role in glucose and lipid metabolism. Mol Pharmacol. 2019;96(3):364‐376. 10.1124/mol.119.116731 [DOI] [PMC free article] [PubMed] [Google Scholar]
- 14. Tiffany CR, Bäumler AJ, Newton ILG. omu, a Metabolomics count data analysis tool for intuitive figures and convenient metadata collection. Microbiol Resour Announc. 2019;8(15):e00129‐19. 10.1128/MRA.00129-19 [DOI] [PMC free article] [PubMed] [Google Scholar]
- 15. Harding SD, Sharman JL, Faccenda E, et al. The IUPHAR/BPS Guide to PHARMACOLOGY in 2018: updates and expansion to encompass the new guide to IMMUNOPHARMACOLOGY. Nucleic Acids Res. 2017;46(D1):D1091‐D1106. 10.1093/nar/gkx1121 [DOI] [PMC free article] [PubMed] [Google Scholar]
- 16. Alexander SPH, Cidlowski JA, Kelly E, et al. THE CONCISE GUIDE TO PHARMACOLOGY 2021/22: nuclear hormone receptors. Br J Pharmacol. 2021;178(S1):S246‐S263. 10.1111/bph.15540 [DOI] [PMC free article] [PubMed] [Google Scholar]
- 17. Alexander SPH, Kelly E, Mathie A, et al. THE CONCISE GUIDE TO PHARMACOLOGY 2021/22: transporters. Br J Pharmacol. 2021;178(S1):S412‐S513. 10.1111/bph.15543 [DOI] [PubMed] [Google Scholar]
- 18. Alexander SPH, Fabbro D, Kelly E, et al. THE CONCISE GUIDE TO PHARMACOLOGY 2021/22: enzymes. Br J Pharmacol. 2021;178(S1):S313‐S411. 10.1111/bph.15542 [DOI] [PubMed] [Google Scholar]
- 19. Alexander SPH, Kelly E, Mathie A, et al. THE CONCISE GUIDE TO PHARMACOLOGY 2021/22: introduction and other protein targets. Br J Pharmacol. 2021;178(S1):S1‐S26. 10.1111/bph.15537 [DOI] [PMC free article] [PubMed] [Google Scholar]
- 20. Craig RM, Ehrenpreis ED. D‐xylose testing. J Clin Gastroenterol. 1999;29(2):143‐150. [DOI] [PubMed] [Google Scholar]
- 21. Immenschuh S, Vijayan V, Janciauskiene S, Gueler F. Heme as a target for therapeutic interventions. Front Pharmacol. 2017;8:146. 10.3389/fphar.2017.00146 [DOI] [PMC free article] [PubMed] [Google Scholar]
- 22. Li T, Chiang JYL. Bile acid signaling in metabolic disease and drug therapy. Pharmacol Rev. 2014;66(4):948‐983. 10.1124/pr.113.008201 [DOI] [PMC free article] [PubMed] [Google Scholar]
- 23. Laezza C, Pagano C, Navarra G, et al. The endocannabinoid system: a target for cancer treatment. Int J Mol Sci. 2020;21(3):747. 10.3390/ijms21030747 [DOI] [PMC free article] [PubMed] [Google Scholar]
- 24. Eichmann TO, Lass A. DAG tales: the multiple faces of diacylglycerol–stereochemistry, metabolism, and signaling. Cell Mol Life Sci. 2015;72(20):3931‐3952. 10.1007/s00018-015-1982-3 [DOI] [PMC free article] [PubMed] [Google Scholar]
- 25. Johnson KR, Johnson KY, Becker KP, Bielawski J, Mao C, Obeid LM. Role of human sphingosine‐1‐phosphate phosphatase 1 in the regulation of intra‐ and extracellular sphingosine‐1‐phosphate levels and cell viability. J Biol Chem. 2003;278(36):34541‐34547. 10.1074/jbc.M301741200 [DOI] [PubMed] [Google Scholar]
- 26. Knottnerus SJ, Bleeker JC, Wüst RC, et al. Disorders of mitochondrial long‐chain fatty acid oxidation and the carnitine shuttle. Rev Endocr Metab Disord. 2018;19(1):93‐106. [DOI] [PMC free article] [PubMed] [Google Scholar]
- 27. Moore S, Nomikos G, Dickason‐Chesterfield A, et al. Identification of a high‐affinity binding site involved in the transport of endocannabinoids. Proc Natl Acad Sci U S A. 2005;102(49):17852‐17857. [DOI] [PMC free article] [PubMed] [Google Scholar]
- 28. Kobayashi R, Shimomura Y, Murakami T, et al. Gender difference in regulation of branched‐chain amino acid catabolism. Biochem J. 1997;327:449‐453. 10.1042/bj3270449 [DOI] [PMC free article] [PubMed] [Google Scholar]
- 29. Krumsiek J, Mittelstrass K, Do KT, et al. Gender‐specific pathway differences in the human serum metabolome. Metabolomics. 2015;11(6):1815‐1833. 10.1007/s11306-015-0829-0 [DOI] [PMC free article] [PubMed] [Google Scholar]
- 30. Eiyama A, Okamoto K. Protein N‐terminal acetylation by the NatA complex is critical for selective mitochondrial degradation. J Biol Chem. 2015;290(41):25034‐25044. 10.1074/jbc.M115.677468 [DOI] [PMC free article] [PubMed] [Google Scholar]
- 31. Van Damme P, Kalvik TV, Starheim KK, et al. A role for human N‐alpha acetyltransferase 30 (Naa30) in maintaining mitochondrial integrity. Mol Cell Proteomics. 2016;15(11):3361‐3372. 10.1074/mcp.M116.061010 [DOI] [PMC free article] [PubMed] [Google Scholar]
- 32. Garcia‐Contreras M, Tamayo‐Garcia A, Pappan KL, et al. Metabolomics study of the effects of inflammation, hypoxia, and high glucose on isolated human pancreatic islets. J Proteome Res. 2017;16(6):2294‐2306. 10.1021/acs.jproteome.7b00160 [DOI] [PMC free article] [PubMed] [Google Scholar]
- 33. Granados JC, Richelle A, Gutierrez JM, et al. Coordinate regulation of systemic and kidney tryptophan metabolism by the drug transporters OAT1 and OAT3. J Biol Chem. 2021;296:100575. 10.1016/j.jbc.2021.100575 [DOI] [PMC free article] [PubMed] [Google Scholar]
- 34. Kikuchi K, Saigusa D, Kanemitsu Y, et al. Gut microbiome‐derived phenyl sulfate contributes to albuminuria in diabetic kidney disease. Nat Commun. 2019/04/23;2019;10(1):1835. 10.1038/s41467-019-09735-4 [DOI] [PMC free article] [PubMed] [Google Scholar]
- 35. Huang CF, Cabot MC. Phorbol diesters stimulate the accumulation of phosphatidate, phosphatidylethanol, and diacylglycerol in three cell types. Evidence for the indirect formation of phosphatidylcholine‐derived diacylglycerol by a phospholipase D pathway and direct formation of diacylglycerol by a phospholipase C pathway. J Biol Chem. 1990;265(25):14858‐14863. [PubMed] [Google Scholar]
- 36. Reue K, Zhang P. The lipin protein family: dual roles in lipid biosynthesis and gene expression. FEBS Lett. 2008;582(1):90‐96. 10.1016/j.febslet.2007.11.014 [DOI] [PMC free article] [PubMed] [Google Scholar]
- 37. Zhong XP, Hainey EA, Olenchock BA, et al. Enhanced T cell responses due to diacylglycerol kinase zeta deficiency. Nat Immunol. 2003;4(9):882‐890. 10.1038/ni958 [DOI] [PubMed] [Google Scholar]
- 38. Turinsky J, O'Sullivan DM, Bayly BP. 1, 2‐Diacylglycerol and ceramide levels in insulin‐resistant tissues of the rat in vivo. J Biol Chem. 1990;265(28):16880‐16885. [PubMed] [Google Scholar]
- 39. Jornayvaz FR, Jurczak MJ, Lee HY, et al. A high‐fat, ketogenic diet causes hepatic insulin resistance in mice, despite increasing energy expenditure and preventing weight gain. Am J Physiol Endocrinol Metab. 2010;299(5):E808‐E815. 10.1152/ajpendo.00361.2010 [DOI] [PMC free article] [PubMed] [Google Scholar]
- 40. Pagadala M, Kasumov T, McCullough AJ, Zein NN, Kirwan JP. Role of ceramides in nonalcoholic fatty liver disease. Trends Endocrinol Metab. 2012;23(8):365‐371. 10.1016/j.tem.2012.04.005 [DOI] [PMC free article] [PubMed] [Google Scholar]
- 41. Lopez X, Goldfine AB, Holland WL, Gordillo R, Scherer PE. Plasma ceramides are elevated in female children and adolescents with type 2 diabetes. J Pediatr Endocrinol Metab. 2013;26(9–10):995‐998. 10.1515/jpem-2012-0407 [DOI] [PubMed] [Google Scholar]
- 42. Chavez JA, Summers SA. Characterizing the effects of saturated fatty acids on insulin signaling and ceramide and diacylglycerol accumulation in 3T3‐L1 adipocytes and C2C12 myotubes. Arch Biochem Biophys. 2003;419(2):101‐109. 10.1016/j.abb.2003.08.020 [DOI] [PubMed] [Google Scholar]
- 43. Lee JS, Pinnamaneni SK, Eo SJ, et al. Saturated, but not n‐6 polyunsaturated, fatty acids induce insulin resistance: role of intramuscular accumulation of lipid metabolites. J Appl Physiol. 2006;100(5):1467‐1474. 10.1152/japplphysiol.01438.2005 [DOI] [PubMed] [Google Scholar]
- 44. Suhre K, Shin S‐Y, Petersen A‐K, et al. Human metabolic individuality in biomedical and pharmaceutical research. Nature. 2011;477(7362):54‐60. 10.1038/nature10354 [DOI] [PMC free article] [PubMed] [Google Scholar]
- 45. Valença I, Pértega‐Gomes N, Vizcaino JR, et al. Localization of MCT2 at peroxisomes is associated with malignant transformation in prostate cancer. J Cell Mol Med. 2015;19(4):723‐733. 10.1111/jcmm.12481 [DOI] [PMC free article] [PubMed] [Google Scholar]
- 46. Porro B, Songia P, Squellerio I, Tremoli E, Cavalca V. Analysis, physiological and clinical significance of 12‐HETE: A neglected platelet‐derived 12‐lipoxygenase product. J Chromatogr B. 2014;964:26‐40. 10.1016/j.jchromb.2014.03.015 [DOI] [PubMed] [Google Scholar]
- 47. Capdevila JH, Falck JR, Imig JD. Roles of the cytochrome P450 arachidonic acid monooxygenases in the control of systemic blood pressure and experimental hypertension. Kidney Int. 2007;72(6):683‐689. 10.1038/sj.ki.5002394 [DOI] [PubMed] [Google Scholar]
- 48. Basu PP, Aloysius MM, Shah NJ, Brown RS Jr. Review article: the endocannabinoid system in liver disease, a potential therapeutic target. Aliment Pharmacol Ther. 2014;39(8):790‐801. 10.1111/apt.12673 [DOI] [PubMed] [Google Scholar]
- 49. Engeli S, Böhnke J, Feldpausch M, et al. Activation of the peripheral endocannabinoid system in human obesity. Diabetes. 2005;54(10):2838‐2843. 10.2337/diabetes.54.10.2838 [DOI] [PMC free article] [PubMed] [Google Scholar]
- 50. Kaczocha M, Glaser ST, Deutsch DG. Identification of intracellular carriers for the endocannabinoid anandamide. Proc Natl Acad Sci U S A. 2009;106(15):6375‐6380. 10.1073/pnas.0901515106 [DOI] [PMC free article] [PubMed] [Google Scholar]
- 51. Deutsch DG. A personal retrospective: elevating anandamide (AEA) by targeting fatty acid amide hydrolase (FAAH) and the fatty acid binding proteins (FABPs). Front Pharmacol. 2016;7:370. 10.3389/fphar.2016.00370 [DOI] [PMC free article] [PubMed] [Google Scholar]
- 52. Ree R, Varland S, Arnesen T. Spotlight on protein N‐terminal acetylation. Exp Mol Med. 2018;50(7):1‐13. [DOI] [PMC free article] [PubMed] [Google Scholar]
- 53. Ke P‐Y. Mitophagy in the pathogenesis of liver diseases. Cells. 2020;9(4):831. 10.3390/cells9040831 [DOI] [PMC free article] [PubMed] [Google Scholar]
- 54. Gervois P, Torra IP, Fruchart JC, Staels B. Regulation of lipid and lipoprotein metabolism by PPAR activators. Clin Chem Lab Med. 2000;38(1):3‐11. 10.1515/cclm.2000.002 [DOI] [PubMed] [Google Scholar]
Associated Data
This section collects any data citations, data availability statements, or supplementary materials included in this article.
Supplementary Materials
Table S1‐S3
Data Availability Statement
The authors confirm that the data supporting the finding on this study are available from the corresponding author upon reasonable request.