

Our recent paper reported evidence that color can be decoded from patterns of brain activity elicited by color stimuli and showed that these patterns reveal a geometry of the neural representation of color that correlates with a universal pattern in color naming. The conclusions were based on analyses of magnetoencephalography responses (MEGco dataset). We have since conducted further analysis of the dataset, and in the process, we uncovered an error in the preprocessing pipeline. The mistake introduced noise in an average of 4.6% of trials per participant for the main experiment (control and pilot experiments were unaffected). The error did not impact the main conclusions, but it did impact specific reported values in all data figures and two minor conclusions must be revised. The evidence that reddish colors are decoded with higher accuracy is weaker than reported, and there is no evidence that S-increment colors are decoded more accurately than S-decrement colors. The raw data remain unaffected (https://doi.org/10.18112/openneuro.ds003352.v1.0.0). We have corrected Figures 2–5 and S1, Videos S1–S4, and the analysis pipeline. The revised pipeline and videos are available at https://neicommons.nei.nih.gov/#/GeometryNeurRepColor. The error was corrected before publication of the subsequent study (Hermann et al., 2022, Nat. Comm. 13, 661). We regret any inconvenience this mistake has caused.
Figure 2.
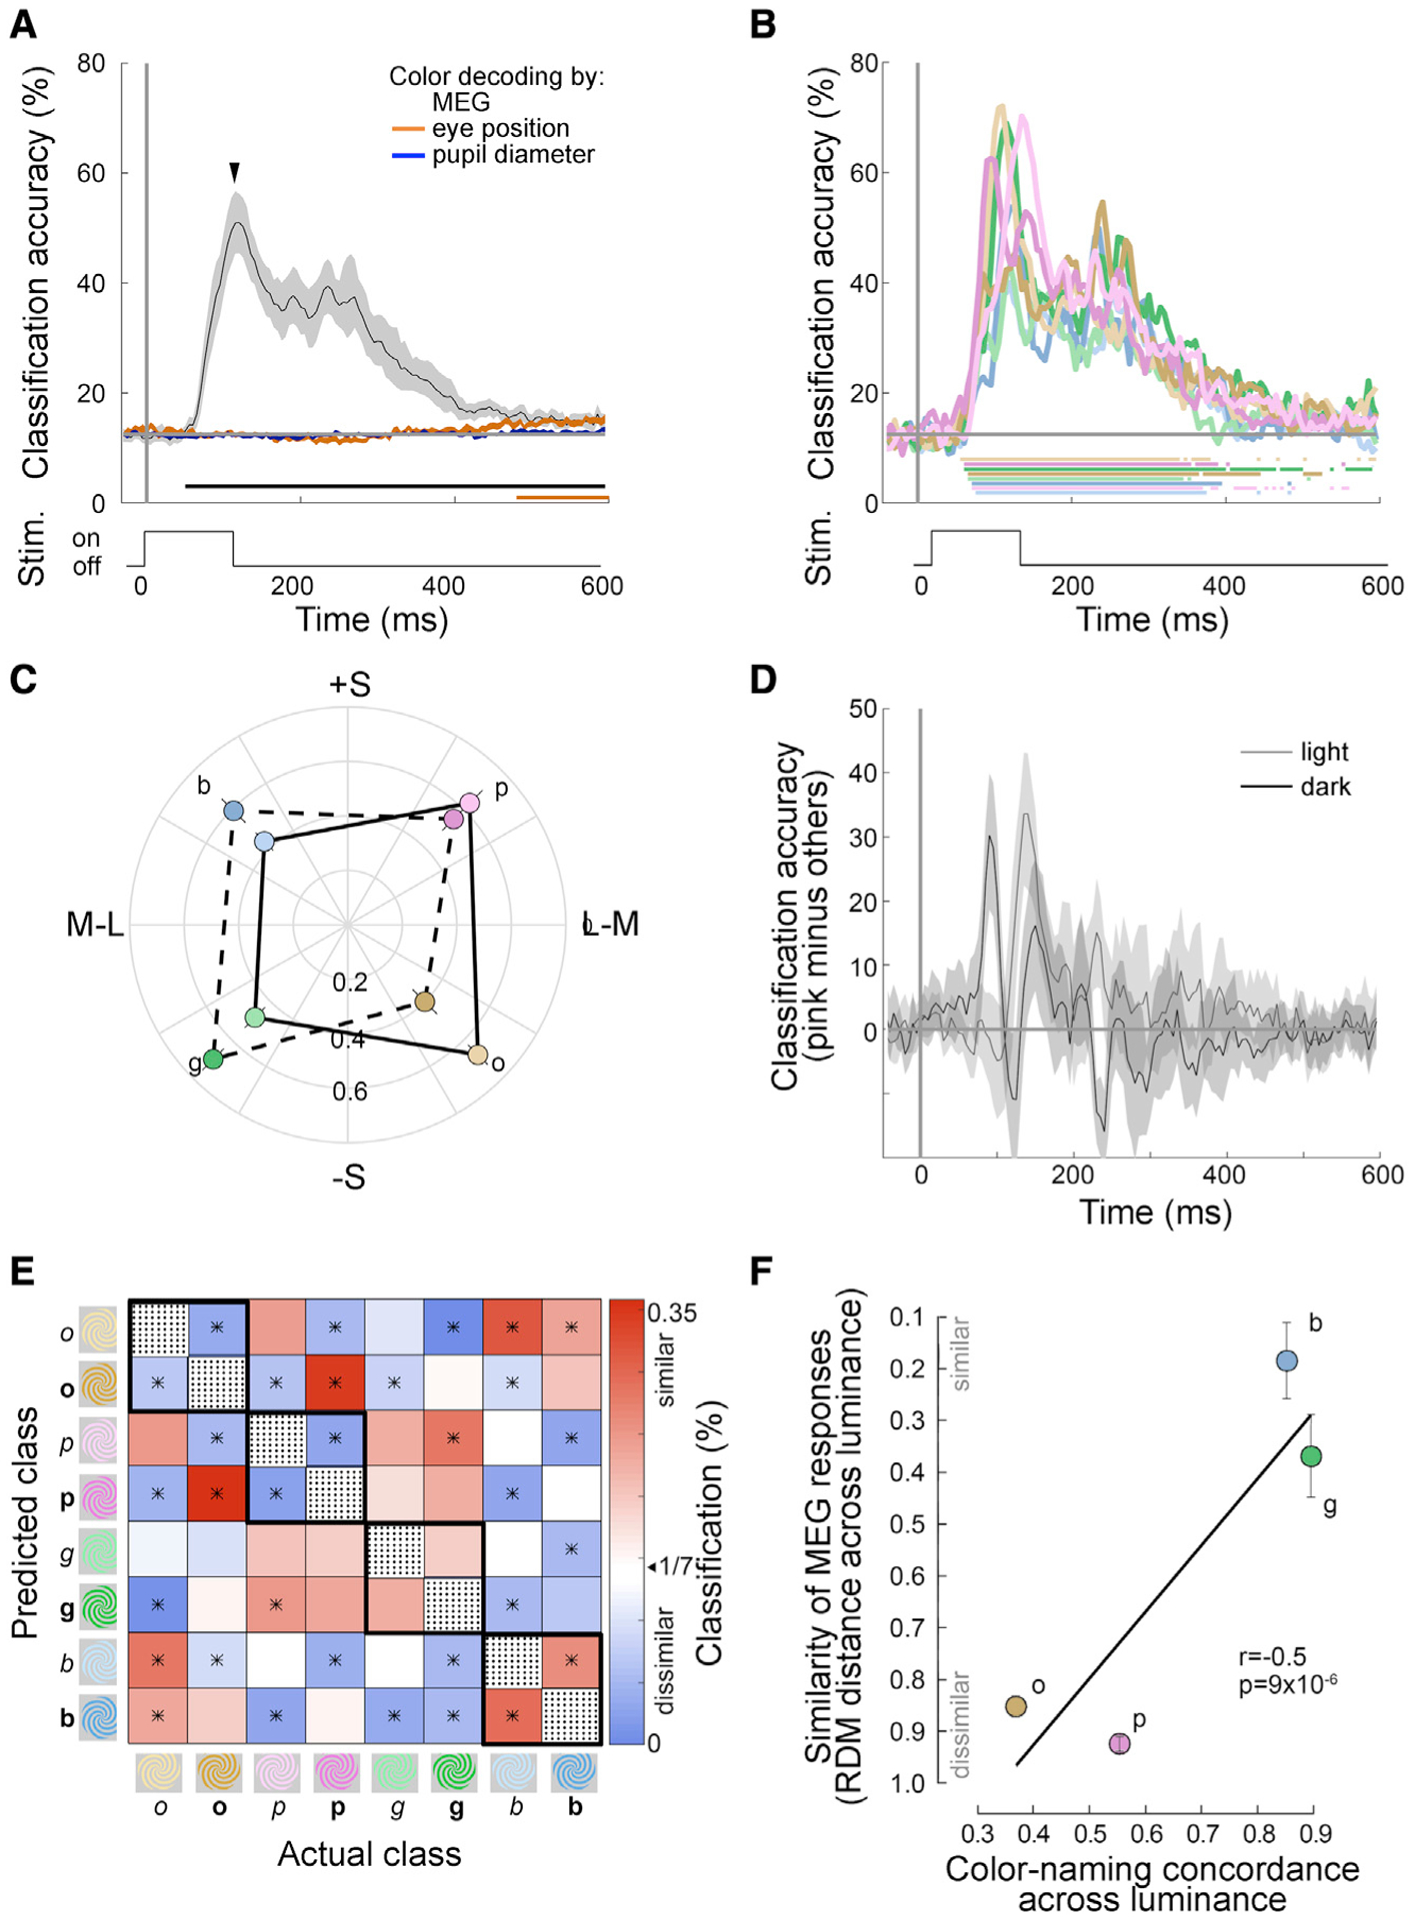
Decoding Stimulus Color from MEG Data (corrected)
Figure 5.
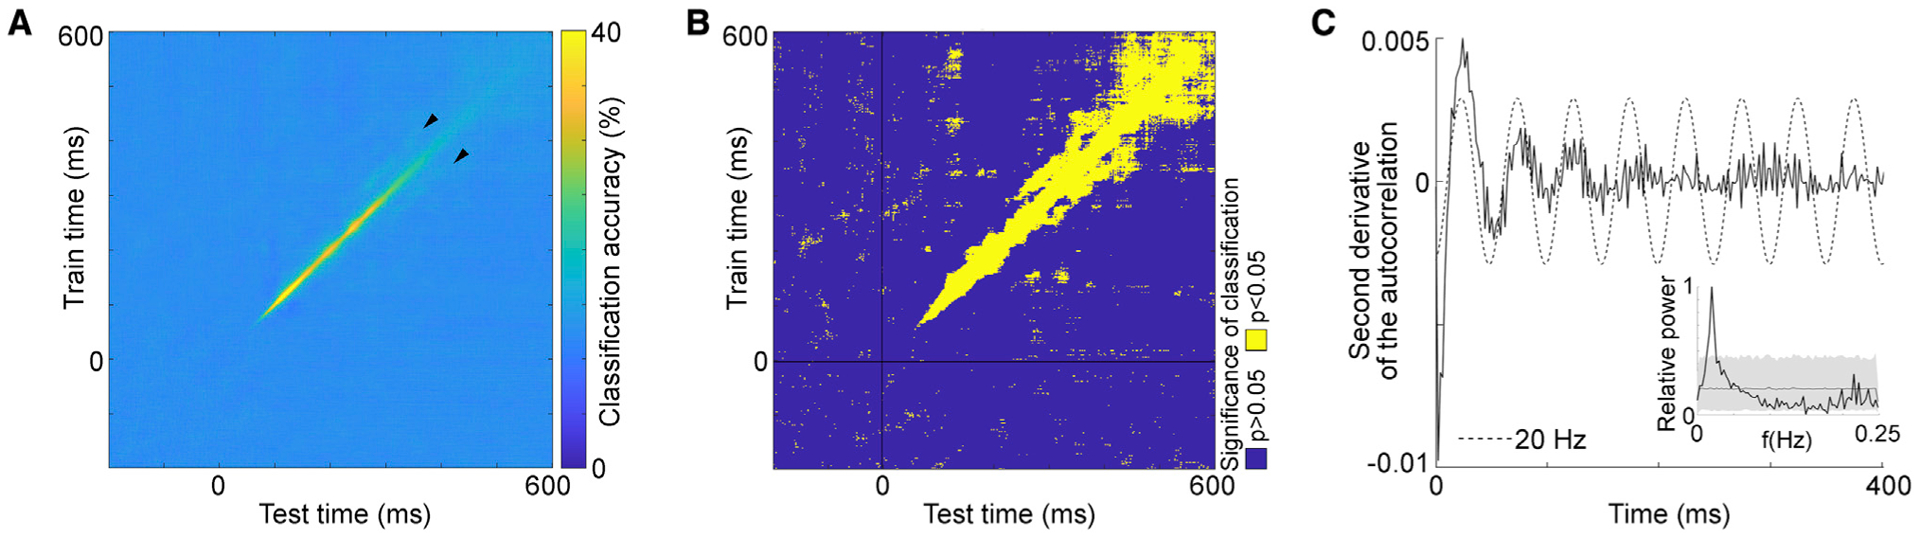
Cross-Temporal Generalization of Color Identity (corrected)
Source of the error: As described in the methods, raw MEG data were converted into raster files that integrate MEG sensor data with trial structure. Before rasterization, trials were marked by Brainstorm, an MEG data-processing program, based on the level of noise. Trials with excess noise, e.g., caused by eyeblinks, were marked as not usable. The mistake arose because these bad trials were inappropriately included in the analysis: the sensor data associated with bad trials were replaced with zeros and the condition labels deleted, resulting in a mismatch between a small subset of trials and their condition labels when the data were sorted by trial condition. The impact of the error was limited because participants were asked to blink between trials.
Corrections that do not change conclusions: The confidence interval (C.I.) of the time to reach significant color decoding across participants is [50, 70] (not [20, 70]); the time to reach peak decoding is 120 ms (not 115 ms) with a C.I. of [110, 130] (not [105, 125]). The C.I. of the time to peak for the second hump in the decoding time course is [170, 270] (not [190, 265]). The range of times-to-peak decoding across participants is 100 to 265 ms (not 95 to 260 ms). The p value for the ANOVA testing the impact of luminance polarity on classification accuracy is p = 0.82 (not p = 0.3697). The ANOVA showing a significant interaction of color decoding between warm-cool and luminance contrast is p = 0.0002 (not p = 0.0055). This interaction was evident for 35 ms (not 15 ms). Across the temporal evolution of the response, the only hue to show sustained higher decoding accuracy among luminance-matched hues for both light and dark hues was pink, as reported, but the duration of the sustained higher decoding was shorter (Video S1; 25–60 ms relative to peak decoding). Post hoc tests for asymmetries in color decoding for colors along the L-M axis are p = 0.88 (not p = 0.28), Bayes factor B10 = 0.25 (not 0.35); for colors across lightness levels are p = 0.91 (not p = 0.42), Bayes factor B10 = 0.24 (not 0.35). These results provide moderate support for the null hypothesis (not anecdotal support). The heatmap in Figure 2E is symmetric about the identity diagonal, Pearson correlation of r = 0.9841 (not r = 0.9665), p = 5 × 10⁻²¹ (not p = 7 × 10⁻¹⁷). The correlation coefficient in Figure 2F is r = 0.5 (not r = 0.32), p = 9 × 10⁻⁶ (not p = 0.007). The distance between hues across luminance contrast was greater for warm colors compared to cool colors, Kruskal-Wallis test, p = 9 × 10⁻⁷ (not p = 5 × 10⁻⁴). The duration of significance for Figure 3A was 350 ms (not 300 ms). The fits of the MDS panels in Figure 3D are, left to right: Pearson’s R = 0.90, p = 3 × 10⁻¹¹; R = 0.90, p = 4 × 10⁻¹¹; R = 0.92, p = 2 × 10⁻¹²; R = 0.97, p = 2 × 10⁻¹⁷; R = 0.98, p = 8 × 10⁻²⁰; R = 0.99, p = 5 × 10⁻²² (not R = 0.84, p = 2 × 10⁻⁸; R = 0.84, p = 3 × 10⁻⁸; R = 0.85, p = 2 × 10⁻⁸; R = 0.91, p = 1 × 10⁻¹¹; R = 0.94, p = 9 × 10⁻¹⁴; R = 0.95, p = 7 × 10⁻¹⁵). The C.I. of onset of decoding of term identity (green or blue) is [45, 70] (not [65, 70]), with a peak at 85 ms (not 100 ms) and the C.I. of the peak is [85, 155] (not [90, 120]).
Figure 3.
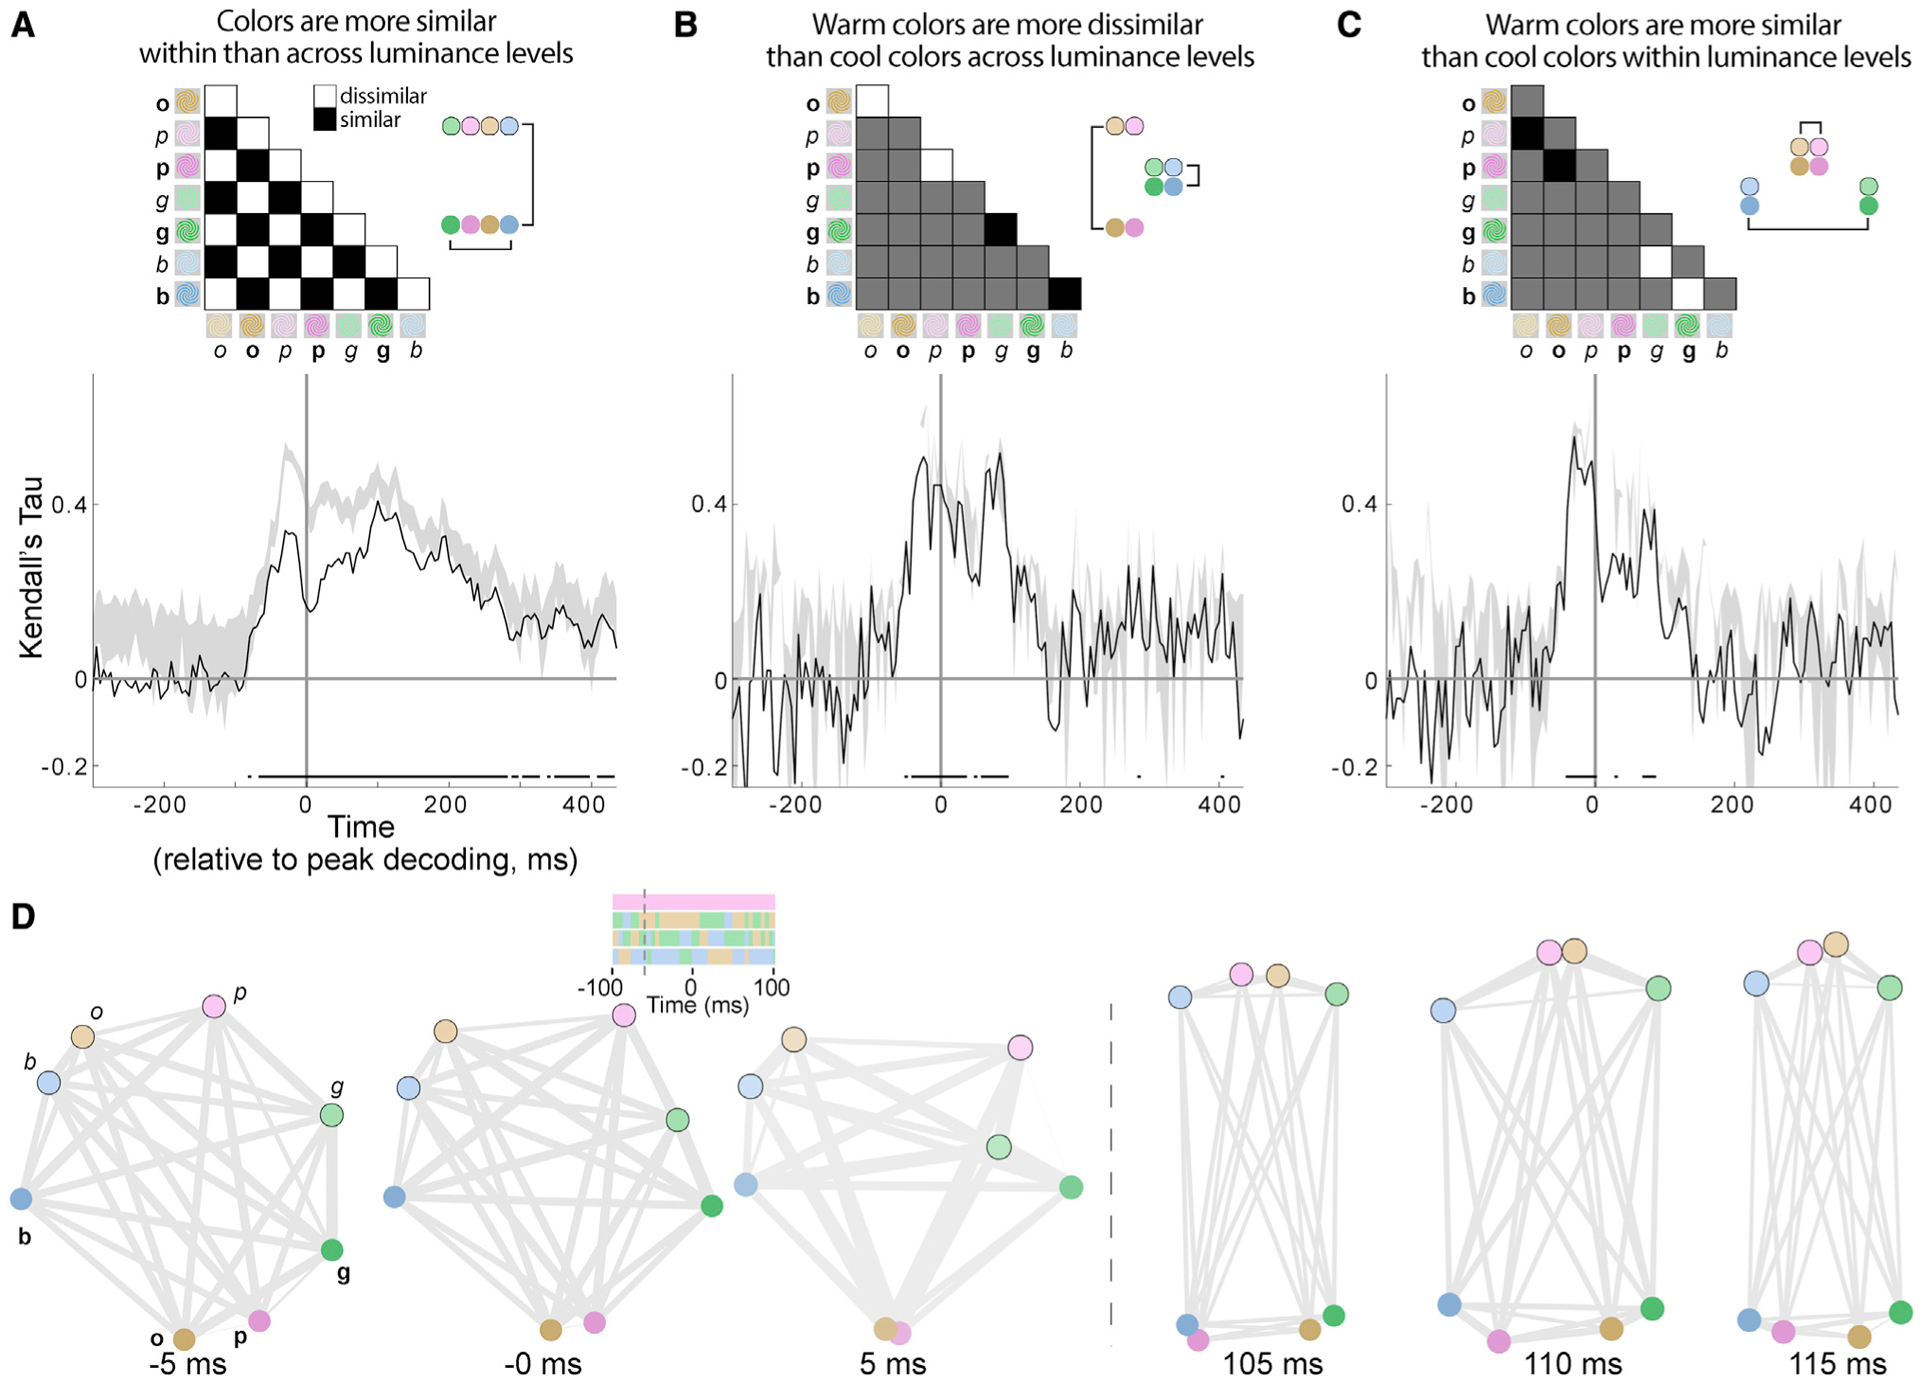
Similarity Relationships among Colors Determined by MEG (corrected)
Corrections that change conclusions: Light orange, not pink, was decoded with the shortest latency onset (Figures 2B and S1). At peak decoding, classification accuracy did not vary by hue (repeated-measures two-way ANOVA on rank-transformed data, p = 0.35, not p = 0.005). Post hoc tests for asymmetries in color decoding for colors along the S axis are p = 0.81 (not p = 0.014), B10 = 0.25 (not 5.4); for colors along the two intermediate axes are p = 0.036 (n.s. after Bonferroni correction p = 0.05/4), B10 = 2.0 (not 6.4). This changes the conclusions described in the fourth paragraph of the discussion, specifically that the lack of an asymmetry in decoding along the S axis suggests that the MEG results do not reflect subcortical activity, but rather representations encoded by the cortex.
Supplementary Material
Figure 4.
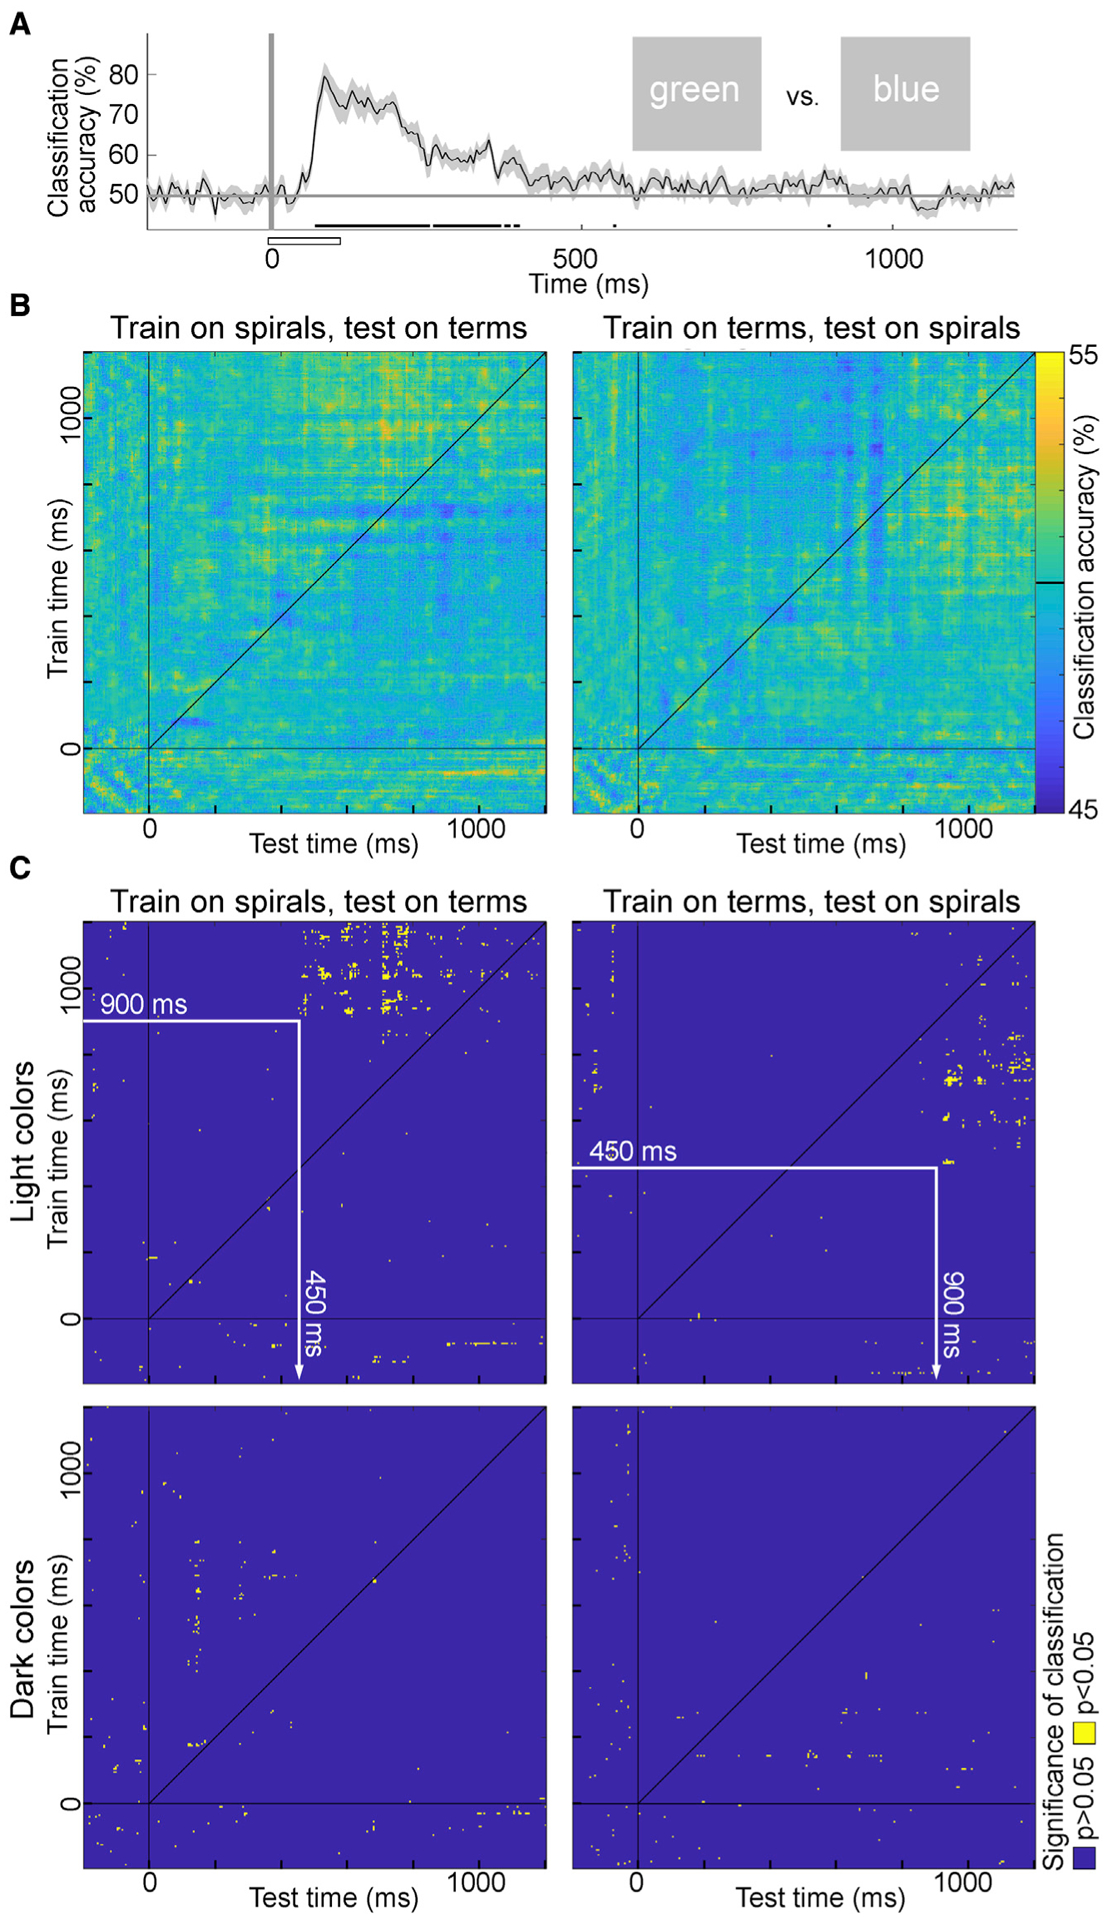
Decoding Color Appearance from Representations of Color Words (corrected)
Associated Data
This section collects any data citations, data availability statements, or supplementary materials included in this article.