Abstract
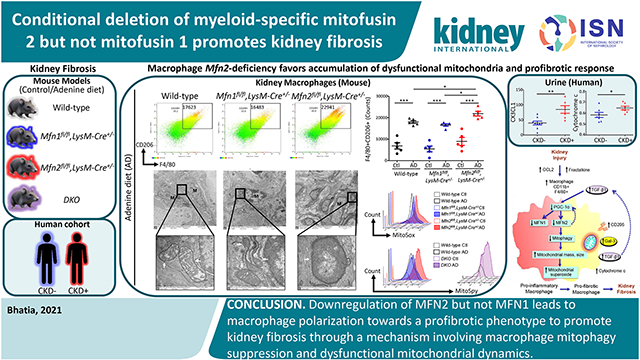
Macrophages exert critical functions during kidney injury, inflammation, and tissue repair or fibrosis. Mitochondrial structural and functional aberrations due to an imbalance in mitochondrial fusion/fission processes are implicated in the pathogenesis of chronic kidney disease. Therefore, we investigated macrophage-specific functions of mitochondrial fusion proteins, mitofusin (MFN)1 and MFN2, in modulating macrophage mitochondrial dynamics, biogenesis, oxidative stress, polarization, and fibrotic response. MFN1 and MFN2 were found to be suppressed in mice after adenine diet-induced chronic kidney disease, in transforming growth factor-beta 1-treated bone marrow-derived macrophages, and in THP-1-derived human macrophages (a human leukemic cell line). However, abrogating Mfn2 but not Mfn1 in myeloidlineage cells resulted in greater macrophage recruitment into the kidney during fibrosis and the macrophage-derived fibrotic response associated with collagen deposition culminating in worsening kidney function. Myeloid-specific Mfn1 /Mfn2 double knockout mice also showed increased adenine-induced fibrosis. Mfn2-deficient bone marrow-derived macrophages displayed enhanced polarization towards the profibrotic/M2 phenotype and impaired mitochondrial biogenesis. Macrophages in the kidney of Mfn2-deficient and double knockout but not Mfn1-deficient mice exhibited greater mitochondrial mass, size, oxidative stress and lower mitophagy under fibrotic conditions than the macrophages in the kidney of wild-type mice. Thus, downregulation of MFN2 but not MFN1 lead to macrophage polarization towards a profibrotic phenotype to promote kidney fibrosis through a mechanism involving suppression of macrophage mitophagy and dysfunctional mitochondrial dynamics.
Keywords: macrophage, kidney fibrosis, mitochondrial fusion, reactive oxygen species, mitophagy
Graphical Abstract
Introduction
Kidney comprises two heterogeneous populations of macrophages, resident macrophages with a longer life span and those differentiated from myeloid lineage in bone marrow and recruited from circulation.1 Kidney injury-induced chemokines, C-C motif chemokine ligand 2 (CCL2) and CX3CL1, favor recruitment of CCR2 and CX3CR1 expressing Ly6Chigh/pro-inflammatory and Ly6Clow/anti-inflammatory monocytes, respectively.2 Duration and type of kidney insult determine dominance of macrophage phenotypes (pro-inflammatory/M1 to anti-inflammatory/M2).1 M2 can also behave as profibrotic macrophages under progressive kidney injury, persistent inflammation with concomitant failure of tissue repair and resultant kidney fibrosis.
We have previously reported protective role of PINK1/MFN2/Parkin-mediated macrophage mitophagy against kidney fibrosis.3 In this study, we compared the effect(s) of macrophage-specific loss(s) of mitofusin (Mfn)-1 or Mfn2 or both on macrophage mitochondrial structure and functions, including biogenesis and mitophagy, and impact on kidney fibrosis. Mitochondrial health, homeostasis, and quality control are critical for normal kidney function,4 and progression of kidney diseases is linked to mitochondrial structural and functional aberrations.5,6,7,8
Mitochondrial fusion is facilitated via outer mitochondrial membrane (OMM) fusion proteins, MFN1 and MFN2, and inner mitochondrial membrane (IMM) fusion protein, optic atrophy 1 (OPA1).9 Mitochondrial fission is regulated by dynamin-related protein 1 (DRP1).10 Excessive fusion and fission contribute to mitochondrial hypertubulation and fragmentation, respectively, and their precise balance maintains a healthy mitochondrial network.9,10 MFN2 plays a crucial role in regulating mitophagy.3,11 DRP1-induced mitochondrial fragmentation also promotes mitochondrial recycling.12,13 Here, using an adenine diet (AD)-induced CKD model in myeloid-specific Mfn1 and Mfn2 conditional single knockout and double knockout (DKO) mice, primary cells, and CKD patient samples, we investigated macrophage-specific roles of mitofusins. MFN2 but not MFN1 prevented macrophage mitochondrial dysfunction and macrophage-derived progression of kidney fibrosis specifically through regulating mitochondrial biogenesis and mitophagy.
Methods
Mice.
Animal experiments were performed under protocols approved by the Institutional Animal Care and Use Committee of Weill Cornell Medicine. Mfn1loxp/loxp (029901-UCD) and Mfn2loxp/loxp (029902-UCD) mice generated by Dr. David C. Chan (California Institute of Technology) were purchased from Mutant Mouse Resource & Research Center. Myeloid-specific Mfn1 or Mfn2 gene single knockout and Mfn1/Mfn2 DKO strains were generated by crossing Mfn1loxp/loxp (Mfn1fl/fl) or Mfn2loxp/loxp (Mfn2fl/fl) or both lines, respectively, to a strain expressing Cre under control of endogenous promoter of lysozyme M (LysM-Cre strain;004781, Jackson Laboratory) to produce Mfn1fl/fl,LysM-Cre+/−, Mfn2fl/fl,LysM-Cre+/−, and DKO, respectively. These strains were of C57BL/6J background and fully backcrossed. Wild-type controls used for comparison with Mfn1fl/fl,LysM-Cre+/− and Mfn2fl/fl,LysM-Cre+/− mice were fl/fl Cre−/− Mfn1fl/fl,LysM-Cr−/− and Mfn2fl/fl,LysM-Cre−/− mice. Wild-type used for comparison with DKO were littermate Mfn1fl/flMfn2fl/fl,LysM-Cre−/− mice. Pink1−/− or Prkn (encoding Parkin)−/− mice were provided by Dr. Jie Shen (Brigham and Women’s Hospital, Harvard Medical School). C57BL/6 mice were purchased from the Jackson Laboratory. We used 8 to 12 weeks old sex-matched mice for the experiments.
AD-induced murine model of kidney fibrosis.
We had 12 different experimental groups (n ≥ 5 mice per group). Mice from each strain as discussed above were either fed with 0.2% of AD or control diet (Ctl) (Envigo#TD150071) for 28 days as previously described,3 and kidneys, whole blood, and urine were collected at euthanasia.
Cell culture and transfection.
BMDM were differentiated from bone marrow cell suspension using monocyte colony-stimulating factor (M-CSF,10ng/ml;Biolegend) for 7-days.14 Macrophages from THP-1 human monocytic cell line (ATCC#202) were derived using phorbol 12-myristate 13-acetate (PMA,10ng/ml;Sigma) for 3 days. BMDM or THP-1-derived macrophages were treated with TGF-β1 (5ng/ml) for 48 hours.
THP-1-derived macrophages were transfected with a pool of either Human SMARTpool on-target plus peroxisome proliferator-activated receptor-gamma coactivator-1 alpha (PGC-1α)-specific (L-005111-00-0005) or non-targeting (D-001810-10-05) siRNAs using transfection reagent (T-2001-01,Dharmacon,PerkinElmer).
Transmission electron microscopy.
Kidneys were fixed, dehydrated, and embedded in an EPON analog resin as previously described.3 Ultrathin sections on copper grids were contrasted with lead citrate and captured on electron microscope (JEM1400,JEOL).
Isolation of kidney macrophages.
Mouse kidney macrophages were isolated using Ficoll-Hypaque density gradient centrifugation,15 followed by magnetic-activated cell sorting as previously described.3
Flow cytometry.
Flow cytometry analyses were performed on kidney single-cell suspensions, sorted kidney macrophages, blood, and BMDM as previously described.3 The following antibodies were used: anti-CD45 (Biolegend), anti-F4/80, anti-CD11b, anti-Galectin-3 (Gal-3), anti-latency associated peptide (LAP/TGF-β1) (Biolegend), anti-Ly6C, and anti-CD206 (Thermo Fisher Scientific). Cells were captured using BD Accuri C6 or Fortessa flow cytometer, and analyzed using C6 analysis or FACSDiva (BD Biosciences) or FlowJo v.10.8 (Tree Star) software.
Measurement of mitochondrial size, mass, mitophagy, and superoxide levels by flow cytometry.
Kidney F4/80+ CD45+ cells were gated down to determine i) mitochondrial size by measuring colocalized signal from forward side scatter (represents size)-high (FSChigh) and MitoSpy green dye (a mitochondrial marker, Biolegend) stained population,10, ii) mitochondrial mass using mean fluorescence intensity (MFI) of MitoSpy green dye, and iii) mitochondrial-derived superoxide levels using MitoSox red dye as previously described.3
Kidney macrophage mitophagy was determined using mitophagy detection kit (Dojindo) by following manufacturer’s instructions,3,16,17 as previously described.3
Mitophagy in BMDM was measured using double-positive signals for MitoTracker Red (Invitrogen#M22426) and LysoTracker green (Invitrogen#L7526) dyes on F4/80+ cells by following manufacturer’s instructions.
Enzyme-linked immunosorbent assay (ELISA) and biochemical measurements.
Mouse urinary CCL2 was quantified using ELISA (LSBio;#LS-F271-1). Blood urea nitrogen (BUN) and creatinine from mouse sera samples were measured on an automated clinical chemistry analyzer (Beckman-Coulter,AU680).
Western blot.
Tissue and cell lysates were prepared as previously described.3 Membranes were subjected to antibodies against MFN1 (Novus#NBP1-71775), MFN2 (Cell Signaling Technology/CST#9482S), CD206 (Abcam#64693), Arginase-I (Arg-I;Santa Cruz Biotechnology/SCBT#271430), Gal-3 (SCBT#32790), fibronectin (FN,Abcam#2413), TGF-β1 (CST#3711S), alpha-smooth muscle actin (α-SMA,Abcam#ab5694), PGC-1α (Abcam#54481;EMDMillipore#ST1202), GAPDH (CST#2118), and β-actin (CST#3700). Bands were visualized and quantified using ImageJ/Fiji software version 1.46 (NIH).
Immunohistochemistry.
Kidney tissues were fixed overnight in 4% paraformaldehyde, dehydrated in 70% ethanol, and embedded in paraffin blocks. 4 μm thin sections were deparaffinized, stained with Masson’s trichrome, and analyzed for collagen deposition using EVOS cell imaging system (Life Technologies).
Confocal microscopy.
BMDM were stained using antibodies against TIM23 (BD Biosciences#611223) and microtubule-associated protein light chain 3 (LC3,Sigma-Aldrich#L7543) or with MitoTracker Deep Red and LysoTracker green dyes and mounted using DAPI (Invitrogen#P36962). Images were captured on Zeiss LSM 880 confocal microscope at 60x magnification and processed using ImageJ/Fiji software.
Statistics.
Data are provided as arithmetic means ± SEM and n represents number of animals or human specimens (patients or controls). Sample size for each group was ≥5. Data were analyzed using one-way analysis of variance (ANOVA) followed by Newman-Keuls post-hoc test. Comparison between two groups was performed by Student's unpaired t-test. For the experiments performed on the same sets of mice, expression of markers was considered to be significantly different if both the P-value and q-value for false discovery rate (FDR) were <0.05. FDR was determined using a two-stage linear step-up procedure of Benjamini, Krieger and Yekutieli after one-way ANOVA. Analysis was performed using GraphPad Prism 5. FDR was determined using GraphPad Prism 9.3.0.
Results
Mitochondrial fusion proteins MFN1 and MFN2 are downregulated in experimental kidney fibrosis and TGF-β1 treated macrophages.
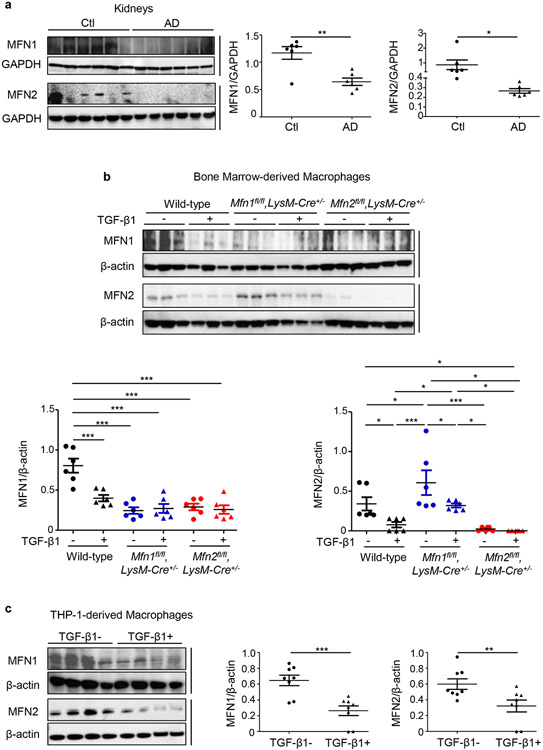
Expression of MFN1 (84 KDa) and MFN2 (84 KDa) was decreased in the kidneys after 28 days of AD than Ctl (Figure 1a). Ratio of large (L, 92 KDa)/small (S, 80 KDa)-OPA1 was also decreased in the kidneys after AD (Supplementary Figure S1a). Whereas, expression of DRP1 (82 KDa), and its phosphorylation at serine-616 (82 KDa, p-DRP1-Ser-616) representing DRP1 translocation to mitochondria to induce fission,13 increased (Supplementary Figure S1a). MFN1 and MFN2 in BMDM (Figure 1b) and THP-1-derived macrophages (Figure 1c) decreased with TGF-β1 treatment. Ratio of L/S forms of OPA1 in BMDM also decreased while expression of DRP1 and p-DRP1-Ser-616 was increased with TGF-β1 treatment (Supplementary Figure S1b).
Figure 1. Mitochondrial fusion protein expression is suppressed in a murine model of kidney fibrosis and TGF-β1 treated macrophages.
Western blot and densitometry analysis for the expression of Mitofusin 1 (MFN1) and Mitofusin 2 (MFN2) in a) kidney tissue lysates from wild-type mice fed with control (Ctl) or adenine diet (AD) (n = 6 per group) for 28 days, normalized to GAPDFI; b) bone marrow-derived macrophages (BMDM) isolated from wild-type, Mfn1fl/fl,LysM-Cre+/− and Mfn2fl/fl,LysM-Cre+/− mice (n = 6 per group) and c) THP-1-derived human macrophages (n = 8 per group) cultured in the absence (−) or presence (+) of TGF-β1 (5 ng/ml) for 48 hours, normalized to β-actin. Data are mean ± SEM representative of 3 independent experiments. *P < 0.05, **P < 0.01, ***P < 0.001, analyzed by student’s unpaired 1-tailed t-test (a, c) or one-way ANOVA followed by Newman-Keuls post-hoc test (b).
Using unilateral ureteral obstruction (UUO) model of kidney fibrosis, we also observed downregulated expression of MFN1 (green, Supplementary Figure S2a) and MFN2 (green, Supplementary Figure S2b) and decreased colocalization with mitochondrial marker TIM23 (red) in the obstructed kidneys after 7 days of UUO compared to sham. Kidney macrophages (CD11b+ F4/80+, Supplementary Figures S2c,S2d), and proximal tubules (PT, megalin+, Supplementary Figures S2e,S2f) from obstructed kidneys also displayed lower expression of MFN1 and MFN2 than sham mice.
Colocalization of MFN2 with TIM23 was further reduced in the Pink1−/− mouse kidney, suggesting PINK1-dependent regulation of mitochondrial MFN2. Kidney macrophages and PT from Pink1−/− or Prkn−/− mice displayed lower expression of MFN2 but not MFN1 (Supplementary Figures S2c,S2d,S2e,S2f). During oxygen deprivation, the expression of MFN2 but not MFN1 was reduced by 40%.18 We earlier observed that Pink1-deficient BMDM displayed lower oxygen consumption rate and higher production of mitochondrial-derived reactive oxygen species (mROS).3 Increased mROS and number of dysfunctional mitochondria in Pink1 or Prkn-deficient cells may contribute to a reduction in the expression of MFN2 but not MFN1.
In primary BMDM from Mfn1fl/fl,LysM-Cre+/− and Mfn2fl/fl,LysM-Cre+/− mice, we confirmed little to no detectable expression of MFN1 and MFN2, respectively (Figure 1b). Interestingly, BMDM (Figure 1b) from Mfn1fl/fl,LysM-Cre+/− mice and Mfn1-deficient kidney macrophages from Ctl or AD-fed mice (Supplementary Figure S3) displayed increased expression of MFN2, whereas BMDM from Mfn2fl/fl,LysM-Cre+/− mice showed reduced expression of MFN1.
Mitochondrial biogenesis regulator modulates MFN1 and MFN2 expression in macrophages.
We next studied the role of PGC-1α, the chief regulator of mitochondrial biogenesis in modulating expression of mitofusins in macrophages. MFN2 is known to induce PGC-1α, which in turn promotes Mfn1 at transcriptional level by coactivating estrogen-related receptor alpha (ERRα).19 PGC-1α also activates promoter region of Mfn2.20
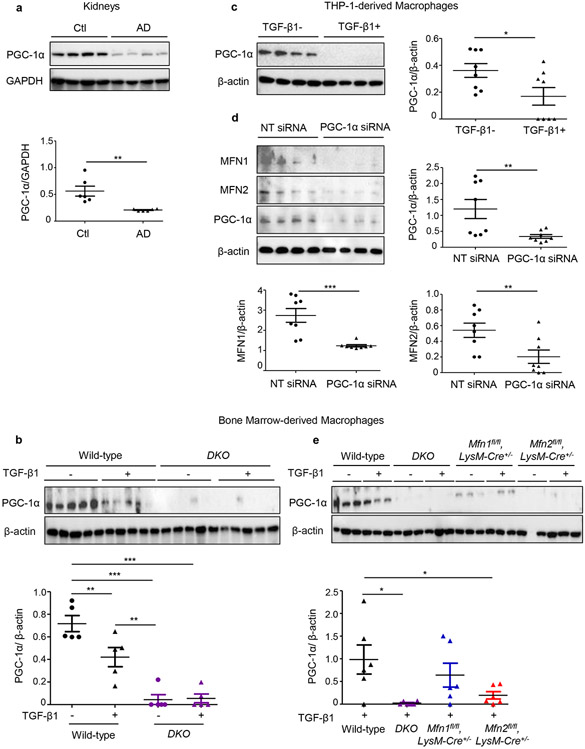
PGC-1α expression decreased in the kidneys after AD (Figure 2a) and BMDM (Figure 2b) and THP-1-derived macrophages (Figure 2c) after TGF-β1 treatment. The siRNA-based knockdown of PGC-1α in THP-1 derived macrophages, resulted in decreased expression of MFN1 and MFN2 (Figure 2d). Mfn1-, Mfn2-deficient, and DKO BMDM displayed reduced expression of PGC-1α, suggesting that mitofusins in turn also regulate PGC-1α (Figures 2b,2e). However, TGF-β1 treated Mfn2-deficient and DKO but not Mfn1-deficient BMDM displayed further lower expression of PGC-1α than wild-type BMDM, suggesting that a compensatory increase in MFN2 expression in Mfn1-deficient BMDM is potentially regulated via PGC-1α. Reduced expression of PGC-1α in Mfn2-deficient macrophages is directly related to a decrease in MFN1 expression.
Figure 2. Mitochondrial biogenesis is impaired during experimental kidney fibrosis and PGC-1α regulates expressions of MFN1 and MFN2 in macrophages.
Western blot and densitometry analysis for the expression of PGC-1α in a) kidney tissue lysates from wild-type mice fed with control (Ctl) or adenine diet (AD) (n = 6 per group) for 28 days, normalized to GAPDH; b) bone marrow-derived macrophages (BMDM) isolated from wild-type, Mfn1/Mfn2 double knockout (DKO) mice treated with TGF-β1 (5 ng/ml) for 48 hours (n = 5 per group), normalized to β-actin (n = 5 per group), c) THP-1-derived human macrophages mice treated with TGF-β1 (5 ng/ml) for 48 hours (n = 8 per group), d) MFN1, MFN2 expression in THP-1-derived human macrophages transfected with PGC-1α siRNA or non-targeting (NT) control siRNA (n = 8 per group), normalized to β-actin. e) PGC-1α expression in BMDM isolated from wild-type, DKO, Mfn1-, Mfn2- deficient mice treated with TGF-β1 (5 ng/ml) for 48 hours (n = 6 per group), normalized to β-actin Data are mean ± SEM representative of 3 independent experiments. *P < 0.05, **P < 0.01, ***P < 0.001, analyzed by student’s unpaired 1-tailed t-test (a, c, d) or one-way ANOVA followed by Newman-Keuls post-hoc test (b, e).
Myeloid-specific deletion of Mfn2 but not Mfn1 promotes kidney fibrosis and worsening kidney function.
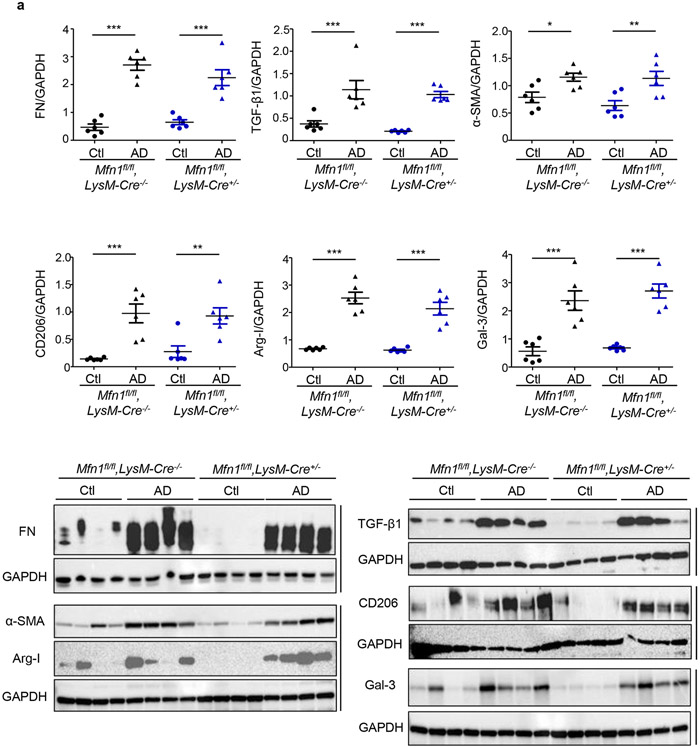
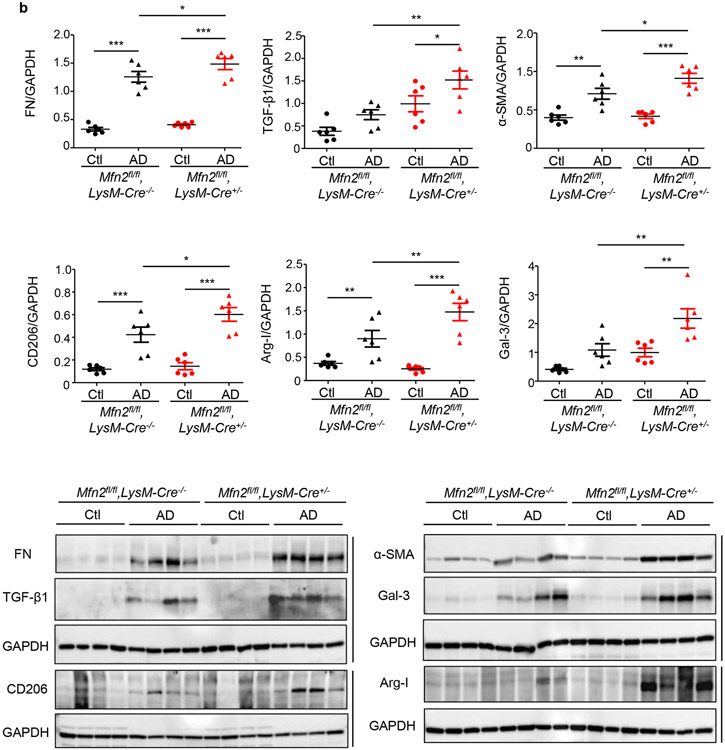
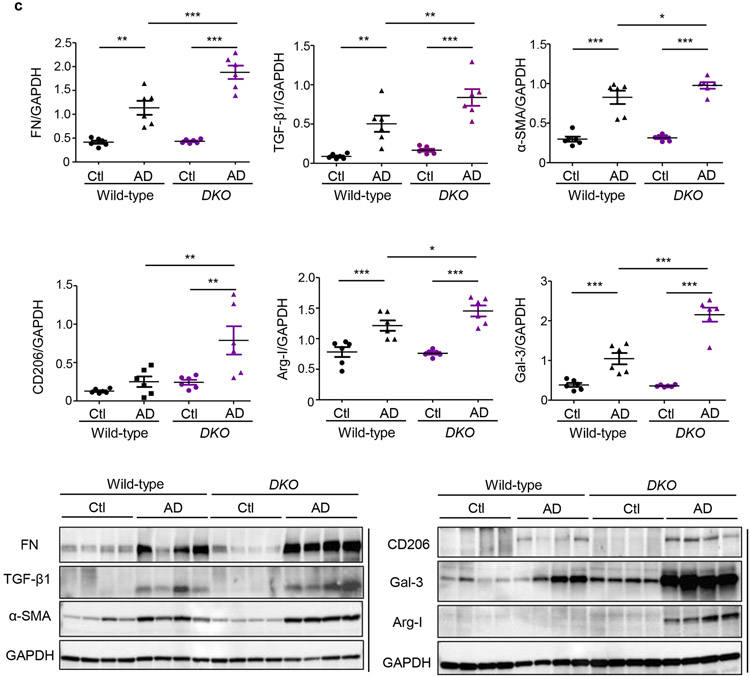
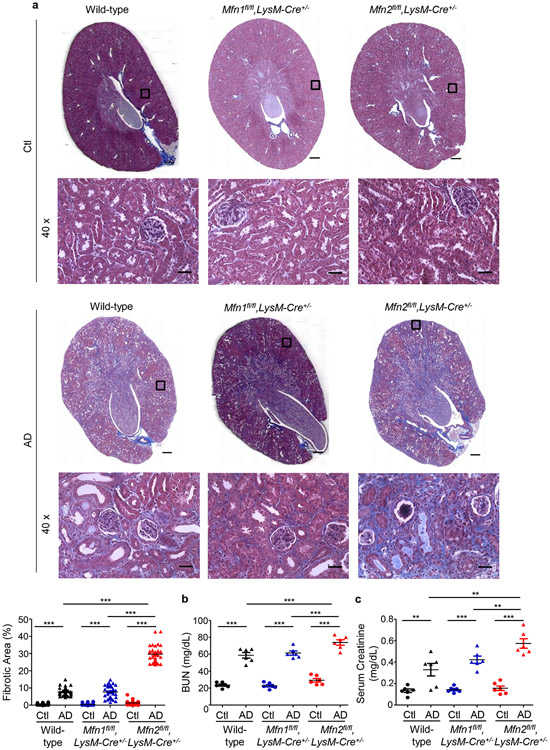
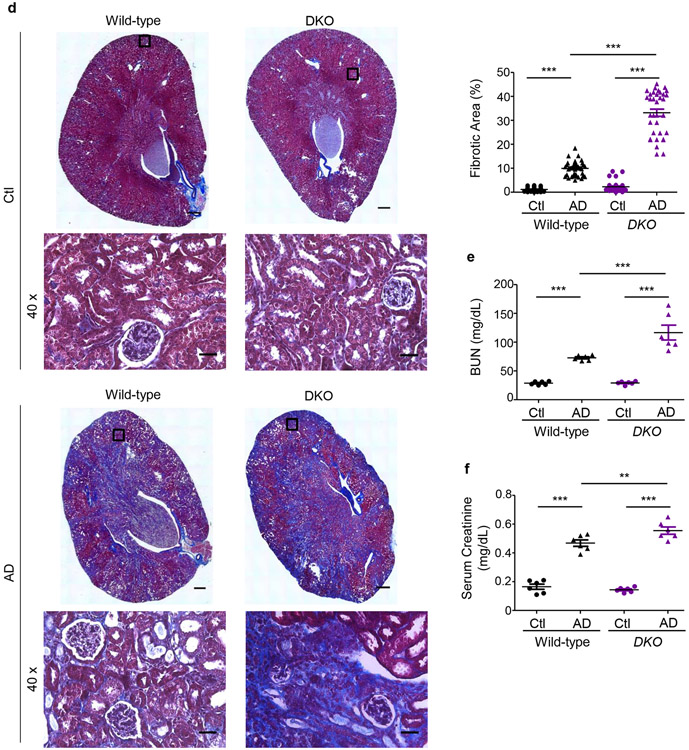
We first compared fibrotic responses in the kidneys. Mfn1fl/fl,LysM-Cre+/− and Mfn1fl/fl,LysM-Cre−/− mice showed similar increases in expression of profibrotic/M2 macrophage, Arg-I (35 kDa), Gal-3 (26 kDa), CD206 (190 kDa) and fibrotic, FN (220 kDa), TGF-β1 (12.5 kDa), and α-SMA (42 kDa) markers in the kidney after 28-days of AD than Ctl (Figure 3a). However, AD-fed Mfn2fl/fl,LysM-Cre+/− and DKO mice displayed higher expression of these profibrotic markers compared to corresponding controls (Figures 3b,3c), indicating enhanced fibrotic response in the kidney in absence of MFN2 but not MFN1 in myeloid cells. Moreover, Mfn2fl/fl,LysM-Cre+/− (Figures 4a,4b,4c) and DKO (Figures 4d,4e,4f) mice also showed a higher collagen deposition and worsening kidney function than Mfn1fl/fl,LysM-Cre+/− and wild-type mice.
Figure 3. Myeloid cell-specific conditional deletion of Mfn2 but not Mfn1 aggravates kidney fibrosis.
a - c) Representative western blots and densitometry analysis in kidney tissue lysates for the expression of fibronectin (FN), TGF-β1, alpha-smooth muscle actin (α-SMA), CD206, arginase-I (Arg-I), and galectin-3 (Gal-3) from mice fed with control (Ctl) or adenine diet (AD) for 28 days in a) Mfn1fl/fl,LysM-Cre-−/− and Mfn1fl/fl,LysM-Cre+/− mice; b) Mfn2fl/fl,LysM-Cre-−/− and Mfn2fl/fl,LysM-Cre+/− mice, and c) Wild-type and Mfn1/Mfn2 double knockout (DKO) mice, normalized to GAPDH, n = 6 per group. Data are mean ± SEM representative of 3 independent experiments. *P < 0.05, **P < 0.01, ***P < 0.001, analyzed by one-way ANOVA followed by Newman-Keuls post-hoc test.
Figure 4. Myeloid cell-specific conditional deletion of Mfn2 but not Mfn1 contributes to collagen deposition and kidney function decline.
a) Representative Masson’s trichrome-stained kidney tissue sections (tissue scans at 20x and magnified images at 40x magnifications) and collagen quantification from wild-type, Mfn1fl/fl,LysM-Cre+/− and Mfn2fl/fl,LysM-Cre+/− mice fed with Ctl or AD for 28 days (n = 6 per group). Scale bars: 200 μm. b) Blood urea nitrogen (BUN) and c) serum creatinine levels in wild-type, Mfn1fl/fl,LysM-Cre+/− and Mfn2fl/fl,LysM-Cre+/− mice (n = 6 per group) fed Ctl or AD for 28 days. d) Representative Masson’s trichrome-stained kidney tissue sections (tissue scans at 20x and magnified images at 40x magnifications) and quantification of collagen from wild-type and Mfn1/Mfn2 double knockout (DKO) mice fed with Ctl or AD for 28 days (n = 6 per group). Fibrosis quantification was performed on 6 areas per sample from Ctl and AD, using ImageJ/FIJI. Scale bars: 200 μm. e) Blood urea nitrogen (BUN) and f) serum creatinine levels in wild-type and DKO mice fed with Ctl or AD, (n = 6 per group) for 28 days. Data are mean ± SEM representative of 3 independent experiments. *P < 0.05, **P < 0.01, ***P < 0.001, analyzed by one-way ANOVA followed by Newman-Keuls post-hoc test.
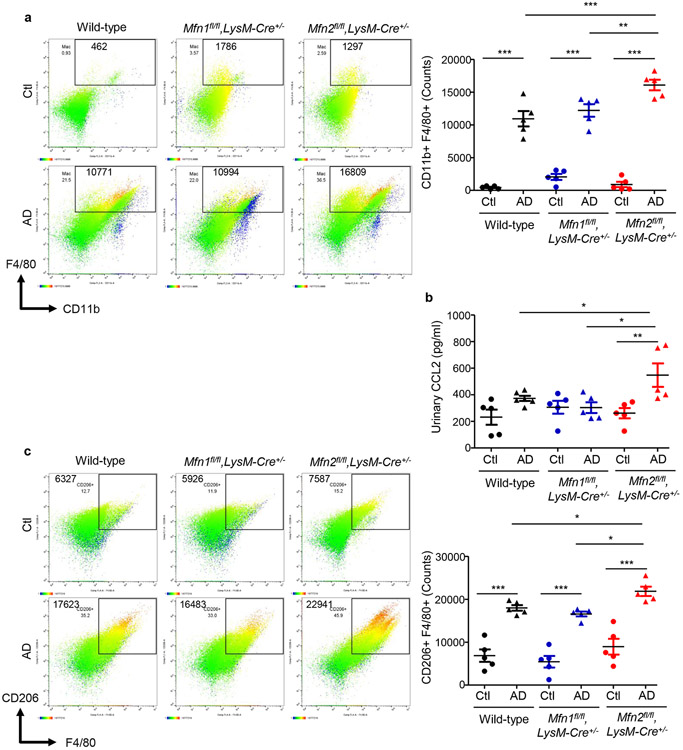
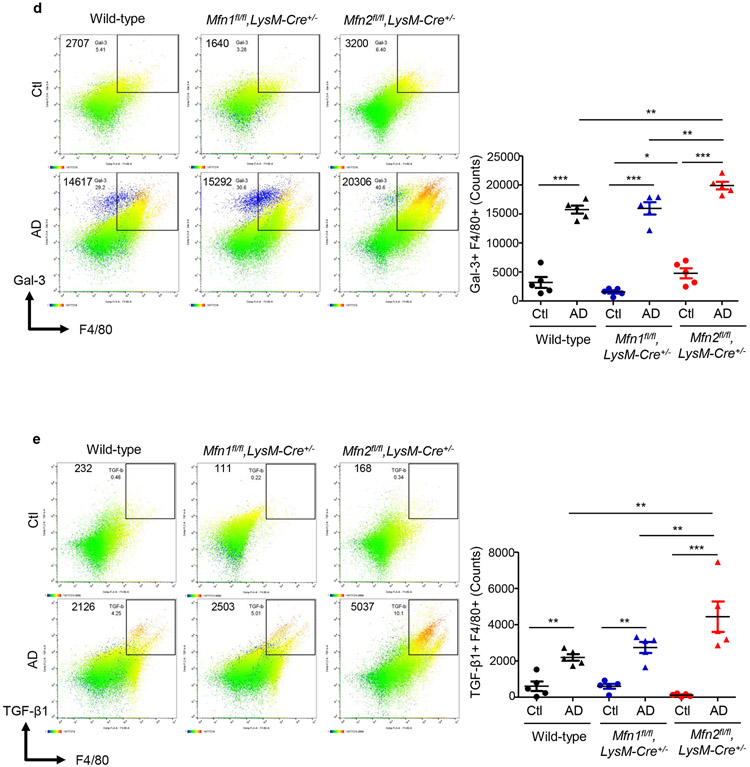
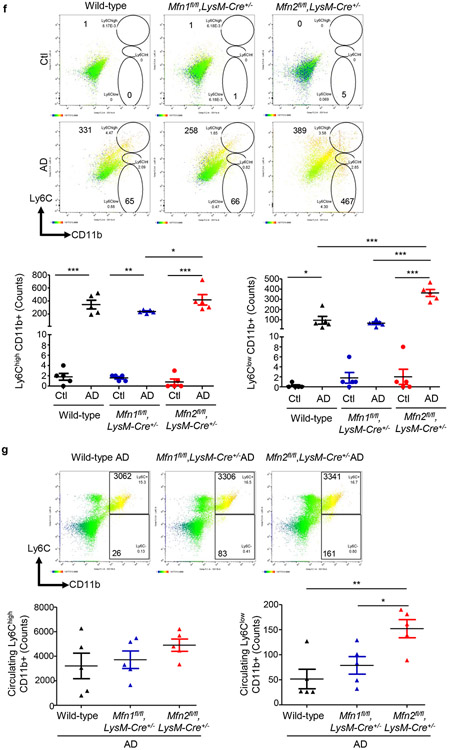
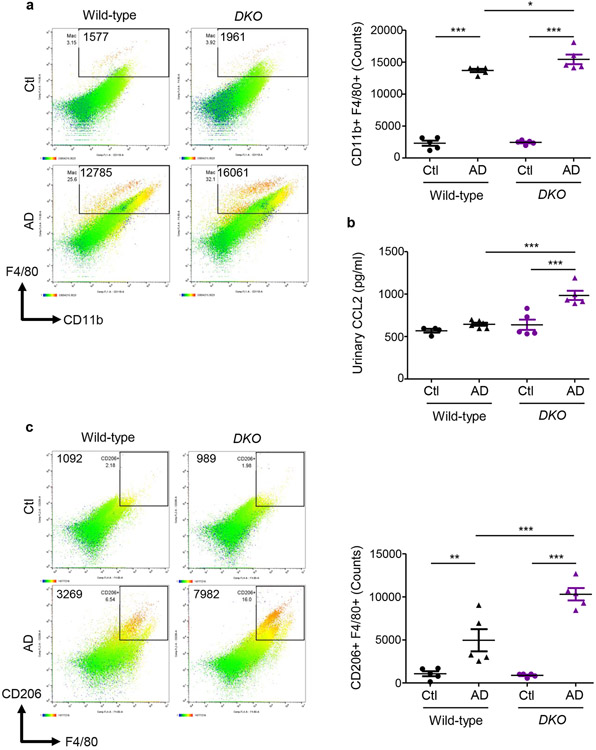
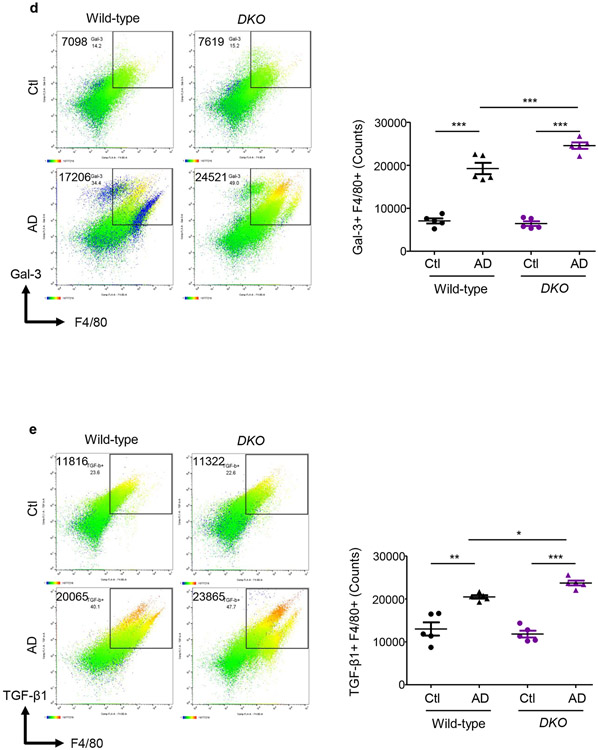
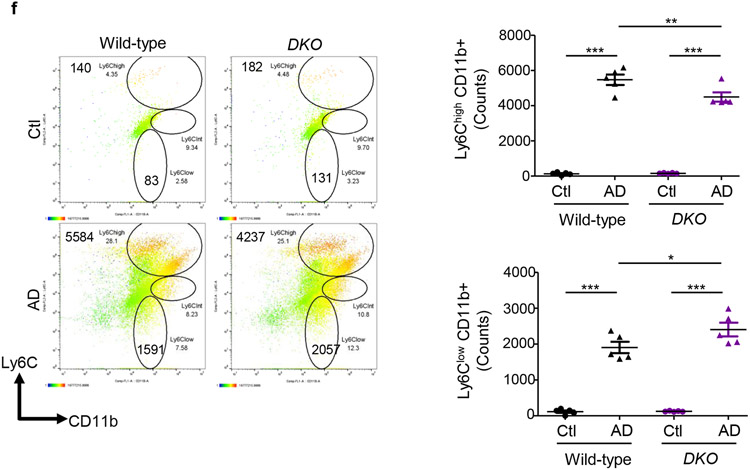
AD-fed Mfn2fl/fl,LysM-Cre+/− mice displayed higher numbers of kidney macrophages and greater urinary CCL2 levels than AD-fed Mfn1fl/fl,LysM-Cre+/−, and wild-type mice (Figures 5a,5b). Tubular cell-derived CCL2 promotes macrophage recruitment and tubulointerstitial fibrosis in the kidney and may contribute to urinary CCL2 excretion.21 Frequencies of CD206+ (Figure 5c) Gal-3+ (Figure 5d) and TGF-β1+ (Figure 5e) F4/80+ populations equally increased in the kidneys of wild-type and Mfn1fl/fl,LysM-Cre+/− mice after AD than Ctl. However, F4/80+ macrophages from AD-fed Mfn2fl/fl,LysM-Cre+/− mice displayed higher expression of CD206, Gal-3 and TGF-β1 than Mfn1fl/fl,LysM-Cre+/− and wild-type mice (Figures 5c,5d,5e). In addition, Mfn2fl/fl,LysM-Cre+/− showed increased kidney (Figure 5f) and circulating (Figure 5g) Ly6ClowCD11b+ monocytes after AD. AD-fed Mfn2fl/fl,LysM-Cre+/− mice displayed greater frequencies of Ly6Chigh monocytes than AD-fed Mfn1fl/fl,LysM-Cre+/− but not wild-type mice. DKO mice also displayed increased numbers of macrophages and expression of CD206, Gal-3 and TGF-β1 on F4/80+ cells and Ly6ClowCD11b+ monocytes while lower Ly6ChighCD11b+ cells in the kidney, and greater urinary CCL2 (Figures 6a,6b,6c,6d,6e,6f) and plasma CCL2 and CX3CL1 levels than their corresponding controls (Supplementary Figures S4a,S4b).
Figure 5. Myeloid cell-specific Mfn2 but not Mfn1 prevents macrophage-derived profibrotic response during kidney fibrosis.
Wild-type, Mfn1fl/fl,LysM-Cre+/− and Mfn2fl/fl,LysM-Cre+/− mice were fed with control (Ctl) or adenine (AD) diet for 28-days. a) Representative flow cytometric plots and analysis showing the numbers of F4/80+ CD11b+ cells in the kidney, b) Urinary chemokine CCL2 levels. c - e) Representative flow cytometric data and analysis showing the counts of CD206+ F4/80+ (c), galectin-3 (Gal-3)+ F4/80+ (d), and TGF-β1+ F4/80+ (e) cells in the kidney. f - g) Representative flow cytometric data and analysis showing the counts of Ly6Chigh and Ly6Clow CD11b+ monocytes in the kidney (f) after Ctl or AD diet and blood (g) after AD-diet fed for 28-days. Data are mean ± SEM representative of 3 independent experiments, (n = 5 per group). *P < 0.05, **P < 0.01, ***P < 0.001, analyzed by one-way ANOVA followed by Newman-Keuls post-hoc test.
Figure 6. Myeloid cell-specific Mfn1/Mfn2 double knockout (DKO) mice display greater macrophage infiltration into the kidney and macrophage-induced fibrotic response.
Wild-type and DKO mice were fed with control (Ctl) or adenine (AD) diet for 28-days. a) Representative flow cytometric plots and analysis showing the numbers of F4/80+ CD11b+ cells in the kidney. b) Urinary chemokine CCL2 levels. c - f) Representative flow cytometric data showing the counts of CD206+ F4/80+ (c), galectin-3 (Gal-3)+ F4/80+ (d), TGF-β1+ F4/80+ (e) kidney macrophages, and Ly6Chigh and Ly6Clow CD11b+ monocytes (f) (n = 5 per group). Data are mean ± SEM representative of 3 independent experiments. *P < 0.05, **P < 0.01, ***P < 0.001, analyzed by one-way ANOVA followed by Newman-Keuls post-hoc test.
Mfn2-deficient BMDM display a higher potency to polarize towards profibrotic/M2 phenotype.
To further understand the effect of genetic deletion of Mfn1 or Mfn2 in macrophages on their profibrotic response, we isolated BMDM from single knockouts, DKO, and controls. Mfn2-deficiency in BMDM was associated with a higher capacity to polarize towards profibrotic/M2 phenotype as determined by increased expression of CD206, FN, and Arg-I by western blot analyses (Supplementary Figure S5a). Flow cytometry data further confirmed increased CD206+F4/80+ profibrotic/M2 macrophages in the Mfn2-deficient BMDM (Supplementary Figure S5b).
Deficiency of Mfn2 but not Mfn1 in myeloid cells increases kidney macrophage mitochondrial size, mass, oxidative stress, and mitochondrial damage by reducing mitophagy.
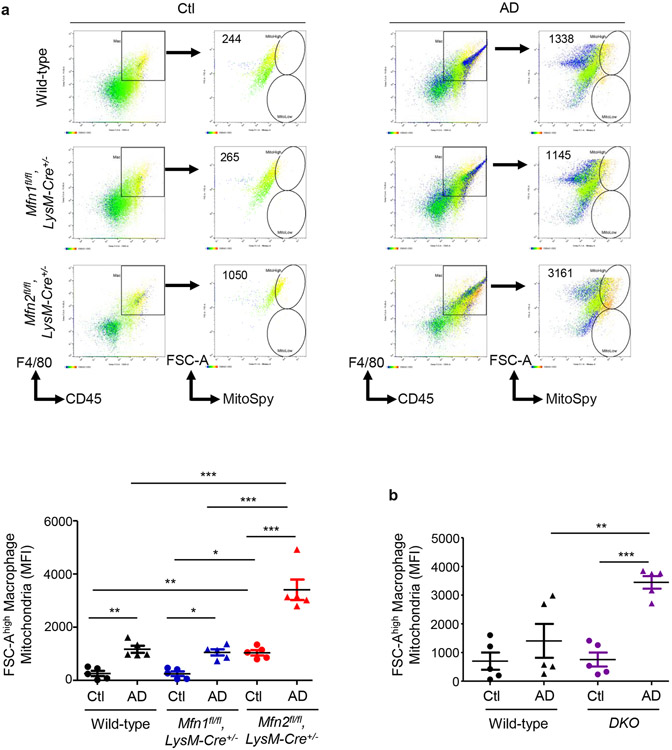
Through morphometric analysis of mitochondria (10) in the kidney mononuclear phagocytic cells (F4/80+ CD45+), we observed two populations of varying sizes of mitochondria, FSChigh and FSClow in AD-fed mice than only the FSChigh population in Ctl-fed mice, suggesting increased heterogeneity in mitochondrial morphology during kidney fibrosis. Mitochondrial size of mononuclear phagocytic population increased after AD in both wild-type and Mfn1fl/fl,LysM-Cre+/− mice than Ctl (Figure 7a). Interestingly, FSChigh mitochondria of greater size from F4/80+ CD45+ cells from Ctl or AD-fed Mfn2fl/fl,LysM-Cre+/− mice was significantly higher than Mfn1fl/fl,LysM-Cre+/− and wild-type mice (Figure 7a). DKO kidney macrophages from AD-fed mice also displayed an increased number of FSChigh mitochondria (Figure 7b). Ultrastructural analysis of kidneys demonstrated that mitochondrial size of kidney macrophages from Ctl or AD-fed Mfn2-deficient mice was larger than Mfn1-deficient and wild-type kidney macrophages (Figure 7c).
Figure 7. Deficiency of Mfn2 but not Mfn1 results in increased kidney macrophage mitochondrial size and mitochondrial mass in adenine-induced kidney fibrosis.
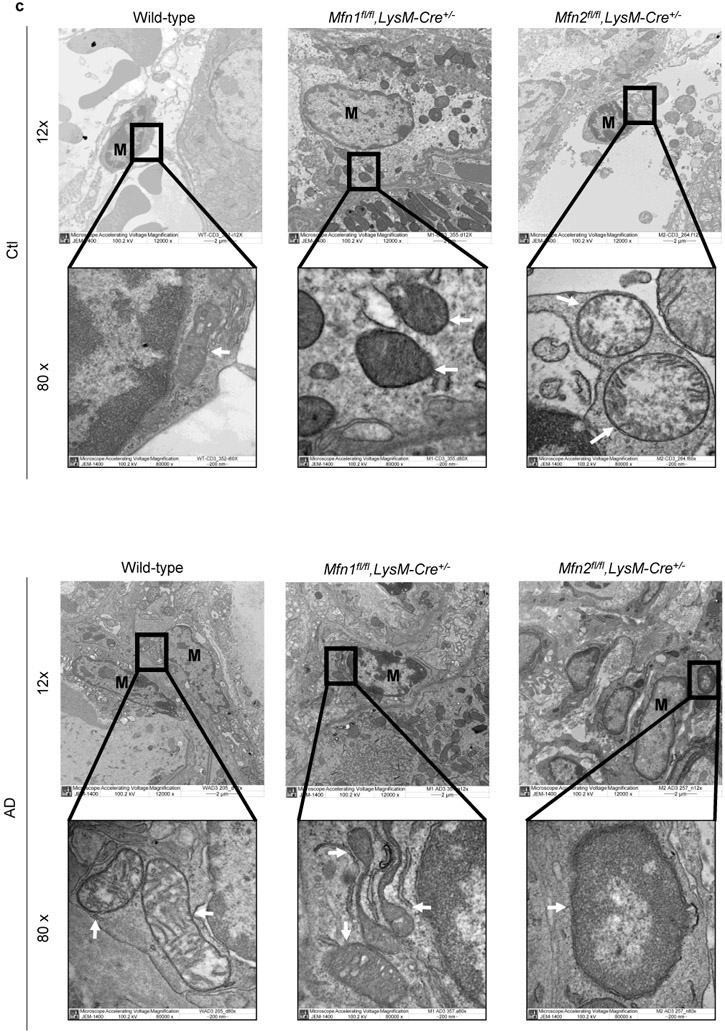
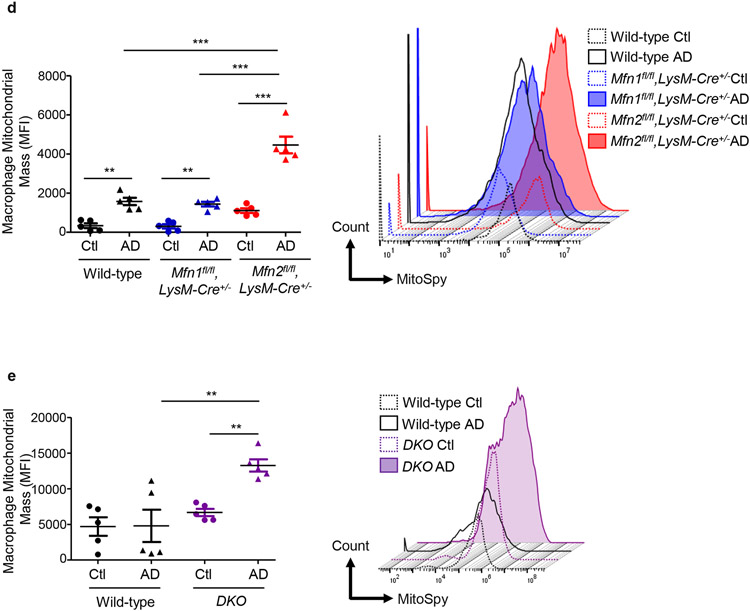
a, b) Representative flow cytometric plots and analysis showing the numbers of forward side scatter high (FSChigh) and MitoSpy dye double positive cells, gated from F4/80+ CD45+ population in the kidneys from control (Ctl) or adenine diet (AD) fed wild-type, Mfn1fl/fl,LysM-Cre+/−, and Mfn2fl/fl,LysM-Cre+/− mice (a), and wild-type and Mfn1/Mfn2 double knockout (DKO) (b) for 28-days. c) Representative transmission electron microscopy (TEM) images displaying kidney macrophages (labeled as M; 12,000X magnification; Scale bars: 2 μm) and their mitochondria (pointed by arrow, 80,000X magnification; Scale bars: 200 nm) in wild-type, Mfn1fl/fl,LysM-Cre+/−, and Mfn2fl/fl,LysM-Cre+/− mice after 28 days of control (Ctl) or adenine (AD) diet. d-e) Representative histogram and mean fluorescence intensity (MFI) of MitoSpy dye gated from F4/80+ CD45+ population in the kidneys from Ctl or AD fed wild-type, Mfn1fl/fl,LysM-Cre+/−, and Mfn2fl/fl,LysM-Cre+/− mice (d) and wild-type and DKO mice (e) for 28 days. Data are mean ± SEM representative of 3 independent experiments, (n = 5 per group). *P < 0.05, **P < 0.01, ***P < 0.001, analyzed by one-way ANOVA followed by Newman-Keuls post-hoc test.
Kidney macrophage mitochondrial mass increased similarly after AD in both wild-type and Mfn1fl/fl,LysM-Cre+/− mice than Ctl (Figure 7d). However, mitochondrial mass of kidney macrophages from AD-fed Mfn2fl/fl,LysM-Cre+/− was higher than Mfn1fl/fl,LysM-Cre+/− and wild-type mice (Figure 7d). DKO kidney macrophages also displayed mitochondrial hyperaccumulation (Figure 7e).
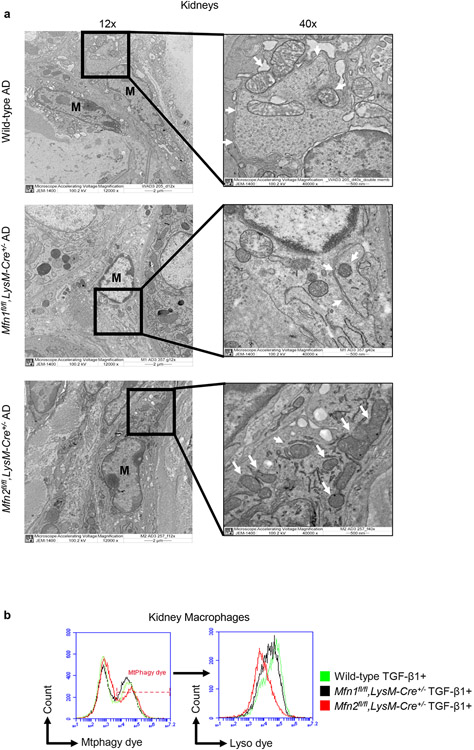
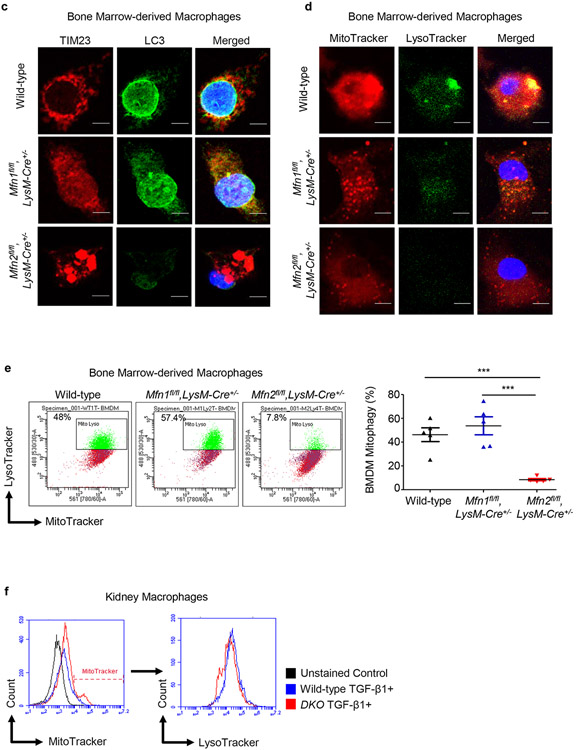
To understand the cause of higher mitochondrial aggregation associated with deficiency of Mfn2 but not Mfn1 in myeloid cells, we next studied the role of mitophagy. Electron microscopy revealed double-membrane vesicles containing mitochondria (mitophagosomes) in the kidney macrophages from AD-fed wild-type and Mfn1fl/fl,LysM-Cre+/− mice but not Mfn2fl/fl,LysM-Cre+/− mice (Figure 8a). Due to defective mitophagic response, Mfn2-deficient kidney macrophages displayed an increased number of accumulated abnormal mitochondria with disorganized cristae after AD. TGF-β1 treated Mfn2-deficient kidney macrophages displayed lower mitophagy than Mfn1-deficient and wild-type macrophages as confirmed by a shift in the MFI of co-localized signal from Mtphagy and Lyso dyes (Figure 8b).
Figure 8. Mitophagy is impaired in Mfn2-deficient macrophages.
a) Representative transmission electron microscopy (TEM) images displaying kidney macrophages (labeled as M; 12,000X magnification; Scale bars: 2 μm) and presence/absence of the double-membrane vesicle containing mitochondria (pointed by arrow, 40,000X magnification; Scale bars: 500 nm) in wild-type, Mfn1fl/fl,LysM-Cre+/−, and Mfn2fl/fl,LysM-Cre+/− mice after 28 days of adenine (AD) diet. b) Representative histograms for the detection of Mtphagy dye stained mitochondria gated for lyso dye positive lysosomes by flow cytometry in kidney macrophages sorted from wild-type, Mfn1fl/fl,LysM-Cre+/−, and Mfn2fl/fl,LysM-Cre+/− mice, cultured in the presence (+) of TGF-β1 (5 ng/ml) for 48 hours. c, d) Representative confocal microscopy images of bone marrow-derived macrophages (BMDM) from wild-type, Mfn1fl/fl,LysM-Cre+/− and Mfn2fl/fl,LysM-Cre+/− mice stained for TIM23 (red), LC3 (green) (c) and MitoTracker (red), LysoTracker (green) (d), mounted with DAPI (blue) containing mountant media. Scale bars: 5 μm. e) Representative flow cytometry plots and analysis showing colocalized signal of MitoTracker (red) and LysoTracker (green) dyes in F4/80+ BMDM from wild-type, Mfn1fl/fl,LysM-Cre+/− and Mfn2fl/fl,LysM-Cre+/− mice. f) Representative flow cytometry histogram showing the mean fluorescence intensity (MFI) of the colocalized signal of MitoTracker (red) and LysoTracker (green) dyes in kidney macrophages sorted from wild-type and Mfn1/Mfn2 double knockout (DKO) mice, cultured in the presence (+) of TGF-β1 (5 ng/ml) for 48 hours. Data are mean ± SEM representative of 3 independent experiments, (n = 5 per group). *P < 0.05, **P < 0.01, ***P < 0.001, analyzed by one-way ANOVA followed by Newman-Keuls post-hoc test.
Furthermore, Mfn2-deficient BMDM, in addition to displaying mitochondrial clumping phenotype as reported in other tissues,22 showed reduced expression of LC3 (green) and decreased colocalization of LC3 with TIM23 (red) than Mfn1-deficient and wild-type BMDM (Figure 8c). Deficiency of Mfn2 was associated with decrease in autophagy-related markers,23 and impaired mitophagy.3,11,24 We further confirmed a reduction in colocalization of MitoTracker red and LysoTracker green dyes in Mfn2-deficient BMDM by confocal microscopy (Figure 8d) and flow cytometry (Figure 8e) than Mfn1-deficient or wild-type BMDM. Furthermore, TGF-β1 treated DKO kidney macrophages also displayed lower colocalization of MitoTracker and LysoTracker dyes than control macrophages (Figure 8f).
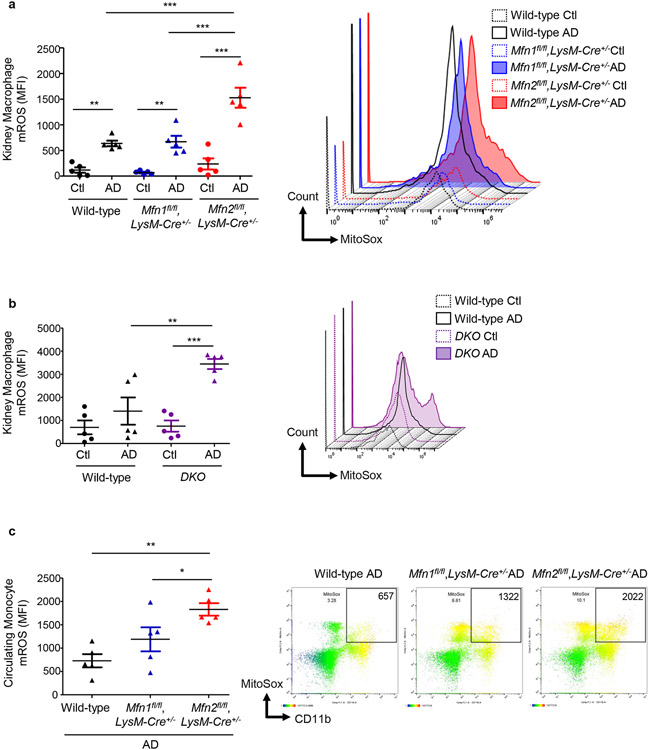
AD-induced mitochondrial superoxide production in kidney macrophages increased similarly in wild-type and Mfn1fl/fl,LysM-Cre+/− mice (Figure 9a). Kidney macrophages from AD-fed Mfn2fl/fl,LysM-Cre+/− mice displayed higher production of mROS than Mfn1fl/fl,LysM-Cre+/− and wild-type mice (Figure 9a). Kidney macrophages from AD-fed DKO mice also showed increased mROS production (Figure 9b). Circulating CD11b+ monocytes from AD-fed Mfn2fl/fl,LysM-Cre+/− mice also exerted greater superoxide levels than Mfn1fl/fl,LysM-Cre+/− and wild-type mice (Figure 9c). Mitochondrial-specific antioxidant, superoxide dismutase (SOD)-2 decreased in kidneys after AD (Supplementary Figure S6a). Mfn2-deficient BMDM displayed a reduced expression of SOD-2 (Figure S6b).
Figure 9. Mfn2-deficient monocytes/macrophages displayed increased production of mitochondrial-specific oxidative stress.
Flow cytometry analysis and representative histograms showing the mean fluorescence intensity (MFI) of mitochondrial-derived superoxide detected using MitoSox dye in the a - b) F4/80+ CD45+ cells in the kidneys from control (Ctl) or adenine (AD) diet (28-days)-fed wild-type, Mfn1fl/fl,LysM-Cre+/−, and Mfn2fl/fl,LysM-Cre+/− mice (a) and wild-type and Mfn1/Mfn2 double knockout (DKO) mice (b). c) CD11b+ circulating monocytes in the AD fed wild-type, Mfn1fl/fl,LysM-Cre+/−, and Mfn2fl/fl,LysM-Cre+/− mice Data are mean ± SEM representative of 3 independent experiments, (n = 5 per group). *P < 0.05, **P < 0.01, and ***P < 0.001, analyzed by one-way ANOVA followed by Newman-Keuls post-hoc test.
Downregulated mitochondrial fusion and upregulated fission by favoring mitochondrial outer membrane permeabilization promote the release of cytochrome c, which induces mitochondrial fragmentation and apoptosis.25,26 Urinary levels of cytochrome c increased after AD in both Mfn2fl/fl,LysM-Cre−/− and Mfn2fl/fl,LysM-Cre+/− mice. However, Ctl-fed Mfn2fl/fl,LysM-Cre+/− mice displayed higher urinary cytochrome c than Mfn2fl/fl,LysM-Cre−/− mice, and both urinary and circulating cytochrome c levels were further increased after AD (Supplementary Figures S6c,S6d). Patients with CKD with histological evidence of interstitial fibrosis and tubular atrophy (IFTA) also displayed higher urinary and plasma cytochrome c (Supplementary Figures S6e,S6f) than controls (CKD-).
Therefore, the central effect of conditional deletion of Mfn2 but not Mfn1 in myeloidlineage is repression of mitochondrial biogenesis and defective mitophagy, which contributes to hyperaccumulation of dysfunctional mitochondria, greater mROS production, and mitochondrial damage.
Patients with CKD display lower expression of mitochondrial fusion proteins in the kidney and higher circulating levels of macrophage chemoattractant.
We previously reported downregulation of MFN2 expression in human kidney biopsy and peripheral blood mononuclear cells from patients with CKD.3 Here, we determined that expression of MFN1 was also downregulated in human CKD kidney samples with biopsy-proven IFTA (Supplementary Figure S7a). Patients with CKD displayed higher urinary levels of CX3CL1 (Supplementary Figure S7b), a chemokine shown to regulate recruitment and survival of monocyte-derived macrophages in the obstructed kidney.21,27 Previously, we had also reported that expression of mitophagy regulatory proteins was decreased while fibrotic markers increased in human primary kidney macrophages after TGF-β1 or mitochondrial division inhibitor 1 (Mdivi1) treatment.3 The observations from current study suggest that mitochondrial dynamics is impaired and mitochondrial injury is aggravated during human kidney fibrosis.
Discussion
Here, we reported differential functions of mitochondrial fusion proteins and uncovered their roles in modulating macrophage-derived progression of kidney fibrosis. Myeloid-specific conditional deletion of Mfn2 but not Mfn1 exaggerated macrophage infiltration, kidney macrophage-derived fibrotic response, tubulointerstitial fibrosis, and worsened kidney function in CKD. Mfn2-deficient macrophages displayed profibrotic phenotype and had dysfunctional mitochondria. Myeloid-specific Mfn2-deficient mice displayed higher circulating and urinary levels of cytochrome c, suggesting greater mitochondrial injury during kidney fibrosis. Mfn2-deficiency in macrophages contributed to mitochondrial hyperaccumulation, elevated superoxide production, impaired biogenesis and mitophagic response under fibrotic conditions. Failure of mitochondrial quality control and an associated increase in oxidative stress in MFN2-deficient state leading to imbalanced mitochondrial dynamics and profibrotic/M2 macrophage-mediated kidney fibrosis.
Mitochondrial fusion and fission dynamics were impaired during kidney fibrosis, OMM and IMM fusion protein were downregulated, while mitochondrial fission protein was upregulated. Interestingly, despite reduced fusion and increased fission protein expression, increased mitochondrial size of macrophages was observed during kidney fibrosis that was further worsened in Mfn2 deficient macrophages. Chen et al. noted that mitochondria from Mfn1/Mfn2 DKO fibroblasts were highly heterogeneous in size, including very large mitochondrial spheres and mitochondrial fragmentation that was reversible.28 Thus, mitochondrial morphology is regulated through dynamic processes and despite an increase in fission during kidney fibrosis, increased mitochondrial size may occur with reversible mitochondrial fragmentation.
Imbalance in mitochondrial fusion/fission and mitophagy during fibrotic conditions in macrophages signify perturbation of macrophage mitochondrial dynamics. Indeed, recent studies implicated impairment in mitophagy in PT in diabetic kidney disease,29 and induced mitochondrial fission in fibroblasts during kidney fibrosis.30 Genetic deletion of Drp1 in PT provided cytoprotection potentially by shifting the balance towards mitochondrial fusion.31
Increases in mitochondrial mass, size, and mROS and decreases in antioxidant response, biogenesis, and mitophagy in Mfn2- but not Mfn1-deficient kidney macrophages suggest a protective role of MFN2 against AD-induced mitochondrial damage. DKO kidney macrophages displayed similar results as Mfn2-deficient kidney macrophages. Kidney-targeted deletion of Mfn2 aggravated mitochondrial damage in PT.32 However, PT-specific Mfn2 deletion protected against ischemia-induced kidney injury.33 Differential effects of Mfn2 deletion in macrophages after AD-induced CKD versus in PT after ischemia-induced acute kidney injury (AKI),33 suggests that MFN2 functions may be regulated in a cell type/context-specific fashion. Accordingly, macrophages and PT were shown to exhibit differential fibrotic responses in UUO-induced kidney fibrosis.34 Context-specific role of MFN2 was recently demonstrated, macrophage MFN2 but not MFN1 expression is induced by lipopolysaccharide (LPS).35 Macrophage-specific Mfn2 but not Mfn1-deleted mice died frequently due to defective LPS-induced inflammatory responses.35 Liver-specific Mfn1−/− mice displayed protection against high-fat diet-induced liver diseases.36 However, liver-specific Mfn2 deletion disrupted lipid metabolism and worsened liver disease.19 Mitofusins exert differential roles, as mitochondrial fusion can not be accomplished in absence of MFN1 but not MFN2.37
Though the expression of both MFN1 and MFN2 was downregulated during CKD, deficiency of MFN2 but not MFN1 enhanced mROS production in monocytes/macrophages. Circulating and kidney Mfn2- but not Mfn1-deficient monocytes/macrophages from AD-fed mice exerted profibrotic profile. Increased MFN2 expression in Mfn1-deficient BMDM and kidney macrophages may explain, at least in part, their protection against polarization to a profibrotic phenotype. Reduced expression of PGC-1α in TGF-β1-treated Mfn2-deficient and DKO but not in Mfn1-deficient BMDM suggests the potential role of PGC-1α in regulating expression of MFN2 in Mfn1-deficient macrophages. Mfn2-deficiency in macrophages was related to defects in mitochondrial biogenesis.
Mitophagy prevents aggregation of damaged mitochondria. Mfn2 but not Mfn1 deficiency led to less mitophagosome formation in kidney macrophages while hyperaccumulation of dysfunctional mitochondria with disorganized cristae, larger mitochondrial size, and higher superoxide production with a defective antioxidant response, were associated with fibrotic conditions. Higher mROS in Mfn2-deficient macrophages may contribute to their enhanced polarization towards a profibrotic/M2 phenotype.38 SS-31, a synthetic peptide, which improves mitochondrial functions, reduced UUO-induced tubular apoptosis, macrophage infiltration, oxidative stress, and tubulointerstitial fibrosis in the kidney.39 Mitochondrial antioxidant MitoQ restored MFN2 while inhibiting DRP1, and concomitantly ameliorated albuminuria and tubulointerstitial fibrosis in diabetic kidney disease.40 Given our findings indicating dysregulated mitochondrial fusion/fission and increased mitochondrial oxidative stress in macrophages associated with kidney fibrosis, strategies using mitochondrial antioxidants to restore balance in mitochondrial dynamics seem logical. Significance of mitochondrial dynamics imbalance in other cells of the kidney has been shown in AKI and CKD.41,42,43
Increases in kidney macrophage numbers in AD-fed myeloid-specific Mfn2-deficient single and DKO mice may be driven by CCL2. Indeed, we detected increases in urinary CCL2 in both AD-fed myeloid-specific Mfn2-deficient single and DKO mice. Intracellular oxidative stress-mediated Mfn2-deficient kidney macrophage-derived autocrine and/or paracrine signaling might be inducing CCL2 production via kidney macrophages and/or injured tubular epithelial cells. Increased urinary CCL2 in patients with kidney diseases positively correlates with kidney macrophage frequencies and negatively correlates with kidney function.44 We have earlier reported increased circulating CCL2 in patients with CKD and mitophagy-deficient animal model of kidney fibrosis.3
MFN2 deficiency in macrophages was associated with increases in TGF-β1 expression in kidney and kidney macrophages. TGF-β1, a potent profibrotic cytokine promotes macrophage polarization to M2 phenotype. Macrophage-specific deletion of TGF-β type II receptor protected against tubulointerstitial fibrosis,45 suggesting that macrophages respond to TGF-β1 and contribute to kidney fibrosis. Interestingly, myeloid-specific TGF-β1-deletion failed to protect against kidney fibrosis,46 suggesting that myeloid cells are not the only source of increased TGF-β1 actions in kidney fibrosis. Stellate cell-specific overexpression of MFN2 has been shown to attenuate liver fibrosis by reducing the infiltration of immune cells and targetting TGF-β1/Smad signaling pathway.47 Investigation of therapeutic applications of cell-specific overexpression of MFN2 against kidney fibrosis is warranted.
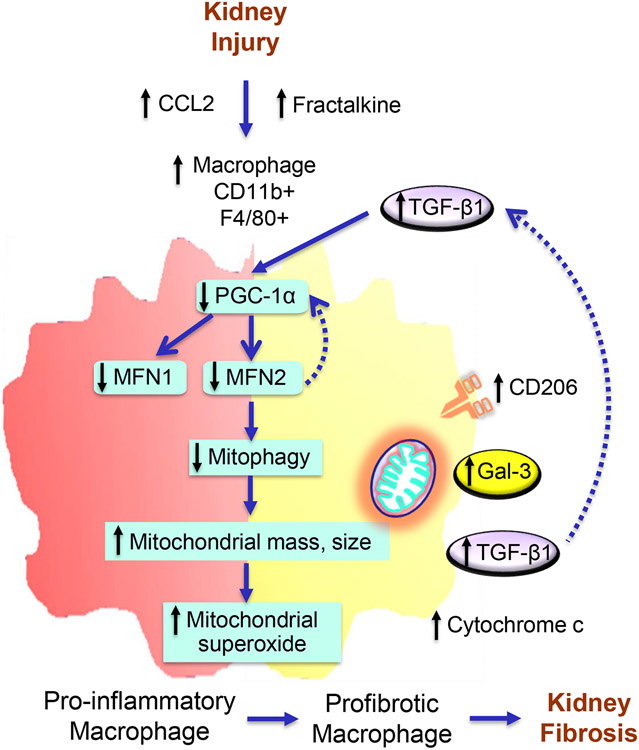
To our knowledge, our study is the first to elucidate that MFN1 and MFN2 possess differential functions in regulating macrophage-dependent remodeling of extracellular matrix during kidney fibrosis. We reveal downregulation of mitochondrial fusion while upregulating fission proteins and suppressing mitophagy and mitochondrial biogenesis in macrophages disturb the balance in mitochondrial dynamics and exaggerate kidney fibrosis (Figure 9). Myeloid-specific loss of Mfn2 but not Mfn1 promotes macrophage infiltration in response to kidney injury-related induction of CCL2 and CX3CL1. Perturbations in macrophage mitochondrial dynamics lead to increases in mitochondrial size, accumulation of dysfunctional mitochondria, and mROS production. MFN2 but not MFN1 prevents macrophage switching towards profibrotic/M2 phenotype and kidney fibrosis by maintaining mitochondrial health through regulating biogenesis and mitophagy and therefore mROS production.
Supplementary Material
Supplementary Figure S1. Balance between mitochondrial fusion/fission proteins is impaired in a murine model of kidney fibrosis and TGF-β1 treated macrophages.
Supplementary Figure S2. Mitochondrial fusion protein expression and mitochondrial colocalization are repressed in experimental kidney fibrosis, and loss of PINK1 or Parkin reduces expression of MFN2 but not MFN1 in kidney macrophages and proximal tubules.
Supplementary Figure S3. Myeloid cell-specific Mfn1-deficient kidney macrophages display higher expression of MFN2.
Supplementary Figure S4. Myeloid cell-specific Mfn1/Mfn2 double knockout (DKO) mice exert higher circulating levels of macrophage chemoattractants during kidney fibrosis.
Supplementary Figure S5. Mfn2-deficient macrophages display higher profibrotic response.
Supplementary Figure S6. MFN2 regulates antioxidant response in macrophages and mitochondrial injury marker increases after adenine diet-induced kidney fibrosis and in patients with chronic kidney disease (CKD).
Supplementary Figure S7. Mitochondrial fusion protein expression is downregulated in human CKD kidneys and is associated with increased urinary macrophage chemoattractant.
Figure 10. Proposed model of Mitofusin 2-dependent regulation of macrophage switch during kidney fibrosis.
Kidney injury-induced increases in secretion of chemokines, C-C motif chemokine ligand 2 (CCL2), and CX3CL1 favor the recruitment of CCR2 and CX3CR1 expressing pro-inflammatory and anti-inflammatory monocytes/macrophages, respectively, into the kidney. Impaired mitochondrial biogenesis in macrophages after kidney injury resulted in a decrease in the expression of MFN1 and MFN2. Reduced expression of Mitofusin (MFN)-2 but not MFN1 in macrophages following kidney injury contributes to the impairment of mitophagy leading to hyperaccumulation of dysfunctional mitochondria with increased superoxide production and increased circulating plasma and urinary cytochrome c, a mitochondrial damage-related marker. Mitochondrial dysfunction and oxidative stress promote the switching over of pro-inflammatory to profibrotic phenotype with higher polarization towards CD206, galectin-3 (Gal-3), and TGF-β1 expressing profibrotic/M2 macrophages and the progression of kidney fibrosis. TGF-β1, in turn, downregulates the expression of PGC-1α and suppresses MFN1 and MFN2 expression. Deficiency of MFN2 but not MFN1, therefore promotes kidney fibrosis by downregulating mitochondrial biogenesis and mitophagy in macrophages.
Translational Statement.
Macrophage-induced inflammatory and fibrotic responses being critical drivers of kidney fibrosis play a crucial role in advancing CKD. Persistent inflammation in CKD contributes to mitochondrial aberrations. Using myeloid lineage-specific mitochondrial fusion proteins, Mfn1/Mfn2 single and DKO mice, we demonstrated that myeloid cell-specific Mfn2 but not Mfn1 deficiency exaggerated macrophage-induced extracellular matrix deposition, and worsened kidney function during CKD. Mfn2-deficient BMDM displayed defective mitochondrial biogenesis and increased polarization towards profibrotic/M2 phenotype. Mfn2-deficient kidney macrophages exhibited mitochondrial hyperaccumulation, elevated superoxide, and impaired mitophagy during fibrosis. This study provides novel insights into the protective role of MFN2 against macrophage-mediated progression of kidney fibrosis.
Acknowledgments
This work was supported in part by the National Institutes of Health grants R01 HL133801 and R01 HL132198 to M.E.C. and A.M.K.C. Portions of data contained in this article have previously been submitted in abstract form for ASN Kidney Week 2020 and 2021.
Footnotes
Disclosure Statement
The spouse of M.E.C. is a cofounder and shareholder, and serves on the Scientific Advisory Board of Proterris, Inc. A.M.K.C. is a cofounder, stockholder and serves on the Scientific Advisory Board for Proterris, which develops therapeutic uses for carbon monoxide (CO). A.M.K.C. also has a use patent on CO.
Competing Interests
All authors declare no competing interests.
Supplementary information is available at Kidney International’s website
Publisher's Disclaimer: This is a PDF file of an unedited manuscript that has been accepted for publication. As a service to our customers we are providing this early version of the manuscript. The manuscript will undergo copyediting, typesetting, and review of the resulting proof before it is published in its final form. Please note that during the production process errors may be discovered which could affect the content, and all legal disclaimers that apply to the journal pertain.
References
- 1.Tang PMK, Nikolic-Paterson DJ, Lan HY. Macrophages: versatile players in renal inflammation and fibrosis. Nat Rev Nephrol. 2019;15:144–158. [DOI] [PubMed] [Google Scholar]
- 2.Li L, Huang L, Sung SS, et al. The chemokine receptors CCR2 and CX3CR1 mediate monocyte/macrophage trafficking in kidney ischemia-reperfusion injury. Kidney Int. 2008;74:1526–37. [DOI] [PMC free article] [PubMed] [Google Scholar]
- 3.Bhatia D, Chung KP, Nakahira K, et al. Mitophagy-dependent macrophage reprogramming protects against kidney fibrosis. JCI Insight. 2019;4: e132826. [DOI] [PMC free article] [PubMed] [Google Scholar]
- 4.Bhargava P, Schnellmann RJ. Mitochondrial energetics in the kidney. Nat Rev Nephrol. 2017;13: 629–646. [DOI] [PMC free article] [PubMed] [Google Scholar]
- 5.Chung KW, Dhillon P, Huang S, et al. Mitochondrial Damage and Activation of the STING Pathway Lead to Renal Inflammation and Fibrosis. Cell Metab. 2019;30:784–799.e5. [DOI] [PMC free article] [PubMed] [Google Scholar]
- 6.Galvan DL, Green NH, Danesh FR. The hallmarks of mitochondrial dysfunction in chronic kidney disease. Kidney Int. 2017;92:1051–1057. [DOI] [PMC free article] [PubMed] [Google Scholar]
- 7.Bhatia D and Choi ME. The Emerging Role of Mitophagy in Kidney Diseases. J Life Sci (Westlake Village). 2019;1:13–22. [DOI] [PMC free article] [PubMed] [Google Scholar]
- 8.Bhatia D, Capili A, Choi ME. Mitochondrial dysfunction in kidney injury, inflammation, and disease: Potential therapeutic approaches. Kidney Res Clin Pract. 2020;39: 244–258. [DOI] [PMC free article] [PubMed] [Google Scholar]
- 9.Shirihai OS, Song M, Dorn GW 2nd. How mitochondrial dynamism orchestrates mitophagy. Circ Res. 2015;116:1835–1849. [DOI] [PMC free article] [PubMed] [Google Scholar]
- 10.Song M, Mihara K, Chen Y, et al. Mitochondrial fission and fusion factors reciprocally orchestrate mitophagic culling in mouse hearts and cultured fibroblasts. Cell Metab. 2015;21:273–286. [DOI] [PMC free article] [PubMed] [Google Scholar]
- 11.Chen Y, Dorn GW 2nd. PINK1-phosphorylated mitofusin 2 is a Parkin receptor for culling damaged mitochondria. Science. 2013;340:471–5. [DOI] [PMC free article] [PubMed] [Google Scholar]
- 12.Li S, Lin Q, Shao X, et al. Drp1-regulated PARK2-dependent mitophagy protects against renal fibrosis in unilateral ureteral obstruction. Free Radic Biol Med. 2020;152: 632–649. [DOI] [PubMed] [Google Scholar]
- 13.Lee DS and Kim JE. PDI-mediated S-nitrosylation of DRP1 facilitates DRP1-S616 phosphorylation and mitochondrial fission in CA1 neurons. Cell Death Dis. 2018;9:869. [DOI] [PMC free article] [PubMed] [Google Scholar]
- 14.Weng SY, Wang X, Vijayan S, et al. IL-4 Receptor Alpha Signaling through Macrophages Differentially Regulates Liver Fibrosis Progression and Reversal. EbioMedicine. 2018;29:92–103. [DOI] [PMC free article] [PubMed] [Google Scholar]
- 15.Bhatia D, Sinha A, Hari P, et al. Rituximab modulates T- and B-lymphocyte subsets and urinary CD80 excretion in patients with steroid-dependent nephrotic syndrome. Pediatr Res. 2018;84:520–526. [DOI] [PubMed] [Google Scholar]
- 16.Zhu L, Xie X, Zhang L, et al. TBK-binding protein 1 regulates IL-15-induced autophagy and NKT cell survival. Nat Commun. 2018;9:2812. [DOI] [PMC free article] [PubMed] [Google Scholar]
- 17.Iwashita H, Torii S, Nagahora N, et al. Live Cell Imaging of Mitochondrial Autophagy with a Novel Fluorescent Small Molecule. ACS Chem Biol. 2017;12:2546–2551. [DOI] [PubMed] [Google Scholar]
- 18.Martorell-Riera A, Segarra-Mondejar M, Muñoz JP, et al. Mfn2 downregulation in excitotoxicity causes mitochondrial dysfunction and delayed neuronal death. EMBO J. 2014;33(20):2388–407. [DOI] [PMC free article] [PubMed] [Google Scholar]
- 19.Martin OJ, Lai L, Soundarapandian MM, et al. A role for peroxisome proliferator-activated receptor γ coactivator-1 in the control of mitochondrial dynamics during postnatal cardiac growth. Circ Res. 2014;114(4):626–36. [DOI] [PMC free article] [PubMed] [Google Scholar]
- 20.Soriano FX, Liesa M, Bach D, et al. Evidence for a mitochondrial regulatory pathway defined by peroxisome proliferator-activated receptor-gamma coactivator-1 alpha, estrogen-related receptor-alpha, and mitofusin 2. Diabetes. 2006;55(6):1783–91. [DOI] [PubMed] [Google Scholar]
- 21.Viedt C, Dechend R, Fei J, et al. MCP-1 induces inflammatory activation of human tubular epithelial cells: involvement of the transcription factors, nuclear factor-kappaB and activating protein-1. J Am Soc Nephrol. 2002;13:1534–47. [DOI] [PubMed] [Google Scholar]
- 22.Sebastián D, Hernández-Alvarez MI, Segalés J, et al. Mitofusin 2 (Mfn2) links mitochondrial and endoplasmic reticulum function with insulin signaling and is essential for normal glucose homeostasis. Proc Natl Acad Sci U S A. 2012;109:5523–8. [DOI] [PMC free article] [PubMed] [Google Scholar]
- 23.Muñoz JP, Ivanova S, Sánchez-Wandelmer J, et al. Mfn2 modulates the UPR and mitochondrial function via repression of PERK. EMBO J. 2013;32:2348–2361. [DOI] [PMC free article] [PubMed] [Google Scholar]
- 24.Schrepfer E, Scorrano L. Mitofusins, from Mitochondria to Metabolism. Mol Cell. 2016;61:683–694. [DOI] [PubMed] [Google Scholar]
- 25.Small DM, Gobe GC. Cytochrome c: potential as a noninvasive biomarker of drug-induced acute kidney injury. Expert Opin Drug Metab Toxicol. 2012;8:655–664. [DOI] [PubMed] [Google Scholar]
- 26.Youle RJ, van der Bliek AM. Mitochondrial fission, fusion, and stress. Science. 2012;337:1062–5. [DOI] [PMC free article] [PubMed] [Google Scholar]
- 27.Peng X, Zhang J, Xiao Z, et al. CX3CL1-CX3CR1 Interaction Increases the Population of Ly6C(−)CX3CR1(hi) Macrophages Contributing to Unilateral Ureteral Obstruction-Induced Fibrosis. J Immunol. 2015;195:2797–805. [DOI] [PubMed] [Google Scholar]
- 28.Chen H, Chomyn A, Chan DC. Disruption of fusion results in mitochondrial heterogeneity and dysfunction. J Biol Chem; 2005;280:26185–92. [DOI] [PubMed] [Google Scholar]
- 29.Zhan M, Usman IM, Sun L, et al. Disruption of renal tubular mitochondrial quality control by Myo-inositol oxygenase in diabetic kidney disease. J Am Soc Nephrol. 2015;26:1304–21. [DOI] [PMC free article] [PubMed] [Google Scholar]
- 30.Wang Y, Lu M, Xiong L, et al. Drp1-mediated mitochondrial fission promotes renal fibroblast activation and fibrogenesis. Cell Death Dis. 2020;11:29. [DOI] [PMC free article] [PubMed] [Google Scholar]
- 31.Perry HM, Huang L, Wilson RJ, et al. Dynamin-related protein 1 deficiency promotes recovery from AKI. J Am Soc Nephrol. 2018;29:194–206. [DOI] [PMC free article] [PubMed] [Google Scholar]
- 32.Gall JM, Wang Z, Liesa M, et al. Role of mitofusin 2 in the renal stress response. PLoS One. 2012;7:e31074. [DOI] [PMC free article] [PubMed] [Google Scholar]
- 33.Gall JM, Wang Z, Bonegio RG, et al. Conditional knockout of proximal tubule mitofusin 2 accelerates recovery and improves survival after renal ischemia. J Am Soc Nephrol. 2015;26:1092–1102. [DOI] [PMC free article] [PubMed] [Google Scholar]
- 34.Bolisetty S, Zarjou A, Hull TD, et al. Macrophage and epithelial cell H-ferritin expression regulates renal inflammation. Kidney Int. 2015;88:95–108. [DOI] [PMC free article] [PubMed] [Google Scholar]
- 35.Tur J, Pereira-Lopes S, Vico T, et al. Mitofusin 2 in Macrophages Links Mitochondrial ROS Production, Cytokine Release, Phagocytosis, Autophagy, and Bactericidal Activity. Cell Rep. 2020;32:108079. [DOI] [PubMed] [Google Scholar]
- 36.Kulkarni SS, Joffraud M, Boutant M, et al. Mfn1 Deficiency in the Liver Protects Against Diet-Induced Insulin Resistance and Enhances the Hypoglycemic Effect of Metformin. Diabetes. 2016;65(12):3552–3560. [DOI] [PubMed] [Google Scholar]
- 37.Cipolat S, Martins de Brito O, Dal Zilio B, Scorrano L. OPA1 requires mitofusin 1 to promote mitochondrial fusion. Proc Natl Acad Sci U S A. 2004;101(45):15927–32. [DOI] [PMC free article] [PubMed] [Google Scholar]
- 38.Zhang Y, Choksi S, Chen K, et al. ROS play a critical role in the differentiation of alternatively activated macrophages and the occurrence of tumor-associated macrophages. Cell Res. 2013;23:898–914. [DOI] [PMC free article] [PubMed] [Google Scholar]
- 39.Mizuguchi Y, Chen J, Seshan SV, et al. A novel cell-permeable antioxidant peptide decreases renal tubular apoptosis and damage in unilateral ureteral obstruction. Am J Physiol Renal Physiol. 2008;295:F1545–F1553. [DOI] [PMC free article] [PubMed] [Google Scholar]
- 40.Xiao L, Xu X, Zhang F, et al. The mitochondria-targeted antioxidant MitoQ ameliorated tubular injury mediated by mitophagy in diabetic kidney disease via Nrf2/PINK1. Redox Biol. 2017;11:297–311. [DOI] [PMC free article] [PubMed] [Google Scholar]
- 41.Brooks C, Wei Q, Cho SG, et al. Regulation of mitochondrial dynamics in acute kidney injury in cell culture and rodent models. J Clin Invest. 2009;119:1275–85. [DOI] [PMC free article] [PubMed] [Google Scholar]
- 42.Ayanga BA, Badal SS, Wang Y, et al. Dynamin-Related Protein 1 Deficiency Improves Mitochondrial Fitness and Protects against Progression of Diabetic Nephropathy. J Am Soc Nephrol. 2016;27:2733–47. [DOI] [PMC free article] [PubMed] [Google Scholar]
- 43.Maekawa H, Inoue T, Ouchi H, et al. Mitochondrial Damage Causes Inflammation via cGAS-STING Signaling in Acute Kidney Injury. Cell Rep. 2019;29:1261–1273.e6. [DOI] [PubMed] [Google Scholar]
- 44.Dantas M, Romão EA, Costa RS, et al. Urinary excretion of monocyte chemoattractant protein-1: a biomarker of active tubulointerstitial damage in patients with glomerulopathies. Kidney Blood Press Res. 2007;30:306–13. [DOI] [PubMed] [Google Scholar]
- 45.Chung S, Overstreet JM, Li Y, et al. TGF-β promotes fibrosis after severe acute kidney injury by enhancing renal macrophage infiltration. JCI Insight. 2018;3:e123563. [DOI] [PMC free article] [PubMed] [Google Scholar]
- 46.Huen SC, Moeckel GW, Cantley LG. Macrophage-specific deletion of transforming growth factor-β1 does not prevent renal fibrosis after severe ischemia-reperfusion or obstructive injury. Am J Physiol Renal Physiol. 2013;305:F477–84. [DOI] [PMC free article] [PubMed] [Google Scholar]
- 47.Zhu H, Shan Y, Ge K, et al. Specific Overexpression of Mitofusin-2 in Hepatic Stellate Cells Ameliorates Liver Fibrosis in Mice Model. Hum Gene Ther. 2020;31(1-2):103–109. [DOI] [PubMed] [Google Scholar]
Associated Data
This section collects any data citations, data availability statements, or supplementary materials included in this article.
Supplementary Materials
Supplementary Figure S1. Balance between mitochondrial fusion/fission proteins is impaired in a murine model of kidney fibrosis and TGF-β1 treated macrophages.
Supplementary Figure S2. Mitochondrial fusion protein expression and mitochondrial colocalization are repressed in experimental kidney fibrosis, and loss of PINK1 or Parkin reduces expression of MFN2 but not MFN1 in kidney macrophages and proximal tubules.
Supplementary Figure S3. Myeloid cell-specific Mfn1-deficient kidney macrophages display higher expression of MFN2.
Supplementary Figure S4. Myeloid cell-specific Mfn1/Mfn2 double knockout (DKO) mice exert higher circulating levels of macrophage chemoattractants during kidney fibrosis.
Supplementary Figure S5. Mfn2-deficient macrophages display higher profibrotic response.
Supplementary Figure S6. MFN2 regulates antioxidant response in macrophages and mitochondrial injury marker increases after adenine diet-induced kidney fibrosis and in patients with chronic kidney disease (CKD).
Supplementary Figure S7. Mitochondrial fusion protein expression is downregulated in human CKD kidneys and is associated with increased urinary macrophage chemoattractant.


