

Abstract
Background:
The opioid epidemic continues to be an ongoing public health crisis in the United States. Initially, large increases in overdose death rates were observed in largely rural, White communities, leading to the initial perception that the opioid epidemic was primarily a problem for the White population. Recent findings have shown increasing rates of overdose death among Blacks. We compare overdose rates between Blacks and Whites and explore county-level spatio-temporal heterogeneity in Ohio.
Methods:
We obtained county-level opioid overdose death counts for Whites and Blacks from 2007–2018 in Ohio. We fit a Bayesian multivariate spatial rates model to estimate annual standardized mortality ratios for Whites and Blacks for each county. We accounted for correlation between racial groups in the same county and across space and time. We also estimated differences in the mean trends between urban and rural counties for each racial group..
Results:
The overall overdose death rate in the state was increasing until 2018. County-level death rates for Whites were higher than Blacks throughout the state early in the study period. Death rates for Blacks increased throughout the study period and were comparable to the rates for Whites by the end of the study in many counties.
Conclusions:
County-level opioid overdose death rates increased faster for Blacks than Whites during the study. By 2018, death rates were comparable for Blacks and Whites in many counties. The opioid epidemic spans racial groups in Ohio and trends indicate that overdose is a growing problem among Blacks.
Keywords: Bayesian hierarchical modeling, disease mapping, opioid, race, spatio-temporal
Background
The opioid epidemic continues to be a public health crisis in the United States (U.S.) (1). There were 70,237 drug overdose deaths in the U.S. in 2017 with nearly 50,000 of those involving an opioid (2). In response to the misuse of prescription painkillers, prescription drug monitoring programs (PDMP) have been implemented by states in an effort to reduce prescribing and prescription opioid-related outcomes (3). However, overdose deaths have continued to rise despite these efforts due to the increased use of heroin (4) and the emergence of fentanyl into the drug supply (5).
The epidemic is particularly severe in Ohio where the state had the second highest age-adjusted overdose rate in the country in 2017 (6). In fact, Ohio’s age-adjusted opioid overdose death rate of 39.2 per 100,000 persons was more than double the national rate of 14.6 per 100,000 (6). Driven largely by opioids, the unintentional overdose death rate has increased over 1000% in Ohio since 2000 (7). The opioid epidemic and its associated morbidity and mortality (8; 9) have cost the state billions of dollars (10) and led to 1/8 of Ohio’s counties being labeled as high risk for an injection drug use associated human immunodeficiency virus (HIV) outbreak by the Centers for Disease Control and Prevention (CDC) (11). Over the past decade, the state has implemented multiple public health and policy interventions to try to mitigate the epidemic (12), which initially focused on the southern, Appalachian part of the state.
Commonly, the opioid epidemic is perceived as a rural, White problem (13). This perception stems from the high burden of drug-related morbidity and mortality in Appalachia (14) and the substantial increase in overdose mortality rates in rural counties (15). However, opioid mortality rates tend to be similar or even higher in urban counties (16) and have started to increase in recent years for Blacks (17). Nationally from 2016 to 2017, the opioid overdose death rate for Blacks increased by 25% compared to 11% for Whites (6). In 2015, Ohio had the fourth highest overdose rate in the country among Blacks (18). However, there is substantial heterogeneity across spatial regions and areas classified as urban or rural (16; 19).
The objectives of this study are to characterize spatial heterogeneity and compare county-level opioid overdose death rates for Blacks and Whites in Ohio from 2007–2018. We use a spatial rates framework (20; 21) which will allow us to investigate departures from a common statewide mortality rate. We also investigate how trends differ by the urban or rural status of a county. By conducting a county-level analysis, we are able to explore heterogeneity across both space and time. However, small counts in rural, less populous counties pose a modeling challenge that we have overcome through use of a multivariate model that borrows strength across racial groups, space, and time.
Methods
Data.
Our primary goal is to estimate and compare county-level opioid overdose death rates by race in Ohio. Mortality data are collected and compiled by the Ohio Department of Health (ODH) and are publicly available through the Ohio Public Health Data Warehouse Ohio Resident Mortality Data (22). For this analysis, we include resident deaths from 2007–2018 that are classified as unintentional drug poisonings and mention any opioid in the multiple cause codes of the death record. This includes International Classification of Disease (ICD)-10 multiple cause codes T40.0-T40.4 and T40.6. Locations are determined by the decedent’s county of residence. The decedent’s race is reported by ODH in five categories using bridging methodology from the National Center for Health Statistics (NCHS): American Indian or Alaskan Native, Asian or Pacific Islander, Black, Other, and White. We focus on those classified as Black or White because of small populations in the other categories. We use the terms “Black” and “White” throughout the manuscript to be consistent with the terminology used by ODH.
We also explore how rates differ for urban and rural areas. We define urban as counties that belong to a Metropolitan Statistical Area (MSA) and rural as those that do not, where MSA is defined by the United States Census Bureau. The MSA status of Ohio counties is shown in eFigure1. We refer to this as urban status throughout the rest of the manuscript. We obtained annual county resident population estimates generated by NCHS from ODH. Observed overdose rates per 100,000 residents for each race group are shown in eFigure 2.
Statistical Considerations.
The main goal of the analysis is to estimate and compare county-level overdose death rates across space and time by race. To do so, we will use the spatial rates (20; 21) parameterization for Poisson regression disease mapping models. This allows us to estimate relative risk with respect to an expected risk of death in the absence of county- or race-specific risk factors. However, one challenge is the relatively small Black population in many counties, particularly those that are more rural. To overcome this, we will jointly model both racial groups using a shared spatio-temporal component (23) to account for correlation between Black and White overdose death rates within a county induced by their shared environment. We also incorporate spatial and temporal dependence terms to allow estimates to borrow strength across space and time. By exploiting the structure of the data, we are able to provide more stable estimates and comparisons than had we examined each racial group individually (24).
We assume a multivariate Poisson generalized linear mixed effects model using the spatial rates parameterization (20; 21). For notation, let r index the county (r = 1, …, 88), t the year (t = 2007, …, 2018), and k the race where k = 0 is White and k = 1 is Black. Then assume
| (1) |
where Yrtk is the count of overdose deaths. Let Ertk be the expected count of overdose deaths under the assumption that overdose death rates vary over time but are homogeneous across both space and race. That is, Ertk = ρtPrtk where ρt =∑k ∑r Yrtk/∑k ∑r Prtk and Prtk is the resident population. Thus, λrtk represents the relative risk of death for race k in county r at year t compared to the state average rate in year t, commonly referred to as the standardized mortality ratio (SMR). Using the log link, we model the SMR as
| (2) |
where βk is a vector of race specific fixed effects corresponding to the vector of covariates Xrt containing an intercept, year, an indicator of urban status, and the interaction between year and urban status. Thus, we model the average log relative risk as a linear function over time specific to race and urban status. We also include a spatio-temporal shared component vrt with race specific loading δk and a term for the remaining race specific heterogeneity ϵrtk. For identification, we assume δ0 = 1.
Since racial groups within a county share a common environment, we include a shared component in the model to capture their correlation. We also use this term to account for spatial structure with an intrinsic conditional autoregressive model (25) and shared temporal autocorrelation using an autoregression of order 1 (AR(1)). That is, we assume the following conditional distributions
| (3) |
Where η is a temporal autoregressive parameter, wrl is an indicator of whether counties r and l are neighbors as defined by adjacency, wr+ is the number of neighbors of county r, and τ2 is a variance parameter. We constrain ∑r vrt =0 for every year t which allows us to use Equation(3) as a valid process model (26). Acknowledging that racial groups may experience the same environment differently, we include a race-specific loading to allow for differing effects of the shared component by race.
We also model race-specific variation to capture variation not accounted for by the shared component or fixed effects. We assume an AR(1) structure to account for temporal autocorrelation within a county. Thus, we assume
| (4) |
where ϕk is a race specific autoregressive parameter and is a variance.
We fit the model within the Bayesian paradigm so we must specify prior distributions on all parameters. All elements of βk and δ1 are assigned independent uniform priors on the real line. Autoregressive parameters η and ϕk are assumed to be uniformly distributed over (0, 1). All variance parameters are assigned independent inverse gamma distributions with shape and scale parameters both equal to 0.5. The model was fit using Markov chain Monte Carlo implemented in NIMBLE (27) in R. The algorithm was run for 1,000,000 iterations, discarding the first 200,000 as burn-in, and then thinned by keeping every 100th iteration. We assessed convergence visually using trace plots and goodness of fit using posterior predictive checking (28). Code is provided in the eAppendix.
Results
We assessed goodness of fit of the model using posterior predictive p-values to compare features of the posterior predictive distribution with those of the observed counts for each race. We examined four test statistics: χ2 discrepancy, standard deviation, maximum, and proportion of zeros. P-values for the χ2 discrepancy were 0.45 for Whites and 0.57 for Blacks with p-values for other statistics ranging from 0.25 to 0.89. These checks do not provide strong evidence of a lack of fit and are shown in eTable 1. This is particularly encouraging as the median county’s Black population is only 1,339 in 2007 compared to a median White population of 56,921. Thus, the borrowing strength across racial groups in our model does not appear to lead to a lack of fit for either group.
First, we examined estimates that describe the change in a typical SMR over time. That is, the SMR when the shared component and race specific random effects are all equal to 0. The SMR estimates are relative to the overall state overdose death rate for each year which is shown in Figure 1(A). For additional context, the observed overdose death rates per 100,000 residents are shown for each demographic group in Table 1. Typical SMRs across the 12 year time period are shown in Figure 1(B) for each of the groups considered. Posterior estimates of the regression coefficients are shown in eTable 2. We notice that on the log scale the typical SMR for rural Whites is relatively flat and slightly declining for urban Whites. Since the large scale temporal trend is captured in the expected counts, the flat trend indicates that rates for Whites are following relatively similar temporal patterns as the overall state rate, which is not surprising as Whites comprise 86% of Ohio’s population over the study period. In Figure 2(A), we show the posterior mean rate ratios and 95% credible interval comparing urban to rural counties for each race. Averaging over time, urban Whites have a 21% higher death rate than rural Whites with 95% credible interval of the rate ratio of (0.97, 1.55) and posterior probability of 0.96 that urban is greater.
Figure 1.
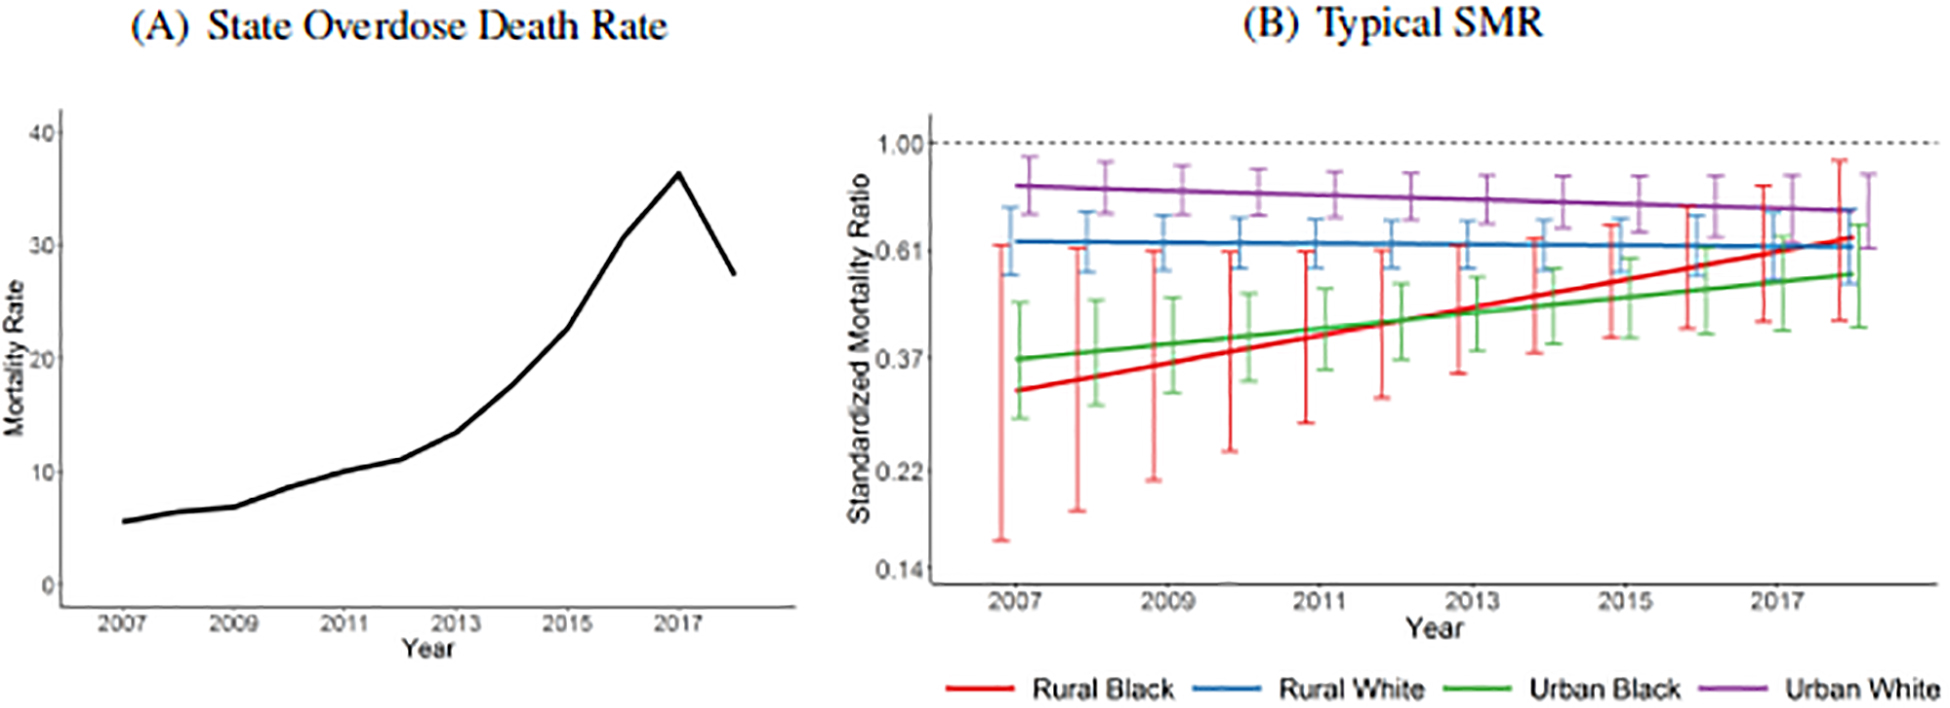
Overall state overdose death rates per 100,000 residents and the posterior mean and 95% credible intervals for the typical standardized mortality ratio (SMR) estimates on the log scale by race and urban status, 2007–2018. A typical SMR assumes all random effects are equal to 0.
Table 1.
Observed overdose death rates per 100,000 residents for each group and year.
| Year | Rural Black | Rural White | Urban Black | Urban White |
|---|---|---|---|---|
| 2007 | 0.0 | 3.9 | 3.5 | 6.5 |
| 2008 | 3.0 | 4.4 | 4.3 | 7.6 |
| 2009 | 9.0 | 5.5 | 3.3 | 8.0 |
| 2010 | 1.5 | 5.5 | 4.7 | 10.4 |
| 2011 | 7.3 | 7.5 | 5.6 | 11.8 |
| 2012 | 4.4 | 7.3 | 6.0 | 13.3 |
| 2013 | 7.2 | 10.4 | 8.5 | 15.5 |
| 2014 | 7.1 | 13.8 | 10.2 | 20.4 |
| 2015 | 18.1 | 16.4 | 13.7 | 26.4 |
| 2016 | 22.0 | 21.3 | 19.7 | 35.8 |
| 2017 | 25.9 | 25.5 | 30.0 | 40.9 |
| 2018 | 21.5 | 20.0 | 24.5 | 30.2 |
Figure 2.
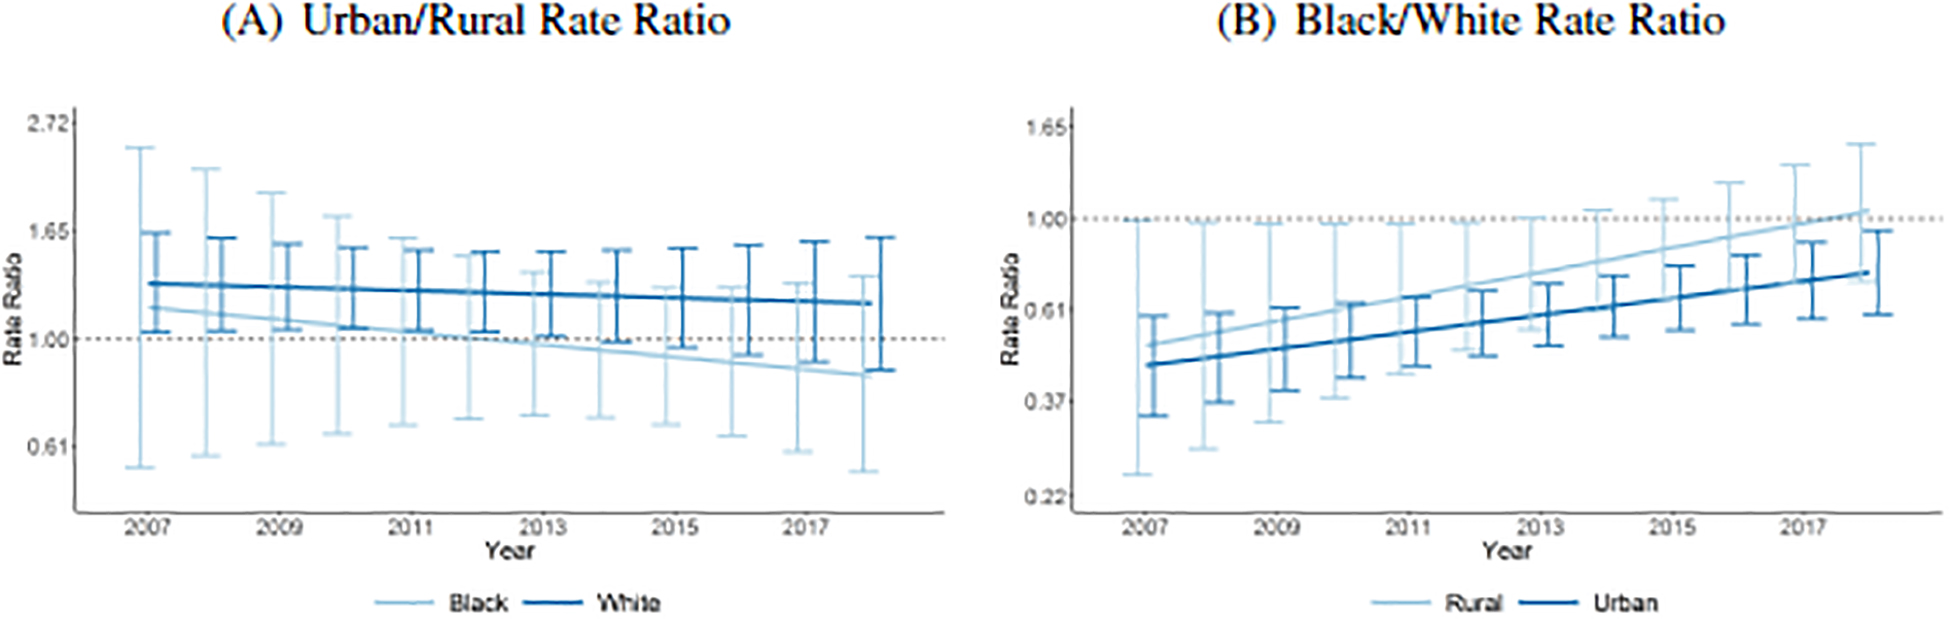
Estimated posterior mean rate ratios on the log scale comparing typical urban to rural counties within race and comparing Blacks to Whites within urban status, 2007–2018. A typical rate ratio assumes all random effects are equal to 0.
Despite an increasing trend in the overall overdose rate, with the exception of 2018, we see increases in the SMR for both urban and rural Blacks. The slope for rural Blacks estimates a 6% increase per year in the SMR with 95% credible interval of the ratio of (0.98, 1.15) and posterior probability that the slope is positive of 0.94. For urban Blacks, the slope estimates a 4% increase per year in the SMR with 95% credible interval of the ratio of (1.00, 1.07) and positive posterior probability of 0.98. This suggests that overdose death rates for Blacks are increasing at faster rates than the overall state death rate (Figure 1(A)). Comparing the slopes for Blacks and Whites, the posterior mean difference and 95% credible interval for rural is 0.07 and (−0.02, 0.15) with posterior probability of a difference greater than 0 of 0.94 and for urban is 0.05 and (0.01, 0.08) with posterior probability of a positive difference of 0.99. Additionally, in Figure 2(B), we see the rate ratios comparing Blacks and Whites over time are approaching 1 for both urban and rural counties, indicating that overdose death rates for Blacks have nearly caught up to rates for Whites.
This general story is further illustrated by looking at the posterior mean estimates of the SMR for each county. We plot the estimates in Figure 3. For Whites, we see above average estimates (greater than 1) each year in the southern and southwestern part of the state, around Cincinnati. Starting roughly around 2012, we start to also see above average estimates in the northeastern part of the state around Cleveland. For Blacks, we see consistently below average estimates through about 2013 when we start to see closer to average estimates in the southwestern part of the state. Starting in 2016, we even start to see several counties with above average death rates for Blacks. In eFigure 3, we plot the posterior probability that the SMR is above average (i.e., greater than 1). We also display posterior mean estimated rates per 100,000 in eFigure 4.
Figure 3.

Estimated posterior mean standardized mortality ratios (SMR) by race, 2007–2018. The color gradient is on the log scale.
In Figure 4, we plot the posterior mean rate ratios comparing Blacks and Whites and the posterior probability that the overdose rate for Blacks is greater than Whites. Until 2014, we consistently see higher rates for Whites than Blacks across the state. Beginning in 2014, we start to see death rates in Blacks roughly equal to those of Whites for some counties. This trend continues through 2018 when 34 counties have estimated death rates for Blacks that exceed Whites. This is particularly apparent in the northeastern and northwestern regions of the state. In particular, the posterior probabilities in Figure 4 illustrate how the overdose rates for Blacks have increased over the study period to the point where they are now comparable to the rates of Whites. This also aligns with what was shown in Figure 2(B).
Figure 4.

Estimated posterior mean rate ratios comparing Blacks to Whites and the posterior probability that the rate ratio is greater than 1, 2007–2018. The color gradient for the rate ratio is on the log scale.
We also plot the posterior mean of the shared component and the posterior probability that it is above average in eFigure 5. The shared component reflects unmeasured common risk (protective) factors for estimates that are above (below) average. In general, we see fairly consistent patterns over time with Southern, Southwestern, and Northeastern Ohio estimated to have excess shared risk. This aligns with the regions of the state that have generally been hardest hit by the opioid epidemic. Posterior mean estimates of the race specific variation are shown in eFigure 6.
Discussion
In this paper, we estimated and compared the SMR for opioid overdose deaths at the county-level for Blacks and Whites from 2007–2018. We used a multivariate spatial rates Poisson regression model to incorporate dependence across racial groups, space, and time. By standardizing to a common statewide rate for each year, we were able to explore heterogeneity in death rates by race and county relative to a homogeneous statewide trend. We compared death rates between Blacks and Whites within a county to identify areas where the rates were similar and different. We also assessed typical rates of change over time by racial group and the urban status of the county. In addition, we estimated a shared component that accounts for common environment in a county and characterizes regions with elevated risk across racial groups.
While overall death rates were increasing over the study period, we found that the rates for Blacks were increasing faster than those for Whites and faster than the overall statewide trend. This aligns with national findings that indicated larger increases in death rates for Blacks than Whites (6). When comparing Black and White overdose death rates within a county, we observed that White rates were generally higher at the beginning of the study period, but that Black rates increased to the point where rates were similar in many counties by 2018. This finding highlights that the opioid epidemic is not just a White problem but instead is a problem that spans racial groups. Thus, it is important to inclusively frame the problem and ensure the equitable allocation of treatment and resources (18). We also estimated that typical overdose death rates for Whites in urban counties were higher than those in rural counties. We did not observe evidence of differences in typical rates for urban and rural counties for Blacks.
Additional research should be done to explore potential reasons for the increase in death rates for Blacks. It has been noted that bias in prescribing patterns of pain medication may have minimized the impact of the wave of prescription opioid misuse on Blacks (29) but at the cost of inadequate pain management. However, the availability of low-cost heroin has increased over the last decade (4) and, while changing, heroin use has historically been linked to urban, minority communities (30). The influx of fentanyl, a synthetic opioid, has also likely contributed to the increases in recent years as it is commonly added to street formulations of heroin and cocaine (18). Often people who use drugs are unaware of the presence of fentanyl, which can be deadly because of its added potency (31). While it would be interesting to explore local estimates of overdose rates by drug type for each race, any analysis is going to be complicated by the small Black population sizes in many communities. In addition, it should also be explored whether racial disparities exist in the access and availability of harm reduction and treatment modalities, like naloxone and buprenorphine.
There are a few limitations to the current study. Race is determined by a classification scheme from NCHS that is used by ODH and may be associated with some degree of misclassification. Our study is also based on data reported on death certificates which we assume to be correct and acknowledge may be imperfect (32). However, Ohio is considered to have very good reporting (6) and by 2007 had already been in the midst of the opioid epidemic and accustomed to reporting overdose deaths. If differential misclassification existed and changed over time, it may partially explain the changes in reported overdose deaths observed. Finally, our study was conducted at the county-level and so all estimates must be interpreted at the county level to avoid the ecological fallacy (33).
In conclusion, we explored differences in opioid overdose death rates for Blacks and Whites in Ohio from 2007–2018. Within each race, the trends for urban and rural counties were similar. We found that the death rates for Blacks were increasing faster than for Whites during the study period. By the end of the study period, overdose death rates for Blacks were comparable to those for Whites throughout most of the state. The results of this study suggest that the opioid epidemic in Ohio is not just a White problem and that rates of overdose death in Blacks are increasing across the state.
Supplementary Material
Acknowledgement:
These data were provided by the Ohio Department of Health. The Department specifically disclaims responsibility for any analyses, interpretations or conclusions.
Funding:
Research reported in this publication was supported by the National Institute On Drug Abuse of the National Institutes of Health under Award Number R21DA045236. The content is solely the responsibility of the authors and does not necessarily represent the official views of the National Institutes of Health.
Footnotes
No conflicts of interest
Data Accessibility:
Death counts are publicly available from the Ohio Department of Health website (http://publicapps.odh.ohio.gov/EDW/DataCatalog) and were obtained from the Ohio Public Health Data Warehouse Ohio Resident Mortality Data. Computer code for the analysis is available online.
References
- [1].Office of National Drug Control Policy Executive, Office of the President of the United States. Epidemic: responding to America’s prescription drug abuse crisis Internet 2011. https://www.hsdl.org/?view&did=4609.
- [2].Lawrence Scholl, Puja Seth, Mbabazi Kariisa, Nana Wilson, Grant Baldwin. Drug and Opioid-Involved Overdose Deaths — United States, 2013–2017 MMWR. Morbidity and Mortality Weekly Report. 2018;67. [DOI] [PMC free article] [PubMed] [Google Scholar]
- [3].Victor Puac-Polanco, Stanford Chihuri, Fink David S, Cerdá Magdalena, Keyes Katherine M, Li Guohua. Prescription Drug Monitoring Programs and Prescription Opioid-Related Outcomes in the United States Epidemiologic Reviews. 2020. mxaa002. [DOI] [PMC free article] [PubMed] [Google Scholar]
- [4].Compton Wilson M, Jones Christopher M, Baldwin Grant T. Relationship between Nonmedical Prescription-Opioid Use and Heroin Use New England Journal of Medicine. 2016;374:154–163. [DOI] [PMC free article] [PubMed] [Google Scholar]
- [5].Daniulaityte R, Juhascik MP, Strayer KE, et al. Overdose Deaths Related to Fentanyl and Its Analogs - Ohio, January-February 2017. MMWR. Morbidity and mortality weekly report. 2017;66:904–908. [DOI] [PMC free article] [PubMed] [Google Scholar]
- [6].Scholl L, Seth P, Kariisa M, Wilson N, Baldwin G. Drug and Opioid-Involved Overdose Deaths - United States, 2013–2017 MMWR. 2019;67:1419–1427. [DOI] [PMC free article] [PubMed] [Google Scholar]
- [7].Ohio Department of Health, Bureau of Vital Statistics. ODH Violence and Injury Prevention Program Online; accessed 5-November-2019 2019. https://odh.ohio.gov/wps/wcm/connect/gov/5deb684e-4667-4836-862b-cb5eb59acbd3/2017_OhioDrugOverdoseReport.pdf.
- [8].Rudd RA, Seth P, David F, Scholl L. Increases in drug and opioid-involved overdose deaths - United States, 2010–2015 MMWR Morb Mortal Wkly Rep. 2016. [DOI] [PubMed] [Google Scholar]
- [9].Zibbell JE, Igbal K, Patel RC, et al. Increases in hepatitis C virus infection related to injection drug use among persons aged ≥ 30 years - Kentucky, Tennessee, Virginia, and West Virginia, 2006–2012 MMWR. 2015;64:453–458. [PMC free article] [PubMed] [Google Scholar]
- [10].Mark Rembert, Michael Betz, Bo Feng, Mark Partridge. Taking measure of Ohio’s opioid crisis 2017. https://aede.osu.edu/sites/aede/files/publication_files/Swank%20-%20Taking%20Measure%20of%20Ohios%20Opioid%20Crisis.pdf.
- [11].Van Handel MM, Rose CE, Hallisey EJ, et al. County-Level Vulnerability Assessment for Rapid Dissemination of HIV or HCV Infections Among Persons Who Inject Drugs, United States Journal of Acquired Immune Deficiency Syndrome. 2016;73:323–331. [DOI] [PMC free article] [PubMed] [Google Scholar]
- [12].Governor’s Cabinet Opiate Action Team. Attacking Ohio’s opiate epidemic Online; accessed 6-September-2017 2012. https://mha.ohio.gov/Researchers-and-Media/Combating-the-Opioid-Crisis.
- [13].Sobotka Tagart Cain, Stewart Sheridan A.. Stereotyping and the opioid epidemic: A conjoint analysis Social Science & Medicine. 2020:113018. [DOI] [PubMed] [Google Scholar]
- [14].Schalkoff Christine A, Lancaster Kathryn E, Gaynes Bradley N, et al. The opioid and related drug epidemics in rural Appalachia: A systematic review of populations affected, risk factors, and infectious diseases Substance Abuse. 2020;41:35–69. . [DOI] [PMC free article] [PubMed] [Google Scholar]
- [15].Rossen Lauren M, Khan Diba, Warner Margaret. Trends and Geographic Patterns in Drug-Poisoning Death Rates in the U.S., 1999–2009 American Journal of Preventive Medicine. 2013;45:e19–e25. [DOI] [PMC free article] [PubMed] [Google Scholar]
- [16].Monnat Shannon M. The contributions of socioeconomic and opioid supply factors to U.S. drug mortality rates: Urban-rural and within-rural differences Journal of Rural Studies. 2019;68:319–335. [Google Scholar]
- [17].Alexander Mathew V, Barbieri Magali. Trends in Black and White Opioid Mortality in the United States, 1979–2015 Epidemiology. 2018:707–715. [DOI] [PMC free article] [PubMed] [Google Scholar]
- [18].Keturah James, Ayana Jordan. The Opioid Crisis in Black Communities The Journal of Law, Medicine & Ethics. 2018;46:404–421. . [DOI] [PubMed] [Google Scholar]
- [19].Rigg Khary K, Monnat Shannon M, Chavez Melody N. Opioid-related mortality in rural America: Geographic heterogeneity and intervention strategies International Journal of Drug Policy. 2018;57:119–129. [DOI] [PubMed] [Google Scholar]
- [20].Noel Cressie, Olivier Perrin, Christine Thomas-Agnan. Likelihood-based estimation for Gaussian MRFs Statistical Methodology. 2005;2:1–16. [Google Scholar]
- [21].Cressie Noel AC, Wikle Christopher K. Statistics for spatio-temporal data. Hoboken, N.J.: Wiley; 2011. [Google Scholar]
- [22].Ohio Public Health Data Warehouse. Ohio Resident Mortality Data http://publicapps.odh.ohio.gov/EDW/DataCatalog 2020. Accessed February 2, 2020.
- [23].Leonhard Knorr-Held, Best Nicola G.. A shared component model for detecting joint and selective clustering of two diseases Journal of the Royal Statistical Society: Series A (Statistics in Society). 2001;164:73–85. [Google Scholar]
- [24].Martinez-Beneito MA, Botella-Rocamora P, Banerjee S. Towards a multidimensional approach to Bayesian disease mapping Bayesian Analysis. 2017;12:239–259. [DOI] [PMC free article] [PubMed] [Google Scholar]
- [25].Julian Besag. Spatial Interaction and the Statistical Analysis of Lattice Systems Journal of the Royal Statistical Society. Series B (Methodological). 1974;36:192–236. [Google Scholar]
- [26].Sudipto Banerjee., Carlin Bradley P., Gelfand Alan E.. Hierarchical modeling and analysis for spatial data. Boca Raton, Fla.: Chapman & Hall/CRC; 2004. [Google Scholar]
- [27].de Valpine P, Turek D, Paciorek CJ, Anderson-Bergman C, Temple Lang D, Bodik R. Programming with models: writing statistical algorithms for general model structures with NIMBLE Journal of Computational and Graphical Statistics. 2017;26:403–417. [Google Scholar]
- [28].Andrew Gelman., Carlin John B., Stern Hal S., Dunson David B., Vehtari Aki., Rubin Donald B.. Bayesian data analysis. Boca Raton, FL: Chapman & Hall/CRC; 2014. [Google Scholar]
- [29].Anjali Om. The opioid crisis in black and white: the role of race in our nation’s recent drug epidemic Journal of Public Health. 2018;40:e614–e615. [Google Scholar]
- [30].Cicero Theodore J, Ellis Matthew S, Surratt Hilary L, Kurtz Steven P. The Changing Face of Heroin Use in the United States: A Retrospective Analysis of the Past 50 Years JAMA Psychiatry. 2014;71:821–826. [DOI] [PubMed] [Google Scholar]
- [31].Mars Sarah G, Rosenblum Daniel, Ciccarone Daniel. Illicit fentanyls in the opioid street market: desired or imposed? Addiction. 2019;114:774–780. [DOI] [PMC free article] [PubMed] [Google Scholar]
- [32].Slavova S, O’Brien DB, Creppage K, et al. Drug Overdose Deaths: Let’s Get Specific. Public health reports. 2015;130. [DOI] [PMC free article] [PubMed] [Google Scholar]
- [33].Steven Pianntadosi, Byar David P., Green Sylvan B.. The Ecological Fallacy American Journal of Epidemiology. 1988;127:893–904. [DOI] [PubMed] [Google Scholar]
Associated Data
This section collects any data citations, data availability statements, or supplementary materials included in this article.
Supplementary Materials
Data Availability Statement
Death counts are publicly available from the Ohio Department of Health website (http://publicapps.odh.ohio.gov/EDW/DataCatalog) and were obtained from the Ohio Public Health Data Warehouse Ohio Resident Mortality Data. Computer code for the analysis is available online.