Abstract
Targeting neurons genetically with light-driven opsins is widely used to investigate cell-specific responses. We transfected midbrain dopamine neurons with the excitatory opsin Chrimson. Extracellular basal and stimulated neurotransmitter levels in the dorsal striatum were measured by microdialysis in awake mice. Optical activation of dopamine cell bodies evoked terminal dopamine release in striatum. Multiplexed analysis of dialysate samples revealed that evoked dopamine was accompanied by temporally coupled increases in striatal 3-methoxytyramine, an extracellular dopamine metabolite, and in serotonin. We investigated a mechanism for dopamine-serotonin interactions involving striatal dopamine receptors. However, evoked serotonin associated with optical stimulation of dopamine neurons was not abolished by striatal D1- or D2-like receptor inhibition. Though the mechanisms underlying the coupling of striatal dopamine and serotonin remain unclear, these findings illustrate advantages of multiplexed measurements for uncovering functional interactions between neurotransmitter systems. Furthermore, they suggest that the output of optogenetic manipulations may extend beyond opsin-expressing neuronal populations.
Keywords: Microdialysis, striatum, substantia nigra, 3-methyltyramine, Chrimson
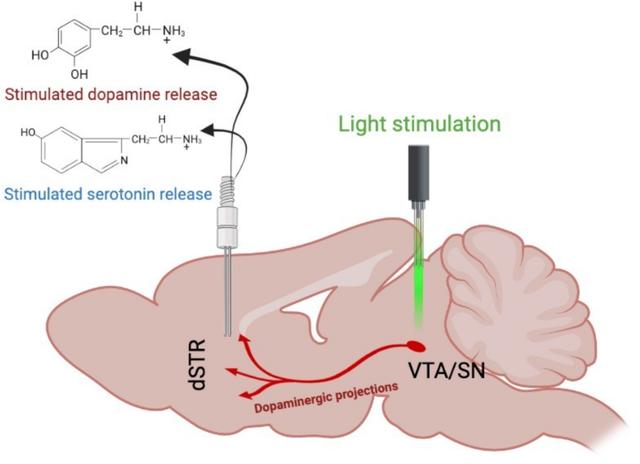
Graphical Abstract
INTRODUCTION
Optogenetics entails expressing light-driven ionotropic receptors in neurons or other excitable cells to enable spatially and temporally restricted activation or inhibition.4–7 Gene constructs for microbial or engineered rhodopsins packaged in viruses are used to transduce brain-region-specific gene expression following local delivery. Gene expression can be targeted further using Cre recombinase under the control of cell-type-specific promotors, in combination with Cre-activated opsin constructs.8 Opsins produce excitatory (e.g., channelrhodopsin-2, Chrimson) or inhibitory (e.g., halorhodopsin, archaerhodopsin) effects on neural activity.9–11 The discovery and use of opsins have enabled the identification of neural pathways involved in the modulation of behavior.12–15
Opsin-targeted cell types do not operate autonomously. Dopamine and serotonin are examples of functionally interconnected neurotransmitter systems. For instance, while dopamine signaling is often associated with reward prediction error, serotonin transmission also plays a role in processing reward-associated information.16–18 Moreover, while widely used therapeutics for mood disorders target the serotonin system,19 the dopamine system encodes information associated with anhedonia, a core symptom of major depressive disorder.17,20–25 Interactions between the dopamine and serotonin systems are evident in drug mechanisms of action, e.g., cocaine, methamphetamine, and 3,4-methylenedioxymethamphetamine.26–29 Thus, these systems act in concert to modulate subjective states.30,31
Microdialysis is a tissue sampling technique. When combined with chemical separation and detection methods, microdialysis enables the identification and quantification of neurotransmitters, metabolites, and drugs in the extracellular space.32 Several groups including ours have optimized microdialysis to monitor brain extracellular dopamine or serotonin levels via online coupling with fast separations by high performance liquid chromatography (HPLC) and electrochemical detection in awake mice and rats.33–39 Dopamine and serotonin can be resolved in the same dialysate samples enabling biologically relevant changes in the basal and stimulated levels of these neurotransmitters to be simultaneously monitored.39,40
Here, we set out to determine the magnitude of extracellular dopamine release in the dorsal striatum (dSTR) upon optogenetic stimulation of midbrain dopaminergic neurons. The excitatory opsin Chrimson was expressed under the control of the dopamine transporter promoter in mice. Optical activation of dopamine neurons has been used to study dopaminergic encoding of reward and movement.15,41 In addition to dopamine, we observed optically induced increases in the dopamine metabolite 3-methoxytyramine (3-MT) and in serotonin levels. These findings demonstrate a functional link between the dopamine and serotonin systems in the basal ganglia. They illustrate the importance of monitoring multiple neurotransmitters simultaneously. And they suggest that opsin-induced behavioral changes may not be attributable solely to the neurotransmitter system or cell type targeted by opsin expression. That is to say, while optogenetics imparts highly selective control of specific types of neurons, brain function and behavior arise from distributed and interconnected networks.
RESULTS AND DISCUSSION
Using microdialysis,33,38,39 we quantified extracellular dopamine in a dopamine-rich projection region—the dSTR—during optical stimulation of midbrain dopamine cell bodies (Fig. 1, Fig. S1). Activation of the excitatory opsin Chrimson10 produced temporally specified increases in striatal extracellular dopamine levels (Fig. 2A). To induce dopamine release we applied 50-ms square pulses for 5 minutes. These parameters were optimized to produce reproducible neurotransmitter release detectable via microdialysis. Control mice expressing mCherry or yellow fluorescent protein (YFP) in dopamine cell bodies showed no detectable changes in dopamine upon optical stimulation (Fig. 2B).
Figure 1: Optogenetic stimulation of dopamine cell bodies.
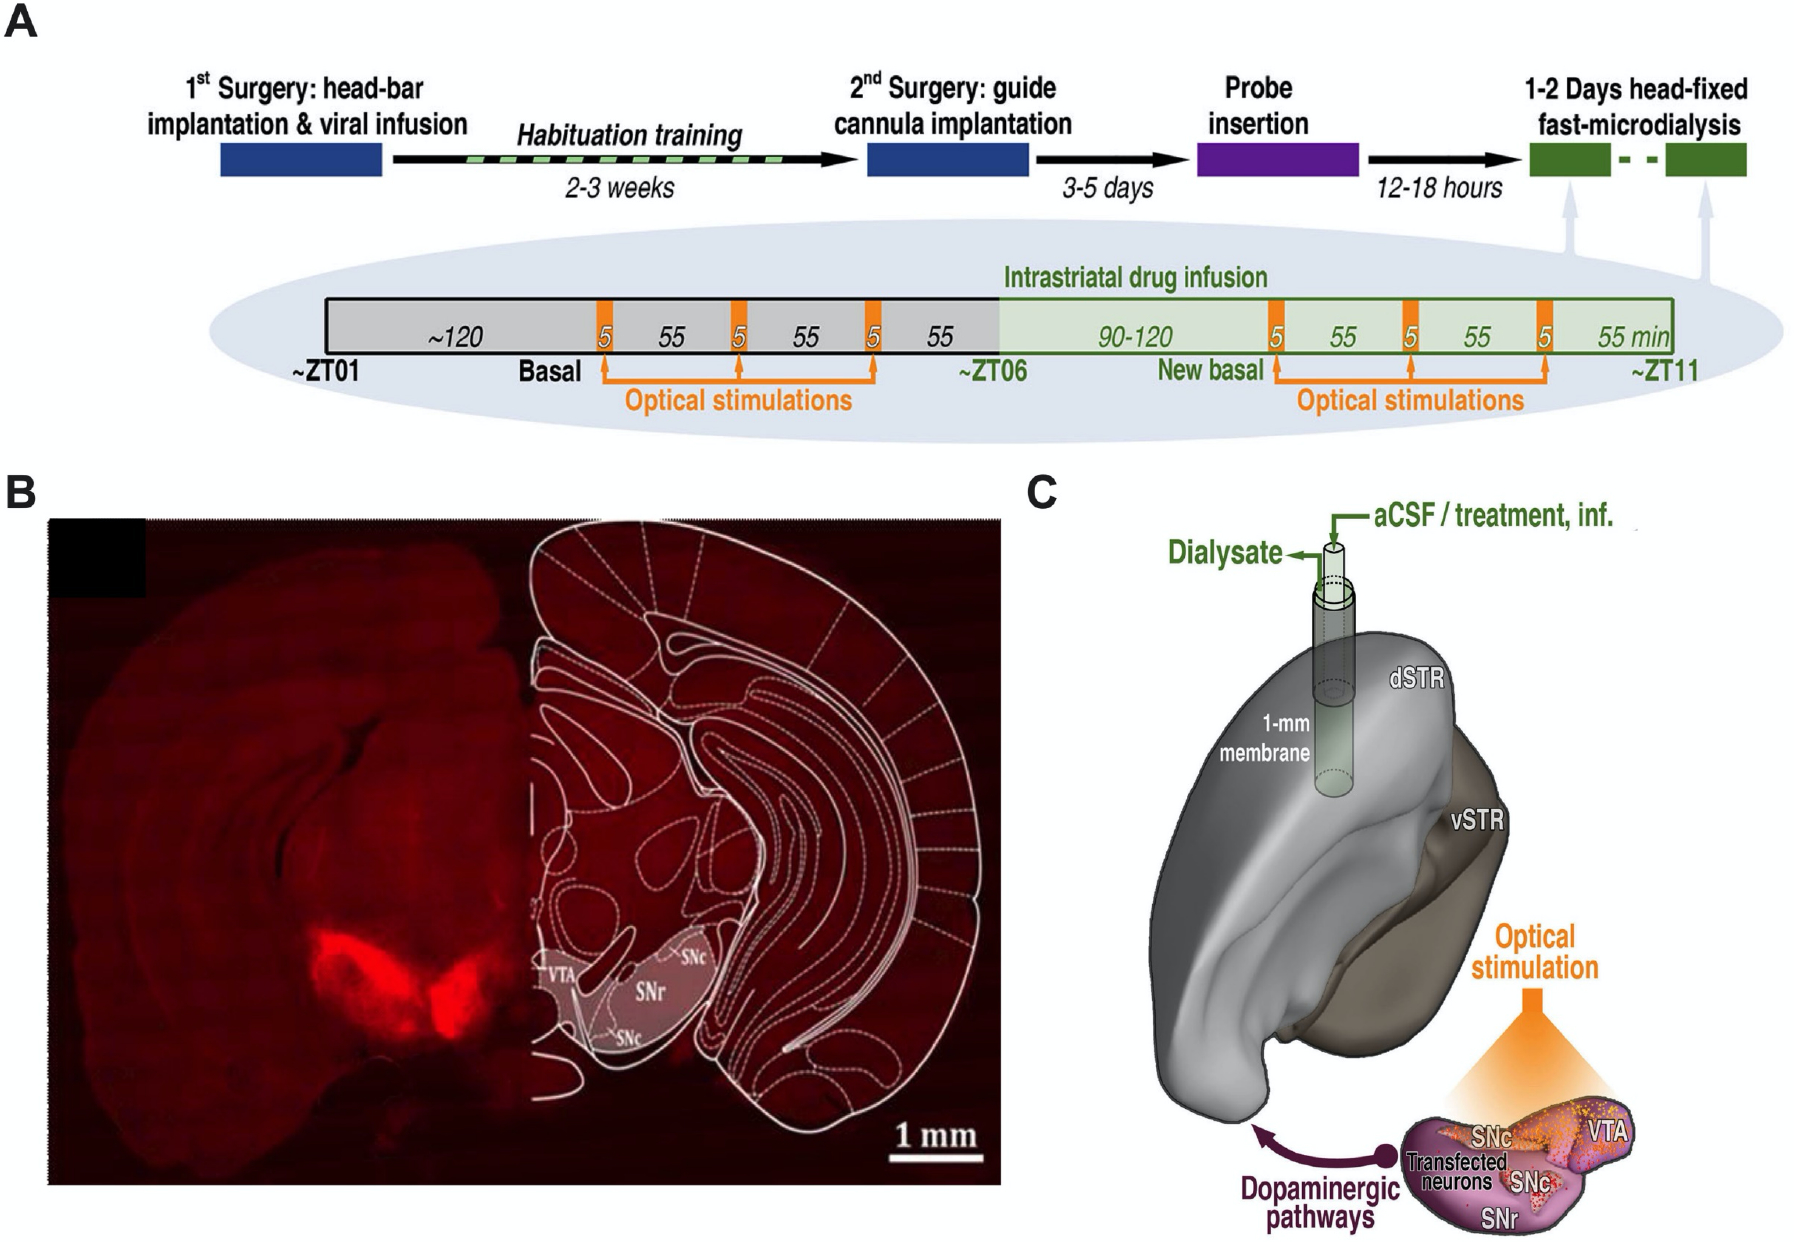
A. Experimental paradigm and timelines. Chrimson-expressing mice underwent microdialysis over two consecutive days. Control mice (transfected with mCherry or eYFP) were dialyzed only on Day 1. B. Representative optical microscopy image of unilateral Chrimson-positive neurons in the substantia nigra and ventral tegmental area. The coronal brain atlas plate 58, adapted from The Mouse Brain in Stereotaxic Coordinates, Paxinos and Franklin, 2nd edition (2001) Academic Press, is overlaid on the hemisphere contralateral to transfection. Ventral tegmental area (VTA), substantia nigra pars compacta (SNc), and substantia nigra pars reticulata (SNr) C. Model showing the location of the microdialysis probe in the dorsal striatum (dSTR) relative to Chrimson transfection and optical stimulation in the ipsalateral VTA, SNc, and SNr. Ventral striatum (vSTR), artificial cerebrospinal fluid (aCSF).
Figure 2: Optical stimulation of dopaminergic cell bodies produces dopamine release in striatal terminal regions.
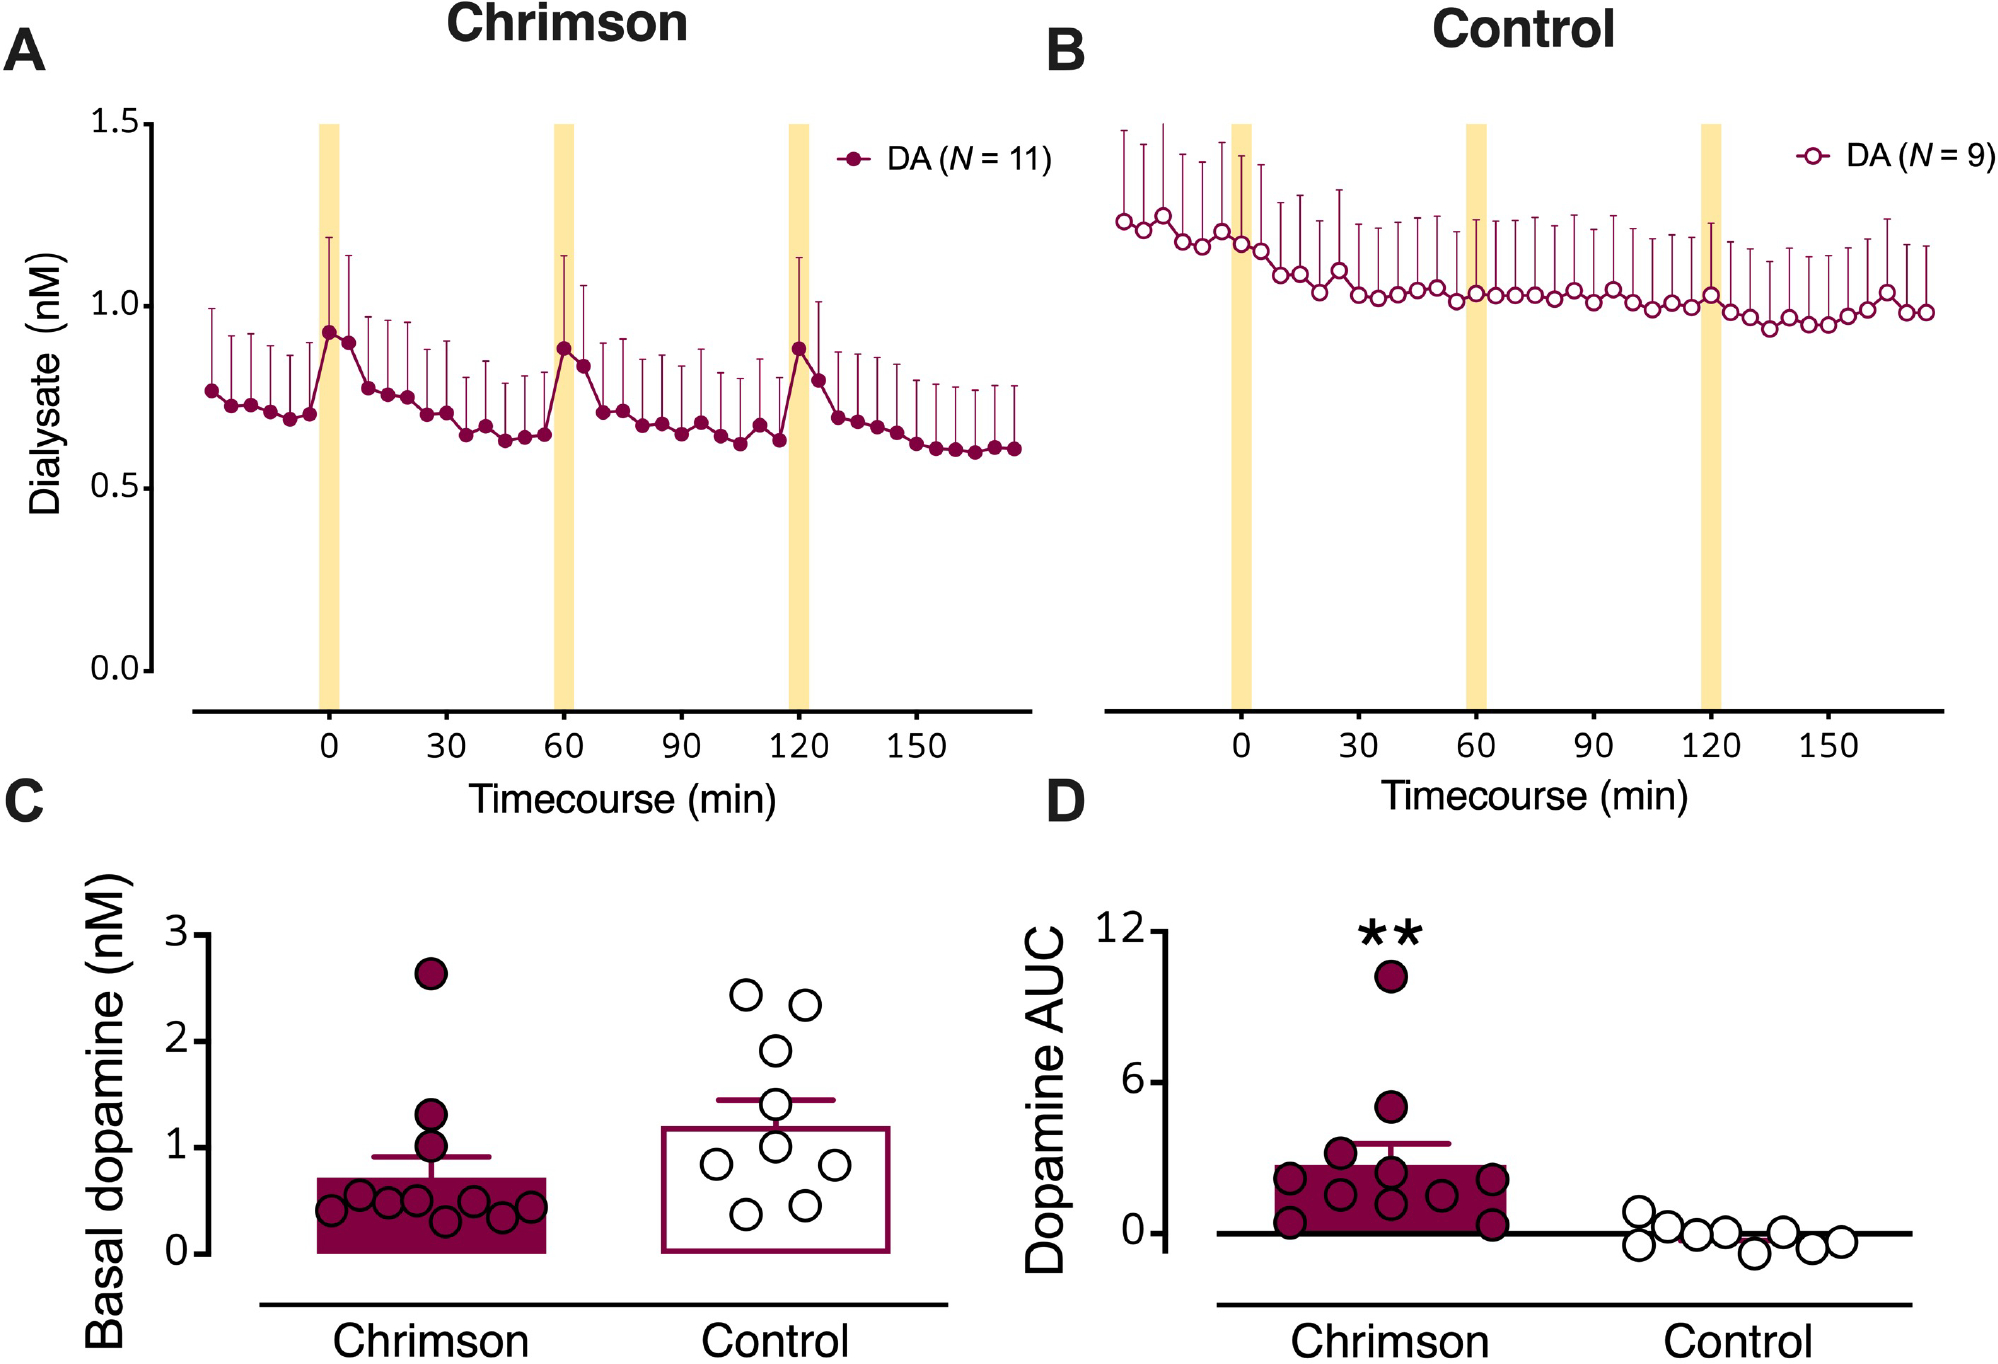
(A) Dialysate dopamine levels were increased in response to optical stimulation in mice expressing Chrimson (N=11) (B) but not in control mice (N=9). The yellow bars indicate optical stimulations (10 Hz @ 10 mw/mm2, 50 ms pulses, for 5 min). C. Basal dopamine levels in mice transfected with Chrimson relative to control mice. D. Dopamine overflow, quantified by area under the curve, was increased in Chrimson expressing but not control mice. Data are means ± SEMs. **P<0.01.
Basal (unstimulated) dialysate dopamine levels were not statistically different in Chrimson-expressing vs. control mice (Fig. 2C; see Table S1 for detailed statistics). Basal dopamine levels for control animals were normally distributed around the mean. In contrast, basal dopamine levels for Chrimson-expressing animals were not normally distributed. Individual dopamine concentrations fell mostly below the mean, apart from three animals, one of which was an outlier. Notably, this outlier is not the same animal that is an outlier for basal serotonin levels in Chrimson-transfected mice (Fig. 4a vide infra). As such, we chose to not to exclude outliers from analysis, although exclusion would have led to a statistically significant reduction in basal dopamine levels in Chrimson-transfected vs. control mice. Stimulated dopamine overflow, quantified as area under the curve (AUC), was greater in Chrimson-expressing vs. control mice (Fig. 2D; t18=3.0, P<0.01). Dopamine levels were increased by ~200 pM by optical stimulation.
Figure 4: Optical stimulation of midbrain dopamine neurons evokes overflow of 3-methyltyramine (3-MT) and serotonin in dorsal striatum (dSTR).
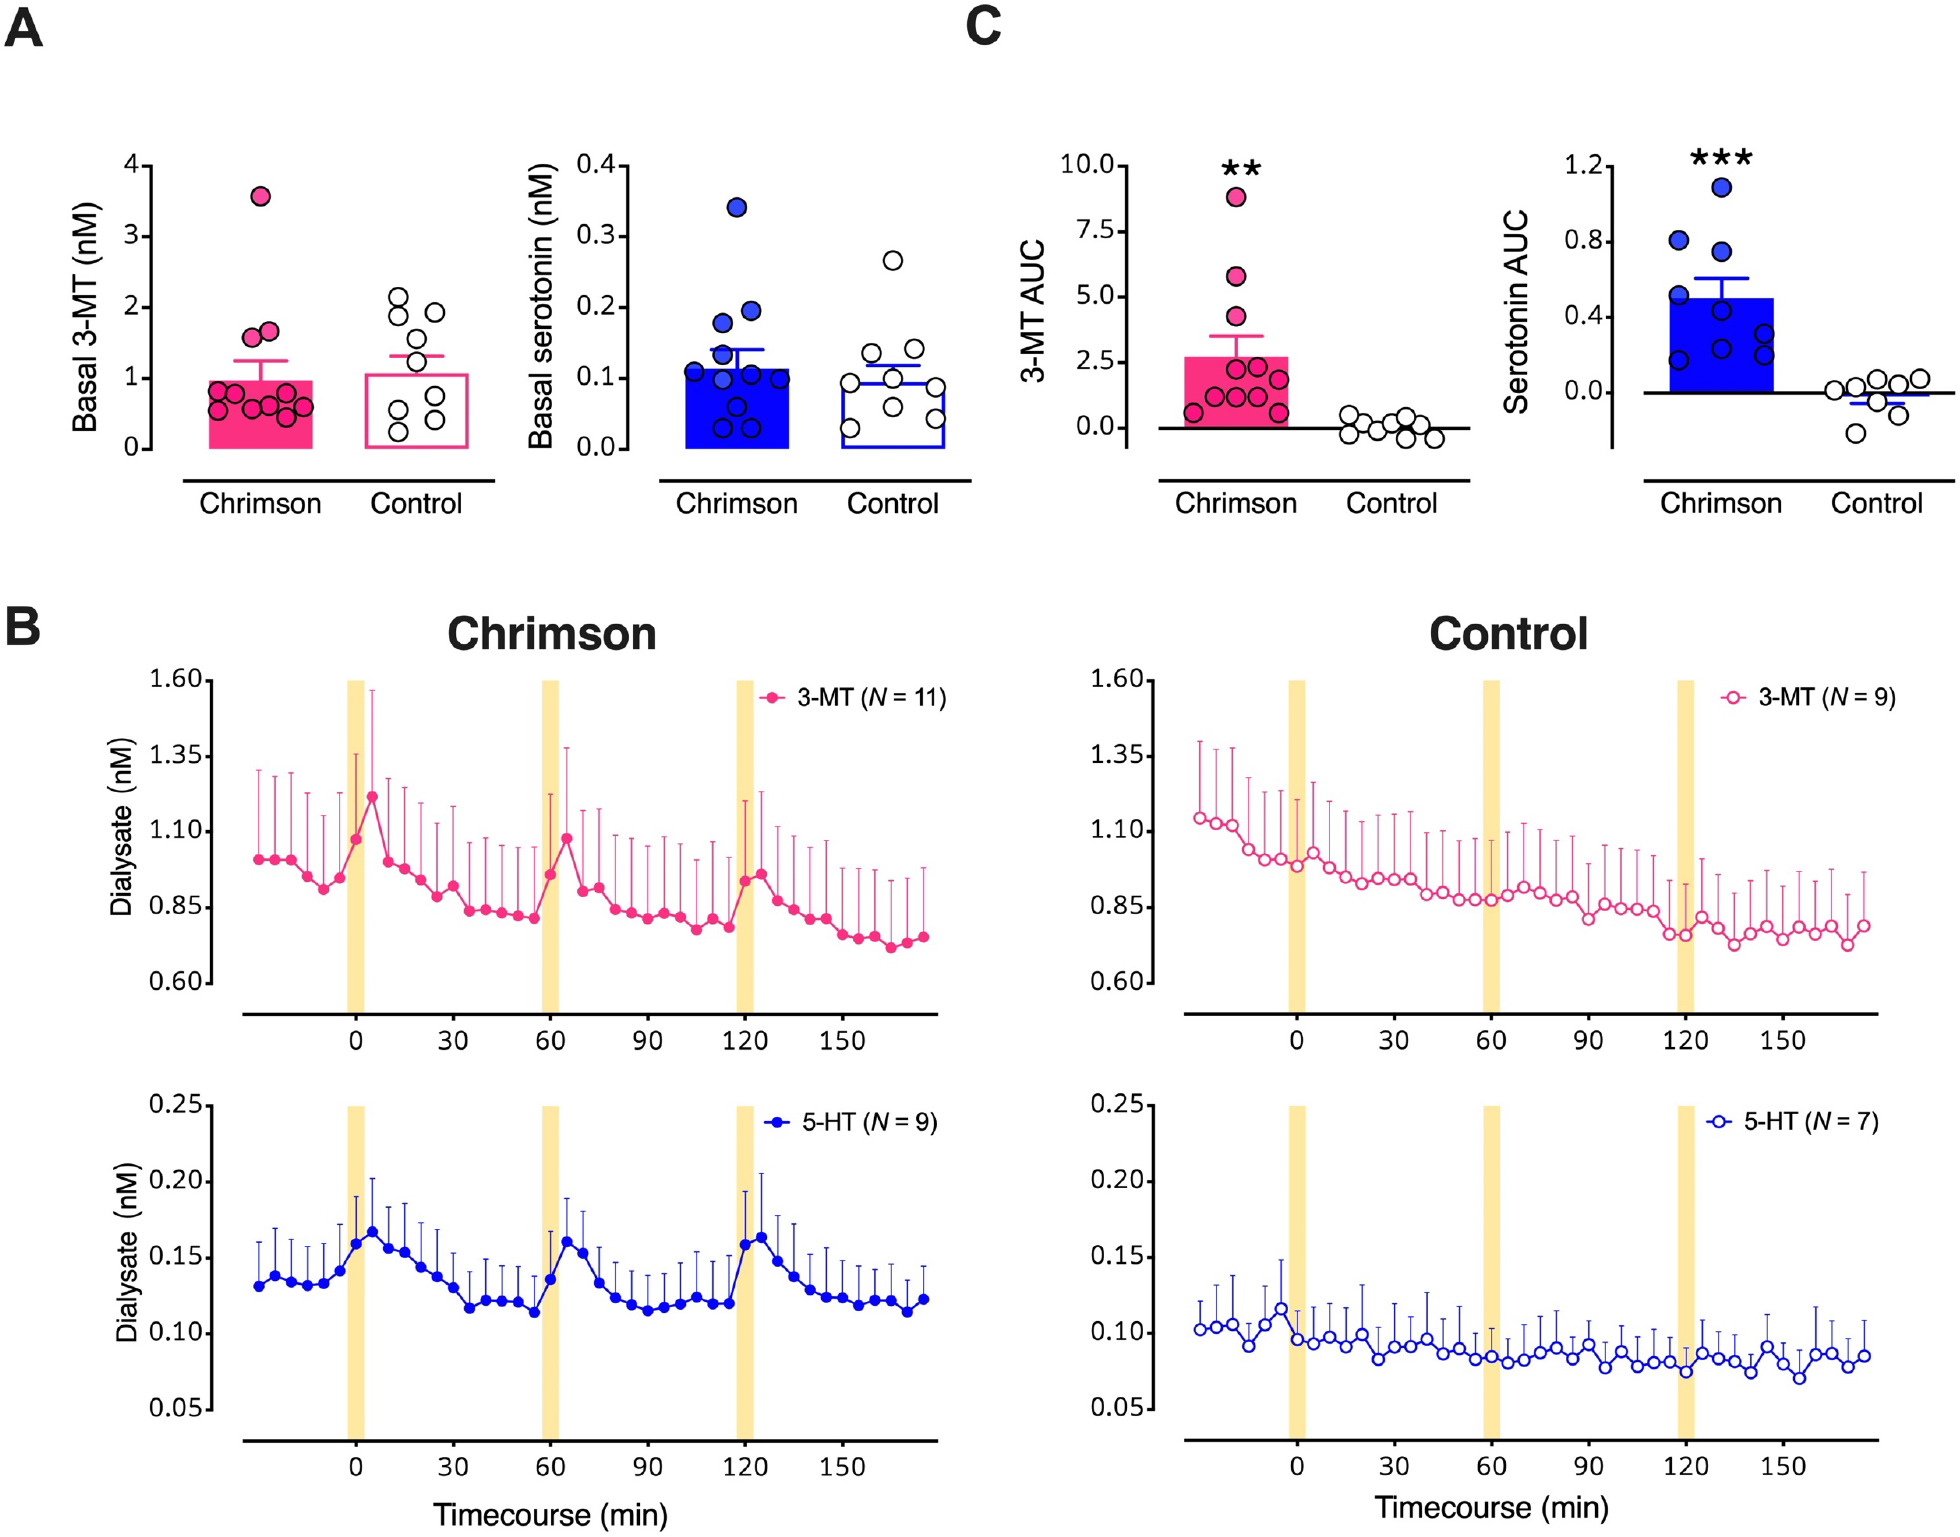
A. Basal dialysate levels of 3-MT (left, pink) and serotonin (right, blue) in mice with vs. without Chrimson transfection. B. Time course of stimulated 3-MT (pink) and serotonin (blue) in mice transfected with Chrimson (left) compared to mice transfected with a control protein (right). Yellow bars indicate 5-min optical stimulations. C. Comparisons of areas under the curve (AUC) for the overflow of 3-MT or serotonin produced by optical stimulation of dopamine neurons expressing Chrimson with respect to control mice. Data are means ± SEMs. **P<0.01, ***P<0.001. In two mice per group, data for serotonin were below the detectable limit.
In addition to dopamine, optical activation led to increases in two other chromatographic peaks (Fig. S2). We perfused a selective serotonin reuptake inhibitor (SSRI) through the dialysis membrane during intracerebral dialysis to investigate peak identity in vivo as retention times commonly shift between standards and brain dialysate samples. Responses to serotonin transporter inhibition identified the smaller, later eluting peak (peak 3) as serotonin (Fig. 3A, B).
Figure 3:
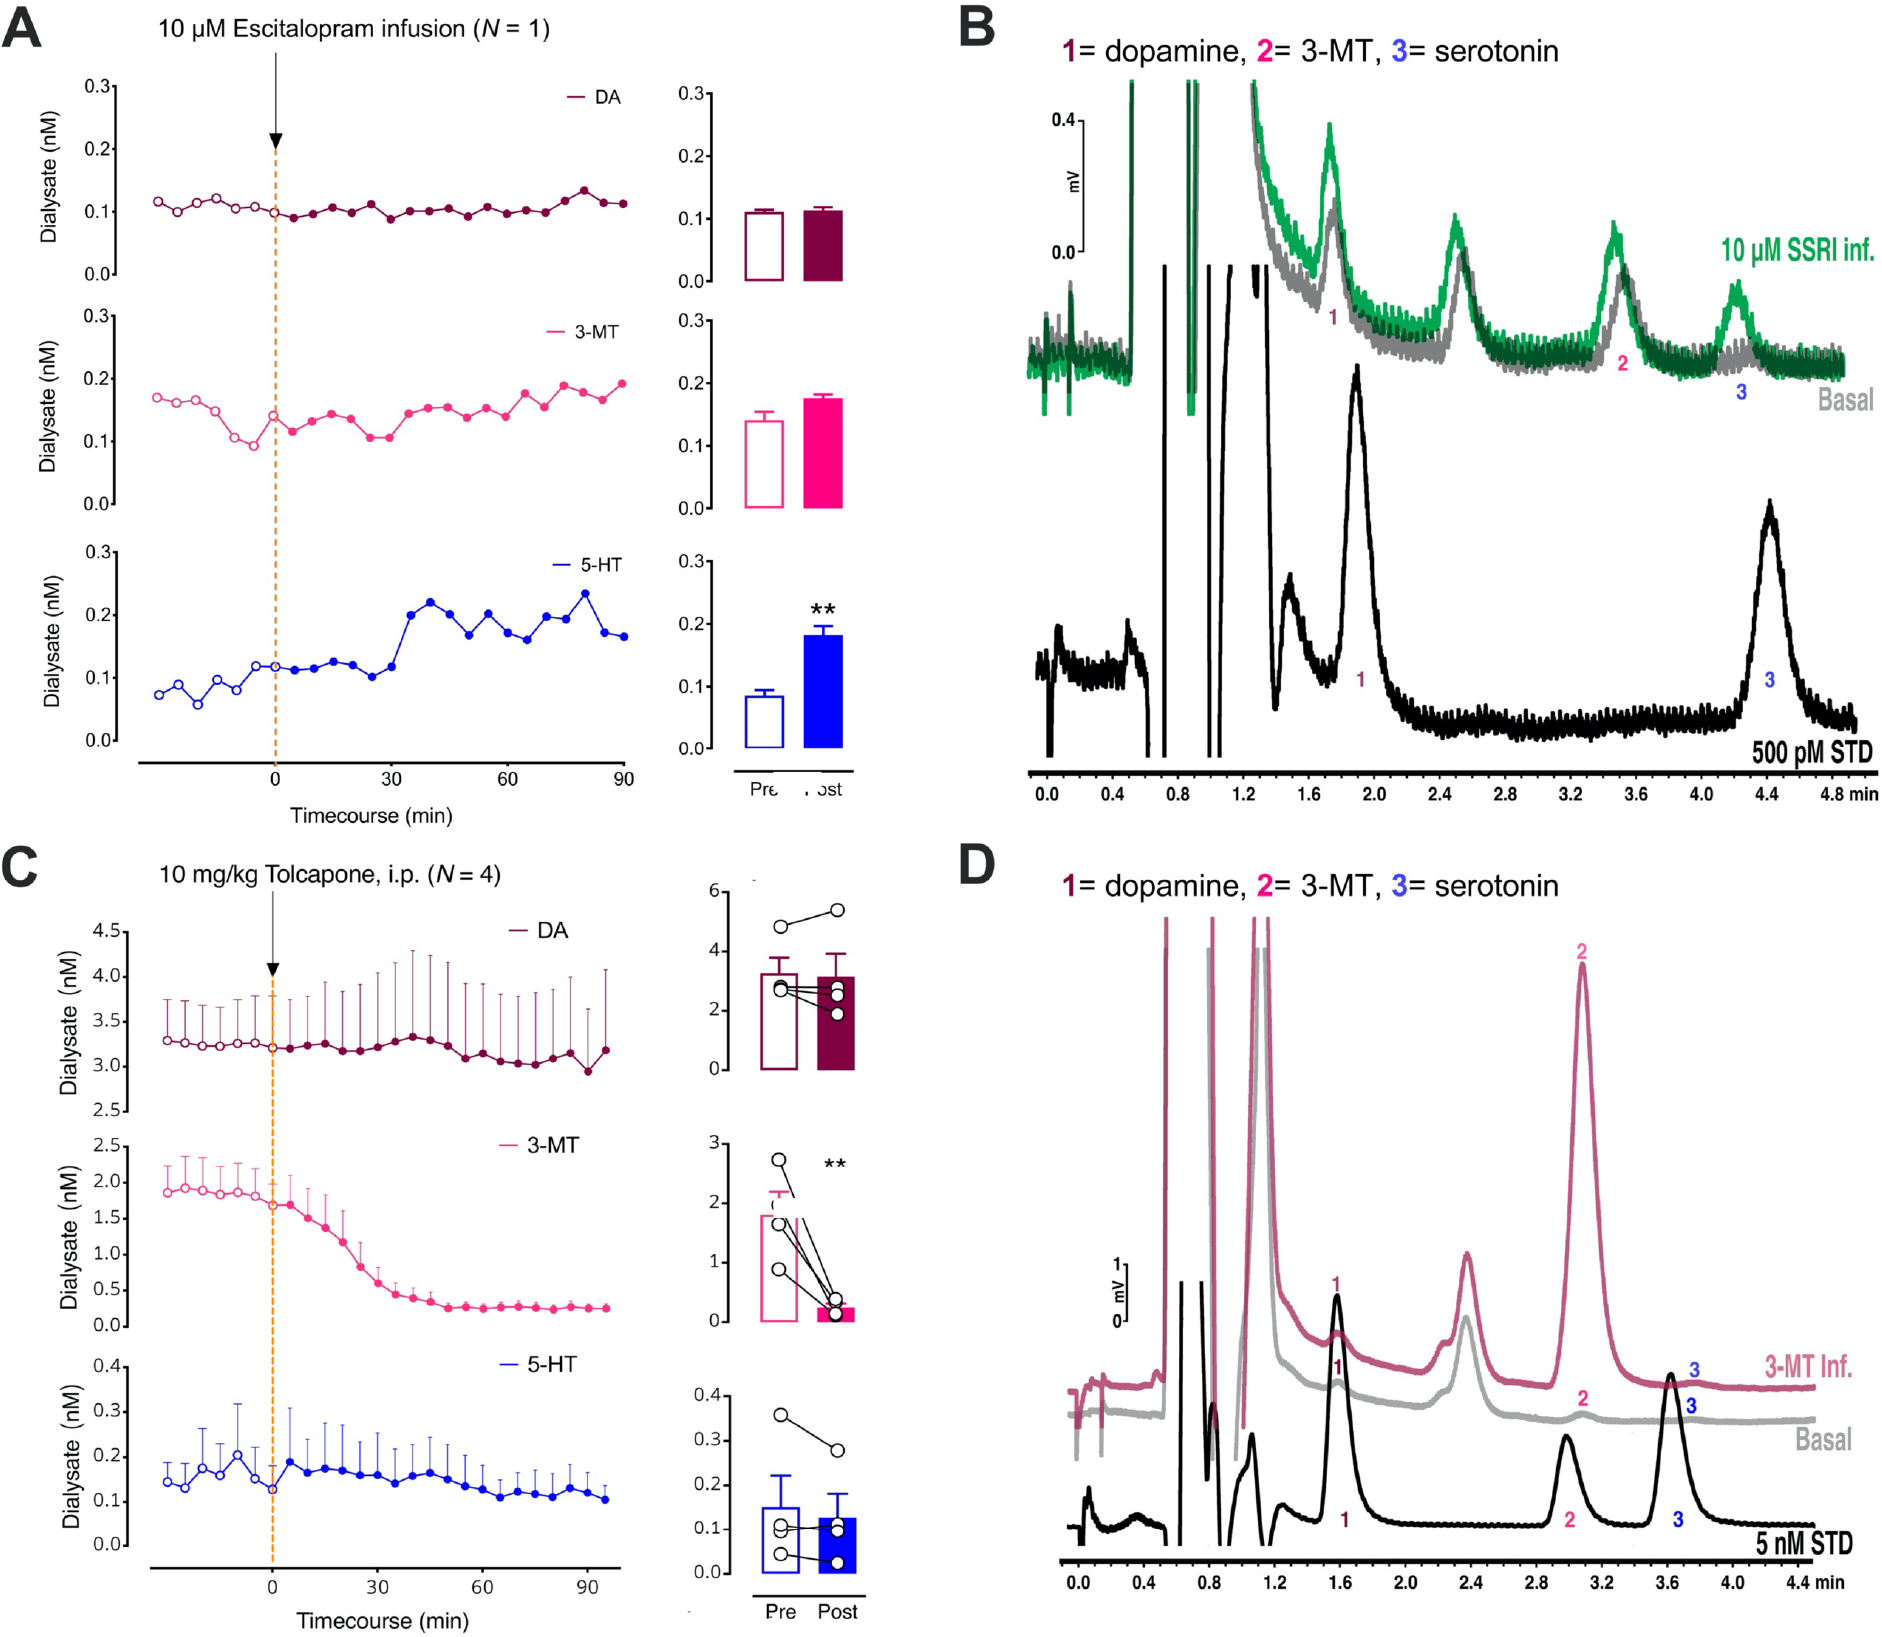
A. The left panel shows the effects of intrastriatal perfusion of 10 μM escitalopram on dopamine (DA; top, red), 3-methyltyramine (3-MT; middle, pink), and serotonin levels (5-HT; bottom, blue). Only basal 5-HT (blue) was significantly increased after escitalopram administration (right). B. Representative chromatograms (DA; 1), 3-methyltyramine (3-MT; 2), and serotonin levels (5-HT; 3) from a Chrimson-transfected mouse under basal conditions (gray) and during perfusion of the selective serotonin reuptake inhibitor (SSRI) escitalopram (green). Peak 3 showed a large increase in response to local delivery of the SSRI suggesting that this peak was serotonin. A standard containing 500 pM dopamine (peak 1) and serotonin (peak 3) is shown in black. C. The left panel shows the effects of systemic administration of tolcapone, a catechol-O- methyltransferase (COMT) inhibitor on dopamine (DA; top, red), 3-methyltyramine (3-MT; middle, pink), and serotonin levels (5-HT; bottom, blue). The enzyme COMT converts dopamine to 3-MT. Only 3-MT (pink) was significantly reduced after tolcapone administration (right). D. Representative chromatograms (DA; 1), 3-methyltyramine (3-MT; 2), and serotonin levels (5-HT; 3) after the intrastriatal perfusion of 50 nM 3-MT (red) vs. a basal dialysate sample from the same control mouse (gray). Reverse dialysis of 3-MT confirms peak 2 as 3-MT. A standard containing 5 nM dopamine (peak 1), 3-MT (peak 2), and serotonin (peak 3) is shown in black. Data in C are means ± SEMs. **P<0.01. A peak sometimes appearing between peaks 1 and 2 was not responsive to optical stimulation or high K+ perfusion, therefore, we did not attempt to identify this peak.
Previous experience analyzing striatal tissue samples led us to hypothesize that the remaining optically responsive peak was 3-methoxytyramine (3-MT). Dopamine is metabolized by catechol-O-methyltransferase (COMT) to produce 3-MT, which is hypothesized to function as a neuromodulator.42,43 We administered the COMT inhibitor tolcapone systemically44 and found that peak 2 was selectively decreased (Fig. 3C; t3=9.6, P<0.01). We also perfused 3-MT through the dialysis membrane into dSTR, i.e., in vivo standard addition, and observed a retention time match confirming the identity of peak 2 as 3-MT (Fig. 3D).
Having identified two optically (i.e., biologically) responsive neurochemicals, in addition to dopamine, we quantified their basal dialysate levels. We found no differences in basal 3-MT or serotonin levels in Chrimson-expressing vs. control mice (Fig. 4A). Optogenetic stimulation of midbrain dopaminergic neurons evoked reproducible increases in 3-MT and serotonin in Chrimson-expressing but not control mice (Fig. 4B,C; t18=3.1, P<0.01, t15=4.4, P<0.001, respectively). Since basal neurochemical levels varied across individual mice (Fig. 2C, 4A), we also analyzed basal and optically stimulated neurochemical levels normalized to mean basal levels determined in control mice (Fig. S3). Concentration and %basal analyses similarly indicated that in addition to dopamine, 3-MT and serotonin overflow were increased in response to optogenetic stimulation of Chrimson-transfected dopamine neurons. Optical stimulation of control mice lacking opsin expression indicates there were no nonspecific increases in neurochemicals due to light-induced arousal and that increases in serotonin and 3-MT were due to optical activation of Chrimson expressed by dopamine neurons.
We hypothesized parsimoniously that the increased overflow of serotonin associated with optical stimulation of dopamine neurons was mediated by activation of striatal dopamine receptors on serotonin terminals. The mRNA for DRD2 and DRD3 receptors (i.e., D2-like) was previously identified in dorsal raphe.45,46 Ren et al.47 and Spaethling et al.48 used single-cell transcriptomics to localize Drd2 transcripts to serotonergic neurons. Using RNAseq, Dymecki and colleagues identified Drd2 mRNA in dorsal raphe serotonin neurons specified by Pet1 expression.49
A small number of DRN serotonin neurons has also been reported to contain Drd1a mRNA.47,49 We carried out in situ hybridization to investigate colocalization of D1 receptor (Drd1) and serotonin transporter (Sert) mRNA in the dorsal raphe nucleus (Fig. 5A,B). We included a probe for the vesicular glutamate transporter type 3 (VGLUT3) because a subpopulation of serotonergic neurons co-expresses VGLUT350 and projects to the striatum.50,51 We found that ~25% of total Sert-positive cells in the dorsal raphe were positive for Sert mRNA alone (Fig. 5C). Approximately 10% of total Sert-positive cells showed colocalization of Sert and Drd1 mRNA, while an additional 35% of SERT-positive cells showed Drd1 and Vglut3 mRNA colocalization. Positive and negative in situ hybridization controls are shown in Figure S4.
Figure 5: Co-localization of serotonin transporter (Sert), D1 dopamine receptor (Drd1), and vesicular glutamate transporter 3 (Vglut3) mRNA in the dorsal raphe nucleus.
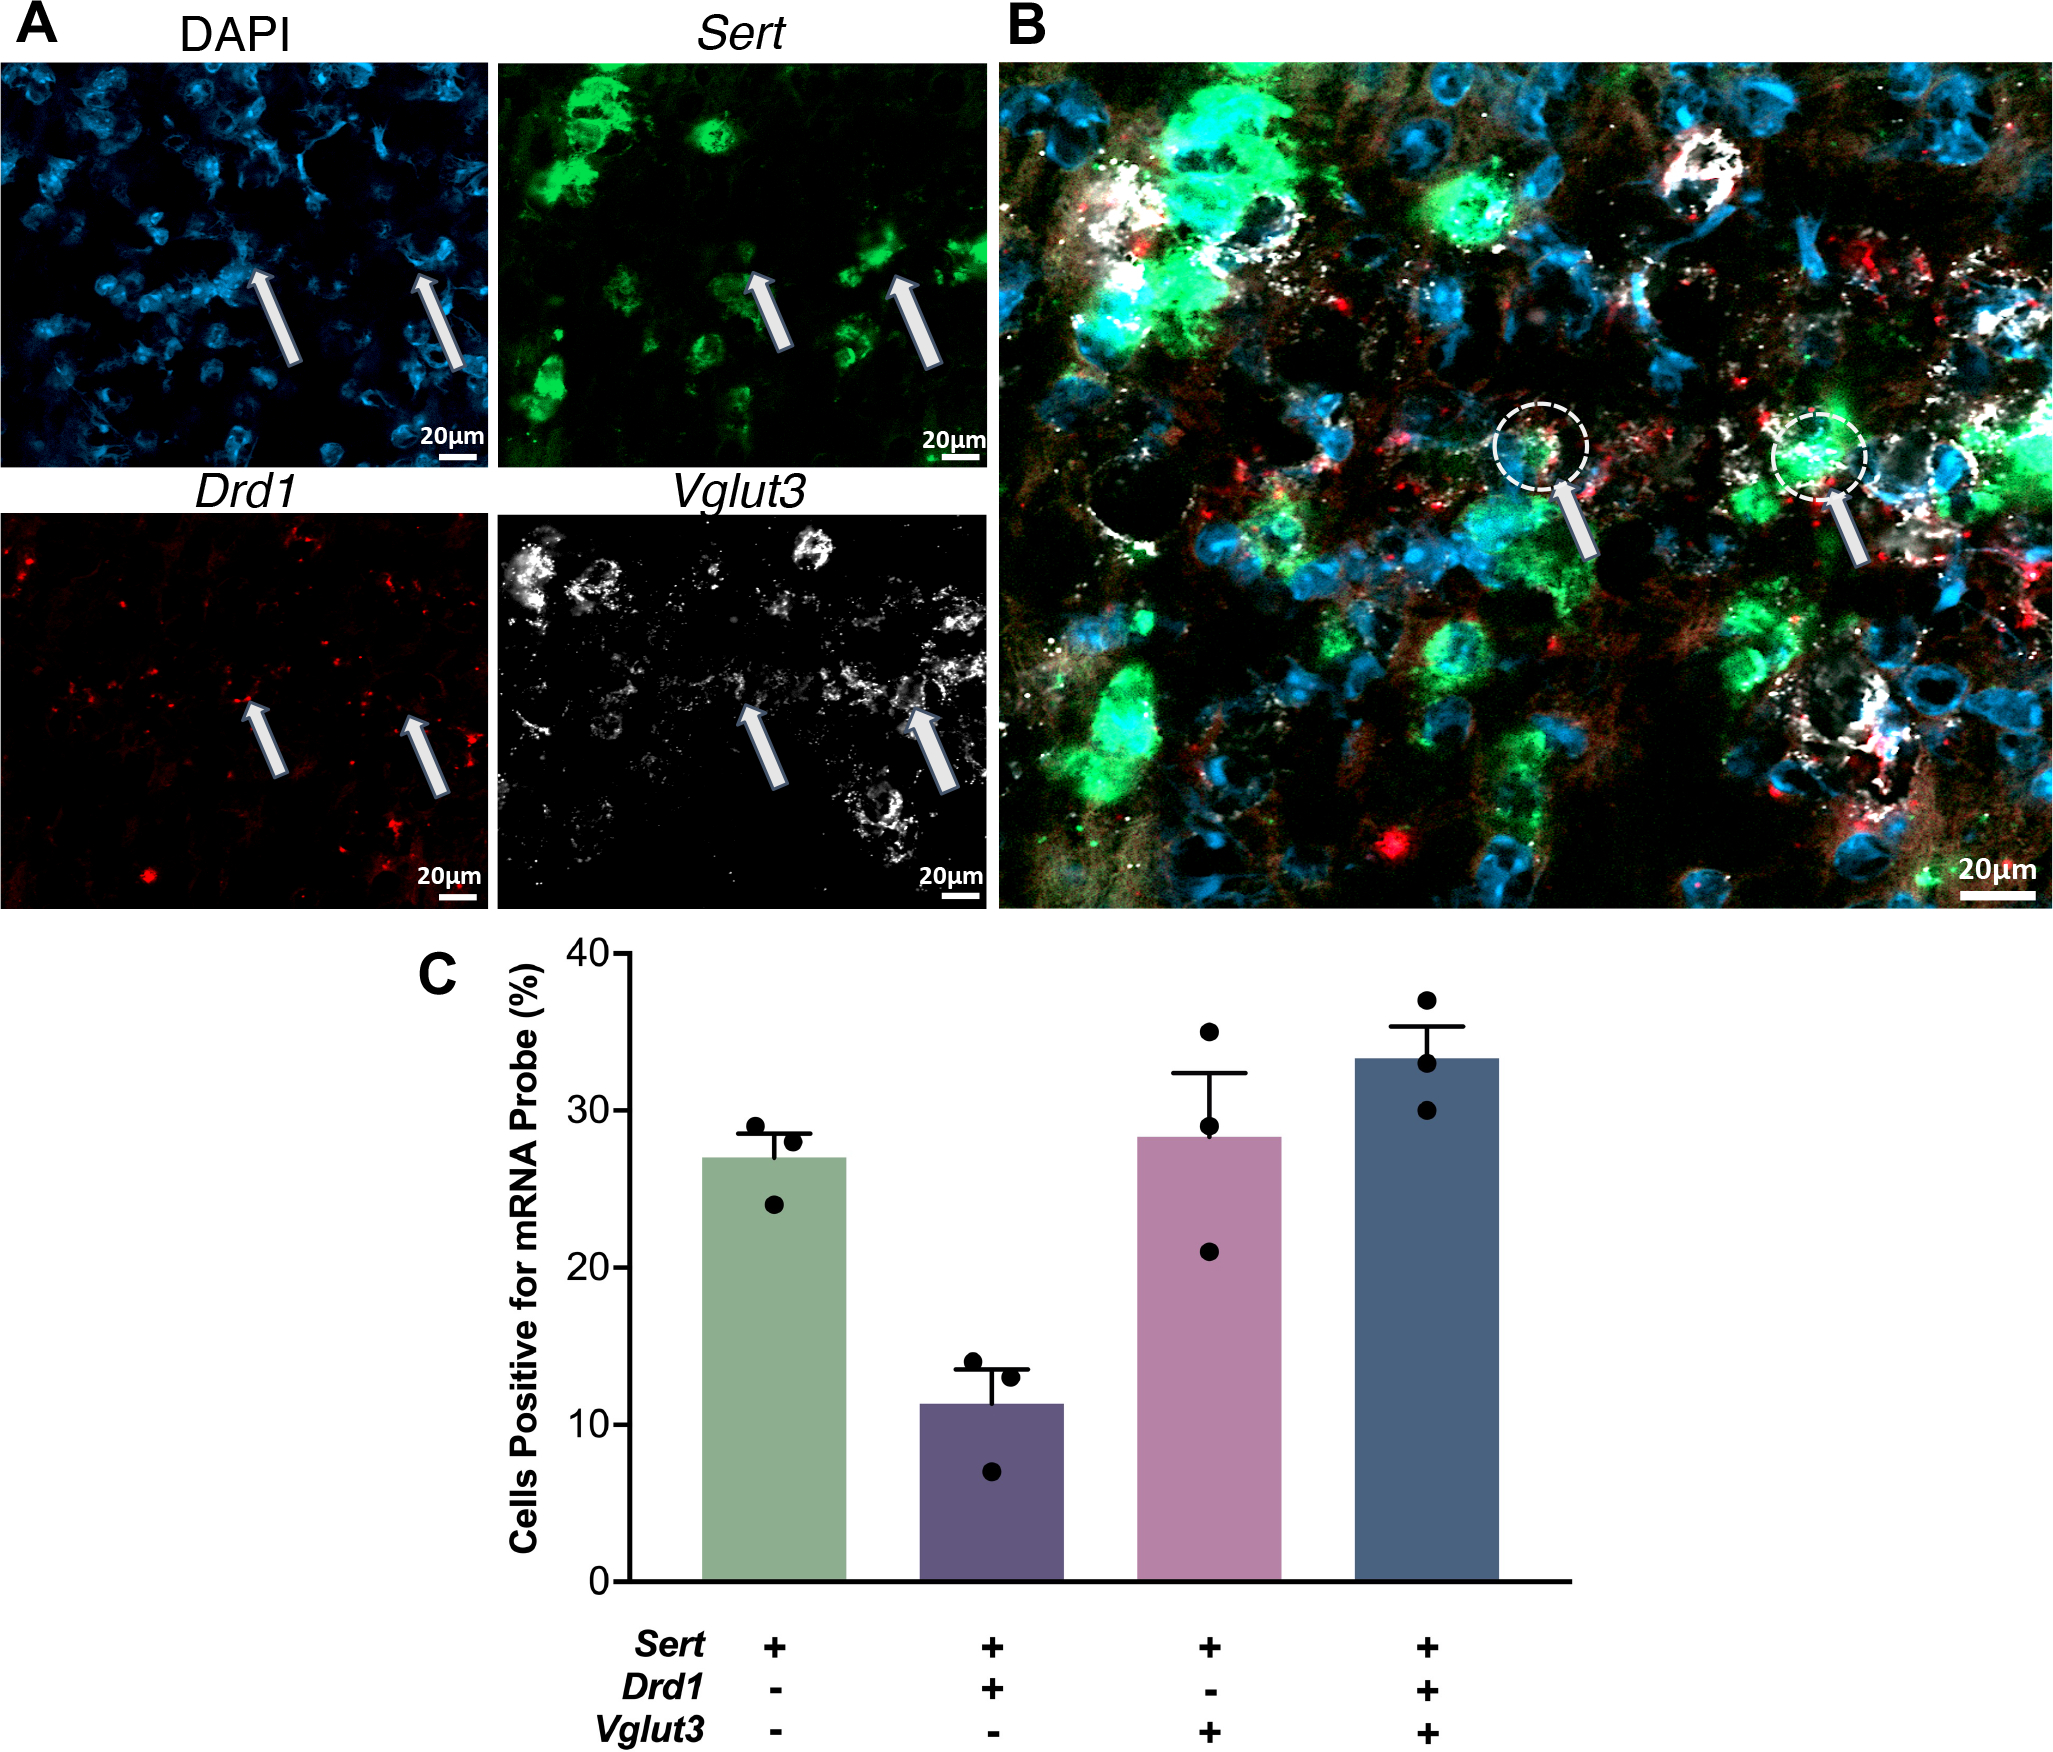
A. Cell nuclei were stained with DAPI (top left, blue). Antisense probes to localize Sert (top right, green), Drd1 (bottom left, red), and Vglut3 (bottom right, white) mRNA were visualized. Puncta for each mRNA were colocalized in some nuclei but did not necessarily overlap. B. Overlay of images in A. Arrows indicate examples of the three mRNAs colocalized in the same nuclei. C. Relative quantification of cells containing Sert, Drd1, and Vglut3 mRNA with respect to the total number of Sert expressing cell bodies. (SEMs are for n=3 z-stack planes in a single mouse. A total of 248 cells were counted).
Since our data suggest that almost half of dorsal raphe serotonin neurons may express heterologous D1 receptors, we investigated whether blocking striatal D1-like receptors prevents optically stimulated serotonin overflow. We perfused SCH 23390, a D1-like receptor antagonist, into the dSTR. Basal dopamine (t3=4.4, P<0.05) and serotonin (t3=4.4, P<0.05) levels were increased by local D1-like receptor inhibition (Fig. 6A,B). Stimulated dopamine (t3=6.2, P<0.01), 3-MT (t3=4.8, P<0.05), and serotonin (t3=4.5, P<0.05) levels were also increased by local perfusion of SCH 23390 (Fig. 6B,C). Elevations in striatal dopamine levels in response to SCH-23390 have been previously reported.52 In addition to serotonin neurons, medium spiny neurons (MSNs) in striatum express D1 receptors. Blocking D1-receptors on MSNs disinhibits dopamine neurons causing an increase in dopamine levels.53,54
Figure 6: Intrastriatal perfusion of a D1-like receptor inhibitor.
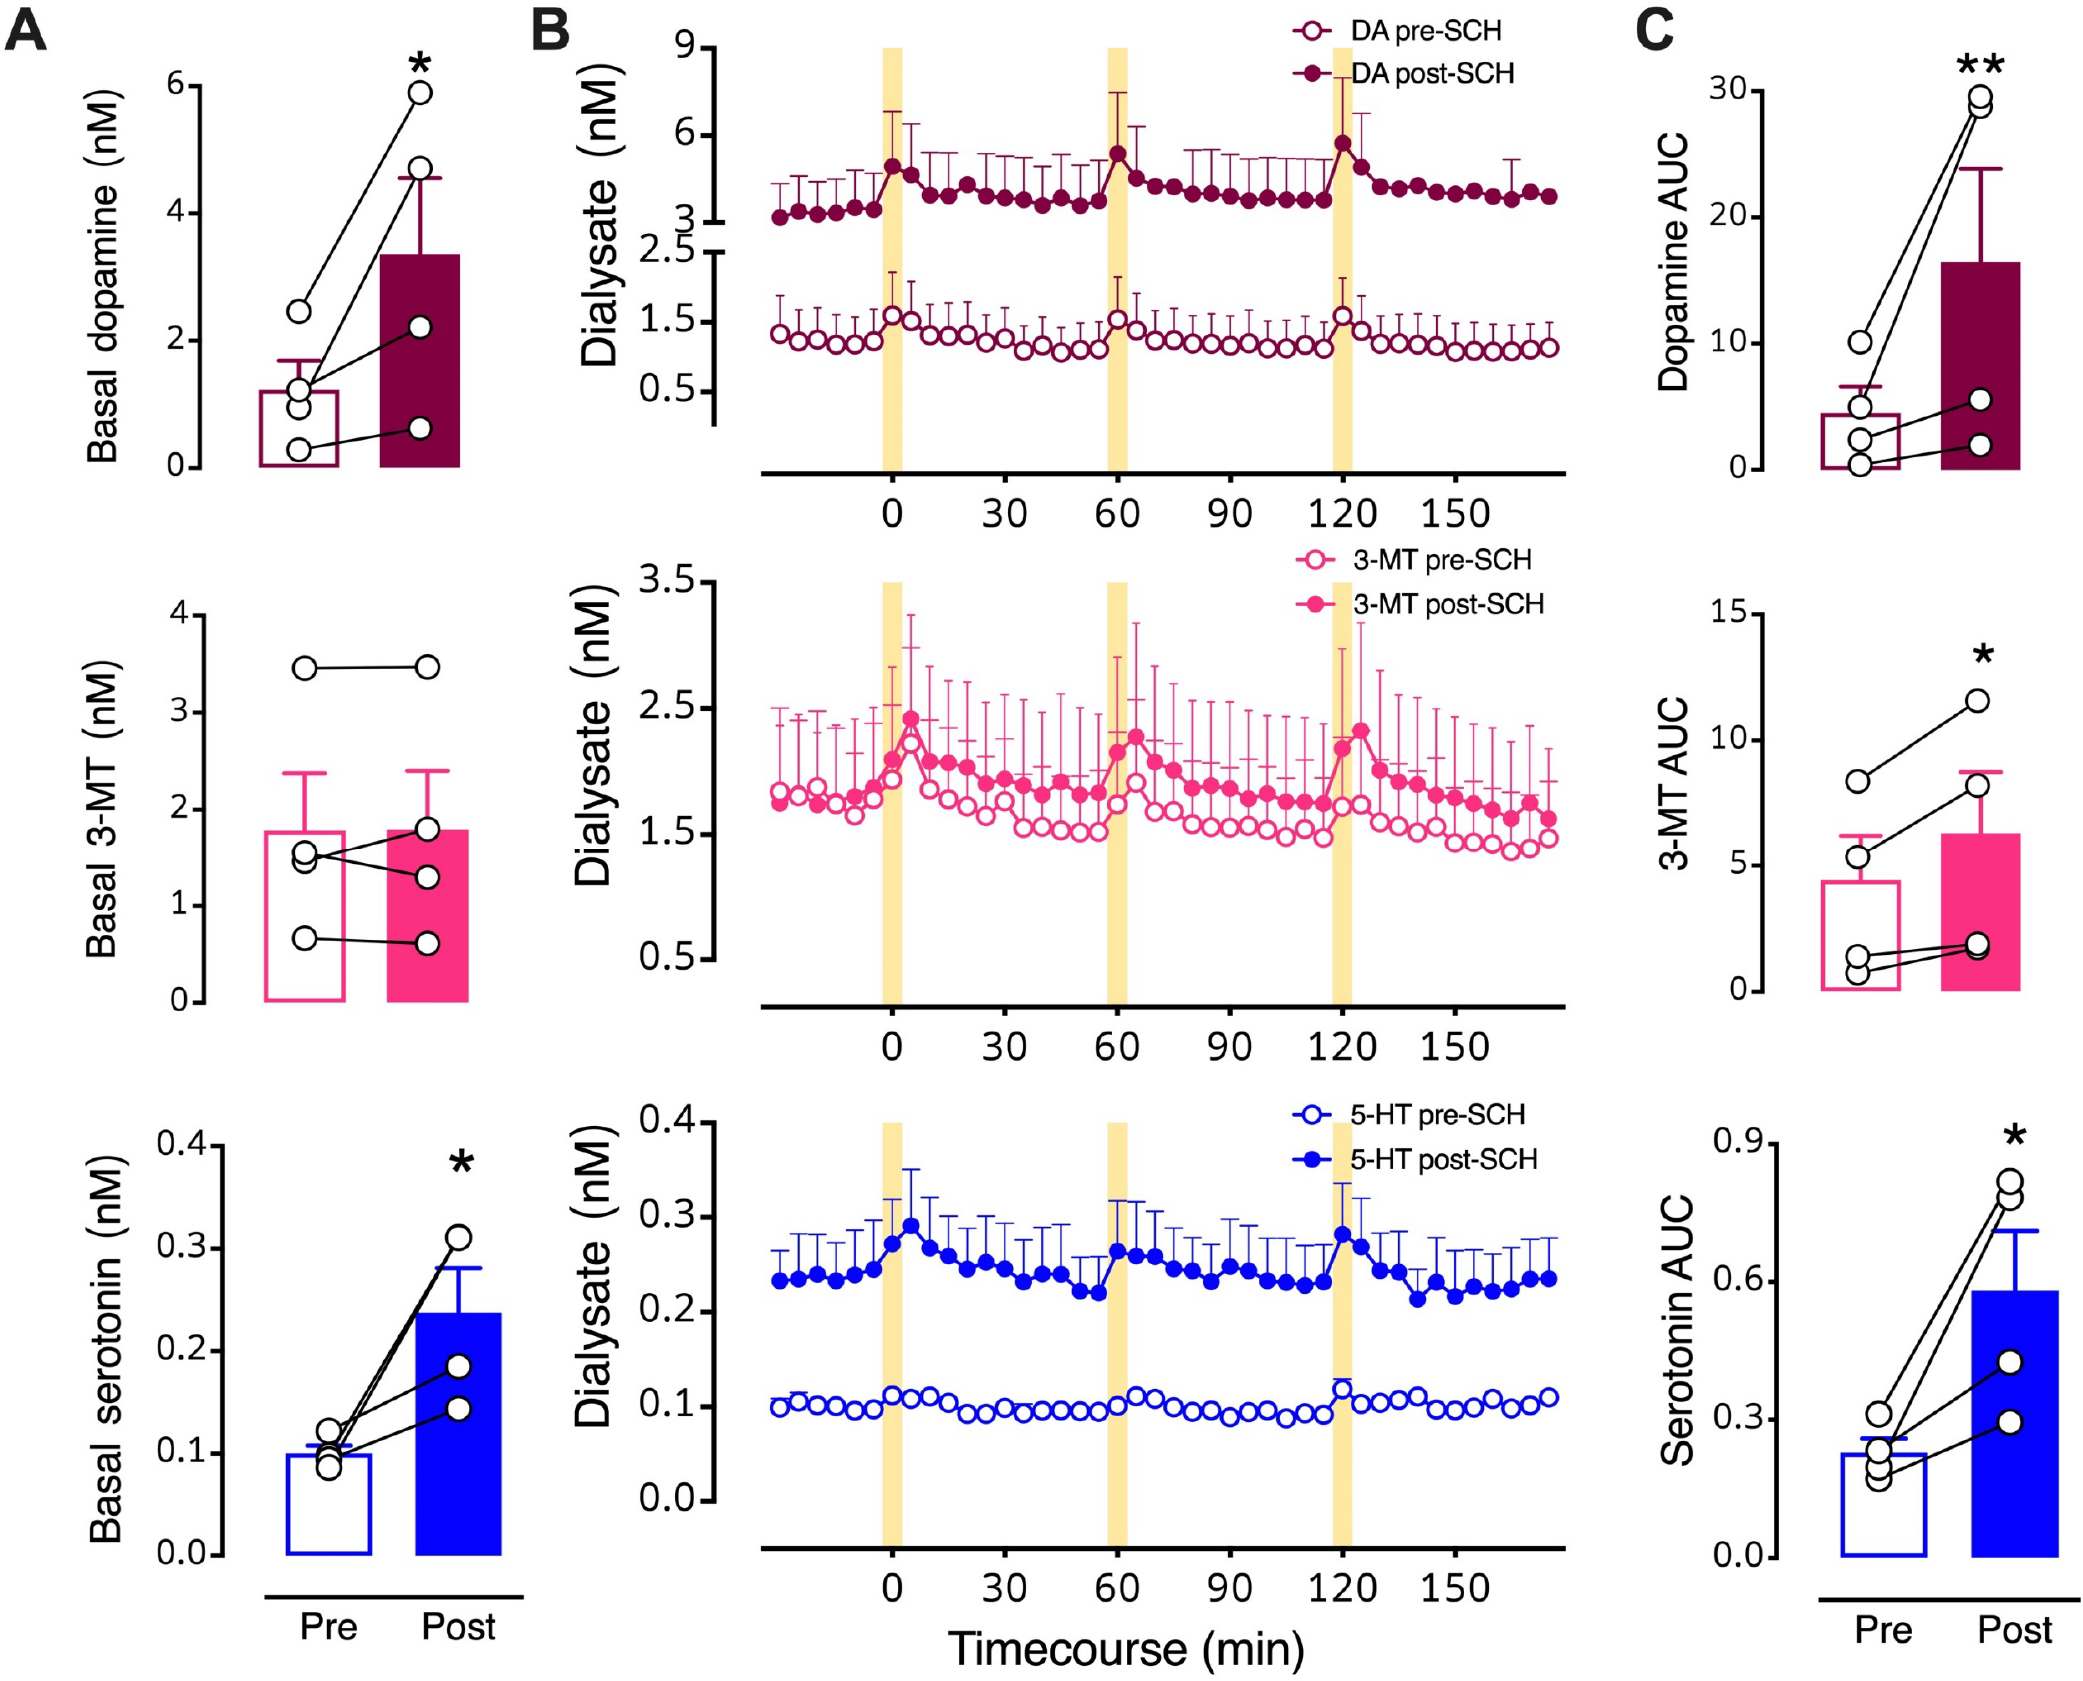
A. Basal levels for the three neurochemicals pre- vs. post-SCH 23390. B. Time courses before and during intrastriatal perfusion of 100 μM SCH 23390 showing optically stimulated increases in dopamine (red, top), 3-methyltyramine (3-MT; pink, middle), and serotonin (blue, bottom). C. Area under the curve (AUC) comparisons of overflow induced by optical stimulation prior to (Pre) and during (Post) SCH 23390 striatal perfusion. Following three pre-drug stimuli, SCH 23390 was perfused for 90–120 min in each mouse prior to the first post-drug stimulation (see Fig. 1A for timeline). The data 30 min prior to the first post-drug stimulus were used to calculate post-drug basal levels. The drug was continuously perfused throughout the post-drug stimulation period. Data are means ± SEMs. *P<0.05, **P<0.01 pre- vs. post- initiation of drug perfusion. N=4 mice. Each basal data point in A represents the mean of six measurements taken just prior to the first pre- or post-drug stimulation (errors not shown). The AUC data points in C are means of each of the three stimuli (errors not shown).
To focus on optically stimulated neurochemical levels, we normalized the SCH 23390 time-course data to pre-drug basal neurochemical levels determined in each mouse (Fig. 7). Similar to the dialysate concentration analysis (Fig. 6), %basal analysis indicated that SCH 23390 increased basal dopamine (t3=4.4, P<0.05) and serotonin (t3=4.4, P<0.05) (Fig. 7A,B). However, when normalized to respective pre-drug basal levels, potentiation of optically stimulated dopamine, 3-MT, or serotonin was no longer evident during striatal SCH 23390 perfusion (Fig. 7B,C). Thus, increases in the stimulated AUCs calculated using dialysate concentrations (Fig. 6C) were largely the result of SCH 29930-induced increases in basal dialysate concentrations.
Figure 7: Effects of intrastriatal perfusion of a D1-like receptor inhibitor analyzed with respect to pre-drug basal levels.
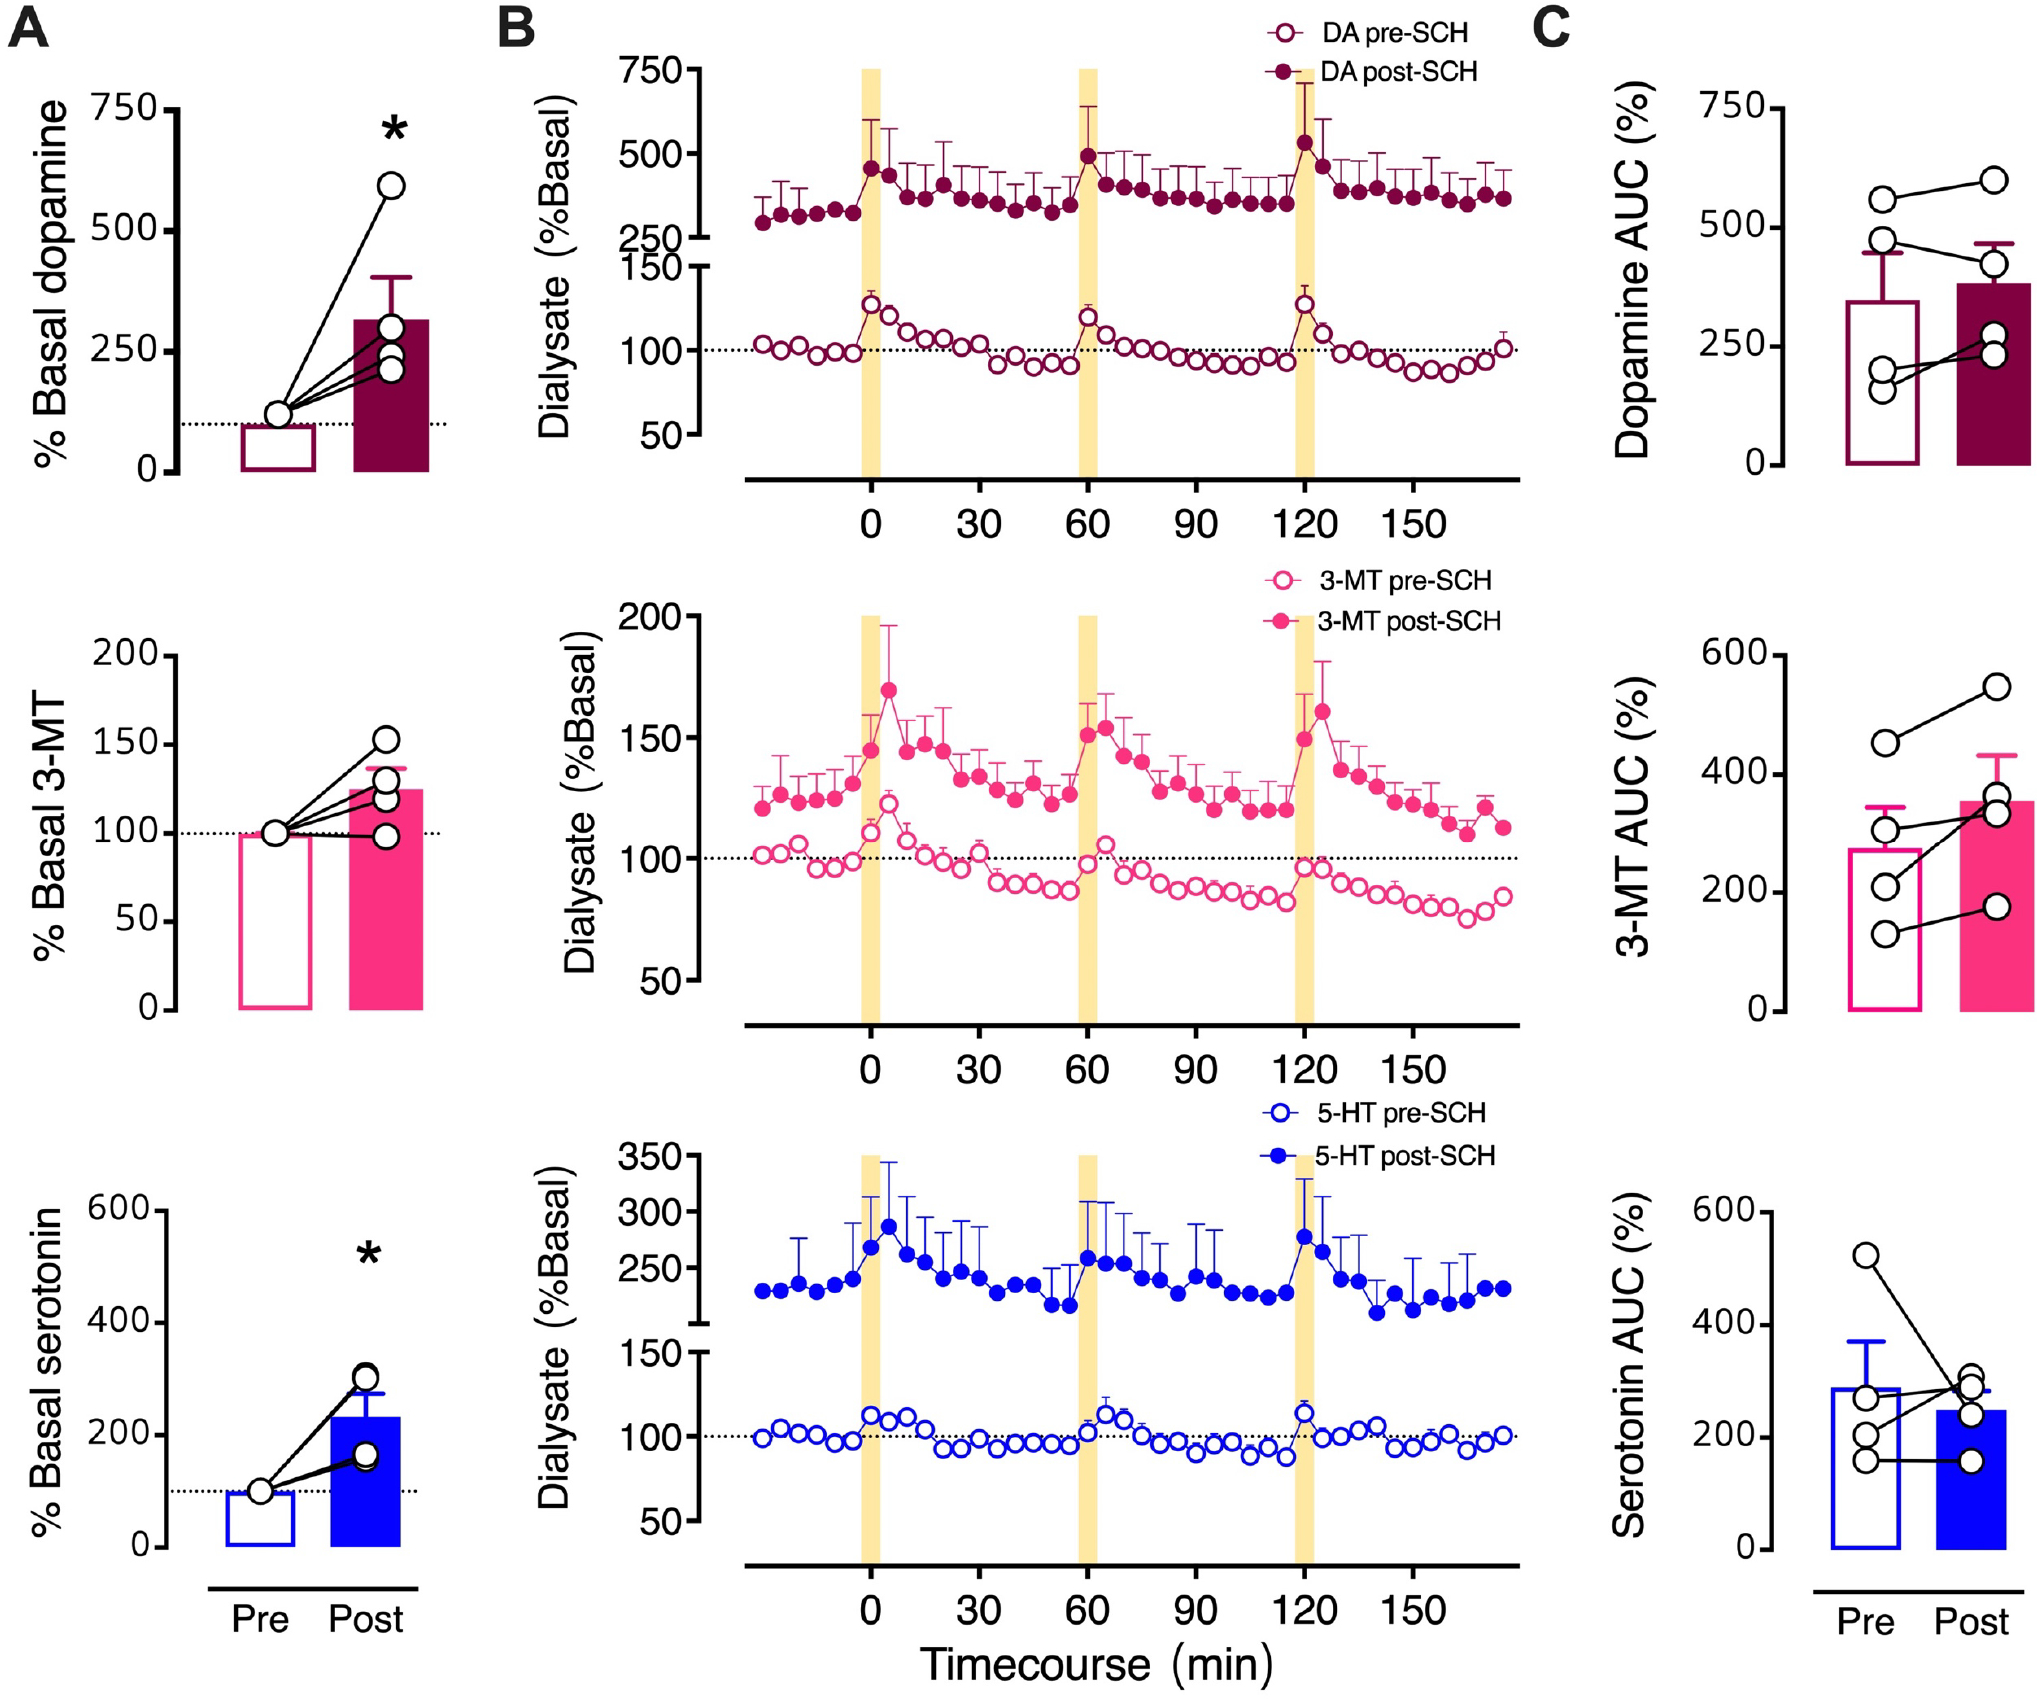
A. Basal neurochemical levels expressed as a percent of average basal levels. B. Time courses of optically stimulated neurochemical levels before and during intrastriatal perfusion of SCH 23390 (100 μM). C. Optically evoked overflow expressed as area under the curve for data normalized to pre-drug basal levels (AUC (%)). Data are means ± SEMs. *P<0.05 vs. pre-drug. N=4 mice. %Basal data points in A represent the means of six measurements just prior to the first stimulation (errors not shown). The AUC datapoints in C are means for the three stimuli (errors not shown).
The D1-like receptor inhibitory increase in basal serotonin levels can be explained by a circuit connecting dSTR to the DRN.1 Approximately, 95% of projections from the dSTR to the DRN are D1-expressing MSNs,1 which tonically inhibit DRN (and presumably serotoninergic) neurons. Blocking D1-like receptors on MSNs dendritic spines55 could reduce tonic inhibition of DRN cell populations leading to increased serotonin levels in the dSTR. Regardless, local inhibition of D1 heteroreceptors on serotonin terminals and/or MSNs did not prevent optically evoked striatal serotonin.
Mice that received the D1-like inhibitor on day 1 of microdialysis were perfused with eticlopride (ETC), a D2-like receptor antagonist, on day 2 (Fig. 1A). Inhibition of D2-like receptors, which are expressed as dopaminergic heteroreceptors and autoreceptors in striatum,56 was not associated with changes in basal levels of dopamine, 3-MT, and serotonin (Fig. 8A,9A). However, eticlopride perfusion into the dSTR potentiated optically evoked dopamine and 3-MT analyzed either as basal (nM) concentrations (Fig. 8B,C) or %basal levels (Fig. 9B,C), though these changes were not always statistically significant due to the small sample sizes. Previous studies have shown that extracellular dopamine is increased upon inhibition of presynaptic D2 receptors.57,58 Significant differences in optically evoked serotonin levels in the presence vs. absence of eticlopride were not apparent by either analysis method (Fig. 8C,9C). In the context of our current hypothesis, and like striatal D1-like receptor inhibition, D2-like inhibition did not block serotonin overflow associated with optically evoked dopamine release.
Figure 8: Intrastriatal perfusion of a D2 antagonist does not prevent optically evoked serotonin.
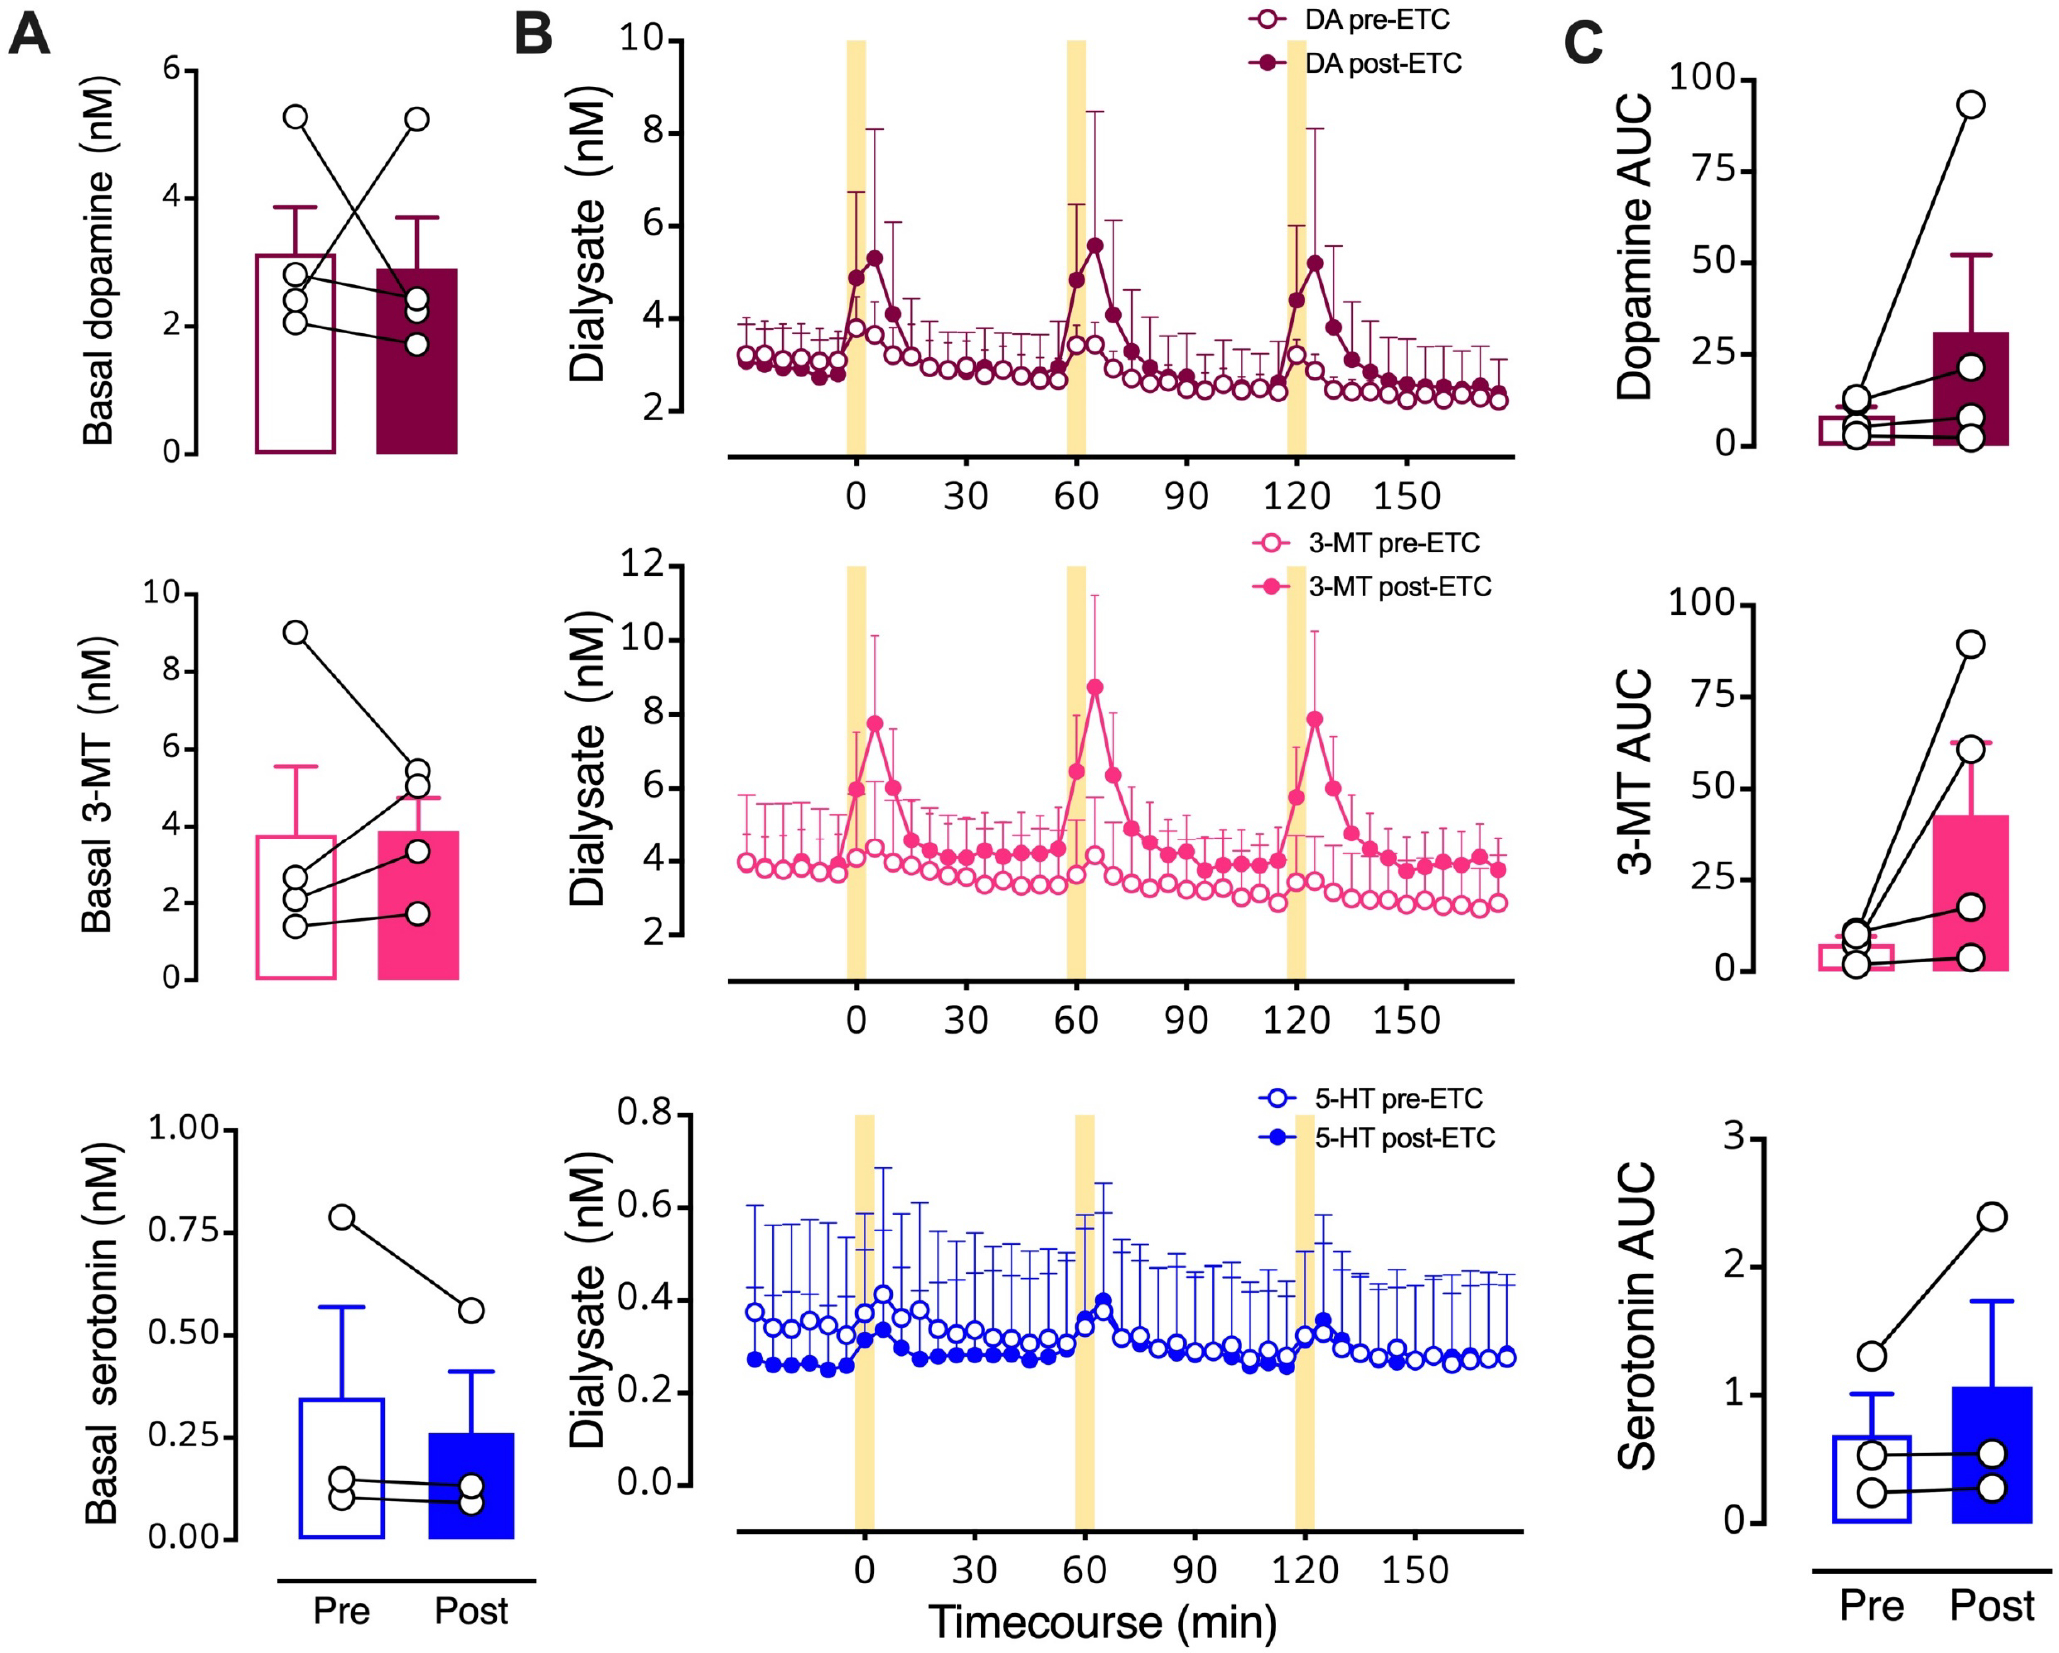
A. Pre- vs. post-eticlopride basal levels of all three neurochemicals. B. Timecourse before and during intrastriatal infusion of the D2-like receptor inhibitor eticlopride (100 μM). C. Areas under the curve (AUC) for optically stimulated neurochemical release prior to (Pre) and during (Post) eticlopride perfusion into striatum. Data are means ± SEMs for N=4 mice. Serotonin levels for one mouse were not detectable. Basal data points (A) represent the means of six measurements just prior to the first stimulation (errors not shown). The AUC datapoints (C) represent the means of three stimuli (errors not shown).
Figure 9: Effects of intrastriatal perfusion of a D2 antagonist analyzed with respect to pre-drug basal levels.
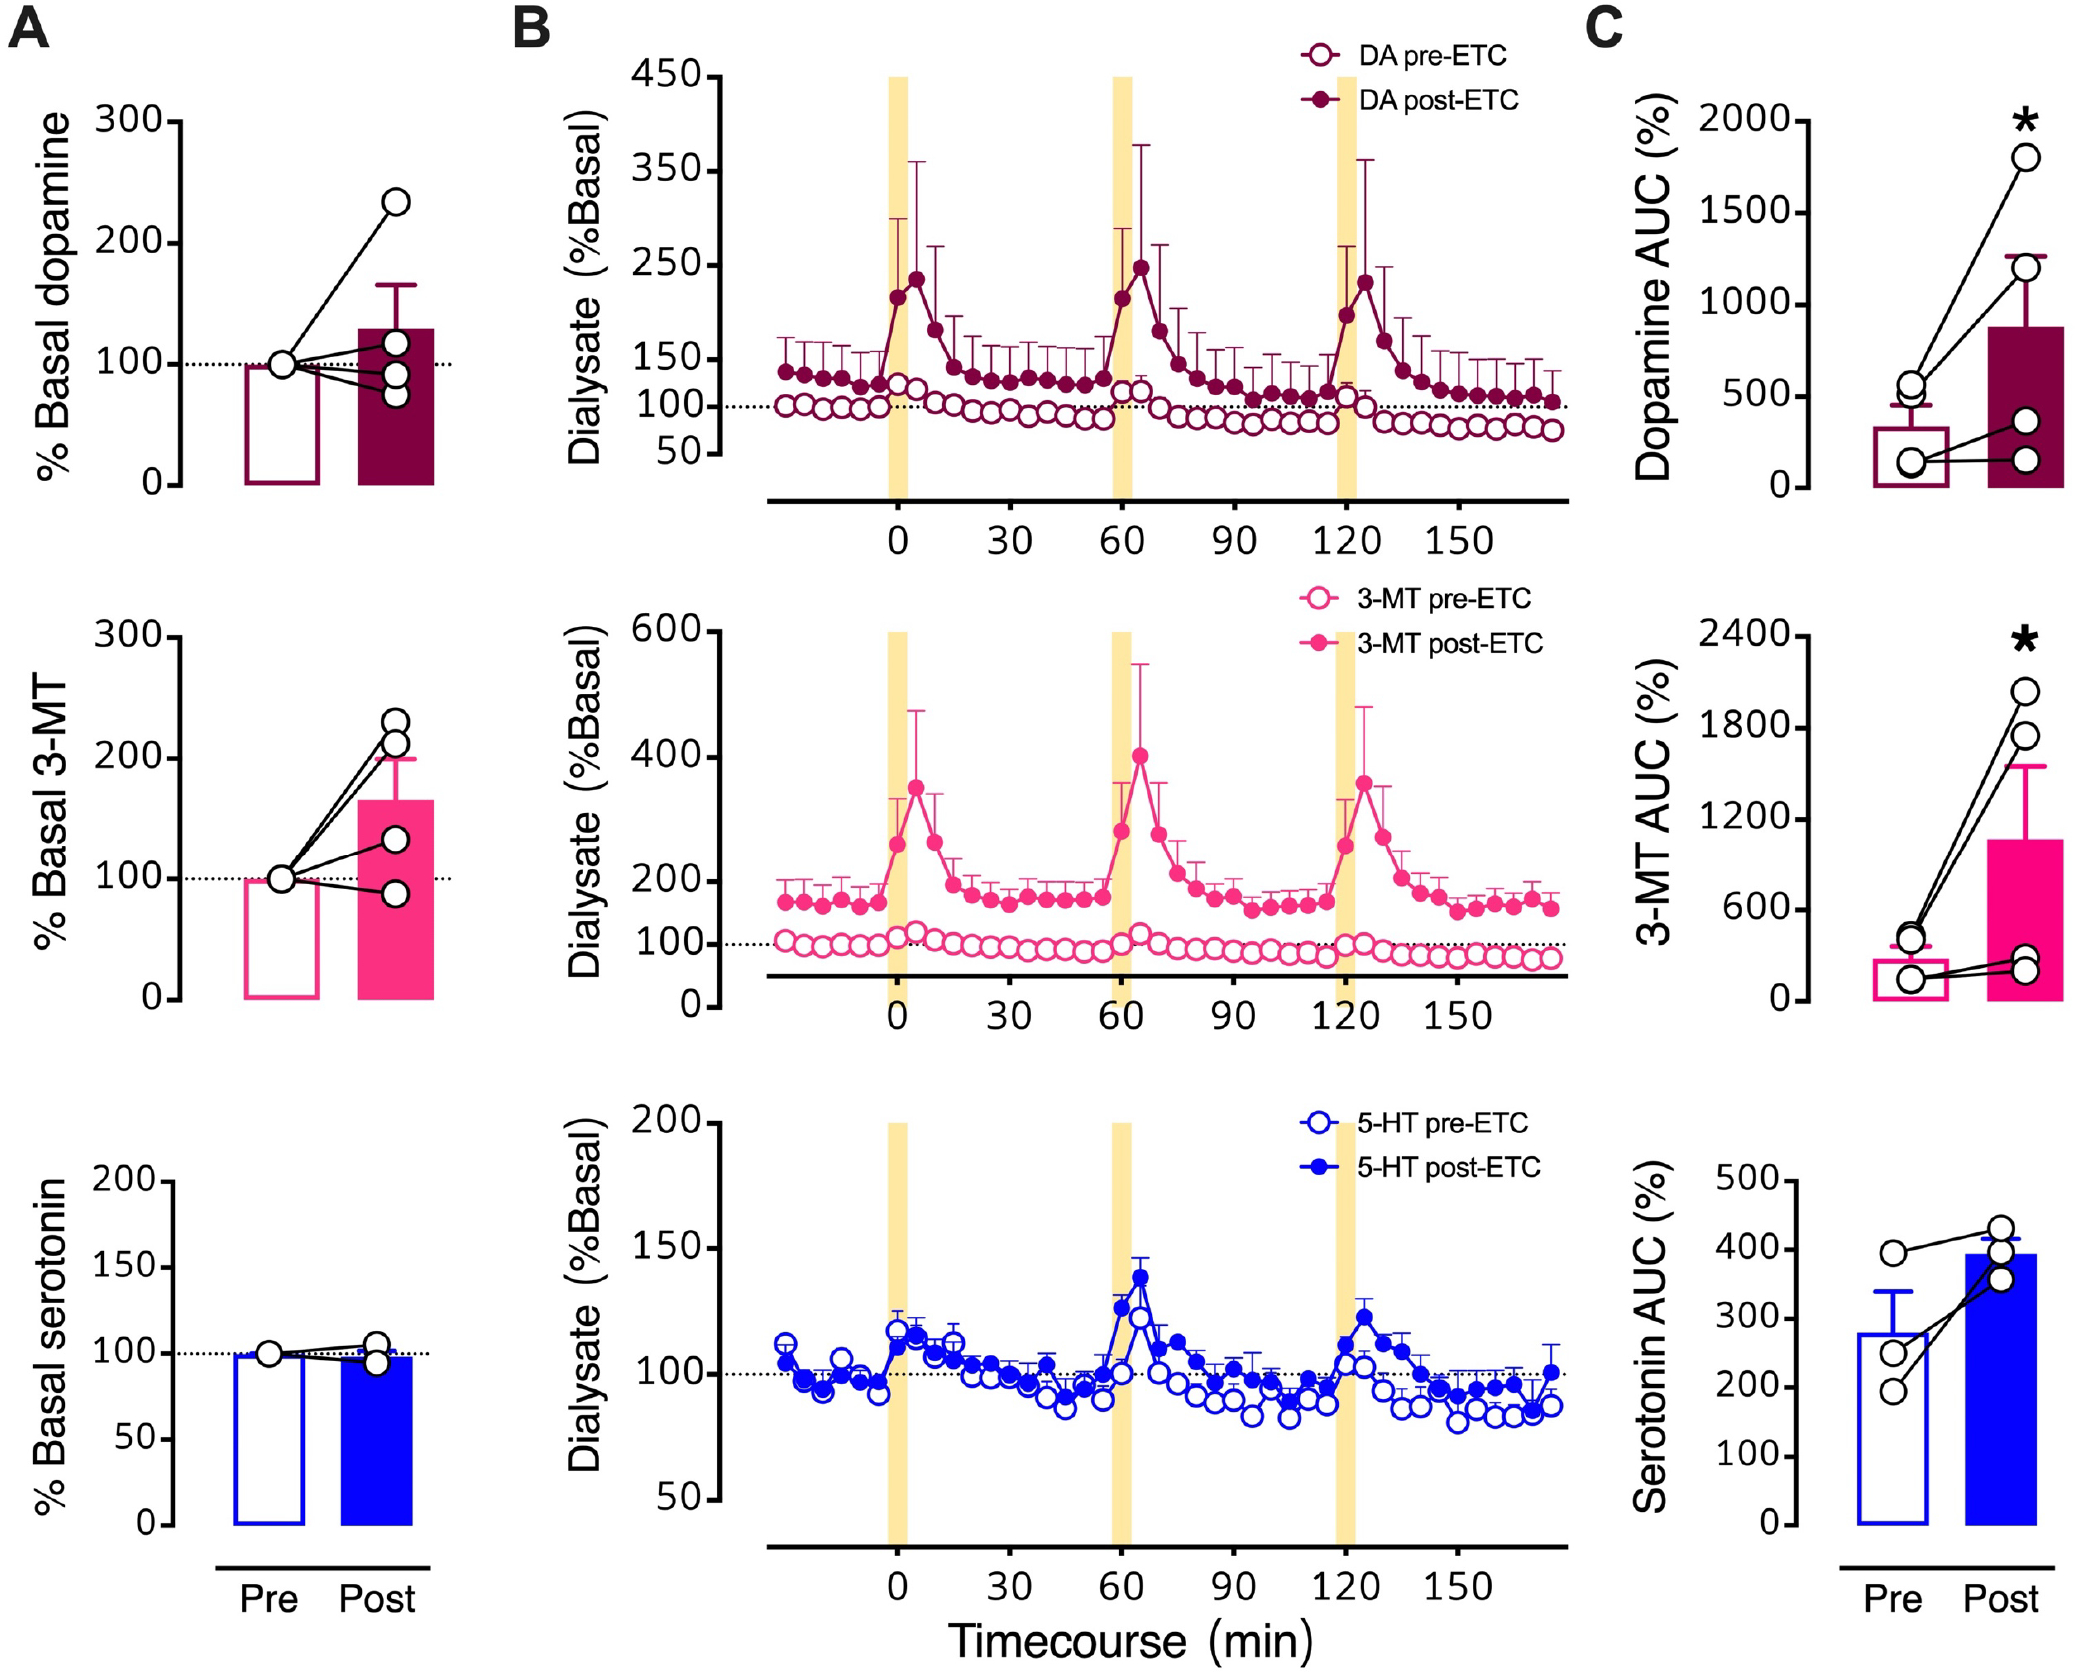
A. Pre- vs. post-eticlopride percent basal levels for dopamine, 3-methyltyramine (3-MT), and serotonin (5-HT). B. Time courses before and during intrastriatal perfusion of eticlopride (100 μM) showing basal and stimulated neurochemical levels expressed as percents of pre-drug basal levels. C. Optically evoked overflow expressed as area under the curve for data normalized to pre-drug basal levels (AUC (%)). Data are means ± SEMs for N=4 mice. Serotonin levels for one mouse were not detectable. *P<0.05 vs. pre-drug. %Basal data points in A represent the means of six measurements just prior to the first stimulation (errors not shown). The AUC datapoints in C are the means of the three stimuli (errors not shown).
Functional interactions between the dopamine and serotonin systems have been investigated for more than 50 years.59–61 In prefrontal cortex, dopamine receptor activation by the nonselective agonist apomorphine or local dopamine perfusion, or D2 autoreceptor inhibition by haloperidol each produced increases in serotonin levels in rats.62 Systemic administration of apomorphine was also shown to increase extracellular serotonin in striatum and hippocampus.63 Our findings indicate that optogenetic activation of midbrain dopamine neurons expressing the excitatory opsin Chrimson produces temporally specified increases in striatal serotonin, as well as an active dopamine metabolite, 3-MT.
We tested hypotheses linking striatal dopamine and serotonin based on the idea that these neurotransmitters are released from different terminals in striatum. We found that serotonin overflow was not prevented by inhibition of striatal D1-like or D2-like receptors (Figs. 6–9). Our findings suggest that optically evoked dopamine does not produce serotonin release by stimulating dopamine receptors on striatal serotonin terminals (or direct/indirect pathway MSNs).
Our findings contrast with those of Jacobs and coworkers where apomorphine-induced or behaviorally evoked increases in striatal extracellular serotonin were inhibited by systemic and intrastriatal D2-like receptor inhibition.63,64 Differences in species (rats vs. mice), drug (raclopride vs. eticlopride) and/or perfusion concentration (10 μM vs. 100 μM) might account for the discrepancies between studies. Jacobs and colleagues did not report on striatal dopamine levels in their studies, i.e., apomorphine and the tail-pinch and light-dark-transition behaviors may have direct receptor/serotonin system effects that are different from those mediated by evoked dopamine.65 Artigas and colleagues reported that reverse dialysis of D1-like or D2-like agonists into striatum in rats did not alter serotonin levels supporting the idea that dopamine-serotonin interactions are not mediated by striatal dopamine receptors.40
Another possibility is that serotonin is released from dopaminergic terminals via co-transmission or co-release. Co-transmission involves release of different neurotransmitters from different vesicle populations within the same neurons; co-release entails release of two or more neurotransmitters from the same vesicles.66 Anatomical, genetic, and functional evidence shows that neurons can have mixed neurochemical phenotypes (for review see66–69 among others) and argues specifically for a serotonin/glutamate mixed phenotype.50,51
Regarding serotonin/dopamine interactions, under conditions where serotonin transporters are genetically or pharmacologically inactivated, serotonin appears to be taken up by dopamine transporters into dopamine neurons, indicated by double serotonin/tyrosine hydroxylase immunoreactivity in the substantia nigra pars compacta and ventral tegmental area.70 Thus, SSRI treatment may result in serotonin being used as a ‘false’ transmitter by dopamine neurons. Studies on chronic SSRI administration and in vivo neurochemical monitoring are needed to test this hypothesis further. In any case, mice with wildtype serotonin transporter expression did not show serotonin colocalization in midbrain dopamine neurons suggesting that under typical circumstances, such as those investigated here, evidence is lacking for serotonin co-transmission or co-release by dopaminergic neurons.70
Beyond striatum, a dopaminergic pathway connects the substantia nigra to the dorsal raphe, which contains a majority of forebrain-projecting serotonin cell bodies (Fig. 10). Mesostriatal serotonergic afferents project from the dorsal raphe to the striatum.2 In addition to striatum, optical activation of dopamine neurons could increase extracellular dopamine in the vicinity of midbrain dopamine cell bodies. Substantia nigra dopamine neurons exhibit activity-dependent somatodendritic dopamine release and D2-mediated autoinhibition.3,71–73 Activation of nigral D2 autoreceptors might increase extracellular serotonin in the dorsal raphe via disinhibition.74 Furthermore, optical stimulation of dopamine cell bodies could activate dopamine projections to the dorsal raphe (Fig. 10). Both scenarios produce dopamine interactions with dorsal raphe serotonin neurons and ostensibly, could increase release of serotonin in striatum (and other brain regions).
Figure 10: Proposed mechanisms of dopamine-mediated serotonin release.
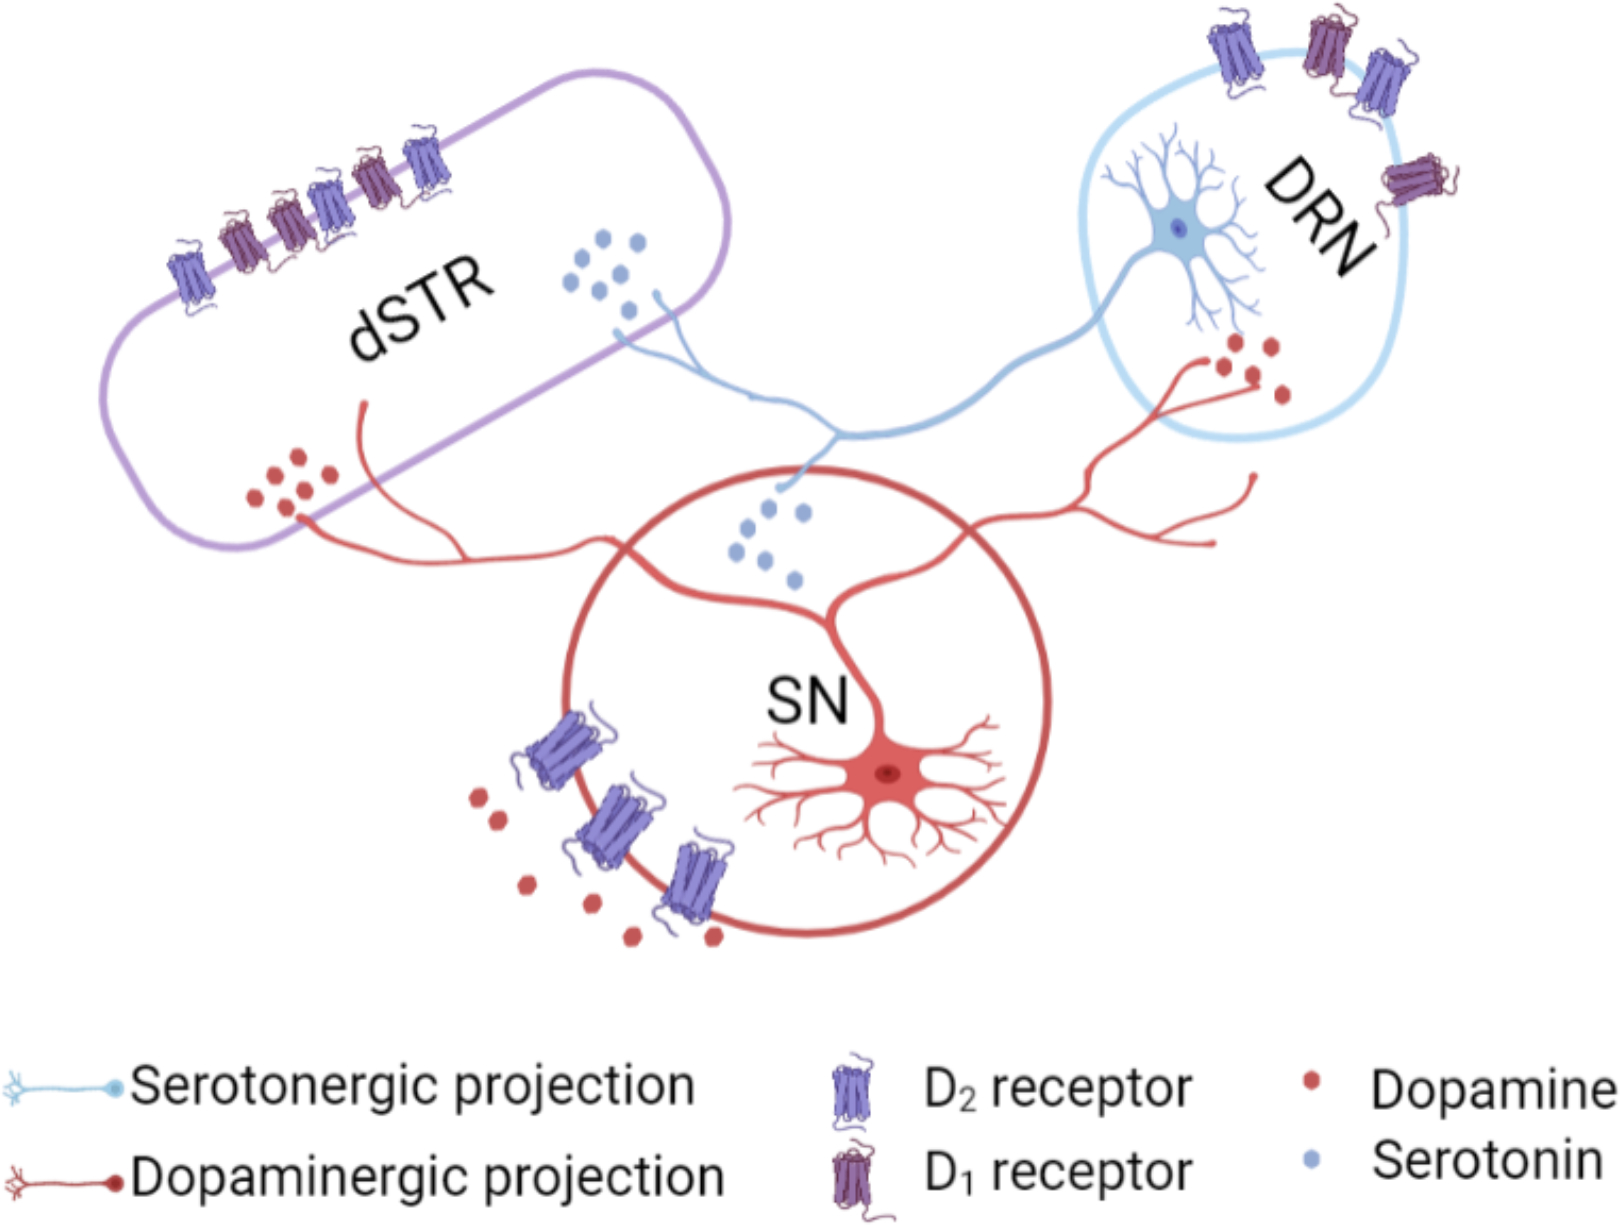
The substantia nigra (SN) sends dense dopaminergic projections to the striatum (nigrostriatal pathway) and to the dorsal raphe nucleus (DRN).1 The DRN sends serotonergic projections to dopaminergic cell bodies in the SN and to the striatum.2 We found that dopamine-induced serotonin release was not blocked by local D1- or D2-like receptor inhibition in the striatum. Another possible mechanism for dopamine-mediated serotonin release is that an optogenetically induced increase in dopamine in the SN, which promotes D2 somatodendritic autoreceptor activation3 and subsequent disinhibition of serotonin cell bodies in the DRN, produces serotonin release in the striatum. Alternately, optically induced dopamine release in DRN could act via local D1 or D2-like receptors to increase the probability of firing of DRN serotonin neurons projecting to dSTR.
Alternately, indirect mechanisms involving SNr-thalamus-cortex-dSTR and/or SNr-thalamus-cortex-DRN pathways cannot be ruled out.75–78 Moreover, recent reports describe the presence of dopamine neurons in the rostral dorsal raphe nucleus.79,80 Future experiments to parse out specific contributions from the SNr, SNc, VTA and DRN to dopamine-induced serotonin release will be informative. It is also possible that optical stimulation of dopamine neurons in Chrimson-transfected mice, in addition to releasing dopamine, is interoceptively detected by mice.81 The perception, increased arousal, and/or reward associated with dopaminergic activity could lead to increases in extracellular serotonin by complex mechanisms not involving direct connections between the dopamine and serotonin systems.
Regardless of mechanism, the present findings indicate that optogenetic stimulation of midbrain dopamine neurons evokes striatal serotonin release. We recently reported similar findings elucidated by rapid-pulse voltammetry coupled with partial least squares regression analysis.82 Dopamine-serotonin coupling is likely to be of importance to the facilitation of reward prediction, locomotor control, habit formation, and anhedonia.
METHODS
Animal procedures
Mice were generated at the University of California, Los Angeles (UCLA) from a DATIREScre line (The Jackson Laboratory, stock no. 006660) on a C57Bl/6J background via heterozygous matings. Mice were housed in groups of 2–5 same-sex siblings prior to surgery, same-sex-sibling pairs after the first surgery to deliver viral vectors and to implant optical fibers and head bars, and singly after the second surgery to implant microdialysis guide cannulae. Food and water were available ad libitum throughout, with the exception of microdialysis testing days where mice were hand-fed a 2:1 sweetened condensed milk:water solution via pipette every 2 h.
The light-dark cycle (12/12 h) in the animal colony room was set to lights on at 0730 h (ZT0). The same light schedule was maintained in the room where microdialysis was performed. The Association for Assessment and Accreditation of Laboratory Animal Care International has fully accredited UCLA. All animal care and use met the requirements of the NIH Guide for the Care and Use of Laboratory Animals, 2011. The UCLA Chancellor’s Animal Research Committee (Institutional Animal Care and Use Committee) preapproved all animal procedures.
Surgeries were carried out under aseptic conditions with isoflurane anesthesia on a KOPF Model 1900 Stereotaxic Alignment System (KOPF, Tujunga, CA). A pair of rectangular stainless steel head-bars (9 mm × 7 mm × 0.76 mm, 0.6 g each, Fab2Order, Brownsburg, IN) were attached to the sides of the skull by C&B-METABOND (Parkell, Edgewood, NY) for head fixation (Fig. S1A,B). Viral vectors, 600 nL of 7.8 × 10¹²/mL AAV5/Syn-Flex-ChrimsonRtdTomato (for experimental groups) or 4.4 × 10¹²/mL AAV5/EF1a-DIO-eYFP or 3.3 × 10¹²/mL AAV5/EF1a-DIO-mcherry (for control subjects), were delivered unilaterally into the SN/VTA (AP-3.08 mm, ML ±1.20 mm, DV −4.00 mm from Bregma) using a Nanoject II (Drummond Scientific, Broomall, PA). A 200 μm diameter optical fiber (0.22 NA, Thorlabs, Newton, NJ) with a total length of 1 cm was lowered via the same track to reach the AAV injection site for optogenetic stimulation. Optical fibers were secured on the skull with C&BMETABOND. The top of each optical fiber outside the skull was covered by a sleeve until coupling to a laser device for testing. All AAV Cre-dependent adeno-associated viral vectors were obtained from the University of North Carolina Vector Core (Chapel Hill, NC).
After the first surgery, animals recovered for 2–3 weeks (Fig. 1B) to allow for viral vector expression prior to guide cannula implantation for microdialysis. During recovery, subjects were trained to acclimate to being head-fixed over the course of 6–10 training sessions, each lasting 15–30 min. A second surgery was carried out on each mouse to implant a CMA/7 guide cannula for a microdialysis probe aimed at the dSTR (AP+1.00 mm, ML±1.75 mm, DV-3.10 mm from Bregma) in the same hemisphere as the viral delivery and fiber implant site. Each guide cannula was secured to the skull with C&B-Metabond. Animals recovered from the second surgery for at least three days before microdialysis. Following each surgery, mice were given daily carprofen injections (5 mg/kg, 1 mg/mL, subcutaneously) for the first three days and a combination of an antibiotic (amoxicillin, 0.25 mg/mL) and a second analgesic (ibuprofen, 0.25 mg/mL) in their drinking water for the first 14 days postoperatively.
Microdialysis
Virgin female mice (N=23) underwent microdialysis at 3–6 months of age. Microdialysis was carried out over two consecutive days for Chrimson-transfected mice (N=14) and one day for control mice (N=9). On the night before the first testing day (ZT10–12), each mouse was transferred to the testing room in its home cage and briefly anesthetized with isoflurane (1–3 min) for insertion of a CMA/7 microdialysis probe (1 mm length, 6 kDa cutoff, CMA8010771) into the guide cannula. Subjects were returned to their home cages and aCSF was continuously perfused through the probe via a liquid swivel (375/D/22QM, Instech Laboratories Inc., Plymouth Meeting, PA) at 2–3 μL/min for 30–60 min followed by a 0.3 μL/min flow rate for an additional 12–14 h to allow the tissue surrounding the probe to recover from acute damage associated with probe insertion. Subjects were tethered to the liquid swivel but otherwise could move freely in their home cages.
Prior to microdialysis, the tubing connecting the microdialysis probe to the liquid swivel was disconnected. The mouse was transferred from its home cage and mounted to the head-fixed stage via its head-bars in the same testing room. The microdialysis probe was connected between the microdialysis syringe pump and the online autoinjector. The aCSF was perfused at 1.8 uL/min throughout the testing day, and samples were collected at 5-min intervals. Subjects were habituated for at least 10-min before the optical fiber was coupled for stimulation delivery.
An MGL-III-532 or MGL-III-589 laser (Opto Engine LLC, Ltd, Changchun, P. R. China) was used to deliver light pulses. The excitation spectrum of Chrimson has a λmax at 590 nm. Due to the broad excitation spectrum, either 532 nm (green) or 589 nm (yellow) light were used to excite this opsin.10 The output of optical stimulation was calibrated to deliver 10 mW/mm2 immediately before coupling on each testing day. The stimulation pulse length (50 ms or 10 Hz) and overall duration (5 min) were selected to generate neurotransmitter release detectable by microdialysis using a 5-min dialysate sampling time. In preliminary experiments, we investigated stimulation pulse lengths that varied from 5–300 ms. We also investigated different laser powers. Longer pulse lengths were ultimately favored over higher laser power with shorter pulses to avoid tissue damage over longer stimulation times needed for microdialysis. Correia et al. used a 5-min stimulation paradigm to investigate the role of serotonin transmission in locomotion.83
The first stimulation was delivered at ~ZT2 after 6–18 basal dialysate samples were collected and analyzed. Prior to reverse dialysis of drugs, three optical stimulations were delivered at 1-h intervals (Fig. 1B). After 90–120 min of intrastriatal drug perfusion, an additional three optical stimulations were delivered at 1-h intervals while drug perfusion continued. On day 1, four Chrimson-transfected mice were perfused with the D1-like antagonist SCH-23390 (100 μM) through the dialysis probe. On day 2, the same four Chrimson-transfected mice were perfused with 100 μM eticlopride (D2-like antagonist).
Eleven mice not receiving D1- or D2-like antagonists underwent brief (5 min) perfusion with 120 mM K+ (KCl substituted isotonically for NaCl in aCSF) to stimulate neurochemical overflow38,39,84 for peak identification. In Fig. S2, data from a representative mouse are shown. Three mice were perfused with an SSRI (10 μM escitalopram) on day one to confirm serotonin peak identity. In Fig. 2A, B, data from a representative mouse are shown. Control mice did not receive intrastriatal perfusions. Four mice (three control mice and one mouse transfected with Chrimson) were administered the COMT inhibitor tolcopone (10 mg/kg, intraperitoneal) to identify the 3-MT peak (Fig. 2C).
Dialysate analysis
High performance liquid chromatography was performed using an Amuza HTEC-500 integrated system (Amuza Corporation [formally known as Eicom], San Diego, CA). An Eicom Insight autosampler was used to inject standards and Eicom EAS-20s online autoinjectors were used to collect and inject dialysate samples online.33 Chromatographic separation was achieved using an Eicom PP-ODS II column (4.6 mm ID × 30 mm length, 2 μm particle diameter) and a phosphate-buffered mobile phase (96 mM NaH2PO4 (Fluka #17844), 3.8 mM Na2HPO4 (Fluka #71633), pH 5.4, 2–2.8% MeOH (EMD #MX0475), 50 mg/L EDTA·Na2 (Sigma #03682), and 500 mg/L sodium decanesulfonate (TCI #I0348) in water purified via a Milli-Q Synthesis A10 system (EMD Millipore Corporation, Billerica, MA). The column temperature was maintained at 21 °C. The volumetric flow rate was 450–500 μL/min. Electrochemical detection was performed using an Eicom WE-3G graphite working electrode with an applied potential of +450 mV vs. a Ag/AgCl reference electrode.
Dopamine (Sigma #H8502), 3-MT (Sigma #65390), and serotonin (Sigma #H9523) standards were prepared in ice-cold 1:1 mobile phase/aCSF (147 mM NaCl (Fluka #73575), 3.5 mM KCl (Fluka #05257), 1.0 mM CaCl2 (Aldrich #499609), 1.0 mM NaH2PO4, 2.5 mM NaHCO3 (Fluka #88208), 1.2 mM MgCl2 (Aldrich #449172), pH 7.3 ± 0.03. (See supplemental information in Liu et al., 2020 for detailed information on formulating aCSF).85 Standard curves encompassed physiological concentration ranges (0–10 nM; Fig. S5). The limit of detection was ≤300 amol (6 pM) for each analyte; the practical limit of quantification was ≤900 amol (18 pM). Dialysate samples were collected online at 5-min intervals using a dialysate flow rate of 1.8 μL/min and injected immediately onto the HPLC system for analysis.
In situ hybridization
We used RNAscope® technology (Advanced Cell Diagnostics Inc., Newark, CA) for in situ hybridization to colocalize mRNAs for D1 receptors in dorsal raphe neurons expressing SERT, VGLUT3, or both. 1,2,47,86 A DATIREScre mouse not transfected with Chrimson was sacrificed by cervical dislocation without isoflurane and the brain was removed, cryoprotected, and frozen. Coronal sections were cut at 16-μm on a cryostat at −15–20 °C and mounted on polylysine-coated slides.
In situ hybridization was conducted using the RNAscope® fresh-frozen V2 protocol. Briefly, sections were incubated in freshly prepared 4% paraformaldehyde (Sigma-Aldrich Cat#441244) in phosphate buffered saline for 15 min followed by sequential dehydration in 50% EtOH, 70% EtOH, and 100% EtOH for 5 min each. Sections were then incubated with the necessary reagents from the Multiplex Fluorescent Reagent Kit V2 (ACD #323110) in a HybEZ® oven. Probes were as follows: Sert (Mm-Slc6a4 Cat#315851) channel 1, Vglut3 (Mm-Slc32a1 Cat#319191-C2) channel 2, and Drd1 (Mm-Drd1a-C3 Cat# 406491-C3) channel 3. Opal dyes 520, 570, and 690 were paired with each probe, respectively (Cat#FP1487A, FP1488A, FP1497A). ProLong™ Diamond Antifade Mountant with DAPI (Molecular Probes P36966) was added to stain cell bodies. Visualization was carried out using a Leica DMI8 or Zeiss LSM800 microscope and images were processed with LAS X and Zen software. Cell nuclei in each field of view were identified via DAPI staining. The DAPI labeled nuclei associated with puncta for one or more mRNA probes were then counted. Data are reported as percent positive cells calculated by dividing the number of cells labeled with Sert, Drd1, and/or Vglut3 by total number of Sert labeled cells.
Histology
At the end of each experiment, the microdialysis probe was removed and the brain of each mouse was prepared for histology to verify probe and optical fiber placements, and Chrimson, mCherry, or eYFP expression. Subjects were exsanguinated with an overdose of 100 mg/kg pentobarbital (2 mL/kg administered at 50 mg/mL, ip) followed immediately by transcardial perfusion with 4% paraformaldehyde in PBS. Sections from the midbrain and dSTR were cut using a vibratome and mounted on microscope slides. Images were acquired using a Zeiss Axio Examiner microscope as follows: tdTomato and mCherry (550 nm excitation/605 nm emission), or eYFP (470 nm excitation/525 nm emission). Microdialysis probe and optical fiber tracks were visualized via light microscopy. Three of the 23 microdialysis subjects failed histology verification for probe or fiber placement. Data for these subjects were excluded from analyses.
Data analysis and statistics
The microdialysis time-course data were analyzed in terms of absolute neurochemical concentrations (nM) and as a percent of mean pre-drug basal neurochemical levels (%basal). Overflow peaks following optical stimulation were identified and analyzed individually using the following criteria and procedures. (1) For each control mouse, the concentrations of six dialysate samples for each neurochemical immediately preceding the onset of the first optical stimulation were averaged (nM) and converted to mean 100% basal levels. (2) For Chrimson-expressing mice on experimental days 1 and 2, basal levels of individual neurochemicals were determined separated by day. The concentrations of the six dialysate samples immediately preceding the onset of the first pre-drug optical stimulation were averaged (nM) and converted to mean 100% basal levels. (3) The AUC for each stimulation peak, defined by the four dialysate samples after the onset of stimulation, was calculated by trapezoidal integration and is reported in nM or as a percent of mean pre-drug basal levels.
Statistical analyses were carried out using Prism, v.9.0.2 (GraphPad Inc., La Jolla, CA). Data are expressed as group means ± SEMs. Two-tailed t-tests (either unpaired or ratio paired, as appropriate) were used for two group comparisons. Throughout, P<0.05 was considered statistically significant. Detailed statistics are summarized in Table S1.
Supplementary Material
Acknowledgements
We acknowledge the Optogenetics and Neural Engineering Core at the University of Colorado Anschutz Medical Campus, funded in part by the National Institute of Neurological Disorders and Stroke (P30 NS048154), for vector engineering. We thank Ms. Cindy Cheng and Ms. Vicky Wang for technical assistance. We also thank the UCLA Intellectual and Developmental Disabilities Research Center (IDDRC) for the use of a cryostat, and Leica fluorescent and Zeiss confocal microscopes. The IDDRC is supported by the Eunice Kennedy Shriver National Institute on Child Health and Human Development (P50 HD103557) and is an Organized Research Unit supported by the Jane and Terry Semel Institute for Neuroscience and Human Behavior at UCLA. We acknowledge BioRender for figure generation.
Funding
The authors acknowledge grant support from the National Institute on Drug Abuse (R01 DA045550 (AMA), R01 DA042739 (SCM), and T32DA024635 (MD)) and the National Institute of Mental Health (R01 MH106806 (AMA)).
Footnotes
The authors have no competing financial interests to declare.
- Head-fixed setup
- Representative chromatogram of optical stimulation
- Normalized time course of optical stimulation responses of Chrimson-transfected vs. control mice
- RNAscope control images
- HPLC standard curves
- Compiled statistical information
BIBLIOGRAPHY
- 1.Pollak Dorocic I; Fürth D; Xuan Y; Johansson Y; Pozzi L; Silberberg G; Carlén M; Meletis K, A whole-brain atlas of inputs to serotonergic neurons of the dorsal and median raphe nuclei. Neuron 2014, 83 (3), 663–678. [DOI] [PubMed] [Google Scholar]
- 2.Muzerelle A; Scotto-Lomassese S; Bernard JF; Soiza-Reilly M; Gaspar P, Conditional anterograde tracing reveals distinct targeting of individual serotonin cell groups (b5-b9) to the forebrain and brainstem. Brain Structure and Function 2016, 221 (1), 535–61. [DOI] [PMC free article] [PubMed] [Google Scholar]
- 3.Hikima T; Lee CR; Witkovsky P; Chesler J; Ichtchenko K; Rice ME, Activity-dependent somatodendritic dopamine release in the substantia nigra autoinhibits the releasing neuron. Cell Reports 2021, 35 (1), 108951. [DOI] [PMC free article] [PubMed] [Google Scholar]
- 4.Bernstein JG; Boyden ES, Optogenetic tools for analyzing the neural circuits of behavior. Trends in Cognitive Science 2011, 15 (12), 592–600. [DOI] [PMC free article] [PubMed] [Google Scholar]
- 5.Boyden ES, Optogenetics: Using light to control the brain. Cerebrum 2011, 2011, 16. [PMC free article] [PubMed] [Google Scholar]
- 6.Kim CK; Adhikari A; Deisseroth K, Integration of optogenetics with complementary methodologies in systems neuroscience. Nature Reviews Neuroscience 2017, 18 (4), 222–235. [DOI] [PMC free article] [PubMed] [Google Scholar]
- 7.Entcheva E; Kay MW, Cardiac optogenetics: A decade of enlightenment. Nature Reviews Cardiology 2020. [DOI] [PMC free article] [PubMed] [Google Scholar]
- 8.Han X, In vivo application of optogenetics for neural circuit analysis. ACS Chemical Neuroscience 2012, 3 (8), 577–84. [DOI] [PMC free article] [PubMed] [Google Scholar]
- 9.Deisseroth K, Optogenetics. Nature Methods 2011, 8 (1), 26–29. [DOI] [PMC free article] [PubMed] [Google Scholar]
- 10.Klapoetke NC; Murata Y; Kim SS; Pulver SR; Birdsey-Benson A; Cho YK; Morimoto TK; Chuong AS; Carpenter EJ; Tian Z; Wang J; Xie Y; Yan Z; Zhang Y; Chow BY; Surek B; Melkonian M; Jayaraman V; Constantine-Paton M; Wong GK; Boyden ES, Independent optical excitation of distinct neural populations. Nature Methods 2014, 11 (3), 338–46. [DOI] [PMC free article] [PubMed] [Google Scholar]
- 11.Madisen L; Mao T; Koch H; Zhuo JM; Berenyi A; Fujisawa S; Hsu YW; Garcia AJ 3rd; Gu X; Zanella S; Kidney J; Gu H; Mao Y; Hooks BM; Boyden ES; Buzsaki G; Ramirez JM; Jones AR; Svoboda K; Han X; Turner EE; Zeng H, A toolbox of cre-dependent optogenetic transgenic mice for light-induced activation and silencing. Nature Neuroscience 2012, 15 (5), 793–802. [DOI] [PMC free article] [PubMed] [Google Scholar]
- 12.Johansen JP; Hamanaka H; Monfils MH; Behnia R; Deisseroth K; Blair HT; LeDoux JE, Optical activation of lateral amygdala pyramidal cells instructs associative fear learning. Proceedings of the National Academy of Sciences 2010, 107 (28), 12692–12697. [DOI] [PMC free article] [PubMed] [Google Scholar]
- 13.Ohmura Y; Tanaka KF; Tsunematsu T; Yamanaka A; Yoshioka M, Optogenetic activation of serotonergic neurons enhances anxiety-like behaviour in mice. International Journal of Neuropsychopharmacology 2014, 17 (11), 1777–1783. [DOI] [PubMed] [Google Scholar]
- 14.Chaudhury D; Walsh JJ; Friedman AK; Juarez B; Ku SM; Koo JW; Ferguson D; Tsai H-C; Pomeranz L; Christoffel DJ; Nectow AR; Ekstrand M; Domingos A; Mazei-Robison MS; Mouzon E; Lobo MK; Neve RL; Friedman JM; Russo SJ; Deisseroth K; Nestler EJ; Han M-H, Rapid regulation of depression-related behaviours by control of midbrain dopamine neurons. Nature 2013, 493 (7433), 532–536. [DOI] [PMC free article] [PubMed] [Google Scholar]
- 15.Lee K; Claar LD; Hachisuka A; Bakhurin KI; Nguyen J; Trott JM; Gill JL; Masmanidis SC, Temporally restricted dopaminergic control of reward-conditioned movements. Nature Neuroscience 2020, 23 (2), 209–216. [DOI] [PMC free article] [PubMed] [Google Scholar]
- 16.Moran RJ; Kishida KT; Lohrenz T; Saez I; Laxton AW; Witcher MR; Tatter SB; Ellis TL; Phillips PE; Dayan P; Montague PR, The protective action encoding of serotonin transients in the human brain. Neuropsychopharmacology 2018, 43 (6), 1425–1435. [DOI] [PMC free article] [PubMed] [Google Scholar]
- 17.Fischer AG; Ullsperger M, An update on the role of serotonin and its interplay with dopamine for reward. Frontiers in Human Neuroscience 2017, 11, 484. [DOI] [PMC free article] [PubMed] [Google Scholar]
- 18.Browne CJ; Abela AR; Chu D; Li Z; Ji X; Lambe EK; Fletcher PJ, Dorsal raphe serotonin neurons inhibit operant responding for reward via inputs to the ventral tegmental area but not the nucleus accumbens: Evidence from studies combining optogenetic stimulation and serotonin reuptake inhibition. Neuropsychopharmacology 2019, 44 (4), 793–804. [DOI] [PMC free article] [PubMed] [Google Scholar]
- 19.Altieri S; Singh Y; Sibille E, Serotonergic pathways in depression. In Neurobiology of depression, CRC Press: 2011; Vol. 20115633, pp 143–170. [Google Scholar]
- 20.Niederkofler V; Asher TE; Dymecki SM, Functional interplay between dopaminergic and serotonergic neuronal systems during development and adulthood. ACS Chemical Neuroscience 2015, 6 (7), 1055–1070. [DOI] [PMC free article] [PubMed] [Google Scholar]
- 21.Dremencov E; Gispan-Herman I; Rosenstein M; Mendelman A; Overstreet DH; Zohar J; Yadid G, The serotonin–dopamine interaction is critical for fast-onset action of antidepressant treatment: In vivo studies in an animal model of depression. Progress in Neuro-Psychopharmacology and Biological Psychiatry 2004, 28 (1), 141–147. [DOI] [PubMed] [Google Scholar]
- 22.de Abreu MS; Maximino C; Cardoso SC; Marques CI; Pimentel AFN; Mece E; Winberg S; Barcellos LJG; Soares MC, Dopamine and serotonin mediate the impact of stress on cleaner fish cooperative behavior. Hormones and Behavior 2020, 125, 104813. [DOI] [PubMed] [Google Scholar]
- 23.Hashemi P; Dankoski EC; Lama R; Wood KM; Takmakov P; Wightman RM, Brain dopamine and serotonin differ in regulation and its consequences. Proceedings of the National Academy of Sciences 2012, 109 (29), 11510–11515. [DOI] [PMC free article] [PubMed] [Google Scholar]
- 24.Daw ND; Kakade S; Dayan P, Opponent interactions between serotonin and dopamine. Neural Networks 2002, 15 (4–6), 603–616. [DOI] [PubMed] [Google Scholar]
- 25.Di Giovanni G; Esposito E; Di Matteo V, Role of serotonin in central dopamine dysfunction: 5HT modulation of DA function. CNS Neuroscience & Therapeutics 2010, 16 (3), 179–194. [DOI] [PMC free article] [PubMed] [Google Scholar]
- 26.Bengel D; Murphy DL; Andrews AM; Wichems CH; Feltner D; Heils A; Mossner R; Westphal H; Lesch KP, Altered brain serotonin homeostasis and locomotor insensitivity to 3, 4-methylenedioxymethamphetamine (“Ecstasy”) in serotonin transporter-deficient mice. Molecular Pharmacology 1998, 53 (4), 649–55. [DOI] [PubMed] [Google Scholar]
- 27.Dunlap LE; Andrews AM; Olson DE, Dark classics in chemical neuroscience: 3,4-Methylenedioxymethamphetamine. ACS Chemical Neuroscience 2018, 9 (10), 2408–2427. [DOI] [PMC free article] [PubMed] [Google Scholar]
- 28.Drake LR; Scott PJH, Dark classics in chemical neuroscience: Cocaine. ACS Chemical Neuroscience 2018, 9 (10), 2358–2372. [DOI] [PMC free article] [PubMed] [Google Scholar]
- 29.Abbruscato TJ; Trippier PC, Dark classics in chemical neuroscience: Methamphetamine. ACS Chemical Neuroscience 2018, 9 (10), 2373–2378. [DOI] [PubMed] [Google Scholar]
- 30.Avery MC; Krichmar JL, Neuromodulatory systems and their interactions: A review of models, theories, and experiments. Frontiers in Neural Circuits 2017, 11. [DOI] [PMC free article] [PubMed] [Google Scholar]
- 31.Zangen A; Nakash R; Overstreet D; Yadid G, Association between depressive behavior and absence of serotonin-dopamine interaction in the nucleus accumbens. Psychopharmacology 2001, 155 (4), 434–439. [DOI] [PubMed] [Google Scholar]
- 32.Microdialysis Techniques in Neuroscience. Humana Press: Totowa, NJ, 2013; Vol. 75. [Google Scholar]
- 33.Sampson MM; Yang H; Andrews AM, Advanced microdialysis approaches resolve differences in serotonin homeostasis and signaling. In Compendium of In Vivo Monitoring in Realtime Molecular Neuroscience, World Scientific: 2017; pp 119–140. [Google Scholar]
- 34.Altieri SC; Yang H; O’Brien HJ; Redwine HM; Senturk D; Hensler JG; Andrews AM, Perinatal vs genetic programming of serotonin states associated with anxiety. Neuropsychopharmacology 2015, 40 (6), 1456–70. [DOI] [PMC free article] [PubMed] [Google Scholar]
- 35.Ngo KT; Varner EL; Michael AC; Weber SG, Monitoring dopamine responses to potassium ion and nomifensine by in vivo microdialysis with online liquid chromatography at one-minute resolution. ACS Chemical Neuroscience 2017, 8 (2), 329–338. [DOI] [PMC free article] [PubMed] [Google Scholar]
- 36.Zhang J; Jaquins-Gerstl A; Nesbitt KM; Rutan SC; Michael AC; Weber SG, In vivo monitoring of serotonin in the striatum of freely moving rats with one minute temporal resolution by online microdialysis-capillary high-performance liquid chromatography at elevated temperature and pressure. Analytical Chemistry 2013, 85 (20), 9889–97. [DOI] [PMC free article] [PubMed] [Google Scholar]
- 37.Liu Y; Zhang J; Xu X; Zhao MK; Andrews AM; Weber SG, Capillary ultrahigh performance liquid chromatography with elevated temperature for sub-one minute separations of basal serotonin in submicroliter brain microdialysate samples. Analytical Chemistry 2010, 82 (23), 9611–6. [DOI] [PMC free article] [PubMed] [Google Scholar]
- 38.Yang H; Sampson MM; Senturk D; Andrews AM, Sex- and SERT-mediated differences in stimulated serotonin revealed by fast microdialysis. ACS Chemical Neuroscience 2015, 6 (8), 1487–1501. [DOI] [PubMed] [Google Scholar]
- 39.Yang H; Thompson AB; McIntosh BJ; Altieri SC; Andrews AM, Physiologically relevant changes in serotonin resolved by fast microdialysis. ACS Chemical Neuroscience 2013, 4 (5), 790–8. [DOI] [PMC free article] [PubMed] [Google Scholar]
- 40.Ferre S; Cortes R; Artigas F, Dopaminergic regulation of the serotonergic raphe-striatal pathway: Microdialysis studies in freely moving rats. Journal of Neuroscience 1994, 14 (8), 4839–4846. [DOI] [PMC free article] [PubMed] [Google Scholar]
- 41.Shin G; Gomez AM; Al-Hasani R; Jeong YR; Kim J; Xie Z; Banks A; Lee SM; Han SY; Yoo CJ; Lee JL; Lee SH; Kurniawan J; Tureb J; Guo Z; Yoon J; Park SI; Bang SY; Nam Y; Walicki MC; Samineni VK; Mickle AD; Lee K; Heo SY; McCall JG; Pan T; Wang L; Feng X; Kim TI; Kim JK; Li Y; Huang Y; Gereau R. W. t.; Ha JS; Bruchas MR; Rogers JA, Flexible near-field wireless optoelectronics as subdermal implants for broad applications in optogenetics. Neuron 2017, 93 (3), 509–521 e3. [DOI] [PMC free article] [PubMed] [Google Scholar]
- 42.Saller CF; Salama AI, 3-Methoxytyramine accumulation: Effects of typical neuroleptics and various atypical compounds. Naunyn-Schmiedeberg’s Archives of Pharmacology 1986, 334 (2), 125–132. [DOI] [PubMed] [Google Scholar]
- 43.Sotnikova TD; Beaulieu J-M; Espinoza S; Masri B; Zhang X; Salahpour A; Barak LS; Caron MG; Gainetdinov RR, The dopamine metabolite 3-methoxytyramine is a neuromodulator. PLoS ONE 2010, 5 (10), e13452. [DOI] [PMC free article] [PubMed] [Google Scholar]
- 44.Kaakkola S; Wurtman RJ, Effects of COMT inhibitors on striatal dopamine metabolism: A microdialysis study. Brain Research 1992, 587 (2), 241–249. [DOI] [PubMed] [Google Scholar]
- 45.Mansour A; Meador-Woodruff JH; Bunzow JR; Civelli O; Akil H; Watson SJ, Localization of dopamine D2 receptor mRNA and D1 and D2 receptor binding in the rat brain and pituitary: An in situ hybridization-receptor autoradiographic analysis. Journal of Neuroscience 1990, 10 (8), 2587–600. [DOI] [PMC free article] [PubMed] [Google Scholar]
- 46.Suzuki M; Hurd YL; Sokoloff P; Schwartz JC; Sedvall G, D3 dopamine receptor mRNA is widely expressed in the human brain. Brain Research 1998, 779 (1–2), 58–74. [DOI] [PubMed] [Google Scholar]
- 47.Ren J; Isakova A; Friedmann D; Zeng J; Grutzner SM; Pun A; Zhao GQ; Kolluru SS; Wang R; Lin R; Li P; Li A; Raymond JL; Luo Q; Luo M; Quake SR; Luo L, Single-cell transcriptomes and whole-brain projections of serotonin neurons in the mouse dorsal and median raphe nuclei. eLife 2019, 8. [DOI] [PMC free article] [PubMed] [Google Scholar]
- 48.Spaethling JM; Piel D; Dueck H; Buckley PT; Morris JF; Fisher SA; Lee J; Sul JY; Kim J; Bartfai T; Beck SG; Eberwine JH, Serotonergic neuron regulation informed by in vivo single-cell transcriptomics. FASEB Journal 2014, 28 (2), 771–80. [DOI] [PMC free article] [PubMed] [Google Scholar]
- 49.Niederkofler V; Asher TE; Okaty BW; Rood BD; Narayan A; Hwa LS; Beck SG; Miczek KA; Dymecki SM, Identification of serotonergic neuronal modules that affect aggressive behavior. Cell Reports 2016, 17 (8), 1934–1949. [DOI] [PMC free article] [PubMed] [Google Scholar]
- 50.Belmer A; Beecher K; Jacques A; Patkar OL; Sicherre F; Bartlett SE, Axonal non-segregation of the vesicular glutamate transporter VGLUT3 within serotonergic projections in the mouse forebrain. Frontiers in Cellular Neuroscience 2019, 13, 193. [DOI] [PMC free article] [PubMed] [Google Scholar]
- 51.Wang H-L; Zhang S; Qi J; Wang H; Cachope R; Mejias-Aponte CA; Gomez JA; Mateo-Semidey GE; Beaudoin GMJ; Paladini CA; Cheer JF; Morales M, Dorsal raphe dual serotonin-glutamate neurons drive reward by establishing excitatory synapses on VTA mesoaccumbens dopamine neurons. Cell Reports 2019, 26 (5), 1128–1142.e7. [DOI] [PMC free article] [PubMed] [Google Scholar]
- 52.Bourne JA, SCH 23390: The first selective dopamine D1-like receptor antagonist. CNS Drug Reviews 2006, 7 (4), 399–414. [DOI] [PMC free article] [PubMed] [Google Scholar]
- 53.Cameron DL; Williams JT, Dopamine D1 receptors facilitate transmitter release. Nature 1993, 366 (6453), 344–347. [DOI] [PubMed] [Google Scholar]
- 54.Burke DA; Rotstein HG; Alvarez VA, Striatal local circuitry: A new framework for lateral inhibition. Neuron 2017, 96 (2), 267–284. [DOI] [PMC free article] [PubMed] [Google Scholar]
- 55.Nishi A; Kuroiwa M; Shuto T, Mechanisms for the modulation of dopamine D(1) receptor signaling in striatal neurons. Frontiers in Neuroanatomy 2011, 5, 43. [DOI] [PMC free article] [PubMed] [Google Scholar]
- 56.Ford CP, The role of D2-autoreceptors in regulating dopamine neuron activity and transmission. Neuroscience 2014, 282, 13–22. [DOI] [PMC free article] [PubMed] [Google Scholar]
- 57.Jenkins BG; Sanchez-Pernaute R; Brownell AL; Chen YC; Isacson O, Mapping dopamine function in primates using pharmacologic magnetic resonance imaging. Journal of Neuroscience 2004, 24 (43), 9553–60. [DOI] [PMC free article] [PubMed] [Google Scholar]
- 58.Martelle JL; Nader MA, A review of the discovery, pharmacological characterization, and behavioral effects of the dopamine D2-like receptor antagonist eticlopride. CNS Neuroscience & Therapeutics 2008, 14 (3), 248–262. [DOI] [PMC free article] [PubMed] [Google Scholar]
- 59.Samanin R; Garattini S, The serotonergic system in the brain and its possible functional connections with other aminergic systems. Life Sciences 1975, 17 (8), 1201–9. [DOI] [PubMed] [Google Scholar]
- 60.Kostowski W, Interactions between serotonergic and catecholaminergic systems in the brain. Polish Journal of Pharmacology and Pharmacy 1975, 27 (Suppl), 15–24. [PubMed] [Google Scholar]
- 61.Waldmeier PC; Delini-Stula AA, Serotonin--dopamine interactions in the nigrostriatal system. European Journal of Pharmacology 1979, 55 (4), 363–73. [DOI] [PubMed] [Google Scholar]
- 62.Petty F; Kramer G; Moeller M, Does learned helplessness induction by haloperidol involve serotonin mediation? Pharmacology Biochemistry and Behavior 1994, 48 (3), 671–6. [DOI] [PubMed] [Google Scholar]
- 63.Mendlin A; Martin FJ; Jacobs BL, Involvement of dopamine D2 receptors in apomorphine-induced facilitation of forebrain serotonin output. European Journal of Pharmacology 1998, 351 (3), 291–8. [DOI] [PubMed] [Google Scholar]
- 64.Mendlin A; Martin FJ; Jacobs BL, Dopaminergic input is required for increases in serotonin output produced by behavioral activation: An in vivo microdialysis study in rat forebrain. Neuroscience 1999, 93 (3), 897–905. [DOI] [PubMed] [Google Scholar]
- 65.Martin-Ruiz R; Ugedo L; Honrubia MA; Mengod G; Artigas F, Control of serotonergic neurons in rat brain by dopaminergic receptors outside the dorsal raphe nucleus. Journal of Neurochemistry 2001, 77 (3), 762–75. [DOI] [PubMed] [Google Scholar]
- 66.Vaaga CE; Borisovska M; Westbrook GL, Dual-transmitter neurons: Functional implications of co-release and co-transmission. Current Opinions in Neurobiology 2014, 29, 25–32. [DOI] [PMC free article] [PubMed] [Google Scholar]
- 67.Nusbaum MP; Blitz DM; Marder E, Functional consequences of neuropeptide and small-molecule co-transmission. Nature Reviews Neuroscience 2017, 18 (7), 389–403. [DOI] [PMC free article] [PubMed] [Google Scholar]
- 68.Granger AJ; Wallace ML; Sabatini BL, Multi-transmitter neurons in the mammalian central nervous system. Current Opinions in Neurobiology 2017, 45, 85–91. [DOI] [PMC free article] [PubMed] [Google Scholar]
- 69.Hnasko TS; Edwards RH, Neurotransmitter corelease: Mechanism and physiological role. Annual Reviews of Physiology 2012, 74, 225–43. [DOI] [PMC free article] [PubMed] [Google Scholar]
- 70.Zhou FC; Lesch KP; Murphy DL, Serotonin uptake into dopamine neurons via dopamine transporters: A compensatory alternative. Brain Research 2002, 942 (1–2), 109–19. [DOI] [PubMed] [Google Scholar]
- 71.Kalivas PW; Duffy P, A comparison of axonal and somatodendritic dopamine release using in vivo dialysis. Journal of Neurochemistry 1991, 56 (3), 961–7. [DOI] [PubMed] [Google Scholar]
- 72.Cheramy A; Leviel V; Glowinski J, Dendritic release of dopamine in the substantia nigra. Nature 1981, 289 (5798), 537–42. [DOI] [PubMed] [Google Scholar]
- 73.Geffen LB; Jessell TM; Cuello AC; Iversen LL, Release of dopamine from dendrites in rat substantia nigra. Nature 1976, 260 (5548), 258–60. [DOI] [PubMed] [Google Scholar]
- 74.Lee EH; Geyer MA, Dopamine autoreceptor mediation of the effects of apomorphine on serotonin neurons. Pharmacology Biochemistry and Behavior 1984, 21 (2), 301–11. [DOI] [PubMed] [Google Scholar]
- 75.Silkis I, Mutual influence of serotonin and dopamine on the functioning of the dorsal striatum and motor activity (hypothetical mechanism). Neurochemical Journal 2014, 8, 149–161. [Google Scholar]
- 76.Pollak Dorocic I; Fürth D; Xuan Y; Johansson Y; Pozzi L; Silberberg G; Carlén M; Meletis K, A whole-brain atlas of inputs to serotonergic neurons of the dorsal and median raphe nuclei. Neuron 2014, 83 (3), 663–78. [DOI] [PubMed] [Google Scholar]
- 77.Gerfen CR; Bolam JP, Chapter 1 - The neuroanatomical organization of the basal ganglia. In Handbook of Behavioral Neuroscience, Steiner H; Tseng KY, Eds. Elsevier: 2016; Vol. 24, pp 3–32. [Google Scholar]
- 78.Mathur BN; Lovinger DM, Serotonergic action on dorsal striatal function. Parkinsonism & Related Disorders 2012, 18 Suppl 1, S129–31. [DOI] [PubMed] [Google Scholar]
- 79.Cho JR; Chen X; Kahan A; Robinson JE; Wagenaar DA; Gradinaru V, Dorsal raphe dopamine neurons signal motivational salience dependent on internal state, expectation, and behavioral context. Journal of Neuroscience 2021, 41 (12), 2645–2655. [DOI] [PMC free article] [PubMed] [Google Scholar]
- 80.Lin R; Liang J; Luo M, The raphe dopamine system: Roles in salience encoding, memory expression, and addiction. Trends in Neuroscience 2021, 44 (5), 366–377. [DOI] [PubMed] [Google Scholar]
- 81.Luis-Islas J; Luna M; Floran B; Gutierrez R, Optoception: Perception of optogenetic brain stimulation. bioRxiv 2021, 2021.04.22.440969. [DOI] [PMC free article] [PubMed] [Google Scholar]
- 82.Movassaghi CS; Perrotta KA; Yang H; Iyer R; Cheng X; Dagher M; Fillol MA; Andrews AM, Simultaneous serotonin and dopamine monitoring across timescales by rapid pulse voltammetry with partial least squares regression. Anal Bioanal Chem 2021, 413 (27), 6747–6767. [DOI] [PMC free article] [PubMed] [Google Scholar]
- 83.Correia PA; Lottem E; Banerjee D; Machado AS; Carey MR; Mainen ZF, Transient inhibition and long-term facilitation of locomotion by phasic optogenetic activation of serotonin neurons. eLife 2017, 6. [DOI] [PMC free article] [PubMed] [Google Scholar]
- 84.Mathews TA; Fedele DE; Coppelli FM; Avila AM; Murphy DL; Andrews AM, Gene dose-dependent alterations in extraneuronal serotonin but not dopamine in mice with reduced serotonin transporter expression. Journal of Neuroscience Methods 2004, 140 (1–2), 169–81. [DOI] [PubMed] [Google Scholar]
- 85.Liu Q; Zhao C; Chen M; Liu Y; Zhao Z; Wu F; Li Z; Weiss PS; Andrews AM; Zhou C, Flexible multiplexed In2O3 nanoribbon aptamer-field-effect transistors for biosensing. iScience 2020, 23 (9), 101469. [DOI] [PMC free article] [PubMed] [Google Scholar]
- 86.Huang KW; Ochandarena NE; Philson AC; Hyun M; Birnbaum JE; Cicconet M; Sabatini BL, Molecular and anatomical organization of the dorsal raphe nucleus. eLife 2019, 8. [DOI] [PMC free article] [PubMed] [Google Scholar]
Associated Data
This section collects any data citations, data availability statements, or supplementary materials included in this article.


