

Abstract
Clinical immunity to P. falciparum malaria is non‐sterilizing, with adults often experiencing asymptomatic infection. Historically, asymptomatic malaria has been viewed as beneficial and required to help maintain clinical immunity. Emerging views suggest that these infections are detrimental and constitute a parasite reservoir that perpetuates transmission. To define the impact of asymptomatic malaria, we pursued a systems approach integrating antibody responses, mass cytometry, and transcriptional profiling of individuals experiencing symptomatic and asymptomatic P. falciparum infection. Defined populations of classical and atypical memory B cells and a TH2 cell bias were associated with reduced risk of clinical malaria. Despite these protective responses, asymptomatic malaria featured an immunosuppressive transcriptional signature with upregulation of pathways involved in the inhibition of T‐cell function, and CTLA‐4 as a predicted regulator in these processes. As proof of concept, we demonstrated a role for CTLA‐4 in the development of asymptomatic parasitemia in infection models. The results suggest that asymptomatic malaria is not innocuous and might not support the induction of immune processes to fully control parasitemia or efficiently respond to malaria vaccines.
Keywords: asymptomatic infection, immunity, immunosuppression, malaria, P. falciparum
Subject Categories: Immunology; Microbiology, Virology & Host Pathogen Interaction; Molecular Biology of Disease
Asymptomatic Plasmodium falciparum malaria infection supports protective humoral responses, but it also features an immunosuppressive transcriptional signature with upregulation of pathways involved in the inhibition of T‐cell function.

Introduction
Malaria remains one of the most serious infectious diseases of humans with over 200 million clinical cases and 600,000 deaths estimated in 2020 (World Health Organization, 2021). Plasmodium falciparum is the most virulent species of malaria parasites and is responsible for disease syndromes ranging from febrile illness to life‐threatening complications including respiratory distress, hypoglycemia, renal failure, pulmonary edema, and cerebral malaria (White & Ho, 1992; Miller et al, 2002). A large body of data supports the concept that disease syndromes result from the sequestration of parasitized red blood cells (RBCs) in vascular beds of target organs (Miller et al, 2002). Inflammatory responses also contribute to severe disease, with high levels of TNF (Molyneux et al, 1993), IFN‐γ, IL‐1β (Pongponratn et al, 2003), and CXCL10 (Wilson et al, 2011) found to be associated with severe P. falciparum malaria. Immune mechanisms controlling parasite growth to below the threshold inducing clinical symptoms develop after repeated exposure over several years. Antibodies are important in clinical immunity to malaria with roles that include inhibition of parasite invasion into RBCs (Blackman et al, 1990) and opsonization for phagocytosis (Hill et al, 2013).
The acquisition of long‐lived antibody‐mediated immunity requires the establishment of germinal centers (GCs) in secondary lymphoid organs, where naive B cells activated by cognate antigen undergo somatic hypermutation of their immunoglobulin (Ig) genes followed by selection of B‐cell clones of high affinity for antigen. These processes require help from T follicular helper (TFH) cells (Vinuesa et al, 2005), which orchestrate GC responses and promote the differentiation of B cells into long‐lived plasma cells and memory B cells (MBCs) (Crotty, 2014). Recent studies in infection models and human malaria revealed that inflammatory cytokines produced in response to acute malaria such as IFN‐γ play an important role in modulating the development of these processes, by upregulating expression of the T helper 1 (TH1)‐defining transcription factor T‐bet in TFH cells and GC B cells. While T‐bet expression in TFH cells impairs their differentiation (Ryg‐Cornejo et al, 2016), thereby reducing the magnitude of the antibody response (Obeng‐Adjei et al, 2015; Ryg‐Cornejo et al, 2016), T‐bet expression in B cells promotes the differentiation of cells with increased affinity for antigen, thereby improving the quality of the antibody response (Ly et al, 2019). Thus, the same inflammatory pathways mediating disease symptoms modulate the acquisition of antibody‐mediated clinical immunity.
Clinical immunity to malaria is not sterilizing, and adults in endemic areas often experience asymptomatic infections. Field studies have shown that antibodies to P. falciparum antigens are rapidly lost in the absence of ongoing exposure to the parasite (Fruh et al, 1991; Kinyanjui et al, 2007; Weiss et al, 2010), suggesting that asymptomatic infections might be required to sustain clinical immunity (Kinyanjui et al, 2004). Aligned with that view, the presence of asymptomatic P. falciparum infections at the end of the dry season was found to reduce the risk of febrile illness in the ensuing malaria season (al‐Yaman et al, 1997; Bereczky et al, 2007; Doumbo et al, 2014). Thus, despite perpetuating a parasite reservoir that deters malaria elimination efforts (Schneider et al, 2007; Sattabongkot et al, 2018), asymptomatic malaria has been long viewed as beneficial to help reduce the risk of severe disease. However, emerging evidence suggests that persistent asymptomatic malaria infections could be detrimental, with important health, developmental, and productivity consequences (Chen et al, 2016). Furthermore, recent studies revealed that treatment of asymptomatic individuals before the start of transmission season does not increase their risk of symptomatic malaria upon re‐infection (Portugal et al, 2017), suggesting that subclinical infections might not always be required to maintain clinical immunity.
To date, the real impact that asymptomatic malaria has on the host and whether these infections should be treated or not remain controversial. To address these issues, we pursued a systems biology approach integrating antibody profiling, high‐dimensional mass cytometry, and peripheral blood mononuclear cell (PBMC) transcriptomic analysis in individuals from a malaria‐endemic area experiencing symptomatic and asymptomatic P. falciparum infection. Antibody responses to parasite invasion ligands, populations of classical and atypical MBCs as well as T helper 2 (TH2) cells were associated with a reduced risk of clinical malaria in asymptomatic individuals. Despite these protective responses, asymptomatic P. falciparum malaria was also characterized by a strong immunosuppressive transcriptional signature with the upregulation of several inhibitory pathways and featuring cytotoxic T‐lymphocyte‐associated protein 4 (CTLA‐4) as a predicted regulator in these processes. Thus, our results suggest that subclinical malaria infections are not benign and do not support the development of immune processes required for the thorough control of parasite replication. As proof of concept, we demonstrated a role for CTLA‐4 in the development of asymptomatic recrudescent parasitemia in infection models.
Results
Cohort characteristics
The study recruited symptomatic (n = 30) and asymptomatic (n = 40) P. falciparum‐infected individuals, as well as light‐microscopy and PCR parasite‐negative healthy community controls (n = 31). Papuans from the Timika region reside both in the lowlands where malaria exposure is common and in the highlands where malaria is absent. Migration of non‐immune adults from the highlands to lowlands means a first infection and symptomatic malaria can occur in all age groups. There were no significant differences in age or gender composition between the symptomatic, asymptomatic, and healthy controls (Fig 1A and B). As expected, mean parasitemia was higher in the symptomatic group compared with the asymptomatic group (Fig 1C). No significant differences were observed between hemoglobin or hematocrit levels (Fig 1D and E), but platelet counts were significantly lower in the symptomatic group compared with both the healthy control and asymptomatic malaria groups (Fig 1F).
Figure 1. Study cohort characteristics.

-
A–FClinical parameters determined in the study include age (A), gender (B), parasitemia (C), hemoglobin (g/dl blood) (D), hematocrit (E), and platelet count (F). Boxes represent the 25th to 75th percentiles, whiskers show the range (minimum to maximum), and lines represent the median. Significance was determined by the Kruskal–Wallis test with Dunn’s multiple comparisons (A, D–F), the Chi‐square test (B), and the Mann–Whitney test (C) using 30 (symptomatic), 40 (asymptomatic), and 31 (healthy immune controls) biological replicates. ****P < 0.0001.
-
GAntibody titers specific for P. falciparum parasite lysate. Bars represent the mean ± SD of using 29 (symptomatic), 35 (asymptomatic), and 26 (healthy immune controls) biological replicates. The dotted line depicts the average antibody background levels of malaria‐naive healthy Melbourne controls.
-
HMean antibody titers as determined by ELISA to the P. falciparum recombinant proteins EBA‐175, EBA‐140, PfRh2, PfRh4, PfRh5, and PfRipr.
-
ISpearman correlations between IgG antibody titers to parasite antigens and parasite density.
-
JOdds ratios as determined by logistic regression showing the association between IgG antibody titers to recombinant proteins EBA‐175, EBA‐140, PfRh2, PfRh4, PfRh5, PfRipr, and the risk of clinical P. falciparum infection. Symbols represent odds ratios and lines depict the 95% confidence intervals, odds ratios below the red dashed line (1) denote reduced risk of symptomatic infection, *P < 0.05.
Assessment of antibody responses to a P. falciparum parasite lysate confirmed that not only infected participants but also healthy controls had been previously exposed to P. falciparum, with high parasite‐specific IgG titers detected in all individuals from each group (Fig 1G). Erythrocyte‐binding antigens (EBAs) and P. falciparum reticulocyte binding protein‐like homologs (PfRhs), two protein families involved in invasion of the parasite into the RBC, are well‐defined targets of naturally acquired immunity to malaria (Cowman & Crabb, 2006). Total IgG levels against EBA‐175, EBA‐140, PfRh2 (a/b common region), PfRh4, PfRh5, and PfRh5‐interacting protein (PfRipr) were examined to identify associations between antibody responses and symptomatic malaria. In general, antibody titers to PfRh5 and PfRipr were lower across the cohort compared with the other invasion ligands and rarely detected among symptomatic individuals (Fig 1H). While IgG levels to EBA‐140 increased with parasite levels, antibody titers to PfRh5 and PfRipr were negatively correlated with parasitemia (Fig 1I). Furthermore, logistic regression analysis revealed that IgG levels against PfRh5 and PfRipr in asymptomatic individuals and healthy immune controls significantly reduced the odds of symptomatic infection (Fig 1J). Thus, all participants in the cohort had been exposed to P. falciparum malaria, and asymptomatic individuals and healthy immune controls generated circulating antibodies able to reduce the odds of symptomatic infection.
High‐dimensional mass cytometry identifies subsets of memory B cells and T cells associated with protection from symptomatic P. falciparum infection
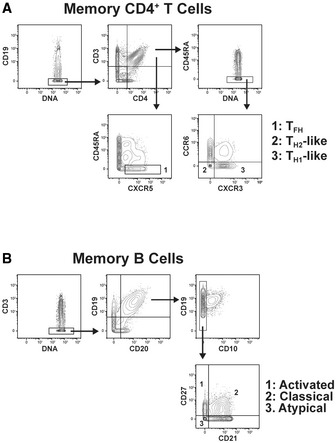
To identify cellular responses associated with reduced risk of clinical P. falciparum malaria, PBMCs from symptomatic and asymptomatic P. falciparum‐infected individuals as well as healthy immune controls were stained with a panel of metal‐labeled antibodies specific for a range of B‐cell and T‐cell markers (Reagents and Tools Table) and analyzed by mass cytometry. In the memory CD4+ T cell pool, expression of CXCR3 and CCR6 allows the identification of TH1‐like CD4+ T cells (CXCR3+CCR6−) from TH2‐like CD4+ T cells (CXCR3−CCR6−), whereas memory TFH cells may be identified by expression of CXCR5 (CD4+CXCR5+) (Fig EV1A). To reveal the cellular complexity within these pools, FlowSOM clustering was applied within each gated population. This allowed the identification of six subsets of TH1‐like CD4+ T cells, TH2‐like CD4+ T cells, and TFH cells, with different expression levels of CD27, CD127, and CD25 (Fig 2A–C). Most but not all CXCR3+ TH1‐like CD4+ T cells expressed T‐bet (Fig 2A). Within TH2‐like CD4+ T cells, PD‐1 expression was in general low (Fig 2B). Two subsets of T‐bet+ TFH cells were detected, as well as multiple clusters of CXCR3−CCR6− cells within the TFH pool (Fig 2C).
Figure EV1. Gating strategy to define major memory CD4+ T cell and MBC populations.
-
AIndividual TH1‐like memory CD4+ T cells (CD19−CD3+CD4+CD45RA−CCR6−CXCR3+), TH2‐like memory CD4+ T cells (CD19−CD3+CD4+CD45RA−CCR6−CXCR3−), circulating memory TFH cells (CD19−CD3+CD4+CD45RA−CXCR5+) memory CD4+ T cells.
-
BClassical (CD3−CD19+CD20+CD10−CD27+CD21+), atypical (CD3−CD19+CD20+CD10−CD27−CD21−), and activated MBCs (CD3−CD19+CD20+CD10−CD27+CD21−).
Figure 2. Identification of MBC and memory CD4+ T‐cell sub‐populations induced by P. falciparum symptomatic and asymptomatic infection.
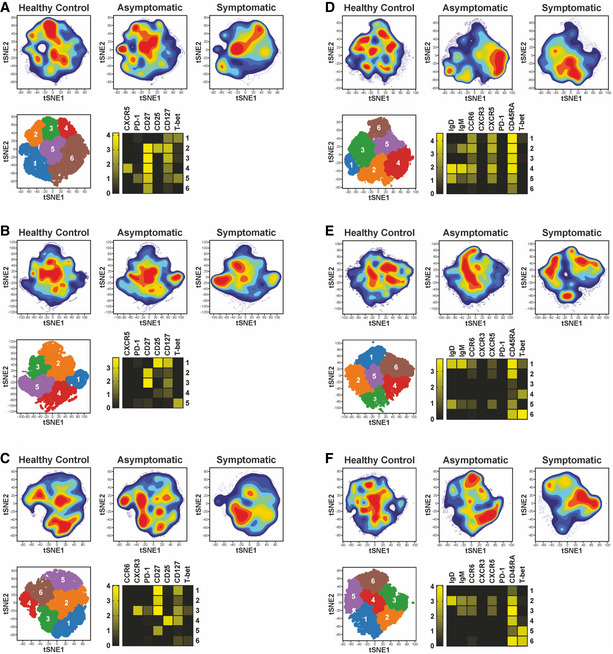
- TH1‐like memory CD4+ T cells (CD19−CD3+CD4+CD45RA−CCR6−CXCR3+)
- TH2‐like memory CD4+ T cells (CD19−CD3+CD4+CD45RA−CCR6−CXCR3−)
- Circulating memory TFH cells (CD19−CD3+CD4+CD45RA−CXCR5+)
- Classical MBCs (CD3−CD19+CD20+CD10−CD27+CD21+)
- Atypical MBCs (CD3−CD19+CD20+CD10−CD27−CD21−)
- Activated MBCs (CD3−CD19+CD20+CD10−CD27+CD21−)
Within the circulating MBC pool, expression of the CD21 and CD27 markers enables the identification of CD21+CD27+ classical, CD21−CD27− atypical, and CD21−CD27+ activated MBCs (Fig EV1B). FlowSOM clustering was performed in each population, allowing for the identification of six sub‐populations of classical, atypical, and activated MBCs (Fig 2D–F). Most classical MBC clusters expressed high levels of CD45RA, whilst expression of chemokine receptors (CXCR5 and CCR6), IgD, and IgM differed across clusters (Fig 2D). Several clusters of IgD−IgM−, class‐switched MBCs were also identified. Downstream flow cytometry experiments revealed that most of these cells expressed IgG. IgM+IgD+ and class‐switched cells were found within clusters of the three MBC sub‐populations, with populations in the atypical and activated MBC pool co‐expressing the transcription factor T‐bet (Fig 2D–F).
Unsupervised identification of differentially abundant cell populations between clinical groups was performed using the CITRUS algorithm (FDR < 5%) (Bruggner et al, 2014). Populations of CD27+CD127low TH1‐like CD4+ T cells were significantly reduced in symptomatic individuals, relative to asymptomatic counterparts (Fig 3A). In contrast, a population of CXCR3− CD4+ T cells, expressing high T‐bet levels was significantly increased in symptomatic individuals compared to healthy immune controls (Fig 3B). Within the TH2‐like memory pool, a CD127+ cluster, expressing low levels of CD25 was enriched among healthy immune controls relative to symptomatic participants (Fig 3B). Two clusters of TH2‐polarized TFH cells expressing CD127 and CD27 were also increased in both healthy immune controls and asymptomatic individuals compared to symptomatic counterparts (Fig 3C). CITRUS analysis revealed four main populations of classical MBCs differentially abundant between clinical groups. Whereas CXCR5+CCR6+ class‐switched and IgM+ MBCs were higher in symptomatic individuals, class‐switched and IgD+IgMlow MBCs expressing low CXCR5 and CCR6 levels were significantly enriched in asymptomatic participants and healthy immune controls (Fig 3D). Two subsets of IgM+IgD+ MBCs among the classical and atypical compartments were also significantly higher in asymptomatic compared to symptomatic participants (Fig 3D and E).
Figure 3. High‐dimensional mass cytometry identifies subsets of MBCs and T cells associated with reduced risk of symptomatic P. falciparum malaria.

-
A–EtSNE plots of clinical groups and viSNE plots depicting expression of selected surface markers, relative abundance and cellular phenotype of differentially abundant clusters identified among CXCR3+CCR6− memory CD4+ T cells (A), CXCR3−CCR6− memory CD4+ T cells (B), circulating memory TFH cells (C), classical MBCs (D), and atypical MBCs (E). The tSNE plots in the top or each panel display cell density and represent pooled data for each group as calculated in the clustering analysis shown in Fig 2A–E, while the viSNE plots on each top panel depict relevant marker expression on tSNE overlays. The lower panels from left to right show differentially abundant populations identified in purple on a tSNE overlay, whiskers showing the range (minimum to maximum), with lines representing the median of 16 (symptomatic), 24 (asymptomatic), and 24 (healthy immune controls) biological replicates, while the pink histograms illustrate marker expression in identified differentially abundant populations, relative to background expression, shown in lilac.
-
FOdds ratios as determined by logistic regression showing associations between cell frequencies and the risk of symptomatic P. falciparum infection. Symbols represent the odds ratio estimated using 16 (symptomatic, SM), 24 (asymptomatic, AM), and 24 (healthy immune controls, HC) biological replicates, and vertical lines depict the 95% confidence interval. *P < 0.05, **P < 0.01, ***P < 0.001.
To define associations between cell populations and risk of symptomatic malaria, logistic regression models were applied (Benjamini–Hochberg adjusted FDR<5%). Consistent with previous studies (Obeng‐Adjei et al, 2015; Ryg‐Cornejo et al, 2016), PD‐1+CXCR3+T‐bet+ TFH cells were associated with increased odds of P. falciparum symptomatic malaria (Fig 3F). Similarly, CXCR5+CCR6+ IgM+ classical and activated MBCs were associated with increased odds of symptomatic infection. In contrast, IgD+IgMlow classical MBCs and two populations of atypical MBCs (IgM+IgD+ and class‐switched T‐bet+ cells) expressing low or no CXCR5 and CCR6, along with CD127+CD25low TH2‐like memory CD4+ T cells, were associated with reduced odds of symptomatic infection (Fig 3F). Thus, diverse MBCs expressing low chemokine receptor levels and a CD4+ TH2 cell bias were associated with reduced odds of clinical malaria.
RNA sequencing of PBMCs segregates transcriptional profiles of symptomatic and asymptomatic P. falciparum malaria and healthy immune controls
To identify molecular pathways associated with the acquisition of clinical immunity, selected P. falciparum‐infected symptomatic and asymptomatic study participants, as well as healthy immune controls, were chosen for transcriptional profiling by RNA‐sequencing (RNA‐seq). Clinical parameters, parasite‐specific antibody responses, and frequencies of CyTOF clusters in these samples were representative of those observed in the entire cohort (Fig EV2). As our mass cytometry analysis focused only on MBCs and CD4+ T cells, we used the cell‐type deconvolution package dtangle (Hunt et al, 2019) with hematopoietic cell RNA‐seq data (Choi et al, 2019) as a reference dataset to estimate the proportion of all PBMC populations in the blood (Fig 4A). No significant enrichment was observed in frequencies of total MBCs, CD4+ and CD8+ T cells, NK cells, monocyte subsets, and dendritic cells across the three clinical groups.
Figure EV2. Transcriptomic cohort characteristics.

-
A–FClinical parameters determined in the study included: age (A), gender (B), parasitemia (C), hemoglobin (g/dl blood) (D), hematocrit (E), and platelet count (F).
-
G–MAntibody responses against the following antigens were evaluated in the study which included: P. falciparum parasite lysate (G), EBA‐175 (H), EBA‐140 (I), PfRh2 (J), PfRh4 (K), PfRh5 (L), and PfRipr (M).
-
N–TPercentage of cell populations identified by CyTOF with statistically significant odds ratios are shown: CXCR3+ PD‐1+ TH1 TFH cells (N), IgM+ classical MBCs (O), IgM+ atypical MBCs (P), CD25low CD27low CD4+ TH2 memory cells (Q), IgD+IgMlow classical MBCs (R), Isotype switched T‐bet+ atypical MBCs (S), and IgD+ IgM+ atypical MBCs (T).
Data information: Boxes represent the 25th to 75th percentiles, whiskers show the range (minimum to maximum), and lines represent the median. Significance was determined by the Mann–Whitney test, *P < 0.05, ****P < 0.01, ****P < 0.005, ****P < 0.001.
Figure 4. RNA sequencing of PBMCs segregates transcriptional profiles of symptomatic and asymptomatic P. falciparum malaria and healthy immune controls.

- Estimated proportions of PBMC subpopulations determined from cell‐type deconvolution from study participant transcriptional profiles.
- Unsupervised multidimensional scaling of the top 1,000 most variably expressed genes across all samples.
- Venn diagram of the number of differentially expressed genes between clinical groups determined at a false discovery rate (FDR) of 15%
- Blood transcriptional module (BTM) analysis showing significant BTMs differentially enriched for pairwise comparisons (FDR<15%).
Multi‐dimensional scaling of transcriptional profiles revealed a good level of segregation between symptomatic P. falciparum‐infected individuals and asymptomatic participants, with a small degree of overlap between these individuals and healthy immune controls (Fig 4B). Clinical groups were then incorporated as a factor into linear modeling for gene expression estimation and identification of differentially expressed genes, whereby the greatest difference was found between symptomatic malaria and healthy immune controls (Fig 4C).
To identify immunological processes underlying differences in transcriptional profiles, differential enrichment was assessed with tmod (preprint: Weiner & Domaszewska, 2016) using pairwise comparisons between clinical groups and blood transcriptional modules (BTMs) (Li et al, 2013) as gene sets (Fig 4D). Multiple modules involved in cell division, cell development, and cell cycle were enriched in symptomatic individuals compared with both asymptomatic participants and healthy immune controls. Conversely, B‐cell differentiation and nuclear receptor subfamily 4 modules were significantly reduced in symptomatic individuals compared to asymptomatic counterparts and healthy immune controls. Interestingly, enrichment of complement, cell adhesion, and chemokine cluster modules was observed in symptomatic malaria only when compared against asymptomatic individuals, suggesting that persistent infections of low parasitemia have a regulatory effect on the induction of those pathways (Fig 4D).
Symptomatic P. falciparum malaria infection drives transcriptional profiles supporting inflammatory processes and fatty acid metabolism
Unsupervised hierarchical clustering of the 922 genes differentially expressed between P. falciparum symptomatic participants and healthy immune controls revealed clear segregation of transcriptional profiles (Fig 5A). Gene set enrichment using gene ontology (GO) terms, Kyoto Encyclopedia of Genes and Genomes (KEGG) pathways, and Ingenuity Pathway Analysis (IPA) showed significant upregulation of terms involved in cell proliferation in symptomatic malaria (Fig 5B–E), including genes encoding cyclins such as CCNB1 and CCNB2, MKI67, replication factors such as CDT1 as well as mitotic checkpoint kinases like BUB1 (Fig 5B). In addition, multiple stress response pathways were upregulated during symptomatic infection (Fig 5C–E), along with terms involved in cholesterol and fatty acid metabolism. Various genes associated with inflammatory responses were upregulated in symptomatic P. falciparum malaria, including SLAMF7, SLAMF8, CXCL9, IFNG, JAK3, C1QC, C1QB, and LAG3 (Fig 5B).
Figure 5. Symptomatic P. falciparum malaria infection drives transcriptional profiles supporting inflammatory processes and fatty acid metabolism.

-
AUnsupervised hierarchical clustering heat map of the 922 differentially expressed genes (DEGs) between symptomatic P. falciparum malaria and healthy immune controls using the complete method and Euclidian measure of distance.
-
BMean‐difference plot displaying genes differentially expressed between symptomatic P. falciparum malaria and healthy immune controls. Each gene is plotted as a single point determined by log‐fold‐change and average transcript abundance. Red genes are overrepresented, and blue genes are underrepresented in symptomatic malaria.
-
CBar plots showing significantly enriched gene ontology (GO) terms scaled by Log10(P‐value). Red GO terms are upregulated and blue GO terms are downregulated in symptomatic P. falciparum malaria compared to healthy immune controls.
-
DBar plots showing significantly enriched Kyoto Encyclopedia of Genes and Genomes (KEGG) pathways scaled by Log10(P‐value). Red KEGG pathways are upregulated and blue KEGG pathways are downregulated in symptomatic P. falciparum malaria compared to healthy immune controls.
-
EIPA canonical pathways significantly overrepresented in DEGs between symptomatic P. falciparum malaria and healthy immune controls scaled by Log10(P‐value). Pathways with a positive z‐score in red are activated, and pathways with a negative z‐score in blue are inhibited in symptomatic P. falciparum malaria compared to healthy immune controls. The ratios of DEGs found in each pathway over the total number of genes in the pathway are listed on the right. The red line corresponds to a P‐value of 0.05.
-
FUpstream regulator analysis of the 922 DEGs between symptomatic P. falciparum malaria and healthy immune controls. The red lines represent a significant activation z‐score of ± 2.
-
G, HHierarchical clustering heatmap (G) and Spearman correlation network (H) displaying DEGs in symptomatic P. falciparum malaria and healthy immune controls predicted to be controlled by IFN‐γ and IL‐13 upstream regulators.
Upstream regulator analysis identified increased activation of the transcription regulator Non‐POU domain‐containing octamer‐binding protein (NONO) and the cytokines IFN‐γ and IL‐13 in symptomatic individuals compared to healthy immune controls (Fig 5F). Whereas several genes involved in stress response and inflammatory processes were predicted as targets of NONO and IFN‐γ‐mediated pathways, the TH2‐cytokine IL‐13 was predicted to control genes involved in cholesterol biosynthesis and fatty acid metabolism (ACADVL, DHCR24, ENPP2, FADS2, and HSD11B1). Interestingly, many IL‐13 and IFN‐γ‐predicted target genes upregulated in symptomatic individuals were significantly correlated with each other (Fig 5G and H), suggesting that TH2‐polarized responses become activated during acute malaria with the potential to help meet the energy demands posed by the inflammatory response to symptomatic infection.
Among the pathways downregulated during symptomatic infection were regulation of gene expression, metabolic processes, and signaling (Fig 5B–E). These included genes encoding DNA‐binding elements and transcription factors such as NAB2, SP3, FOXN3, as well as the nuclear receptors NR4A3, NR4A2, and NR1D2, known to modulate immune cell activation, cell migration, apoptosis, and cell metabolism (Fig 5B). Thus, concomitant with a proliferative/inflammatory transcriptional signature, symptomatic malaria appears to impact the control of cellular processes by altering the expression of transcriptional regulators.
Asymptomatic P. falciparum malaria drives a transcriptional profile supporting immunosuppressive processes
IPA of the 418 genes differentially expressed between P. falciparum symptomatic and asymptomatic individuals showed significant upregulation of cell proliferation canonical pathways in response to symptomatic infection (Fig 6A). In contrast, cell cycle checkpoint control, together with p53 signaling, were among the pathways downregulated in symptomatic relative to asymptomatic P. falciparum malaria (Fig 6A). As in Fig 5, upstream regulator analysis predicted activation of IFN‐γ and IL‐13‐mediated pathways in symptomatic malaria (Fig 6B). Notably, the only upstream regulator significantly upregulated by asymptomatic infection was CTLA‐4 (Fig 6B). All genes in the dataset predicted to be controlled by CTLA‐4 were involved in the control of cell proliferation. To further define transcriptional signatures preferentially activated by asymptomatic or symptomatic infection, hierarchical clustering was performed (Fig 6C). The inclusion of healthy immune controls in this analysis allowed visualization of 4 gene clusters. Two of them had genes either upregulated (cluster 1) or downregulated (cluster 2) in response to symptomatic infection compared to both asymptomatic infection and healthy immune controls (Fig 6C). These groups featured genes involved in response to stress, similar to those described in Fig 5. In contrast, clusters 3 and 4 consisted of genes in which expression profiles were either enriched or diminished by symptomatic or asymptomatic infection relative to homeostatic transcriptional levels from healthy immune controls (Fig 6C–F). A group of integrins (ITGA2B, ITGB3, and ITGB5), proteosome‐encoding genes (PSMA4, PSMB5, PSMC2, PSMD1), and cytoskeleton regulators (KIF23, KIF2C, KIF18A) involved in antigen presentation, along with various genes encoding protein products involved in immune defense to microorganisms (LCN2, PRDX1, SUCNR1, BATF2, ALPK1, and IDO2), were upregulated in response to symptomatic malaria but underrepresented in asymptomatic malaria carriers, suggesting that persistent asymptomatic infection may have a suppressive effect in the induction of those responses (Fig 6D–F). Similarly, genes involved in cell proliferation (CCNA2 and TOP2A) predicted to be controlled by CTLA‐4 (Fig 6B) were also reduced in asymptomatic individuals (Fig 6E and F). Furthermore, linear regression analysis identified 18 additional genes involved in cell cycle control downregulated by asymptomatic malaria, with transcription patterns correlated with CCNA2 expression (Fig 6G).
Figure 6. Asymptomatic P. falciparum malaria upregulates transcription of pathways involved in immunosuppressive processes.

- IPA canonical pathway analysis scaled by −Log10(P‐value) using the 418 differentially expressed genes (DEGs) between symptomatic and asymptomatic P. falciparum malaria. Pathways with a positive z‐score in red are activated, and pathways with a negative z‐score in blue are inhibited in symptomatic compared with asymptomatic P. falciparum malaria. The ratios of DEGs found in each pathway over the total number of genes in the pathway are listed on the right. The red line corresponds to a P‐value of 0.05.
- Upstream regulator analysis of the 418 DEGs between P. falciparum symptomatic and asymptomatic infected participants. The red lines represent a significant activation z‐score of ± 2.
- Heatmap of the 418 DEGs in P. falciparum symptomatic and asymptomatic infected participants as well as in healthy immune controls.
- Bar plots showing significantly enriched gene ontology (GO) terms scaled by Log10(P‐value) in clusters 3 and 4 from the heatmap in C. Red GO terms are upregulated and blue GO terms are downregulated in symptomatic compared with asymptomatic P. falciparum malaria.
- Volcano plot displaying selected genes clusters 3 and 4 from heatmap in C scaled by Log2‐fold‐change and ‐Log10(P‐value) differentially expressed between P. falciparum symptomatic and asymptomatic infected individuals. Genes in red are overrepresented in symptomatic malaria and genes in blue are overrepresented in asymptomatic malaria.
- Mean Reads Per Kilobase of transcript per Million mapped reads (RPKMs) ± SEM of selected genes in P. falciparum malaria symptomatic (n = 6) and asymptomatic (n = 5) individuals. Dotted red lines depict transcriptional levels of healthy immune controls, Mann–Whitney test of biological replicates, *P < 0.05.
- Hierarchical clustering heatmap of genes associated with CCNA2 identified by linear regression analysis (FDR < 5%).
- Spearman correlation matrix (Benjamini–Hochberg adjusted FDR < 5%) between parasitemia levels and immunoregulatory genes differentially expressed between symptomatic and asymptomatic P. falciparum‐infected individuals. Significant positive correlations are shown in blue and significant negative correlations are shown in red.
Genes in cluster 4 (Fig 6C), underrepresented in symptomatic malaria and upregulated by asymptomatic infection, included several genes encoding protein products mediating negative regulation of immune processes, such as the anti‐proliferative molecules BTG1 and NDRG2, as well as the checkpoint receptor CD83 (Fig 6D and E). PLD4 encoding phospholipase D4 and WNT10B implicated in anti‐inflammatory responses (Trischler et al, 2016) were also upregulated in this group (Fig 6D–F). Two nuclear receptors described to negatively modulate transcriptional profiles of a range of immune responses were also overrepresented in asymptomatic individuals: IRF2BP2 encoding the transcriptional repressor IFN regulatory factor 2 binding protein 2 that suppresses CD4+ T‐cell proliferation (Secca et al, 2016) and the nuclear receptor NR1D1, a circadian clock gene that controls the transcription of several inflammatory cytokines (Chang et al, 2019; Liu et al, 2020) (Fig 6E and F). Correlation analysis of this immunoregulatory signature with parasitemia levels identified two groups of genes. NR1D1, NDRG2, and PLD4 showed significant negative correlations with parasitemia, suggesting that downregulation of transcription could be driven by high parasite burden and/or the concomitant inflammation associated with symptomatic infection (Fig 6H). In contrast, integrins, cytoskeleton regulators, and anti‐microbial genes along with IRF2BP2, CD83, BTG1, and WNT10B with anti‐proliferative and anti‐inflammatory activity were not a function of high parasitemia (Fig 6H), raising the possibility that low parasitemia asymptomatic P. falciparum infections activate a blood transcriptional profile that drives immunosuppressive processes.
To further define molecular processes influenced by asymptomatic P. falciparum infection, transcriptional profiles of asymptomatic individuals and healthy immune controls were compared (Fig 7A). Within the pathways uniquely downregulated by asymptomatic malaria were response to endogenous stimulus, regulation of cell proliferation, and cell‐cell adhesion (Fig 7B). These included genes encoding 7‐dehydrocholesterol reductase (DHCR7) involved in vitamin D metabolism, myeloperoxidase (MPO) with important antimicrobial function, as well as the secreted protein acidic and rich in cysteine (SPARC) and vascular cell adhesion protein 1 (VCAM1) that play an important role in cell adhesion under inflammatory conditions. MAP3K7CL encoding the mitogen‐activated protein kinase 7 and PDE5A encoding a phosphodiesterase implicated in the control of T‐cell function were also significantly downregulated in asymptomatic individuals compared to healthy controls (Fig 7C). Gene set enrichment analysis showed significant upregulation of retinol metabolism, terms involved in negative regulation of T‐cell co‐stimulation, and nitric oxide synthesis (Fig 7B and C) in response to asymptomatic malaria. These included RDH13, encoding retinol dehydrogenase 13, genes involved in NFKB regulation such as CRIP2 and PDCD2L, as well as NOS3, encoding nitric oxide synthase. The expression of IL5RA encoding the receptor for the TH2‐cytokine IL‐5 was also upregulated in asymptomatic individuals (Fig 7C). Various genes encoding protein products involved in the negative control of B cell (such as TRPM5) and T‐cell effector function (such as CD160), as well as the transcription regulators EGR3 (Safford et al, 2005) and FOSB (Baumann et al, 2003), were also upregulated in P. falciparum asymptomatic malaria compared to healthy individuals (Fig 7C). Except for DHCR7, which negatively correlated with high parasitemia, transcription profiles of immunoregulatory genes differentially expressed between asymptomatic infected individuals and healthy controls were not correlated with parasitemia levels (Fig 7D). Furthermore, various genes such as CRIP2, TRPM5, EGR3, PDE5A, MAP3 KTC7, and SPARC, among others, displayed similar levels of upregulation or downregulation in asymptomatic individuals compared to both symptomatic counterparts and healthy controls (Fig 7E). Thus, these results support the notion that asymptomatic P. falciparum infections drive a blood transcriptional profile that supports anti‐inflammatory and immunosuppressive processes.
Figure 7. Asymptomatic P. falciparum malaria upregulates transcription of pathways involved in immunosuppressive processes.

- Hierarchical clustering heat map of the 171 differentially expressed genes (DEGs) in P. falciparum asymptomatic and healthy immune control participants.
- Bar plots showing significantly enriched gene ontology (GO) terms scaled by Log10(P‐value) within clusters 1 and 2 from the heat map shown in A. Red GO terms are upregulated and blue GO terms are downregulated in asymptomatic P. falciparum malaria compared to healthy immune controls.
- Mean‐difference plot displaying DEGs between asymptomatic P. falciparum malaria and healthy immune controls. Each gene is plotted as a single point determined by log‐fold‐change and average transcript abundance. Red genes are overrepresented, and blue genes are underrepresented in asymptomatic malaria.
- Spearman correlation matrix (Benjamini–Hochberg adjusted FDR < 5%) between parasitemia levels and immunoregulatory genes differentially expressed between asymptomatic P. falciparum‐infected individuals and healthy immune controls. Significant positive correlations are shown in blue and significant negative correlations are shown in red.
- Mean RPKMs ± SEM of selected genes in P. falciparum malaria asymptomatic individuals (n = 5) and healthy immune controls (n = 6). Dotted red lines depict transcriptional levels of P. falciparum‐infected symptomatic individuals, Mann–Whitney test of biological replicates, *P < 0.05.
Asymptomatic P. falciparum malaria‐immunosuppressive transcriptional profiles are not correlated with protective responses to infection
To integrate immune responses associated with increased or reduced risk of malaria identified by mass cytometry and blood transcriptional signatures, Spearman correlations were applied (Benjamini–Hochberg adjusted FDR < 5%). In general, cell populations overrepresented in symptomatic malaria were positively correlated with the symptomatic transcriptional signature, with T‐bet+ memory CD4+ T cells and activated IgM+ MBCs featuring the highest number of associations with gene expression profiles (Fig EV3). Whereas expression of genes involved in cell cycle progression, inflammatory and stress responses positively correlated with frequencies of T‐bet+ memory CD4+ T cells (Figs 8A and EV3A and B), genes involved in cell proliferation and telomerase recruitment were associated with the expansion of the activated IgM+ MBC compartment (Figs 8B and EV3C and D). Frequencies of activated IgM+ MBCs, associated with increased odds of symptomatic infection, were also positively correlated with classical IgM+ MBCs and with CXCR3+ TFH cells (Figs 8C and EV4A and B). Together, these findings suggest that the highly inflammatory milieu during symptomatic infection supports a TH1‐polarized TFH cell compartment, which induces activation and expansion of this MBC pool (Fig 8C).
Figure EV3. Correlations between cell populations identified by CyTOF and P. falciparum malaria blood transcriptional signatures.

-
A, BHierarchical clustering heatmap (A) and bar plots showing enriched GO pathways (B) using genes upregulated in symptomatic individuals that were significantly correlated (Benjamini–Hochberg adjusted P < 0.05) with IgM+ activated MBCs.
-
C, DHierarchical clustering heatmap (B) and bar plots showing enriched GO pathways (D) using genes upregulated in symptomatic individuals that were significantly correlated with T‐bet+ CD4+ T cells.
-
EHierarchical clustering heat map of genes upregulated in asymptomatic P. falciparum‐infected individuals that were significantly correlated (Benjamini–Hochberg adjusted P < 0.05) with CD27+ TH2 CD4+ cells.
Figure 8. Asymptomatic P. falciparum malaria supports humoral responses to infection, but drives immunosuppressive responses.

-
AVolcano plot showing genes upregulated in symptomatic individuals that were significantly correlated with IgM+ activated MBCs.
-
BVolcano plot showing genes upregulated in symptomatic individuals that were significantly correlated with T‐bet+ CD4+ T cells.
-
CChord diagram integrating associations between symptomatic malaria signature genes, immune cell populations, and antibody responses. Blue lines within the chord diagram represent positive correlations between two variables, while red lines represent negative correlations (Benjamini–Hochberg adjusted Spearman’s Rho, FDR < 5%).
-
DChord diagram integrating associations between asymptomatic malaria signature genes, immune cell populations, and antibody responses. Blue lines within the chord diagram represent positive correlations between two variables, while red lines represent negative correlations (Benjamini–Hochberg adjusted Spearman’s Rho, FDR < 5%).
Figure EV4. Correlations between cell populations identified by CyTOF in response to P. falciparum infection.

-
AHierarchical clustering subdivides population identified by CyTOF into three main clusters, with cluster 1 featuring populations abundant in symptomatic patients and cluster 3 cells abundant in healthy immune controls.
-
B–DSpearman correlation matrices were used to determine the relationship between cell populations within each separate cluster (Benjamini–Hochberg adjusted P > 0.05). The numbers beween parentheses next to each cell population indicate the cluster number within each subset defined by FlowSOM clustering in Fig 2.
Populations of class‐switched and IgD+IgMlow MBCs associated with reduced odds of symptomatic infection, that were overrepresented in asymptomatic individuals and healthy immune controls, were highly correlated with each other and were also positively associated with a population of CD27+ TH2‐polarized TFH cells. This suggests that help from this TFH cell lineage sustains the expansion of MBCs contributing to clinical immunity (Figs 8D and EV4A and C). Transcription levels of most genes enriched in asymptomatic infection were positively associated with each other (Fig 8D). Unlike symptomatic malaria, where blood transcriptional profiles showed coherent correlations with key immune cell populations expanding in response to infection, virtually no associations were found between the asymptomatic transcriptional signature and cells associated with reduced risk of clinical malaria (Figs 8D and EV3E). Thus, these results suggest that two independent processes with presumably different etiologies operate during asymptomatic malaria: an antibody‐dependent immune response that reduces the risk of symptomatic infection, and an immunoregulatory signature capable of reducing immune cell effector function.
CTLA‐4 is upregulated in memory CD4+ T cells in asymptomatic malaria and contributes to the development of clinically silent parasitemia
To infer potential cellular sources of the immunoregulatory transcriptional signature featured by asymptomatic P. falciparum malaria, cell‐type‐specific marker genes were examined using dtangle. This analysis predicted CD4+ T cells as the main sources of asymptomatic malaria transcriptional profiles (Fig 9A). We then sought to provide proof of concept for the regulatory pathways identified by our bioinformatic analysis in the control of asymptomatic infection. Since CTLA‐4 was predicted as a potential regulator in these processes (Fig 6) and is expressed by CD4+ T cells, this pathway was selected for further analysis. Flow cytometry followed by high‐dimensional analysis of CD3+CTLA‐4+ cells identified specific populations expressing this receptor in response to symptomatic and asymptomatic P. falciparum malaria. Although similar frequencies of CTLA‐4+CD4+FoxP3+ regulatory cells (TREG) were found between groups, CTLA‐4 expression in this compartment was twice as high in symptomatic compared to asymptomatic infection (Fig 9A–F). CTLA‐4+CD4+ T cells expressing high CD25 levels were also increased in symptomatic infection, but conventional CD45RA− memory CD4+ T cells became important sources of CTLA‐4 expression during asymptomatic infection compared to symptomatic counterparts (Fig 9A–G). To extend these observations and provide mechanistic evidence for the role of CTLA‐4 in the control of asymptomatic parasitemia, C57BL/6 mice were infected with P. chabaudi chabaudi, which results in a peak of parasitemia around day 8 post‐infection (p.i) that is resolved after two weeks and followed by asymptomatic recrudescences of low parasitemia (Fig 9H). Although these recrudescences differ from persistent clinically silent infections seen in human malaria, they provide a valuable tool to investigate the role of regulatory pathways in asymptomatic parasitemia. Frequencies of CTLA‐4‐expressing cells were then examined among gated FoxP3+CD25+CD4+ TREG cells and CD44+ activated CD4+ T cells by flow cytometry. When animals were experiencing peak parasitemia on day 8 p.i., the percentage of CTLA‐4+ cells significantly increased in both TREG and CD4+ T‐cell compartments (Fig 9I–K). Whereas frequencies of CTLA‐4+ TREG cells returned to normal levels after resolution of peak parasitemia, they remained significantly higher than uninfected controls among CD4+ T cells when mice were experiencing asymptomatic recrudescence on day 20 p.i (Fig 9I–K). tSNE and FlowSom analysis of gated CTLA‐4+CD4+ T cells revealed clear differences in the composition of the CTLA‐4+ pool expanding during peak parasitemia and asymptomatic recrudescence, with high frequencies and absolute numbers of CD44+CCR7−CD62Llow cells consistent with an effector memory phenotype, coinciding with the onset of recrudescent infection (Fig 9L–Q). Thus, CTLA‐4 expression remains elevated among memory CD4+ T cells in both human and mouse asymptomatic malaria. Furthermore, administration of anti‐CTLA‐4 blocking antibodies to P. chabaudi chabaudi‐infected mice from day 13 p.i resulted in a 10‐fold reduction in recrudescent parasitemia levels compared to controls (Fig 9R), providing proof of concept for CTLA‐4 as an immunoregulatory pathway contributing to the development of persistent asymptomatic parasitemia after malaria infection.
Figure 9. CTLA‐4 is upregulated in memory CD4+ T cells in asymptomatic malaria and contributes to the development of clinically silent parasitemia.

-
AEstimated proportions of PBMC subpopulations determined from cell‐type deconvolution featuring transcriptional profiles upregulated in asymptomatic individuals.
-
B–GPBMCs from P. falciparum symptomatic (n = 6, SM) and asymptomatic (n = 6, AM) infected individuals as well as healthy immune controls (n = 6, HC) were stained with a panel of antibodies and analyzed by flow cytometry. tSNE plots (B) display cell density of the pooled data for each group, (C) shows a projection of the FlowSOM clusters on a tSNE plot, and (D) is a heatmap depicting the cellular phenotype of clusters of CTLA‐4+CD3+CD19− cells. Bar plots representing mean relative abundance of biological replicates ± SEM of relevant clusters among clinical groups (E), Mann–Whitney test, *P < 0.05. The panel on the left shows the average CTLA‐4 mean fluorescent intensity (MFI) or 6 biological replicates in cluster 4 ± SEM, Mann–Whitney test, **P < 0.01, while representative histograms of CTLA‐4 expression in cluster 4 are shown on the right (F). Marker intensity within clusters 1 and 6 (G).
-
HC57BL/6 mice (n = 10) were infected with P. chabaudi chabaudi. Percentage parasitemia of infected mice was determined every 2–3 days. Symbols represent average parasitemia ± SEM.
-
I–QSplenocytes from P. chabaudi chabaudi infected mice were stained with fluorescent antibodies and analyzed by flow cytometry. (I) Representative contour plots showing CTLA‐4‐expressing cells among TREG and CD44+ CD4+ T cells. (J, K) Percentage of CTLA‐4+ cells among CD4+FoxP3+ Treg cells (J) and CD44+ activated CD4+ T cells (K) at peak (day 8 p.i) and recrudescent (day 20 p.i) parasitemia and after infection resolution (day 40 p.i). Bar plots represent mean percentage of 6 biological replicates ± SEM (unpaired t‐test, ***P < 0.005, *P < 0.05). (L–N) tSNE plots (L) display cell density of the pooled data for each group, (M) shows a projection of the FlowSOM clusters on a tSNE plot, and (N) is a heatmap depicting the cellular phenotype of CTLA‐4+ conventional CD4+ T cells during peak and recrudescent parasitemia. (O) Bar plots represent the average relative abundance of 6 biological replicates in relevant clusters ± SEM (unpaired t‐test, **P < 0.01). (P and Q) Representative contour plots (P) and absolute number (Q) of CTLA‐4‐expressing CD4+CD44+CCR7+CD62Lhigh central memory (CM) and CD4+CD44+CCR7−CD62Llow effector memory (EM) cells during peak and recrudescent parasitemia. Symbols represent the mean cell number of 6 biological replicates ± SEM (unpaired t‐test, ***P < 0.05).
-
RC57BL/6 mice (n = 6) were infected with P. chabaudi chabaudi and treated with anti‐CTLA‐4 or isotype control every 3 days from day 13 p.i as indicated by the red arrows. Parasitemia was determined every 2–3 days. Bar plots represent mean parasitemia of biological replicates ± SEM (unpaired t‐test, **P < 0.01, *P < 0.05).
Discussion
This study pursued a systems biology approach integrating P. falciparum‐specific antibody responses, multidimensional mass cytometry, and blood transcriptional profiling in adults from a malaria‐endemic area of Indonesia to understand cellular and molecular processes operating during asymptomatic P. falciparum infection. Aligned with the concept of clinical immunity, our findings identified antibody responses to parasite invasion ligands along with specific populations of classical and atypical MBCs associated with reduced odds of symptomatic infection in asymptomatic individuals. Notably, asymptomatic P. falciparum malaria was also characterized by an important immunoregulatory blood transcriptional signature with the upregulation of various pathways involved in the inhibition of CD4+ T‐cell function. Thus, our findings suggest that although these sub‐clinical infections allow the development of antibody responses that reduce parasitemia levels to below the threshold required to induce clinical symptoms, they might not entirely support the effective induction of cellular immune processes required for the thorough control of parasite replication.
Aligned with previous RNA‐seq analyses (Tran et al, 2016; Lee et al, 2018; Bediako et al, 2019) and a well‐defined role for IFN‐γ in acute malaria (Pongponratn et al, 2003), transcriptional profiles of P. falciparum symptomatic malaria predicted this cytokine as an upstream regulator of the stress response induced during infection. Concomitant with this inflammatory response, symptomatic malaria was also characterized by the upregulation of enzymes required for fatty acid metabolism. Our bioinformatic approach predicted the TH2 cytokine IL‐13 as the regulator responsible for these processes. Recent studies revealed that IL‐13 plays a key role in driving metabolic conditioning during endurance exercise by preserving glycogen in favor of fatty acid oxidation (Knudsen et al, 2020). Thus, although upregulation of type‐2 cytokines in response to malaria has been historically proposed to ameliorate the effects of excessive inflammatory responses to infection, our findings here are consistent with a model in which TH2 pathways might become activated during acute malaria to help meet the energy demands posed by the inflammatory response to symptomatic infection.
The high‐dimensional unsupervised single‐cell mass cytometry approach used in this study allowed us to dissect distinct TH1 and TH2‐polarized memory CD4+ T cells, TFH cells, and specific sub‐populations of classical and atypical MBCs associated with either increased or reduced odds of P. falciparum symptomatic malaria. Similar to P. vivax malaria (Ioannidis et al, 2021), class‐switched T‐bet+CCR6− atypical MBCs were associated with reduced odds of P. falciparum malaria, suggesting that specific subsets within this cell lineage, previously viewed as a predictor of poor infection outcomes (Obeng‐Adjei et al, 2017), might play a beneficial role in the control of parasite burden. Unlike P. vivax malaria, in which only class‐switched MBCs were associated with reduced odds of symptomatic infection (Ioannidis et al, 2021), populations of both classical and atypical IgD+IgM+/low MBCs were found to be associated with protection from symptomatic P. falciparum infection. Parasite‐specific IgM+ MBCs have been detected in P. falciparum‐exposed individuals (Krishnamurty et al, 2016) and IgM antibodies specific for blood‐stage antigens have been found to be associated with protection from symptomatic malaria (Arama et al, 2015; Boyle et al, 2019). Unlike class‐switched MBCs, IgD+IgM+ MBCs have the capacity to differentiate into GC B cells upon re‐stimulation (Seifert et al, 2015). Consistently, mouse malaria studies found that IgM+ MBCs adopt a GC B‐cell phenotype upon secondary infection (Pietrzak et al, 2020), while sequencing studies revealed that IgM+ MBCs acquire further mutations upon P. falciparum re‐infection in children (Wendel et al, 2017), suggesting a role for unswitched MBCs in B‐cell receptor repertoire expansion and remodeling during malaria.
Whereas several transcriptional profiles of individuals presenting with symptomatic P. falciparum malaria have been successfully described (Tran et al, 2016; Bediako et al, 2019; Boldt et al, 2019; Nallandhighal et al, 2019), blood transcriptional activity induced in response to asymptomatic infection is still underreported. A longitudinal study following P. falciparum‐asymptomatic individuals through the dry season found transcriptional changes in several metabolic pathways (Andrade et al, 2020). Whole‐blood microarray analysis of children with P. falciparum asymptomatic malaria found chromatin remodeling‐driven gene regulation to contribute to the maintenance of an asymptomatic status (Boldt et al, 2019). Similarly, regulatory genes involved in chromatin remodeling were differentially expressed in monocytes from malaria‐infected men living in Burkina Faso, with lower susceptibility to P. falciparum malaria than sympatric tribes (Quin et al, 2017). Whole‐blood transcriptional profiling of children who differed in their capacity to control parasitemia and fever following P. falciparum infection revealed a signature of p53 activation at baseline in participants who remained asymptomatic upon re‐infection (Tran et al, 2019), thereby identifying a critical pathway in clinical immunity. Despite the development of protective MBCs and antibody responses in our study, transcriptional profiling revealed several integrins, proteosome‐encoding genes, and cytoskeleton regulators involved in antigen presentation underrepresented in asymptomatic malaria carriers relative to symptomatic counterparts, suggesting that persistent asymptomatic low‐parasitemia infection might have a detrimental effect in the induction of those pathways. Furthermore, our analysis identified significant downregulation of genes involved in the control of cell proliferation in asymptomatic malaria and predicted the inhibitory receptor CTLA‐4 as the upstream regulator responsible for these processes. Upregulation of CTLA‐4 in TREG cells and CD4+ T cells has previously been shown in human (Goncalves‐Lopes et al, 2016; Mackroth et al, 2016) and mouse malaria infection models (Haque et al, 2010; Hafalla et al, 2012), and its expression has been associated with restricting pathogenic cellular responses during acute infection, at the expense of inhibiting cell proliferation (Mackroth et al, 2016) and antibody responses to infection (Kurup et al, 2017). While CTLA‐4 blockade improved control of acute parasitemia in mice, it was also found to worsen experimental cerebral malaria disease outcomes (Jacobs et al, 2002; Lepenies et al, 2007), suggesting a protective role for this receptor in the development of T cell‐mediated organ‐specific syndromes during acute infection. In all the above‐mentioned settings, upregulation of CTLA‐4 was always documented in response to acute malaria. Using human studies and mouse malaria infection models, our results revealed a novel and previously unexplored role for CTLA‐4, showing that low parasitemia levels in clinically silent persistent infections are also capable of activating this suppressive pathway, thereby preventing full control of parasite replication. Further work is required to determine if upregulation of CTLA‐4 in these settings arises to prevent pathogenic responses potentially caused by persistent low parasitemia infections.
Concomitant with the downregulation of genes promoting cell proliferation, our approach identified various transcriptional regulators with immunoregulatory and anti‐inflammatory functions arising in the blood in response to asymptomatic P. falciparum malaria. These included B‐cell translocation gene 1 (BTG1), a member of the BTG/transducer of Erb family known to inhibit cell proliferation (Rouault et al, 1992), and the early growth response gene 3 (EGR3) that has recently emerged as a regulatory molecule that is able to suppress excessive CD4+ T‐cell responses (Singh et al, 2017). Expression levels of the transcriptional repressor IFN regulatory factor 2 binding protein 2 (IRF2BP2), that restrains CD4+ T‐cell activation (Secca et al, 2016), were also upregulated by asymptomatic infection. More mechanistic work is now needed to examine if activation of these pathways during asymptomatic infection also modulates the control of low parasitemia infection.
Without the deployment of a highly effective vaccine, there has been an increased focus on interventions to reduce malaria transmission, including administration of artemisinin combined therapies and long‐lasting insecticide‐treated bed nets (Smithson et al, 2015). A central issue in the malaria eradication agenda is the challenge posed by asymptomatic infection, as this clinically silent parasite reservoir is known to perpetuate transmission (Bousema et al, 2004). Strategies of antimalarial mass drug administration to at‐risk populations or mass screening and treatment of asymptomatically infected individuals have been considered. However, this has raised concerns about whether these strategies will have a negative impact on the immune status of the population and increase the risk of severe malaria upon re‐infection. To date, this idea remains controversial, with epidemiological evidence showing shifts to older age in malaria‐related hospital admissions in previously eliminated areas (Ceesay et al, 2008), to no increased risk of clinical malaria upon re‐infection after treatment of asymptomatic infections right before the start of the wet season (Portugal et al, 2017). Furthermore, increasing evidence suggests that asymptomatic malaria results in detrimental effects for the host including splenomegaly, anemia, diminished learning and school performance in children, and increased incidence of invasive bacterial infections requiring hospitalization, suggesting a reduced capacity to fight infection in individuals carrying asymptomatic malaria infections (Chen et al, 2016). Our findings here have uncovered immunosuppression as another potentially deleterious consequence of asymptomatic malaria, which has critical implications for the administration of malaria vaccines, to populations carrying subclinical infections. In line with this concept, attenuated sporozoite vaccine formulations were found to be significantly less immunogenic in malaria‐exposed African adults than malaria‐naive adults (Ishizuka et al, 2016; Jongo et al, 2019; Sissoko et al, 2017), suggesting that chronic exposure to malaria limits vaccine efficacy. Thus, our results suggest that asymptomatic infections are not necessarily benign and provide a framework to consider screening and treatment of asymptomatic P. falciparum malaria.
Materials and Methods
Reagents and Tools Table
| Reagent or resource | Reference or source | Identifier or catalog number |
|---|---|---|
| Biological samples and experimental models | ||
| Melbourne unexposed healthy control | Walter and Eliza Hall Institute of Medical Research Volunteer Blood Donor Registry | N/A |
| Timika healthy community control | Pigapu and Hirapau villages, Timika | HC |
|
Timika asymptomatic P. falciparum malaria |
Pigapu and Hirapau villages, Timika | AM |
|
Timika symptomatic P. falciparum malaria |
Rumah Sakit Mitra Masyarakat Hospital, Timika | SM |
| C57BL6/J (M. musculus) | Jex Laboratory, Walter and Eliza Hall Institute | N/A |
| Antibodies | ||
| ELISA antibodies | ||
| Fc‐HRP‐conjugated mouse anti‐human IgG | Southern Biotech |
Clone H2; Cat# 9042‐05 |
| Surface marker antibodies for CYTOF | ||
| 141Pr‐conjugated mouse anti‐human CD196/CCR6 | Fluidigm |
Clone 11A9; Cat# 3141014A |
| 144Nd‐conjugated mouse anti‐human CD45RA | Fluidigm |
Clone HI100; Cat# 3143006B |
| 146Nd‐conjugated mouse anti‐human IgD | Fluidigm |
Clone IA6‐2; Cat# 3146005B |
| 147Sm‐conjugated mouse anti‐human CD20 | Fluidigm |
Clone 2H7; Cat# 3147001B |
| 151Eu‐conjugated hamster anti‐human ICOS | Fluidigm |
Clone DX29; Cat# 3151020B |
| 152Sm‐conjugated mouse anti‐human CD21 | Fluidigm |
Clone BL13; Cat# 3152010B |
| 153Eu‐conjugated rat anti‐human CXCR5 | Fluidigm |
Clone RF8B2; Cat# 3153020B |
| 156Gd‐conjugated mouse anti‐human CXCR3 | Fluidigm |
Clone G025H7; Cat# 3156004B |
| 158Gd‐conjugated mouse anti‐human CD10 | Fluidigm |
Clone HI10a; Cat# 3158011B |
| 165Ho‐conjugated mouse anti‐human CD19 | Fluidigm |
Clone HIB19; Cat# 3165025B |
| 167Er‐conjugated mouse anti‐human CD27 | Fluidigm |
Clone L128; Cat# 3167006B |
| 170Er‐conjugated mouse anti‐human CD3 | Fluidigm |
Clone UCHT1; Cat# 3170001B |
| 172Yb‐conjugated mouse anti‐human IgM | Fluidigm |
Clone MHM‐88; Cat# 3172004B |
| 174Yb‐conjugated mouse anti‐human CD4 | Fluidigm |
Clone SK3; Cat# 3174004B |
| 175Lu‐conjugated mouse anti‐human PD‐1 | Fluidigm |
Clone EH12.2H7; Cat# 3175008B |
| 176Yb‐conjugated mouse anti‐human CD127 | Fluidigm |
Clone A019D5; Cat# 3176004B |
| APC‐conjugated rat anti‐human IgG | Biolegend |
Clone M1310G05; Cat# 410711 |
| PE‐conjugated mouse anti‐human FcRL5 | Biolegend |
Clone 509f6; Cat# 340304 |
| 145Nd‐conjugated mouse anti‐human PE | Fluidigm |
Clone PE001; Cat# 3145006B |
| 162Dy‐conjugated mouse anti‐human APC | Fluidigm |
Clone APC003; Cat# 3162006B |
| 161Dy‐conjugated mouse anti‐human T‐bet | Fluidigm |
Clone 4B10; Cat# 3161014B |
| Infection model antibodies | ||
| Syrian hamster anti‐mouse CTLA‐4 | Walter and Eliza Hall Institute | Clone 9H10 |
| Ultra‐LEAF™ Purified Armenian Hamster IgG Isotype Control | Biolegend |
Clone 400959; Cat# 400969 |
| Flow cytometry antibodies | ||
| AF700‐conjugated mouse anti‐human CD3 | Biolegend |
Clone UCHT1; Cat# 300424 |
| BV786‐conjugated mouse anti‐human CD4 | BD Biosciences |
Clone SK3; Cat# 664528 |
| BV421‐conjugated mouse anti‐human CD19 | Biolegend |
Clone HIB19; Cat# 302234 |
| PE/Cy7‐conjugated mouse anti‐human CD25 | Biolegend |
Clone M‐A251; Cat# 356108 |
| BV711‐conjugated mouse anti‐human PD‐1 | Biolegend |
Clone EH12.2H7; Cat# 329928 |
| BV650‐conjugated mouse anti‐human CD45RA | Biolegend |
Clone HI100; Cat# 304136 |
| APC/Fire750‐conjugated mouse anti‐human CD8 | Biolegend |
Clone SK1; Cat# 980914 |
| PE/Dazzle594‐conjugated mouse anti‐human CTLA‐4 | Biolegend |
Clone BNI3; Cat# 369616 |
| BB700‐conjugated mouse anti‐human FoxP3 | BD Biosciences |
Clone 236A/E7; Cat# 566526 |
| Rat anti‐mouse CD16/CD32 Fc Block | BD Biosciences |
Clone 2.4G2; Cat# 553142 |
| FITC‐conjugated hamster anti‐mouse TCR β chain | BD Biosciences | Clone H57‐597; Cat# 553170 |
| PE/Cy7‐conjugated rat anti‐mouse CD4 | Biolegend |
Clone RM4‐5; Cat# 100528 |
| BV785‐conjugated anti‐mouse CD44 | Biolegend |
Clone IM7; Cat# 103041 |
| PerCp‐Cy5.5‐conjugated rat anti‐mouse CXCR5 | BD Biosciences |
Clone 2G8; Cat# 560528 |
| BV421‐conjugated Armenian hamster anti‐mouse CXCR3 | Biolegend |
Clone CXCR3‐173; Cat# 126521 |
| APC/Cy7‐conjugated rat anti‐mouse CD62L | Biolegend |
Clone MEL‐14; Cat#104428 |
| Biotin‐conjugated rat anti‐mouse CCR7 | Biolegend |
Clone 4B12; Cat# 120103 |
| Pacific Blue™‐conjugated rat anti‐mouse FoxP3 | Biolegend |
Clone MF‐14; Cat# 126409 |
| APC‐conjugated Armenian hamster anti‐mouse CTLA‐4 | Biolegend |
Clone UC10‐4B9; Cat# 106309 |
| Chemicals, Enzymes, and other reagents | ||
| P. falciparum lysate (5 μg/ml) | Generated in‐house | N/A |
| P. falciparum recombinant protein (0.5–2 μg/ml) | Generated in‐house | N/A |
| 1x10⁵ P. chabaudi chabaudi AS | Generated in‐house | N/A |
| Tetramethyl‐benzidine/H2O2 | KPL Inc. | Cat# 50‐76‐03 |
| Cell‐ID Cisplatin (5 μM) | Fluidigm | Cat# 201064 |
| Dulbecco’s phosphate‐buffered saline (DPBS) | Gibco | Cat# 14190144 |
| Human TruStain FcX | Biolegend | Cat# 422302 |
| Bovine serum albumin (0.5%) (w/v) | Sigma‐Aldrich | Cat# A7906‐100G |
| Sodium azide 0.02% (w/v) | Sigma‐Aldrich | Cat# S8032‐25G |
| Maxpar nuclear antigen staining buffer set | Fluidigm | Cat# 201063 |
| Maxpar fix and perm buffer | Fluidigm | Cat# 201067 |
| Cell‐ID intercalator (125nM) | Fluidigm | Cat# 201192A |
| EQ Four Element beads | Fluidigm | Cat# 201078 |
| Fixable Viability Dye efluor‐506 | eBioscience | Cat# 65‐0866 |
| Software | ||
| CyTOF software v7.0.8493 | Fluidigm | N/A |
| FlowJo v10 | BD Biosciences | https://www.graphpad.com/ |
| Cytobank | (Kotecha et al, 2010) | https://www.beckman.com/flow‐cytometry/software/cytobank‐enterprise |
| GraphPad Prism v8.0 | GraphPad | https://www.graphpad.com/ |
| Rstudio v4.0.3‐4.1.2 | (R Core Team, 2021) | https://www.R‐project.org/ |
| Rsubread v2.0.1 | (Liao et al, 2019) (Liao et al, 2013) | http://bioconductor.org/packages/release/bioc/html/Rsubread.html |
| limma v3.46.0 | (Ritchie et al, 2015) | http://bioconductor.org/packages/release/bioc/html/limma.html |
| Ingenuity Pathway Analysis | QIAGEN | http://pages.ingenuity.com/rs/ingenuity/images/IPA_data_sheet.pdf |
| Reagent kits and Instruments | ||
| QIAamp DNA Blood Mini Kit | QIAGEN | Cat# 51104 |
| Chameleon plate reader | Hidex | N/A |
| Helios mass cytometer | Fluidigm | N/A |
| Isolate II RNA Mini Kit | Bioline | Cat# BIO‐52072 |
| Illumina TruSeq RNA Library Prep Kit (< 100 ng) | Illumina | Cat# RS‐122‐2001 |
| FoxP3/Transcription Factor Staining Buffer Set | eBioscience | Cat# 00‐5521‐00 |
| BD LSR Fortessa X20 | eBioscience | N/A |
| Agilent TapeStation 2200 | Agilent | N/A |
| Illumina NextSeq 500 | Illumina | N/A |
Methods and Protocols
Study population
A retrospective study was conducted in the Timika region of Papua, Indonesia. Papuans reside both in the Timika lowlands where malaria exposure is common and the highlands where malaria is absent (Karyana et al, 2008). Migration of non‐immune adults from the highlands to lowlands means a first malaria infection can occur in all age groups. Consenting participants (aged between 5 and 45 years) donated a venous blood sample at enrollment, and peripheral blood mononuclear cells (PBMCs) and plasma were frozen. Parasite densities were determined by blood smears and participants with light‐microscopy confirmed malaria infections received first‐line anti‐malarial treatment according to the Indonesian Ministry of Health guidelines. In addition, 30 individuals presenting with symptomatic P. falciparum malaria at the Rumah Sakit Mitra Masyarakat Hospital were enrolled in the study. Hemoglobin, hematocrit, and platelet count were measured using a hematology analyzer. Genomic DNA was extracted from dried blood spots using the QIAamp DNA Blood Mini Kit (QIAGEN). The presence of Plasmodium species was confirmed by a nested PCR assay as previously described (Snounou et al, 1993). Symptomatic malaria cases were defined as individuals with an axillary fever temperature ≥ 37.5°C, chills, malaise, headache, or vomiting at the time of examination or up to 24 h prior to the examination and the presence of a P. falciparum positive blood smear and no other cause of fever discernible by physical exam. All individuals included in the immunity study were Papuan. Symptomatic individuals included in the immunity study had > 500 parasite/μl blood, whereas individuals with a P. falciparum‐positive blood smear and no clinical symptoms were classified as asymptomatic infections. Healthy immune controls had a negative light‐microscopy and PCR diagnosis. Previous exposure to malaria in these individuals was confirmed by ELISA against a P. falciparum parasite lysate. This study was approved by the Human Research Ethics Committees of the Eijkman Institute for Molecular Biology, the Walter and Eliza Hall Institute of Medical Research, the Northern Territory Department of Health & Families, and the Menzies School of Health Research. Written informed consent was obtained from all study participants prior to their inclusion in the study. All the experiments conformed to the principles set out in the WMA Declaration of Helsinki and the Department of Health and Human Services Belmont Report.
ELISA
Ninety‐six well plates (Corning) were coated with 5 μg/ml of P. falciparum lysate or 0.5–2 μg/ml of P. falciparum recombinant protein in carbonate buffer pH 9.6 and incubated at 4°C overnight. After washing, plates were blocked with 5% skim milk in phosphate‐buffered saline (PBS) for 1 h at 37°C. Blocked plates were washed with 0.05% Tween‐20 in PBS and incubated with serial two‐fold dilutions of plasma for 1 h at 37°C. After washes, plates were incubated with an HRP‐conjugated mouse anti‐human IgG antibody (Southern Biotech, USA) for 1 h at 37°C. Bound antibodies were detected by reaction of tetramethylbenzidine and H2O2 (KPL Inc., USA). The reaction was stopped by the addition of 1 M H3PO4 and absorbance read at 450 nm on a CHAMELEON plate reader (Hidex). Plasma from malaria‐naive Melbourne blood donors were included as background controls. Antibody titers were calculated as the serum dilution with an optical density (OD) value higher than that observed for negative controls at a 1/100 dilution.
CyTOF
PBMCs (2 × 10⁶) from P. falciparum symptomatic and asymptomatic infected individuals as well as healthy immune controls were stained with 5 μM Cell‐ID Cisplatin (Fluidigm) in PBS (Gibco) for 5 min at room temperature. Cells were then blocked with Human TruStain FcX (Biolegend) and stained with a cocktail of surface marker antibodies (Reagents and Tools Table) in CyTOF staining buffer (PBS with 0.5% bovine serum albumin [BSA; Sigma] and 0.02% sodium azide [Sigma]) for 30 min at room temperature. After surface staining, cells were fixed and permeabilized with a Maxpar nuclear antigen staining buffer set (Fluidigm) and then stained with a 161Dy‐conjugated anti‐T‐bet (clone 4B10; Fluidigm) antibody for 45 min at room temperature. Cells were then washed twice and stored in Maxpar fix and perm buffer (Fluidigm) with 125 nM Cell‐ID iridium intercalator (Fluidigm) for a minimum of 18 h. Prior to data acquisition, cells were washed twice by centrifugation in ultrapure water then resuspended in a 1/10 dilution of 4‐Element EQ normalization beads (Fluidigm) in ultrapure water. Cells were analyzed on a Helios model mass cytometer (Fluidigm) at ~ 300 events/s. Data were normalized using the signal from 4‐Element EQ Beads (Fluidigm) as previously described (Finck et al, 2013). Manual gating was performed using FlowJo version 10 (BD Biosciences) to exclude doublets and dead cells before individual cell populations were selected and exported for further analysis in Cytobank (Kotecha et al, 2010). Individual cell populations were then visualized using viSNE (Amir et al, 2013), while FlowSOM (Van Gassen et al, 2015) was used to examine the composition of the MBC and memory CD4+ T cell pools. The following parameters were included in the viSNE analysis for classical, atypical, and activated MBCs: IgD, IgM, CXCR5, CXCR3, CCR6, CD45RA, PD‐1, and T‐bet. For CXCR3−CCR6+ and CXCR3−CCR6+ memory CD4+ T cells, the following parameters were included: CXCR5, PD‐1, CD27, CD25, CD127, and T‐bet. For TFH cells, the following parameters were included: CXCR3, CCR6, PD‐1, CD27, CD25, CD127, and T‐bet. Self‐organizing maps (SOMs) were then generated for each cell population using hierarchical consensus clustering on the tSNE axes. CITRUS (Bruggner et al, 2014) was used to identify differentially abundant cell populations using the same parameters as the viSNE analysis at a 5% FDR. Preliminary analysis revealed that a minimum of eight samples per group was required for identification of differentially abundant populations between groups.
RNA preparation and sequencing
RNA was extracted from 2 × 10⁵ PBMCs from selected samples with sufficient material to allow assessment of multiple endpoints using the ISOLATE II RNA Mini Kit (Bioline) following the manufacturer’s instructions, with the final elution step repeated once and RNA eluted into 40 μl total RNase‐free water. RNA was quantified with RNA Screen Tape on the Agilent TapeStation 2200 System. Libraries were prepared with either 50 ng or 25 ng total RNA using the Illumina TruSeq RNA Library Prep Kit (< 100 ng) following manufacturers’ instructions. Products were checked for size using D1000 ScreenTape on the Agilent TapeStation 2200 system, pooled in equimolar amounts, and submitted for sequencing by paired‐end, 80 base pair reads on an Illumina NextSeq 500 platform.
Transcriptional analysis
Raw sequence reads in FASTQ file format were aligned to the human reference genome GRCh38/hg38 using the align() function in Bioconductor package Rsubread version 2.0.1 with default parameters (Liao et al, 2013, 2019). Fragments of aligned sequences overlapping NCBI RefSeq human genes (build 38.2) were quantified with featureCounts (Liao et al, 2014) with the Rsubread inbuilt annotation used in the quantification. Genes with no symbols, sex‐linked genes, and immunoglobulin genes were filtered out from the analysis. Hemoglobin genes were found to be highly variable and were also filtered from the analysis. Genes with 0.5 counts per million (CPM) or higher in fewer than five samples were determined as unexpressed and filtered out, leaving 15,371 genes for differential expression analysis. Counts were transformed to log2‐CPM (logCPM), precision weighted, and quantile normalized using the voom() function (Law et al, 2014) in the Bioconductor package limma version 3.46.0 (Ritchie et al, 2015). The logCPM values were then converted to fragments per kilobase of exons per million mapped reads at the log2 scale (logFPKM). A linear model was fitted to each gene and differential expression was assessed using empirical Bayes moderated t‐statistics (Smyth, 2004). P‐values were adjusted to control the global FDR‐ across all comparisons using the “global” option of the decideTests function in the limma package. An FDR cut‐off of 15% was applied for calling differentially expressed genes. Preliminary analysis indicated that ~ 6 samples per group were adequate to observe good segregation of transcriptional profiles. Entrez Gene IDs for differentially expressed genes were entered into the goana() and kegga() functions (Young et al, 2010) in limma to determine overrepresentation of differentially expressed genes in Gene Ontology terms. Lists of differentially expressed genes between pairwise comparisons were also entered into Ingenuity Pathway Analysis (QIAGEN) software for canonical pathway and upstream regulator analysis. Cell‐type deconvolution was performed on log‐transformed and normalized counts using dtangle version 2.0.9 (Hunt et al, 2019) with default parameters and human hematopoietic cell RNA‐seq expression data as a reference data set (Choi et al, 2019). Differential enrichment of functional immune pathways was determined using the tmodLimmaTest() function in tmod version 0.46.2 (preprint: Weiner & Domaszewska, 2016) with blood transcription modules (Li et al, 2013) as gene sets, and the same contrasts as in the differential expression analysis. Heatmaps were created using pheatmap version 1.0.12. Correlations were visualized in R as either matrices, networks, or chord diagrams using corrplot version 0.92, corrr version 0.4.3, or circlize version 0.4.12 (Gu et al, 2014), respectively.
Mouse infections
Eight‐ to 12‐week‐old female mice were infected intravenously (i.v.) with 1 × 10⁵ P. chabaudi chabaudi AS. In some experiments, mice were treated intraperitoneally (i.p) with 100 µg of anti‐CTLA‐4 antibody (9H10) or isotype control (Syrian hamster serum, Biolegend) after resolution of peak parasitemia every 3 days. Parasitemia was assessed from Giemsa‐stained smears of tail blood. Mice were housed in individually ventilated cages. All experiments were performed in compliance with the Walter & Eliza Hall Institute Animal Ethics Committee requirements.
Flow cytometry
Human PBMCs were blocked with Human TruStain FcX (Biolegend) and stained with a cocktail of surface marker antibodies (Reagents and Tools table) in staining buffer (PBS with 1% HI‐FBS and 2 mM ethylenediaminetetraacetic acid [EDTA]) for 30 min on ice. After surface staining, cells were fixed and permeabilized using the FoxP3/Transcription Factor Staining Buffer Set (eBioscience) and then stained with PE Dazzle‐ anti‐CTLA‐4 (BNI3) and BB700‐anti‐FoxP3 (236/E7, BD Bioscience) antibodies for 45 min at room temperature. For mouse infection studies, splenocyte suspensions were incubated with anti‐CD16/CD32 antibody in staining buffer. Cells were washed and incubated with a cocktail of surface marker antibodies (Reagents and Tools table) for 30 min at 4°C. Secondary streptavidin conjugates were added for 30 min at 4°C following sample washes. After surface staining, cells were stained with surface markers and then fixed/permeabilized using the Foxp3/Transcription Factor Staining Buffer Set (eBioscience, CA) following the manufacturer’s protocol. Antibodies to FoxP3 (MF‐14) and CTLA‐4 (UC10‐4B9) were then added for 45 min at room temperature (all antibodies are from Biolegend unless otherwise indicated in the Reagents and Tools table). In all experiments, dead cells were excluded by staining with Fixable Viability Dye efluor‐506 (eBioscience, CA) and acquired using a BD LSR Fortessa X20 (eBioscience, CA). Analysis was performed using FlowJo version 10 (BD Biosciences). Cell populations were selected and exported for further analysis in Cytobank (Kotecha et al, 2010).
Statistical analysis
Characteristics of clinical groups were compared using one‐way ANOVA with Tukey’s multiple comparisons for continuous data that were normally distributed, and the Kruskal–Wallis test for data that did not follow normal distribution. The Mann–Whitney test was used to compare paired data and the Chi‐squared test for nominal data. Logistic regression models were fitted for pairwise comparisons between groups to determine the odds ratio for antibody titers and cell populations. Hierarchical clustering heatmaps were calculated using the complete method and Euclidian distance matrix using the pheatmap package version 1.0.12 in R. Linear regression models and differential abundance of cell populations were assessed using limma and a robust empirical Bayes procedure (Phipson et al, 2016). When performing differential expression analysis, a 15% FDR was considered significant. The FDR was otherwise controlled to below 5% using the method of Benjamini and Hochberg. Correlations were determined using Spearman’s rank correlation coefficient in the psych package version 2.1.9 in R. Statistical analyses were performed in GraphPad Prism version 8 and R versions 4.0.3‐4.1.2.
Author contributions
Stephanie I Studniberg: Formal analysis; Validation; Investigation; Visualization; Methodology; Writing—original draft; Project administration; Writing—review and editing. Lisa J Ioannidis: Formal analysis; Investigation; Methodology; Writing—original draft; Project administration. Retno A S Utami: Formal analysis; Investigation. Leily Trianty: Formal analysis; Investigation. Yang Liao: Formal analysis. Waruni Abeysekera: Formal analysis. Connie S N Li‐Wai‐Suen: Formal analysis. Halina M Pietrzak: Investigation; Methodology. Jullie Healer: Supervision; Methodology. Agatha M Puspitasari: Investigation. Dwi Apriyanti: Investigation. Farah Coutrier: Investigation. Jean R Poespoprodjo: Resources; Supervision; Project administration. Enny Kenangalem: Resources; Project administration. Benediktus Andries: Resources; Project administration. Pak Prayoga: Resources. Novita Sariyanti: Resources; Project administration. Gordon K Smyth: Supervision. Alan F Cowman: Supervision. Ric N Price: Supervision; Project administration. Rintis Noviyanti: Conceptualization; Resources; Supervision; Investigation; Project administration. Wei Shi: Resources; Software; Formal analysis; Supervision; Investigation; Methodology. Alexandra L Garnham: Software; Formal analysis; Supervision; Investigation; Visualization; Methodology. Diana S Hansen: Conceptualization; Formal analysis; Supervision; Funding acquisition; Investigation; Methodology; Writing—original draft; Project administration; Writing—review and editing.
In addition to the CRediT author contributions listed above, the contributions in detail are:
SIS, LJI, and DSH conceived and designed the study. AMP, DA, FC, JRP, EK, BA, PP, NS, LT, RNP, and RN conducted the field sample collection. SIS, LJI, HMP, and RASU performed the experiments. JH and AFC provided reagents. SIS, LJI, RASU, YL, WA, CSNL‐W‐S, GKS, and DSH performed the analysis. SIS, LJI, and DSH wrote the manuscript. WS, ALG, and DSH supervised the study.
Disclosure and competing interests statement
The authors declare that they have no conflict of interest.
Supporting information
Expanded View Figures PDF
Acknowledgements
This work was performed in part at the Materials Characterisation and Fabrication Platform (MCFP) at the University of Melbourne and the Victorian Node of the Australian National Fabrication Facility (ANFF). Supported by the Australian Government National Health and Medical Research Council (NHMRC) Independent Medical Research Institutes Infrastructure Support Scheme and Project Grants 1058665 and 1137989; the Australian Academy of Science (DSH), the Victorian State Government Operational Infrastructure Support, and the Ministry of Research and Technology of the Republic of Indonesia. GKS was supported by NHMRC Fellowship 1154970.
Mol Syst Biol. (2022) 18: e10824
Data availability
Processed bulk RNA‐seq data generated for this study are available as GEO series GSE181179 (https://www.ncbi.nlm.nih.gov/geo/query/acc.cgi?acc=GSE181179). Raw data are available upon request, subject to approval by the Walter and Eliza Hall Institutional Data Access Committee (dataaccess@wehi.edu.au) to ensure preservation of patient confidentiality.
References
- Al‐Yaman F, Genton B, Reeder JC, Anders RF, Smith T, Alpers MP (1997) Reduced risk of clinical malaria in children infected with multiple clones of Plasmodium falciparum in a highly endemic area: a prospective community study. Trans R Soc Trop Med Hyg 91: 602–605 [DOI] [PubMed] [Google Scholar]
- Amir ED, Davis KL, Tadmor MD, Simonds EF, Levine JH, Bendall SC, Shenfeld DK, Krishnaswamy S, Nolan GP, Pe'er D (2013) viSNE enables visualization of high dimensional single‐cell data and reveals phenotypic heterogeneity of leukemia. Nat Biotechnol 31: 545–552 [DOI] [PMC free article] [PubMed] [Google Scholar]
- Andrade CM, Fleckenstein H, Thomson‐Luque R, Doumbo S, Lima NF, Anderson C, Hibbert J, Hopp CS, Tran TM, Li S et al (2020) Increased circulation time of Plasmodium falciparum underlies persistent asymptomatic infection in the dry season. Nat Med 26: 1929–1940 [DOI] [PubMed] [Google Scholar]
- Arama C, Skinner J, Doumtabe D, Portugal S, Tran TM, Jain A, Traore B, Doumbo OK, Davies DH, Troye‐Blomberg M et al (2015) Genetic resistance to malaria is associated with greater enhancement of immunoglobulin (Ig)M than IgG responses to a broad array of Plasmodium falciparum antigens. Open Forum Infect Dis 2: ofv118 [DOI] [PMC free article] [PubMed] [Google Scholar]
- Baumann S, Hess J, Eichhorst ST, Krueger A, Angel P, Krammer PH, Kirchhoff S (2003) An unexpected role for FosB in activation‐induced cell death of T cells. Oncogene 22: 1333–1339 [DOI] [PubMed] [Google Scholar]
- Bediako Y, Adams R, Reid AJ, Valletta JJ, Ndungu FM, Sodenkamp J, Mwacharo J, Ngoi JM, Kimani D, Kai O et al (2019) Repeated clinical malaria episodes are associated with modification of the immune system in children. BMC Med 17: 60 [DOI] [PMC free article] [PubMed] [Google Scholar]
- Bereczky S, Liljander A, Rooth I, Faraja L, Granath F, Montgomery SM, Farnert A (2007) Multiclonal asymptomatic Plasmodium falciparum infections predict a reduced risk of malaria disease in a Tanzanian population. Microbes Infect 9: 103–110 [DOI] [PubMed] [Google Scholar]
- Blackman MJ, Heidrich HG, Donachie S, McBride JS, Holder AA (1990) A single fragment of a malaria merozoite surface protein remains on the parasite during red cell invasion and is the target of invasion‐inhibiting antibodies. J Exp Med 172: 379–382 [DOI] [PMC free article] [PubMed] [Google Scholar]
- Boldt ABW, van Tong H, Grobusch MP, Kalmbach Y, Dzeing Ella A, Kombila M, Meyer CG, Kun JFJ, Kremsner PG, Velavan TP (2019) The blood transcriptome of childhood malaria. EBioMedicine 40: 614–625 [DOI] [PMC free article] [PubMed] [Google Scholar]
- Bousema JT, Gouagna LC, Drakeley CJ, Meutstege AM, Okech BA, Akim IN, Beier JC, Githure JI, Sauerwein RW (2004) Plasmodium falciparum gametocyte carriage in asymptomatic children in western Kenya. Malar J 3: 18 [DOI] [PMC free article] [PubMed] [Google Scholar]
- Boyle MJ, Chan JA, Handayuni I, Reiling L, Feng G, Hilton A, Kurtovic L, Oyong D, Piera KA, Barber BE et al (2019) IgM in human immunity to Plasmodium falciparum malaria. Sci Adv 5: eaax4489 [DOI] [PMC free article] [PubMed] [Google Scholar]
- Bruggner RV, Bodenmiller B, Dill DL, Tibshirani RJ, Nolan GP (2014) Automated identification of stratifying signatures in cellular subpopulations. Proc Natl Acad Sci USA 111: E2770–E2777 [DOI] [PMC free article] [PubMed] [Google Scholar]
- Ceesay SJ, Casals‐Pascual C, Erskine J, Anya SE, Duah NO, Fulford AJC, Sesay SSS, Abubakar I, Dunyo S, Sey O et al (2008) Changes in malaria indices between 1999 and 2007 in The Gambia: a retrospective analysis. Lancet 372: 1545–1554 [DOI] [PMC free article] [PubMed] [Google Scholar]
- Chang C, Loo CS, Zhao X, Solt LA, Liang Y, Bapat SP, Cho H, Kamenecka TM, Leblanc M, Atkins AR et al (2019) The nuclear receptor REV‐ERBalpha modulates Th17 cell‐mediated autoimmune disease. Proc Natl Acad Sci USA 116: 18528–18536 [DOI] [PMC free article] [PubMed] [Google Scholar]
- Chen I, Clarke SE, Gosling R, Hamainza B, Killeen G, Magill A, O'Meara W, Price RN, Riley EM (2016) "Asymptomatic" malaria: a chronic and debilitating infection that should be treated. PLoS Medicine 13: e1001942 [DOI] [PMC free article] [PubMed] [Google Scholar]
- Choi J, Baldwin TM, Wong M, Bolden JE, Fairfax KA, Lucas EC, Cole R, Biben C, Morgan C, Ramsay KA et al (2019) Haemopedia RNA‐seq: a database of gene expression during haematopoiesis in mice and humans. Nucleic Acids Res 47: D780–D785 [DOI] [PMC free article] [PubMed] [Google Scholar]
- Cowman AF, Crabb BS (2006) Invasion of red blood cells by malaria parasites. Cell 124: 755–766 [DOI] [PubMed] [Google Scholar]
- Crotty S (2014) T follicular helper cell differentiation, function, and roles in disease. Immunity 41: 529–542 [DOI] [PMC free article] [PubMed] [Google Scholar]
- Doumbo S, Tran TM, Sangala J, Li S, Doumtabe D, Kone Y, Traoré A, Bathily A, Sogoba N, Coulibaly ME et al (2014) Co‐infection of long‐term carriers of Plasmodium falciparum with Schistosoma haematobium enhances protection from febrile malaria: a prospective cohort study in Mali. PLoS Negl Trop Dis 8: e3154 [DOI] [PMC free article] [PubMed] [Google Scholar]
- Finck R, Simonds EF, Jager A, Krishnaswamy S, Sachs K, Fantl W, Pe'er D, Nolan GP, Bendall SC (2013) Normalization of mass cytometry data with bead standards. Cytometry A 83: 483–494 [DOI] [PMC free article] [PubMed] [Google Scholar]
- Fruh K, Doumbo O, Muller HM, Koita O, McBride J, Crisanti A, Toure Y, Bujard H (1991) Human antibody response to the major merozoite surface antigen of Plasmodium falciparum is strain specific and short‐lived. Infect Immun 59: 1319–1324 [DOI] [PMC free article] [PubMed] [Google Scholar]
- Goncalves‐Lopes RM, Lima NF, Carvalho KI, Scopel KK, Kallas EG, Ferreira MU (2016) Surface expression of inhibitory (CTLA‐4) and stimulatory (OX40) receptors by CD4+ regulatory T cell subsets circulating in human malaria. Microbes Infect 18: 639–648 [DOI] [PMC free article] [PubMed] [Google Scholar]
- Gu Z, Gu L, Eils R, Schlesner M, Brors B (2014) circlize Implements and enhances circular visualization in R. Bioinformatics 30: 2811–2812 [DOI] [PubMed] [Google Scholar]
- Hafalla JC, Claser C, Couper KN, Grau GE, Renia L, de Souza JB, Riley EM (2012) The CTLA‐4 and PD‐1/PD‐L1 inhibitory pathways independently regulate host resistance to Plasmodium‐induced acute immune pathology. PLoS Pathog 8: e1002504 [DOI] [PMC free article] [PubMed] [Google Scholar]
- Haque A, Best SE, Amante FH, Mustafah S, Desbarrieres L, de Labastida F, Sparwasser T, Hill GR, Engwerda CR (2010) CD4+ natural regulatory T cells prevent experimental cerebral malaria via CTLA‐4 when expanded in vivo. PLoS Pathog 6: e1001221 [DOI] [PMC free article] [PubMed] [Google Scholar]
- Hill DL, Eriksson EM, Suen CSNLW, Chiu CY, Ryg‐Cornejo V, Robinson LJ, Siba PM, Mueller I, Hansen DS, Schofield L (2013) Opsonising antibodies to P. falciparum merozoites associated with immunity to clinical malaria. PLoS One 8: e74627 [DOI] [PMC free article] [PubMed] [Google Scholar]
- Hunt GJ, Freytag S, Bahlo M, Gagnon‐Bartsch JA (2019) dtangle: accurate and robust cell type deconvolution. Bioinformatics 35: 2093–2099 [DOI] [PubMed] [Google Scholar]
- Ishizuka AS, Lyke KE, DeZure A, Berry AA, Richie TL, Mendoza FH, Enama ME, Gordon IJ, Chang LJ, Sarwar UN et al (2016) Protection against malaria at 1 year and immune correlates following PfSPZ vaccination. Nat Med 22: 614–623 [DOI] [PMC free article] [PubMed] [Google Scholar]
- Ioannidis LJ, Pietrzak HM, Ly A, Utami RAS, Eriksson EM, Studniberg SI, Abeysekera W, Li‐Wai‐Suen CSN, Sheerin D, Healer J et al (2021) High‐dimensional mass cytometry identifies T cell and B cell signatures predicting reduced risk of Plasmodium vivax malaria. JCI Insight 6: e148086 [DOI] [PMC free article] [PubMed] [Google Scholar]
- Jacobs T, Graefe SE, Niknafs S, Gaworski I, Fleischer B (2002) Murine malaria is exacerbated by CTLA‐4 blockade. J Immunol 169: 2323–2329 [DOI] [PubMed] [Google Scholar]
- Jongo SA, Church LWP, Mtoro AT, Chakravarty S, Ruben AJ, Swanson PA, Kassim KR, Mpina M, Tumbo AM, Milando FA et al (2019) Safety and differential antibody and T‐cell responses to the Plasmodium falciparum sporozoite malaria vaccine, PfSPZ vaccine, by age in Tanzanian adults, adolescents, children, and infants. Am J Trop Med Hyg 100: 1433–1444 [DOI] [PMC free article] [PubMed] [Google Scholar]
- Karyana M, Burdarm L, Yeung S, Kenangalem E, Wariker N, Maristela R, Umana KG, Vemuri R, Okoseray MJ, Penttinen PM et al (2008) Malaria morbidity in Papua Indonesia, an area with multidrug resistant Plasmodium vivax and Plasmodium falciparum . Malar J 7: 148 [DOI] [PMC free article] [PubMed] [Google Scholar]
- Kinyanjui SM, Mwangi T, Bull PC, Newbold CI, Marsh K (2004) Protection against clinical malaria by heterologous immunoglobulin G antibodies against malaria‐infected erythrocyte variant surface antigens requires interaction with asymptomatic infections. J Infect Dis 190: 1527–1533 [DOI] [PubMed] [Google Scholar]
- Kinyanjui SM, Conway DJ, Lanar DE, Marsh K (2007) IgG antibody responses to Plasmodium falciparum merozoite antigens in Kenyan children have a short half‐life. Malar J 6: 82 [DOI] [PMC free article] [PubMed] [Google Scholar]
- Knudsen NH, Stanya KJ, Hyde AL, Chalom MM, Alexander RK, Liou Y‐H, Starost KA, Gangl MR, Jacobi D, Liu S et al (2020) Interleukin‐13 drives metabolic conditioning of muscle to endurance exercise. Science 368: eaat3987 [DOI] [PMC free article] [PubMed] [Google Scholar]
- Kotecha N, Krutzik PO, Irish JM (2010) Web‐based analysis and publication of flow cytometry experiments. Curr Protoc Cytom Chapter 10: Unit10 17 [DOI] [PMC free article] [PubMed] [Google Scholar]
- Krishnamurty AT, Thouvenel CD, Portugal S, Keitany GJ, Kim KS, Holder A, Crompton PD, Rawlings DJ, Pepper M (2016) Somatically hypermutated Plasmodium‐Specific IgM+ memory B cells are rapid, plastic, early responders upon malaria rechallenge. Immunity 45: 402–414 [DOI] [PMC free article] [PubMed] [Google Scholar]
- Kurup SP, Obeng‐Adjei N, Anthony SM, Traore B, Doumbo OK, Butler NS, Crompton PD, Harty JT (2017) Regulatory T cells impede acute and long‐term immunity to blood‐stage malaria through CTLA‐4. Nat Med 23: 1220–1225 [DOI] [PMC free article] [PubMed] [Google Scholar]
- Law CW, Chen Y, Shi W, Smyth GK (2014) voom: precision weights unlock linear model analysis tools for RNA‐seq read counts. Genome Biol 15: R29 [DOI] [PMC free article] [PubMed] [Google Scholar]
- Lee HJ, Georgiadou A, Walther M, Nwakanma D, Stewart LB, Levin M, Otto TD, Conway DJ, Coin LJ, Cunnington AJ (2018) Integrated pathogen load and dual transcriptome analysis of systemic host‐pathogen interactions in severe malaria. Sci Transl Med 10: eaar3619 [DOI] [PMC free article] [PubMed] [Google Scholar]
- Lepenies B, Gaworski I, Tartz S, Langhorne J, Fleischer B, Jacobs T (2007) CTLA‐4 blockade differentially influences the outcome of non‐lethal and lethal Plasmodium yoelii infections. Microbes Infect 9: 687–694 [DOI] [PubMed] [Google Scholar]
- Li S, Rouphael N, Duraisingham S, Romero‐Steiner S, Presnell S, Davis C, Schmidt DS, Johnson SE, Milton A, Rajam G et al (2013) Molecular signatures of antibody responses derived from a systems biology study of five human vaccines. Nat Immunol 15: 195 [DOI] [PMC free article] [PubMed] [Google Scholar]
- Liao Y, Smyth GK, Shi W (2013) The Subread aligner: fast, accurate and scalable read mapping by seed‐and‐vote. Nucleic Acids Res 41: e108 [DOI] [PMC free article] [PubMed] [Google Scholar]
- Liao Y, Smyth GK, Shi W (2014) featureCounts: an efficient general purpose program for assigning sequence reads to genomic features. Bioinformatics 30: 923–930 [DOI] [PubMed] [Google Scholar]
- Liao Y, Smyth GK, Shi W (2019) The R package Rsubread is easier, faster, cheaper and better for alignment and quantification of RNA sequencing reads. Nucleic Acids Res 47: e47 [DOI] [PMC free article] [PubMed] [Google Scholar]
- Liu H, Zhu Y, Gao Y, Qi D, Zhao L, Zhao L, Liu C, Tao T, Zhou C, Sun X et al (2020) NR1D1 modulates synovial inflammation and bone destruction in rheumatoid arthritis. Cell Death Dis 11: 129 [DOI] [PMC free article] [PubMed] [Google Scholar]
- Ly A, Liao Y, Pietrzak H, Ioannidis LJ, Sidwell T, Gloury R, Doerflinger M, Triglia T, Qin RZ, Groom JR et al (2019) Transcription factor T‐bet in B cells modulates germinal center polarization and antibody affinity maturation in response to malaria. Cell Rep 29: 2257–2269 [DOI] [PubMed] [Google Scholar]
- Mackroth MS, Abel A, Steeg C, Schulze Zur Wiesch J, Jacobs T (2016) Acute malaria induces PD1+CTLA4+ effector T cells with cell‐extrinsic suppressor function. PLoS Pathog 12: e1005909 [DOI] [PMC free article] [PubMed] [Google Scholar]
- Miller LH, Baruch DI, Marsh K, Doumbo OK (2002) The pathogenic basis of malaria. Nature 415: 673–679 [DOI] [PubMed] [Google Scholar]
- Molyneux ME, Engelmann H, Taylor TE, Wirima JJ, Aderka D, Wallach D, Grau GE (1993) Circulating plasma receptors for tumour necrosis factor in Malawian children with severe falciparum malaria. Cytokine 5: 604–609 [DOI] [PubMed] [Google Scholar]
- Nallandhighal S, Park GS, Ho YY, Opoka RO, John CC, Tran TM (2019) Whole‐blood transcriptional signatures composed of erythropoietic and NRF2‐regulated genes differ between cerebral malaria and severe malarial anemia. J Infect Dis 219: 154–164 [DOI] [PMC free article] [PubMed] [Google Scholar]
- Obeng‐Adjei N, Portugal S, Tran T, Yazew T, Skinner J, Li S, Jain A, Felgner P, Doumbo O, Kayentao K et al (2015) Circulating Th1‐Cell‐type Tfh cells that exhibit impaired B cell help are preferentially activated during acute malaria in children. Cell Rep 13: 425–439 [DOI] [PMC free article] [PubMed] [Google Scholar]
- Obeng‐Adjei N, Portugal S, Holla P, Li S, Sohn H, Ambegaonkar A, Skinner J, Bowyer G, Doumbo OK, Traore B et al (2017) Malaria‐induced interferon‐γ drives the expansion of Tbethi atypical memory B cells. PLoS Pathog 13: e1006576 [DOI] [PMC free article] [PubMed] [Google Scholar]
- Phipson B, Lee S, Majewski IJ, Alexander WS, Smyth GK (2016) Robust hyperparameter estimation protects against hypervariable genes and improves power to detect differential expression. Ann Appl Stat 10: 946–963 [DOI] [PMC free article] [PubMed] [Google Scholar]
- Pietrzak HM, Ioannidis LJ, Hansen DS (2020) IgM+ memory B cells induced in response to Plasmodium berghei adopt a germinal centre B cell phenotype during secondary infection. Parasitology 147: 994–998 [DOI] [PMC free article] [PubMed] [Google Scholar]
- Pongponratn E, Viriyavejakul P, Looareesuwan S, Hien TT, Phu NH, Turner GDH, Day NPJ, Simpson JA, Ferguson DJP, White NJ et al (2003) An ultrastructural study of the brain in fatal Plasmodium falciparum malaria. Am J Trop Med Hyg 69: 345–359 [PubMed] [Google Scholar]
- Portugal S, Tran TM, Ongoiba A, Bathily A, Li S, Doumbo S, Skinner J, Doumtabe D, Kone Y, Sangala J et al (2017) Treatment of chronic asymptomatic Plasmodium falciparum infection does not increase the risk of clinical malaria upon reinfection. Clin Infect Dis 64: 645–653 [DOI] [PMC free article] [PubMed] [Google Scholar]
- Quin JE, Bujila I, Chérif M, Sanou GS, Qu Y, Vafa Homann M, Rolicka A, Sirima SB, O'Connell MA, Lennartsson A et al (2017) Major transcriptional changes observed in the Fulani, an ethnic group less susceptible to malaria. eLife 6: e29156 [DOI] [PMC free article] [PubMed] [Google Scholar]
- R Core Team (2021) R: a language and environment for statistical computing, Vienna: R Foundation for Statistical Computing; [Google Scholar]
- Ritchie ME, Phipson B, Wu D, Hu Y, Law CW, Shi W, Smyth GK (2015) limma powers differential expression analyses for RNA‐sequencing and microarray studies. Nucleic Acids Res 43: e47 [DOI] [PMC free article] [PubMed] [Google Scholar]
- Rouault JP, Rimokh R, Tessa C, Paranhos G, Ffrench M, Duret L, Garoccio M, Germain D, Samarut J, Magaud JP (1992) BTG1, a member of a new family of antiproliferative genes. EMBO J 11: 1663–1670 [DOI] [PMC free article] [PubMed] [Google Scholar]
- Ryg‐Cornejo V, Ioannidis L, Ly A, Chiu C, Tellier J, Hill D, Preston S, Pellegrini M, Yu DI, Nutt S et al (2016) Severe malaria infections impair germinal center responses by inhibiting T follicular helper cell differentiation. Cell Rep 14: 68–81 [DOI] [PubMed] [Google Scholar]
- Safford M, Collins S, Lutz MA, Allen A, Huang C‐T, Kowalski J, Blackford A, Horton MR, Drake C, Schwartz RH et al (2005) Egr‐2 and Egr‐3 are negative regulators of T cell activation. Nat Immunol 6: 472–480 [DOI] [PubMed] [Google Scholar]
- Sattabongkot J, Suansomjit C, Nguitragool W, Sirichaisinthop J, Warit S, Tiensuwan M, Buates S (2018) Prevalence of asymptomatic Plasmodium infections with sub‐microscopic parasite densities in the northwestern border of Thailand: a potential threat to malaria elimination. Malar J 17: 329 [DOI] [PMC free article] [PubMed] [Google Scholar]
- Schneider P, Bousema JT, Gouagna LC, Otieno S, van de Vegte‐Bolmer M, Omar SA, Sauerwein RW (2007) Submicroscopic Plasmodium falciparum gametocyte densities frequently result in mosquito infection. Am J Trop Med Hyg 76: 470–474 [PubMed] [Google Scholar]
- Sécca C, Faget DV, Hanschke SC, Carneiro MS, Bonamino MH, de‐Araujo‐Souza PS, Viola JPB (2016) IRF2BP2 transcriptional repressor restrains naive CD4 T cell activation and clonal expansion induced by TCR triggering. J Leukoc Biol 100: 1081–1091 [DOI] [PMC free article] [PubMed] [Google Scholar]
- Seifert M, Przekopowitz M, Taudien S, Lollies A, Ronge V, Drees B, Lindemann M, Hillen U, Engler H, Singer BB et al (2015) Functional capacities of human IgM memory B cells in early inflammatory responses and secondary germinal center reactions. Proc Natl Acad Sci USA 112: E546–E555 [DOI] [PMC free article] [PubMed] [Google Scholar]
- Singh R, Miao T, Symonds ALJ, Omodho B, Li S, Wang P (2017) Egr2 and 3 inhibit T‐bet‐mediated IFN‐gamma production in T cells. J Immunol 198: 4394–4402 [DOI] [PMC free article] [PubMed] [Google Scholar]
- Sissoko MS, Healy SA, Katile A, Omaswa F, Zaidi I, Gabriel EE, Kamate B, Samake Y, Guindo MA, Dolo A et al (2017) Safety and efficacy of PfSPZ Vaccine against Plasmodium falciparum via direct venous inoculation in healthy malaria‐exposed adults in Mali: a randomised, double‐blind phase 1 trial. Lancet Infect Dis 17: 498–509 [DOI] [PMC free article] [PubMed] [Google Scholar]
- Smithson P, Florey L, Salgado SR, Hershey CL, Masanja H, Bhattarai A, Mwita A, McElroy PD, Tanzania Malaria Impact Evaluation Research Group (2015) Impact of malaria control on mortality and anemia among Tanzanian children less than five years of age, 1999–2010. PLoS One 10: e0141112 [DOI] [PMC free article] [PubMed] [Google Scholar]
- Smyth GK (2004) Linear models and empirical bayes methods for assessing differential expression in microarray experiments. Stat Appl Genet Mol Biol 3: Article3 [DOI] [PubMed] [Google Scholar]
- Snounou G, Viriyakosol S, Zhu XP, Jarra W, Pinheiro L, do Rosario VE, Thaithong S, Brown KN (1993) High sensitivity of detection of human malaria parasites by the use of nested polymerase chain reaction. Mol Biochem Parasitol 61: 315–320 [DOI] [PubMed] [Google Scholar]
- Tran TM, Jones MB, Ongoiba A, Bijker EM, Schats R, Venepally P, Skinner J, Doumbo S, Quinten E, Visser LG et al (2016) Transcriptomic evidence for modulation of host inflammatory responses during febrile Plasmodium falciparum malaria. Sci Rep 6: 31291 [DOI] [PMC free article] [PubMed] [Google Scholar]
- Tran TM, Guha R, Portugal S, Skinner J, Ongoiba A, Bhardwaj J, Jones M, Moebius J, Venepally P, Doumbo S et al (2019) A molecular signature in blood reveals a role for p53 in regulating malaria‐induced inflammation. Immunity 51: 750–765 [DOI] [PMC free article] [PubMed] [Google Scholar]
- Trischler J, Shiomi T, Turner DL, Sklepkiewicz PL, Goldklang MP, Tanaka KF, Xu M, Farber DL, D'Armiento JM (2016) Immune modulation of the T cell response in asthma through Wnt10b. Am J Respir Cell Mol Biol 54: 584–593 [DOI] [PMC free article] [PubMed] [Google Scholar]
- Van Gassen S, Callebaut B, Van Helden MJ, Lambrecht BN, Demeester P, Dhaene T, Saeys Y (2015) FlowSOM: Using self‐organizing maps for visualization and interpretation of cytometry data. Cytometry A 87: 636–645 [DOI] [PubMed] [Google Scholar]
- Vinuesa CG, Tangye SG, Moser B, Mackay CR (2005) Follicular B helper T cells in antibody responses and autoimmunity. Nat Rev Immunol 5: 853–865 [DOI] [PubMed] [Google Scholar]
- Weiner J 3rd, & Domaszewska T (2016) tmod: an R package for general and multivariate enrichment analysis. PeerJ Preprints 4: e2420v1 [PREPRINT] [Google Scholar]
- Weiss GE, Traore B, Kayentao K, Ongoiba A, Doumbo S, Doumtabe D, Kone Y, Dia S, Guindo A, Traore A et al (2010) The Plasmodium falciparum‐specific human memory B cell compartment expands gradually with repeated malaria infections. PLoS Pathog 6: e1000912 [DOI] [PMC free article] [PubMed] [Google Scholar]
- Wendel BS, He C, Qu M, Wu DI, Hernandez SM, Ma K‐Y, Liu EW, Xiao J, Crompton PD, Pierce SK et al (2017) Accurate immune repertoire sequencing reveals malaria infection driven antibody lineage diversification in young children. Nat Commun 8: 531 [DOI] [PMC free article] [PubMed] [Google Scholar]
- White NJ, Ho M (1992) The pathophysiology of malaria. Adv Parasitol 31: 83–173 [DOI] [PubMed] [Google Scholar]
- Wilson NO, Jain V, Roberts CE, Lucchi N, Joel PK, Singh MP, Nagpal AC, Dash AP, Udhayakumar V, Singh N et al (2011) CXCL4 and CXCL10 predict risk of fatal cerebral malaria. Dis Markers 30: 39–49 [DOI] [PMC free article] [PubMed] [Google Scholar]
- World Health Organization (2021) World malaria report 2021. Geneva: World Health Organization; [Google Scholar]
- Young MD, Wakefield MJ, Smyth GK, Oshlack A (2010) Gene ontology analysis for RNA‐seq: accounting for selection bias. Genome Biol 11: R14 [DOI] [PMC free article] [PubMed] [Google Scholar]