Abstract
Indole-3-acetic acid (IAA) and salicylic acid (SA) are two important phytohormones. In this work, for the first time, a ratiometric electrochemical sensor was developed for quantifying IAA and SA simultaneously. A composite of multi wall carbon nanotubes (MWNT) and carbon black (CB) was used to enhance the sensitivity of electrochemical detection. Ferrocene (Fc) was used as the reference molecule to offer a built-in correction to improve the accuracy. A good linearity was constructed between the IIAA/IFc and the concentration of IAA from 25 μM to 1000 μM. The linear equation was y = 0.00159x + 0.124 (R2 = 0.9887). The LOD for IAA was 1.99 μM. Meanwhile, the ISA/IFc gradually increased with increasing concentration of SA. The linear regression equation for SA was y = 0.00107x + 0.34465 (R2 = 0.9488) with the LOD of 3.30 μM. Thus, the as-prepared multifunctional ratiometric electrochemical sensor was successfully applied to detect IAA and SA at the same time. This sensor was also successfully used to detect IAA and SA in the homogenates of soybean seedlings under salt stress, confirming the practical applicability of the sensor. And the obtained results agreed well with those obtained by the ultra performance liquid chromatography-mass spectrometry (UPLC-MS) method.
For the first time, a multifunctional ratiometric electrochemical sensor was developed for quantifying IAA and SA simultaneously.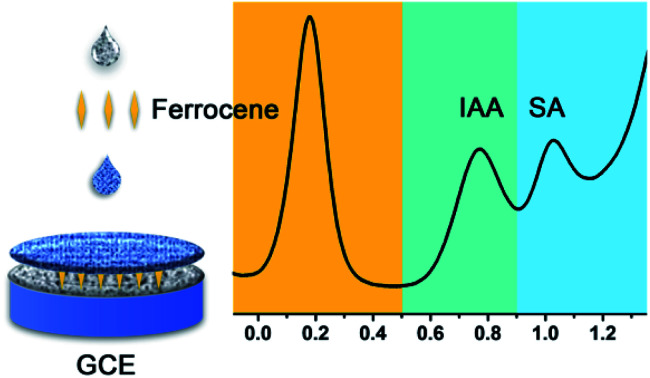
1. Introduction
Phytohormones are small organic molecules produced in plants. They play an important role in regulating the growth and development of plants. Indole-3-acetic acid (IAA) and salicylic acid (SA) are two important phytohormones (Scheme 1). IAA mainly regulates gene expression, cell division, plant growth, flowering, withering, and so on.1–3 And there is evidence that IAA is involved in a plant's response and adaptation to stress.4,5 SA plays an important role in regulating plant seed germination, membrane permeability, defense responses, flowering, heat production, etc.6 When plants encounter external stresses, the level of many phytohormones will change accordingly, thus causing a response to the external environment. Accumulating evidence suggests that IAA and SA are often involved in the same biological process in plants.7–9 For example, SA can inhibit plant growth by suppressing the signal of IAA.9 Therefore, simultaneous detection of IAA and SA may improve our understanding of a plant's physiological regulation mechanism.
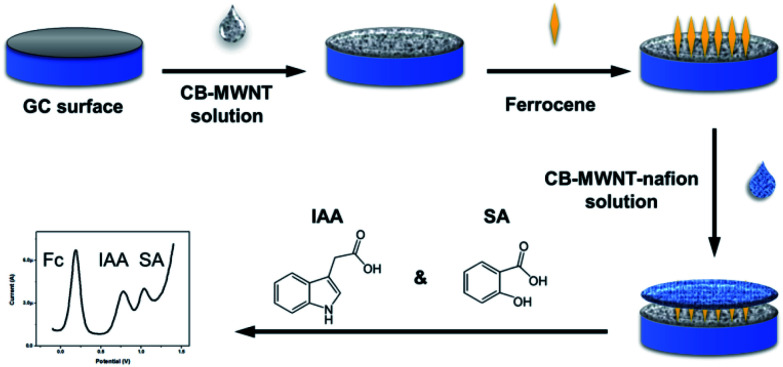
Scheme 1. Schematic illustration of the fabrication process for the ratiometric electrochemical sensor of IAA and SA.
Many technologies can be used for determining phytohormones, such as capillary gas chromatographic (GC),10 capillary electrophoresis (CE),11 radioimmunoassay,12 high performance liquid chromatography (HPLC),13 fluorescence spectrometry14,15 and enzyme linked immunosorbent assay (ELISA), etc. However, these methods often require expensive apparatus or lengthy proceeding. Electrochemical sensors have aroused extensive interest due to their high sensitivity, good selectivity, fast response, good portability, and low cost, etc. Various electrochemical sensors have been developed for the detection of IAA16–18 or SA19–21 alone. However, up to our knowledge, few works has been done on the simultaneous detection of IAA and SA using electrochemical methods.16
Recently, a great deal of research has been done on the development of ratiometric electrochemical sensors. Different from the conventional single signal electrochemical sensors, ratiometric electrochemical sensors introduce an independent redox probe which can offer a built-in correction for the analyte's signal. The ratio of the two signals is used to replace the absolute value of signal of analyte as the output signal, thus the reproducibility and robustness of the sensor can be remarkably enhanced. Nowadays, ratiometric electrochemical sensors have been developed for a varieties of biomolecules including nucleic acid,22,23 biological small molecule,24,25 protein,26,27 and metal ions,28,29etc. But most ratiometric electrochemical sensors only can detect one analyte. Only a very few works have been shown that two analytes can be detected simultaneously using ratiometric electrochemical sensors, such as copper ion and l-cysteine,29 glucose and pH,30etc. Therefore, the multifunctional ratiometric electrochemical sensor for dual biochemical analysis is still a great challenge.
In this paper, a multifunctional ratiometric electrochemical sensor was fabricated for detecting IAA and SA simultaneously. As shown in the Scheme 1, first, we used a layer of composite of multi wall carbon nanotubes (MWNT) and carbon black (CB) to enhance the sensitivity of sensor. MWNT have been widely used in many biosensors due to its unique properties, such as high specific surface areas, excellent electrical conductivity and chemical stability, etc. With the aim of producing a low-cost, practical sensor, carbon black (CB) was also used to form a CB–MWNT composite due to its high surface to area ratio, good conductivity, and low cost. Second, a layer of ferrocene (Fc) was modified on the electrode, which was used as the reference molecule. Third, a layer of CB–MWNT–Nafion was modified on the electrode, which used to improve the sensitivity of electrochemical detection further and avoid the interference of other molecules. The as-prepared ratiometric sensor is accurate and selective for IAA and SA detection. As far as we know, this is the first work for detecting IAA and SA simultaneously using ratiometric electrochemical sensor. The developed sensor was applied to determine the levels of IAA and SA in the soybean seedlings under different salt treatment, confirming the practical applicability of the ratiometric sensor.
2. Experimental
2.1. Chemicals and materials
Salicylic acid (SA), ascorbic acid, indole acetic acid (IAA), methyl jasmonate, succinic acid, citric acid, abscisic acid, and Nafion (5 wt%) were supplied by Sigma-Aldrich Co. LLC. (St. Louis, MO, US). The multiwalled carbon nanotube (MWNT) was bought from Nanjing XFNANO Materials Tech Co. Ltd. (Jiangsu, China). VXC72R conductive carbon black (CB) was bought from Cabot Chemical (Tianjin) Co., Ltd. (Tianjin China). Ferrocene (Fc), chitosan (CS) and other chemicals were obtained from Beijing Chemical Works (Beijing, China).
2.2. Preparation of the ratiometric electrochemical sensor
Glassy carbon (GC) electrode (3 mm in diameter) was polished with 0.3 and 0.05 μm alumina powder in turn. It was ultrasonic cleaned in deionized water and ethanol, then dried under N2 atmosphere.
The MWNT was oxidized and shortened with H2SO4 and HNO3 (3 : 1) for 6 h. Then it was centrifuged and washed. CB and MWNT were dissolved in 1 ml 1% CS solution. The concentration of CB and MWNT were optimized. After ultrasonicating for 1 h, a stable black suspension of CB–MWNT was obtained. The cleaned GC electrode was firstly modified by dropping 5 μl CB–MWNT solutions. After dried in air, 5 μl 5 mg ml−1 Fc solution was dropped on the electrode and dried in the air. At last, another 5 μl CB–MWNT solution was dropped on the electrode, for the second layer of CB–MWNT, Nafion (0.5%) was added to improve the selectivity and stability of the sensor. The modified CB–MWNT–Nafion/Fc/CB–MWNT/GC electrode was used as the working electrode. CB–Nafion/Fc/CB/GC electrode and MWNT–Nafion/Fc/MWNT/GC electrode were also prepared for comparation.
2.3. Characterization
The surface morphology of the CB–MWNT–Nafion/Fc/CB–MWNT/GC electrode for the modification process was characterized by field emission scanning electron microscopy (FESEM; ZEISS Gemini SEM 500) equipped with an energy dispersive spectrometer (EDS) detector (Oxford X-Max Extreme). Glassy carbon sheets (5 mm in diameter, purchased from Shanghai Chenhua Instrument Co., Ltd.) were employed for the characterization.
2.4. Electrochemical experiments
A Ag/AgCl (3 M KCl) reference electrode, a platinum wire counter electrode and the modified working electrode was used for the electrochemical measurement, which was conducted on the electrochemical analyzer system (PGSTAT302N AUTOLAB). Differential pulse voltammetry (DPV) measurements was recorded from −0.1 V to 1.4 V. The DPV parameter includes step potential of 2 mV, scan rate of 20 mV s−1, and the modulation amplitude of 50 mV. 10 mM PBS (pH = 7.4) was used as the buffer solution for the electrochemical measurement.
2.5. Plant samples preparation
The seeds of soybean (ZH13) were bought from Beijing Kafry Technology Co., Ltd. The germinated seeds were incubated in half-strength Hoagland solution in an illuminating incubator for 10 days. Then the seedlings were divided into eight groups randomly (20 plants in each group) for salt stress experiment. Different concentrations of salts (0 and 100 mM NaCl) with different treatment time (0, 12, 24, 36 h) were used.
The stems of soybean seedlings were ground into homogenates with crystalline silica, then centrifuged for 10 min (10 000 rpm at 4 °C). The supernatant was collected and diluted with PBS (1 : 1 in volume) freshly for electrochemical measurements.
2.6. UPLC-MS measurements
The UPLC-MS measurements were done referring to our previous work.31,32 Briefly, the stems of soybean seedlings with different salt treatments were collected respectively. The samples were ground with liquid nitrogen. 100 mg ground sample was dispersed in 1 mL precooled methanol (80%) for extraction and stayed at 4 °C overnight. 1 ml CHCl3 was added into the extract. After that, it was vibrated for 4 min (900 rpm at 4 °C) and centrifuged for 5 min (12 000 rpm at 4 °C). The underlying liquid was collected and dried at room temperature. Before the UPLC-MS, the sample was dissolved with methanol and filtrated.
3. Results and discussion
3.1. Characterization of the modified electrodes
The catalytic performance of the four electrodes, bare GC electrode, CB–Nafion/Fc/CB/GC electrode, MWNT–Nafion/Fc/MWNT/GC electrode and CB–MWNT–Nafion/Fc/CB–MWNT/GC to SA and IAA was tested by DPV measurement. As shown in Fig. S1,† compared the four DPV curves, the bare GC electrode showed the weakest catalytic performance to SA and IAA. The catalytic ability of MWNT–Nafion/Fc/MWNT/GC electrode was better than CB–Nafion/Fc/CB/GC electrode. This may be due to the lower electrical conductivity of the CBs compared to MWNTs.33 The CB–MWNT–Nafion/Fc/CB–MWNT/GC electrode showed the best performance to SA and IAA, which may be due to the extended conjugated network between CBs and MWNTs, resulting a highly synergistic improvement in the electrical and electrochemical properties.34 So, the CB–MWNT–Nafion/Fc/CB–MWNT/GC electrode was used in the following experiments.
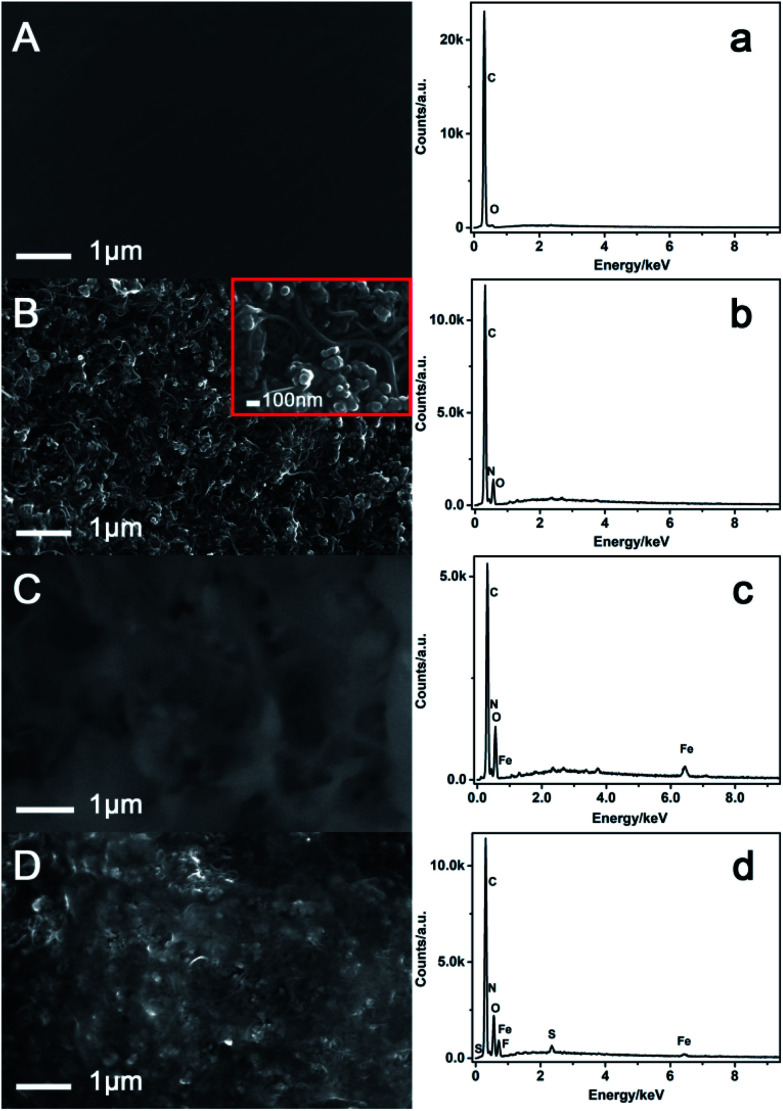
The morphology for the modification process of CB–MWNT–Nafion/Fc/CB–MWNT/GC was characterized by SEM using glassy carbon sheets as the substrate. The bare GC electrode surface is smooth (Fig. 1A). After modified the electrode with CB–MWNT layer, MWNT tubes and evenly distributed CB can be observed (Fig. 1B). MWNT shows homogeneous layer of randomly distributed strongly interlaced tubes. The diameter of the MWNT tubes is about 20–30 nm. The CBs are intercalated between the MWNT bundles. This uniform and interdigitated nanostructure provides a significant increase of effective area of the electrode. When Fc was cast on the CB–MWNT layer (Fig. 1C), the Fc molecules adsorbed on the surface of CB–MWNT layer. Because Fc was dissolved in methanol, which evaporated during the modification process, the whole modification layer on the electrode becomes denser and rougher. After modified the CB–MWNT–Nafion layer (Fig. 1D), the random distribution of MWNTs and CBs can also be observed on the electrode surface which showed that the MWNTs and CBs were homogeneously dispersed into the Nafion matrix. A membrane like substance forms on the surface of the modifier, suggesting the Nafion layer was formed on the electrode. So the addition of Nafion in the fabrication of the electrode can improve the stability of the sensor. SEM data confirms the changes in the electrode surface morphology and indicates the successful fabrication of the electrode. EDS was used to analyze the elements for each step of the modified electrode. For the bare electrode (Fig. 1a), only C and O elements can be observed. The appearance of C elements was due to that the glassy carbon sheets which were used as the substrate. The appearance of O elements may be ascribed to the absorption of O in the air. For the CB–MWNT/GC electrode (Fig. 1b), the elements of C, O and N are observed. CB and MWNT also have the C element. The oxidation treatment of MWNT can produce the O and N elements. This result confirms the modification of CB and MWNT. For the Fc/CB–MWNT/GC electrode (Fig. 1c), except for C, O, N, Fe element is observed, because there are Fe element in Fc molecules. This result confirms the modification of Fc layer on the electrode. For the CB–MWNT–Nafion/Fc/CB–MWNT/GC (Fig. 1d), except for C, O, N, Fe, F and S elements are observed, because there are F and S elements in Nafion. This result confirms the modification of CB–MWNT–Nafion layer on the electrode. The EDS results also confirm that the electrode was successfully fabricated.
Fig. 1. SEM (A–D) and EDS spectra (a–d) analysis of bare GC, CB–MWNT/GC, Fc/CB–MWNT/GC, CB–MWNT–Nafion/Fc/CB–MWNT/GC.
3.2. Feasibility of the CB–MWNT–Nafion/Fc/CB–MWNT/GC electrode for ratiometric detection of IAA and SA simultaneously
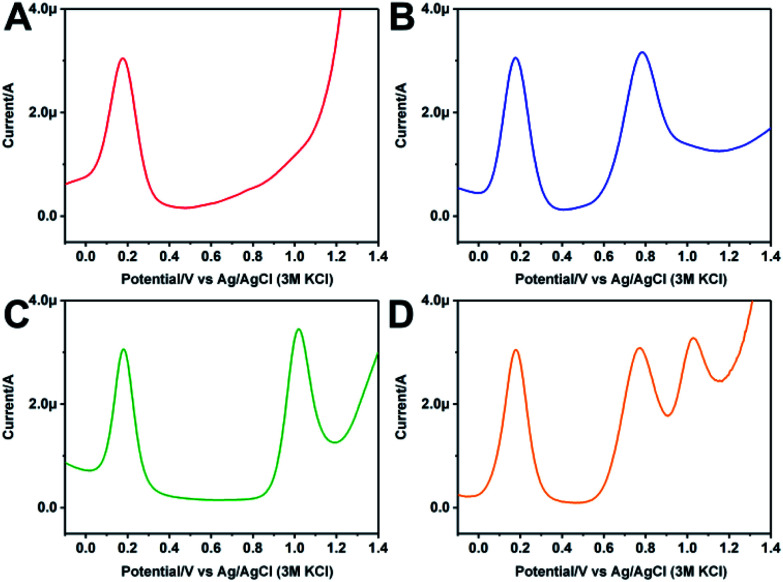
As for the multifunctional ratiometric electrochemical sensor, one important challenge is that the redox potential of the internal reference and the analytes should not disturb each other. Fig. 2A shows the DPV curve of the modified GC electrode in 10 mM PBS. An oxidation peak is observed at 0.15 V, which is ascribed to the Fc modification on the electrode. Fig. 2B shows the DPV curve of the modified electrode in 600 μM IAA. Except for the oxidation peak of Fc, a new oxidation peak appears at 0.75 V, which is due to the oxidation of IAA. The oxidation peaks of Fc and IAA are separated by ∼600 mV. Fig. 2C shows the DPV curve of the modified electrode in 600 μM SA. Along with the oxidation peak of Fc, the oxidation peak of SA appears at 1.05 V. The oxidation peaks of Fc and SA are separated by ∼900 mV. Fig. 2D shows the DPV curve of the modified electrode in 600 μM IAA and 600 μM SA. Three oxidation peaks are obviously observed, which ascribe to the Fc, IAA and SA, respectively. The oxidation peaks of IAA and SA are separated by ∼300 mV. It has been reported that two substances can be measured simultaneously without mutual interference if their oxidation potential separation is more than 100 mV.35 As the oxidation potential separation of Fc and IAA, Fc and SA, and IAA and SA are ∼600 mV, ∼900 mV and ∼300 mV, respectively, indicating that the modified electrode can simultaneously detect the oxidation of Fc, IAA and SA. The coexistence of Fc, IAA and SA in this sensor system could not produce interference to respective oxidation peak intensities and positions. Therefore, using the IIAA/Fc and ISA/Fc, a ratiometric electrochemical sensor which can simultaneously detect IAA and SA can be constructed.
Fig. 2. (A) DPV curve of the modified CB–MWNT–Nafion/Fc/CB–MWNT/GC electrode in 10 mM PBS (pH = 7.4). (B) DPV curve of the modified GC electrode in 600 μM IAA. (C) DPV curve of the modified GC electrode in 600 μM SA. (D) DPV curve of the modified GC electrode in 600 μM IAA + 600 μM SA.
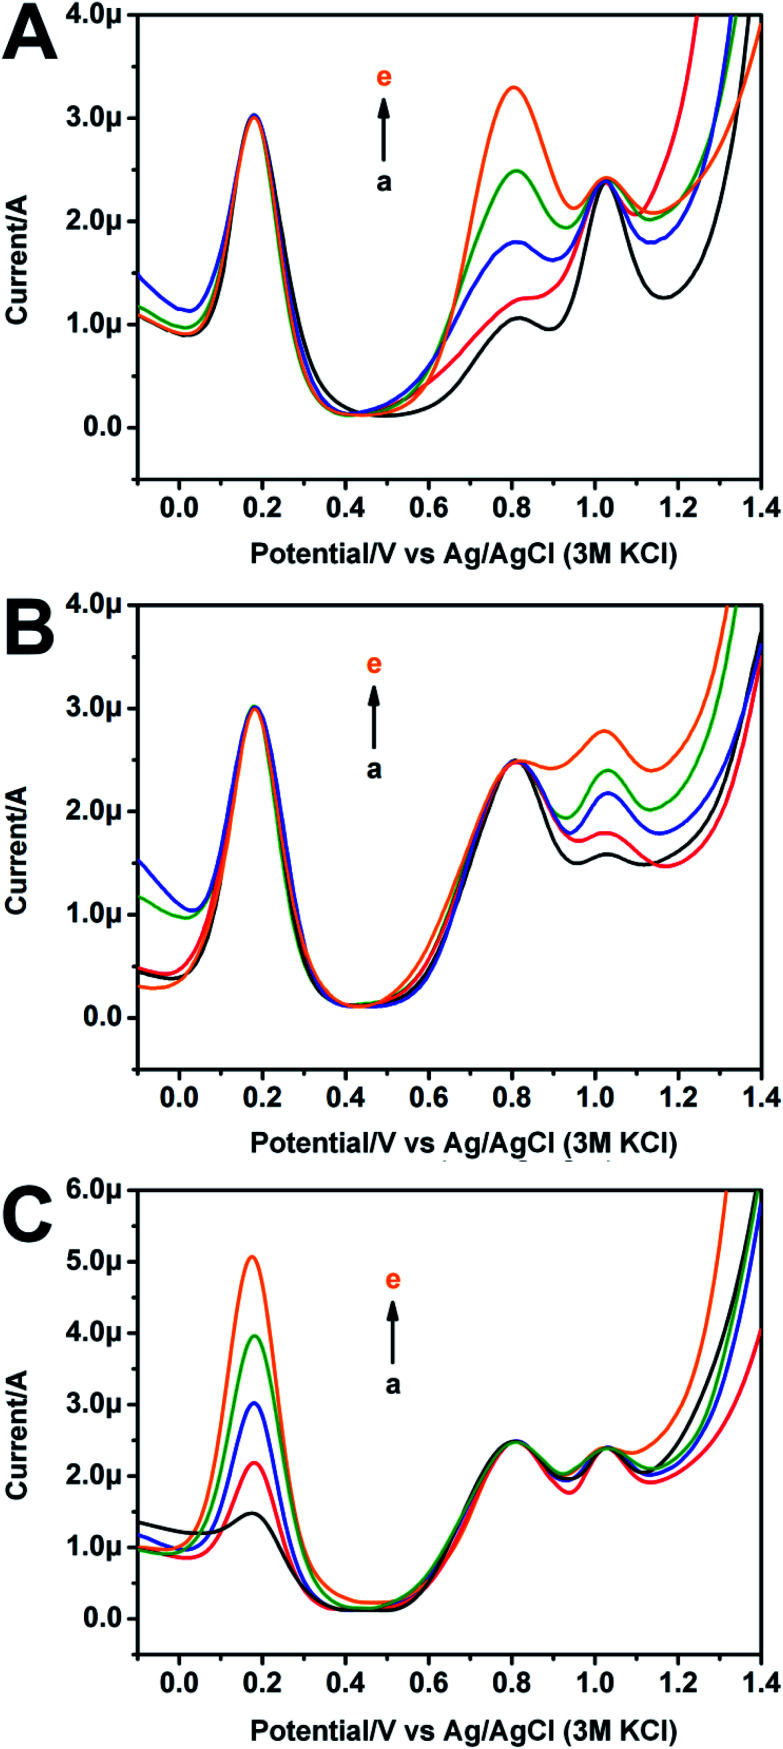
The mutual interferences between Fc and IAA (or SA) were also conducted. Fig. 3A shows the DPV curves of the modified electrode in presence of different concentrations of IAA with a fixed concentration of SA. The increase of IAA causes a gradual increase of the oxidation peak intensity of IAA, but hardly has any impact on that of Fc and SA. Fig. 3B shows the DPV curves of the modified electrode in presence of different concentrations of SA with a fixed concentration of IAA. With the increase of SA, the oxidation peak intensity of SA increases, but it also has little effect on that of Fc and IAA. Similarly, as shown in Fig. 3C, the increase of Fc also has negligible effect on IAA and SA. These results suggest that the mutual interferences from the three substances (Fc, IAA and SA) with fixed or increased concentrations have negligible influence on the oxidation peaks of other components. The fabrication of microsensor for ratiometric detection of IAA and SA simultaneously is feasible.
Fig. 3. DPV curves of the modified electrode contained 5 mg ml−1 Fc in PBS with SA (400 μM) plus IAA (125 μM, 200 μM, 300 μM, 400 μM, 600 μM, (a) to (e)) (A); IAA (400 μM) plus SA (125 μM, 200 μM, 300 μM, 400 μM, 600 μM, (a) to (e)) (B); IAA (400 μM), SA (400 μM) and Fc (1 mg ml−1, 2.5 mg ml−1, 5 mg ml−1, 7.5 mg ml−1, 10 mg ml−1, (a) to (e)) (C).
3.3. Performance of the CB–MWNT–Nafion/Fc/CB–MWNT/GC electrode for ratiometric detection of IAA and SA simultaneously
The concentrations of CB and MWNT used to prepare the CB–MWNT–Nafion/Fc/CB–MWNT/GC electrode were optimized. As shown in Fig. S2,† when the concentration of MWNT is kept constant, as the concentration of CB increases from 0.5 mg ml−1 to 2 mg ml−1, the oxidation peak current of SA (250 μM) increases significantly. When the concentration of CB increases further, the peak current of SA decreases, indicating the optimal concentration of CB is about 2 mg ml−1. The concentration of MWNT was also investigated. As shown in Fig. S3,† the peak current of IAA is highest when 4 mg ml−1 MWNT was used. So, the 4 mg ml−1 MWNT was used in the following experiments.
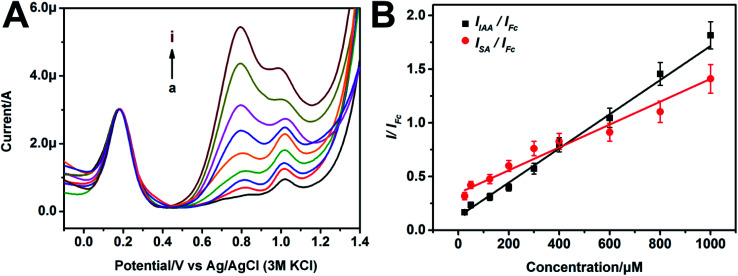
The performance of the prepared CB–MWNT–Nafion/Fc/CB–MWNT/GC electrode toward ratiometric detection of IAA and SA was studied by DPV. As the concentrations of IAA and SA raise from 25 μM to 1000 μM, the oxidation peak intensity of IAA and SA increase gradually (Fig. 4A), while the oxidation peak intensity of Fc remains unchanged. The ratio between the peak currents of IAA and Fc (i.e., IIAA/IFc) is linearly related to the IAA concentration from 25 μM to 1000 μM. The linear regression equation is y = 0.00159x + 0.124 (R2 = 0.9887), the LOD of the ratiometric sensor for IAA is 1.99 μM. The ISA/IFc also shows a linear relationship to the SA concentration from 25 μM to 1000 μM. The linear regression equation is y = 0.00107x + 0.34465 (R2 = 0.9488). The LOD of the ratiometric sensor for SA is 3.30 μM. As shown in Tables S1 and S2,† our sensor is more sensitive or comparable with the most electrochemical sensors that existed for IAA or SA detection, and the linear range of our sensor is wider, which can cover the concentration range of IAA and SA in most plants. More importantly, our sensor can detect the two substances simultaneously with high reliability.
Fig. 4. (A) DPV curves of the CB–MWNT–Nafion/Fc/CB–MWNT/GC modified electrode in PBS contained SA and IAA with the same concentration changes (25 μM, 50 μM, 125 μM, 200 μM, 300 μM, 400 μM, 600 μM, 800 μM, 1000 μM, (a) to (i)); (B) the linear relationships of IAA/Fc versus IAA concentrations, and SA/Fc versus SA concentrations.
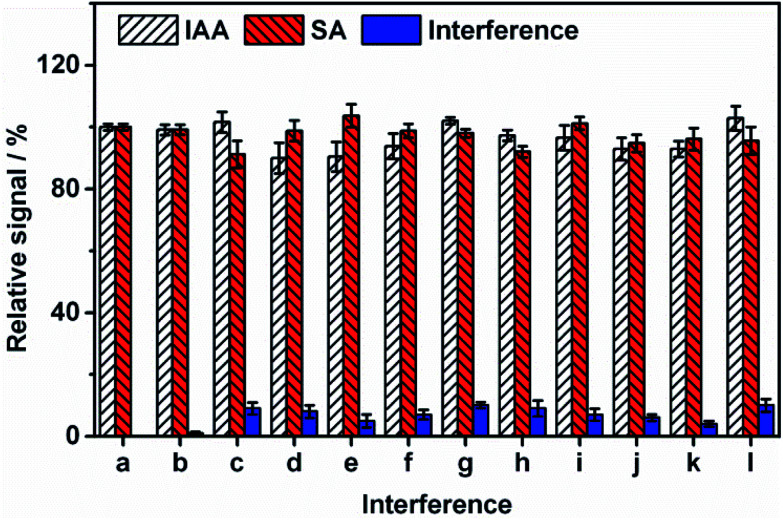
The selectivity of the sensor was also studied. As shown in Fig. 5, no obvious responses are observed for the potential interfering substances including abscisic acid, citric acid, methyl jasmonate, succinic acid, ascorbic acid, glucose, lactose, glycine, MgCl2, CaCl2 and mix of all the interferences. This result suggests that our sensor possesses high selectivity. The fabrication reproducibility of IAA and SA using six freshly prepared CB–MWNT–Nafion/Fc/CB–MWNT/GC electrodes is shown in Fig. S4.† The reproducibility of the CB–MWNT–Nafion/Fc/CB–MWNT/GC electrode is also evaluated by performing intra-assay and inter-assay experiments. The intra-assay is performed by assaying six replicate measurements with the same electrode in two concentrations of IAA and SA (50 μM and 250 μM). The inter-assay is estimated by using six freshly prepared electrodes. The CV% intra-assay values are below 4% and the inter-assay values are below 6% (Table S3†), respectively, indicating an acceptable reproducibility. The ratiometric sensor still has 87% sensing capacity after storing at 4 °C for one month, indicating it has high stability.
Fig. 5. Selectivity of the modified CB–MWNT–Nafion/Fc/CB–MWNT/GC electrode toward potential interfering including (a) blank, (b) abscisic acid, (c) citric acid, (d) methyl jasmonate, (e) succinic acid, (f) ascorbic acid, (g) glucose, (h) lactose, (i) glycine, (j) MgCl2, (k) CaCl2, (l) mix of all the interferences. The concentrations of IAA, SA and the interferences are all 250 μM.
3.4. Simultaneous detection of IAA and SA for the salt treated soybean seedlings using the ratiometric sensor
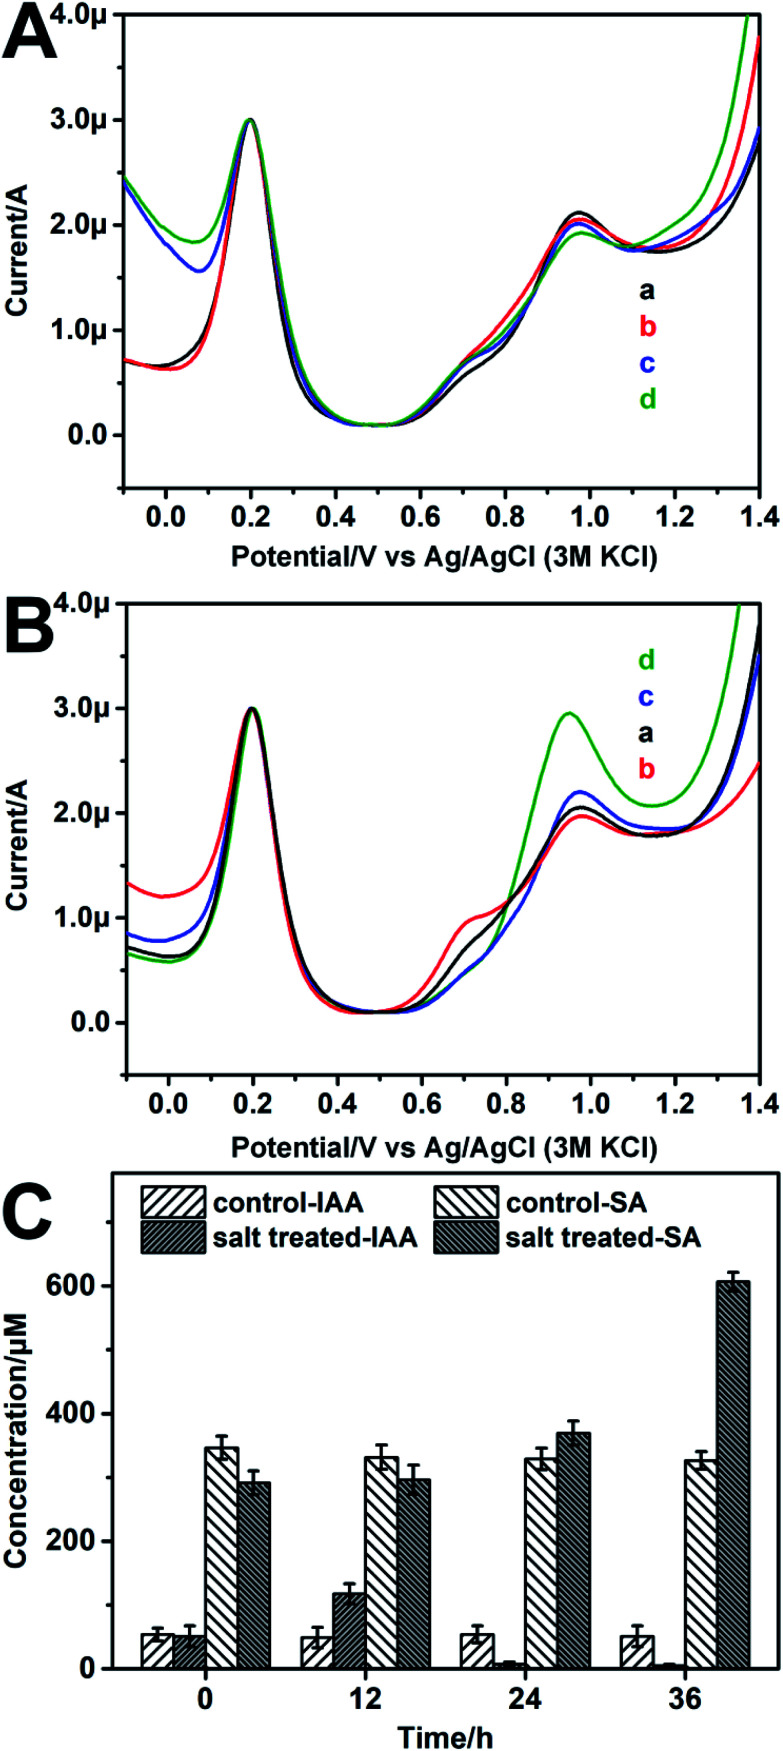
Salinity is one kind of environmental stresses which have obstructing effect on plant growth. In this work, the IAA and SA levels in the soybean seedlings treated by different salt concentrations were monitored by the fabricated ratiometric sensor. The soybean seedlings were salt treated for different time (0 h, 12 h, 24 h, 36 h). As shown in Fig. 6A, for the control group, the IAA and SA levels changed little over time, which are separately about 60–70 μM and 300–320 μM (Table S4†). For the salt treated group, the IAA level raises (124.69 ± 6.67 μM) compare to the control group after 12 h salt stress (Table S4†). Then the IAA level declines (40.35 ± 3.11 μM) after 24 h salt stress. After 36 h salt treatment, the IAA level declined further. While for SA, its level keeps rising from 314.91 ± 19.32 μM to 740.30 ± 15.47 μM during the 36 h salt stress (Fig. 6B). The UPLC-MS result (Fig. 6C) also shows similar trends with the result obtained by the prepared ratiometric sensor, which confirms the reliability of the developed sensor.
Fig. 6. Representative DPV curves of 50% homogenate of soybean seedling stems diluted by 10 mM PBS solution under (A) 0 mM (B) 100 mM NaCl salt stress for: 0 h (a), 12 h (b) 24 h (c) 36 h (d) detected by the modified CB–MWNT–Nafion/Fc/CB–MWNT/GC electrode. (C) The UPLC-MS results of IAA and SA levels of (A) and (B).
Both IAA and SA are important phytohormones. Our results suggest that, for IAA, its level raises first and then declines. For SA, its level keeps rising for the 36 h salt stress. This result indicates that both the two phytohormones are involved in the response of soybean seedlings to salt stress. The different changes of IAA and SA may relate to their different functions. IAA plays an important role in promoting plant growth.1,3,36 With the damage of salt stress to soybean seedlings, the growth of the soybean seedlings will be inhibited, so the level of IAA decreases in general. Studies have shown that IAA can improve plant drought resistance by regulating ABA-related gene and reactive oxygen species metabolism,37 suggesting that IAA can improve the plants tolerance to environment stresses to a certain extent. Therefore, the initial increase of IAA may be ascribed to plants self-regulation under salt stress. As for SA, one of its important roles is to send out defensive signals in the process of plants immunity.38,39 Therefore, with the prolongation of salt stress, the SA level kept rising for enhancing the plant defense response.
4. Conclusions
In summary, a multifunctional ratiometric electrochemical sensor for simultaneous determination of IAA and SA has been fabricated. The composite of MWNT and CB was used to enhance the sensitivity of sensor. Fc was used as reference molecule to offer a built-in correction. The proposed sensor showed high selectivity and accuracy. And it was applied to the determination of IAA and SA in the homogenates of soybean seedlings under different salt treatment successfully, confirming its practical applicability. The strategy demonstrates here could be further developed for establishing other kinds of multifunctional ratiometric electrochemical sensor for dual/multi-analysis.
Conflicts of interest
There are no conflicts to declare.
Supplementary Material
Acknowledgments
The authors are thankful for the fundings from Beijing Municipal Natural Science Foundation (No. 2182022), the National Natural Science Foundation of China (Grant No. 21974012), Key-Area Research and Development Program of Guangdong Province (No. 2019B020219002), Research and Innovation Platform Construction Project and Innovation Building Program of Beijing Academy of Agriculture and Forestry Sciences (No. PT2019-21, KJCX20170418).
Electronic supplementary information (ESI) available. See DOI: 10.1039/c9ra09951d
References
- Liu H. T. Li Y. F. Luan T. G. Lan C. Y. Shu W. S. Chromatographia. 2007;66:515–520. doi: 10.1365/s10337-007-0350-3. [DOI] [Google Scholar]
- Gomes Silva C. Luz I. Llabrés i Xamena F. X. Corma A. García H. Chem.–Eur. J. 2010;16:11133–11138. doi: 10.1002/chem.200903526. [DOI] [PubMed] [Google Scholar]
- Ma Z. Ge L. Lee A. S. Y. Yong J. W. H. Tan S. N. Ong E. S. Anal. Chim. Acta. 2008;610:274–281. doi: 10.1016/j.aca.2008.01.045. [DOI] [PubMed] [Google Scholar]
- Fahad S. Hussain S. Matloob A. Khan F. A. Khaliq A. Saud S. Hassan S. Shan D. Khan F. Ullah N. Plant Growth Regul. 2015;75:391–404. doi: 10.1007/s10725-014-0013-y. [DOI] [Google Scholar]
- Eyidogan F., Oz M. T., Yucel M. and Oktem H. A., Signal Transduction of Phytohormones Under Abiotic Stresses, 2012 [Google Scholar]
- Wang Z. Ai F. Xu Q. Yang Q. Yu J.-H. Huang W.-H. Zhao Y.-D. Colloids Surf., B. 2010;76:370–374. doi: 10.1016/j.colsurfb.2009.10.038. [DOI] [PubMed] [Google Scholar]
- Park J.-E. Park J.-Y. Kim Y.-S. Staswick P. E. Jeon J. Yun J. Kim S.-Y. Kim J. Lee Y.-H. Park C.-M. J. Biol. Chem. 2007;282:10036–10046. doi: 10.1074/jbc.M610524200. [DOI] [PubMed] [Google Scholar]
- Ding X. Cao Y. Huang L. Zhao J. Xu C. Li X. Wang S. Plant Cell. 2008;20:228–240. doi: 10.1105/tpc.107.055657. [DOI] [PMC free article] [PubMed] [Google Scholar]
- Wang D. Pajerowska-Mukhtar K. Culler A. H. Dong X. Curr. Biol. 2007;17:1784–1790. doi: 10.1016/j.cub.2007.09.025. [DOI] [PubMed] [Google Scholar]
- Budi Muljono R. A. Looman A. M. G. Verpoorte R. Scheffer J. J. C. Phytochem. Anal. 1998;9:35–38. doi: 10.1002/(SICI)1099-1565(199801/02)9:1<35::AID-PCA379>3.0.CO;2-D. [DOI] [Google Scholar]
- Chen H. Guo X.-F. Zhang H.-S. Wang H. J. Chromatogr. B: Anal. Technol. Biomed. Life Sci. 2011;879:1802–1808. doi: 10.1016/j.jchromb.2011.05.002. [DOI] [PubMed] [Google Scholar]
- Madej A. Häggblom P. Physiol. Plant. 1985;64:389–392. doi: 10.1111/j.1399-3054.1985.tb03358.x. [DOI] [Google Scholar]
- Croubels S. Maes A. Baert K. De Backer P. Anal. Chim. Acta. 2005;529:179–187. doi: 10.1016/j.aca.2004.08.020. [DOI] [Google Scholar]
- Sun J. Wang B. Zhao X. Li Z.-J. Yang X. Anal. Chem. 2016;88:1355–1361. doi: 10.1021/acs.analchem.5b03848. [DOI] [PubMed] [Google Scholar]
- Sena M. M. Trevisan M. G. Poppi R. J. Talanta. 2006;68:1707–1712. doi: 10.1016/j.talanta.2005.08.024. [DOI] [PubMed] [Google Scholar]
- Sun L. Liu X. Gao L. Lu Y. Li Y. Pan Z. Bao N. Gu H. Anal. Lett. 2015;48:1578–1592. doi: 10.1080/00032719.2014.991963. [DOI] [Google Scholar]
- Liu F. Tang J. Xu J. Shu Y. Xu Q. Wang H. Hu X. Biosens. Bioelectron. 2016;86:871–878. doi: 10.1016/j.bios.2016.07.089. [DOI] [PubMed] [Google Scholar]
- Lu L. Yu Y. Zhou H. Li P. Peng Y. Wang W. He H. Int. J. Electrochem. Sci. 2016;11:2392–2400. [Google Scholar]
- Park J. Eun C. Electrochim. Acta. 2016;194:346–356. doi: 10.1016/j.electacta.2016.02.103. [DOI] [Google Scholar]
- Sun L. Feng Q. Yan Y. Pan Z. Li X. Song F. Yang H. Xu J. Bao N. Gu H. Biosens. Bioelectron. 2014;60:154–160. doi: 10.1016/j.bios.2014.04.021. [DOI] [PubMed] [Google Scholar]
- Lu L. Zhu X. Qiu X. He H. Xu J. Wang X. Int. J. Electrochem. Sci. 2014;9:8057–8066. [Google Scholar]
- Deng C. Pi X. Qian P. Chen X. Wu W. Xiang J. Anal. Chem. 2017;89:966–973. doi: 10.1021/acs.analchem.6b04209. [DOI] [PubMed] [Google Scholar]
- Zhang J. Wang L.-L. Hou M.-F. Xia Y.-K. He W.-H. Yan A. Weng Y.-P. Zeng L.-P. Chen J.-H. Biosens. Bioelectron. 2018;102:33–40. doi: 10.1016/j.bios.2017.10.050. [DOI] [PubMed] [Google Scholar]
- Wang L. Gong C. Shen Y. Ye W. Xu M. Song Y. Sens. Actuators, B. 2017;242:625–631. doi: 10.1016/j.snb.2016.11.100. [DOI] [Google Scholar]
- Cui L. Lu M. Li Y. Tang B. Zhang C.-y. Biosens. Bioelectron. 2018;102:87–93. doi: 10.1016/j.bios.2017.11.025. [DOI] [PubMed] [Google Scholar]
- Yao D. Zhao W. Zhang L. Tian Y. Analyst. 2017;142:4215–4220. doi: 10.1039/C7AN01295K. [DOI] [PubMed] [Google Scholar]
- Zhao H. Liang R. Wang J. Qiu J. Chem. Commun. 2015;51:12669–12672. doi: 10.1039/C5CC03678J. [DOI] [PubMed] [Google Scholar]
- Jia J. Chen H. G. Feng J. Lei J. L. Luo H. Q. Li N. B. Anal. Chim. Acta. 2016;908:95–101. doi: 10.1016/j.aca.2015.12.028. [DOI] [PubMed] [Google Scholar]
- Luo Y. Zhang L. Liu W. Yu Y. Tian Y. Angew. Chem., Int. Ed. 2015;54:14053–14056. doi: 10.1002/anie.201508635. [DOI] [PubMed] [Google Scholar]
- Li S. Zhu A. Zhu T. Zhang J. Z. H. Tian Y. Anal. Chem. 2017;89:6656–6662. doi: 10.1021/acs.analchem.7b00881. [DOI] [PubMed] [Google Scholar]
- Li H. Y. Wang C. Wang X. D. Hou P. C. Luo B. Song P. Pan D. Y. Li A. X. Chen L. P. Biosens. Bioelectron. 2019;126:193–199. doi: 10.1016/j.bios.2018.10.041. [DOI] [PubMed] [Google Scholar]
- Hu Y. Zhao J. Li H. Y. Wang X. D. Hou P. C. Wang C. Li A. X. Chen L. P. RSC Adv. 2018;8:23404–23410. doi: 10.1039/C8RA03475C. [DOI] [PMC free article] [PubMed] [Google Scholar]
- Wu N. L. Wang S. Y. J. Power Sources. 2002;110:233–236. doi: 10.1016/S0378-7753(02)00257-4. [DOI] [Google Scholar]
- Kim K. S. Park S. J. Mater. Res. Bull. 2012;47:4146–4150. doi: 10.1016/j.materresbull.2012.08.082. [DOI] [Google Scholar]
- Xiao T. F. Wu F. Hao J. Zhang M. N. Yu P. Mao L. Q. Anal. Chem. 2017;89:300–313. doi: 10.1021/acs.analchem.6b04308. [DOI] [PubMed] [Google Scholar]
- Xi Z. Zhang Z. Sun Y. Shi Z. Tian W. Talanta. 2009;79:216–221. doi: 10.1016/j.talanta.2009.03.031. [DOI] [PubMed] [Google Scholar]
- Schopfer P. Liszkay A. Bechtold M. Frahry G. Wagner A. Planta. 2002;214:821–828. doi: 10.1007/s00425-001-0699-8. [DOI] [PubMed] [Google Scholar]
- An C. Mou Z. Integr J. Plant Biol. 2011;53:412–428. doi: 10.1111/j.1744-7909.2011.01043.x. [DOI] [PubMed] [Google Scholar]
- Hayat S. Irfan M. Wani A. S. Nasser A. Ahmad A. Plant Signaling Behav. 2012;7:93–102. doi: 10.4161/psb.7.1.18620. [DOI] [PMC free article] [PubMed] [Google Scholar]
Associated Data
This section collects any data citations, data availability statements, or supplementary materials included in this article.


