

Abstract
Creatine deficiency disorders are inborn errors of creatine metabolism, an energy homeostasis molecule. One of these, guanidinoacetate N-methyltransferase (GAMT) deficiency, has clinical characteristics that include features of autism, self-mutilation, intellectual disability, and seizures, with approximately 40% having a disorder of movement; failure to thrive can also be a component. Along with low creatine levels, guanidinoacetic acid (GAA) toxicity has been implicated in the pathophysiology of the disorder. Present-day therapy with oral creatine to control GAA lacks efficacy; seizures can persist. Dietary management and pharmacological ornithine treatment are challenging. Using an AAV-based gene therapy approach to express human codon-optimized GAMT in hepatocytes, in situ hybridization, and immunostaining, we demonstrated pan-hepatic GAMT expression. Serial collection of blood demonstrated a marked early and sustained reduction of GAA with normalization of plasma creatine; urinary GAA levels also markedly declined. The terminal time point demonstrated marked improvement in cerebral and myocardial creatine levels. In conjunction with the biochemical findings, treated mice gained weight to nearly match their wild-type littermates, while behavioral studies demonstrated resolution of abnormalities; PET-CT imaging demonstrated improvement in brain metabolism. In conclusion, a gene therapy approach can result in long-term normalization of GAA with increased creatine in guanidinoacetate N-methyltransferase deficiency and at the same time resolves the behavioral phenotype in a murine model of the disorder. These findings have important implications for the development of a new therapy for this abnormality of creatine metabolism.
Keywords: guanidinoacetate methyltransferase deficiency, gene therapy, creatine, guanidinoacetate, AAV
Graphical abstract
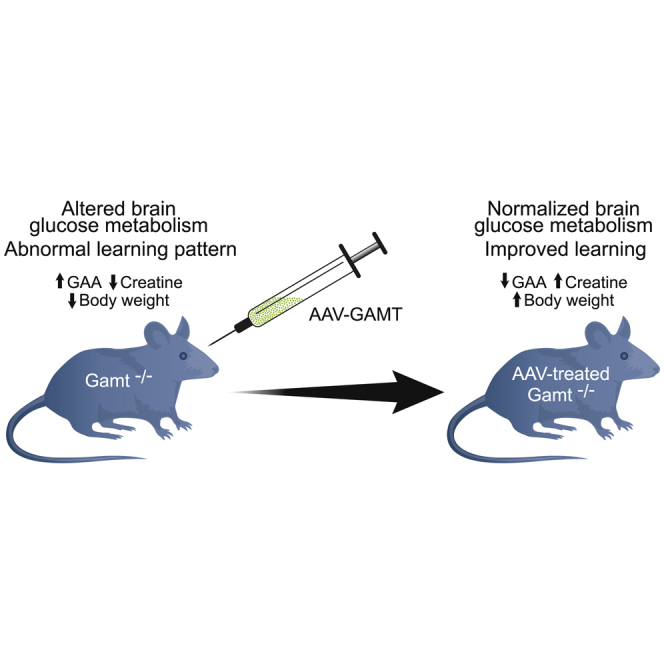
Khoja et al. have developed a gene therapy approach for guanidinoacetate methyltransferase (GAMT) deficiency, a creatine deficiency disorder. With this AAV-based approach, the marked plasma elevation of guanidinoacetate with reduced creatine is resolved along with the abnormal findings of the behavioral phenotype.
Introduction
Creatine has an essential role in energy homeostasis, being particularly important in muscle and the brain due to their fluctuating energy demands. Outside of the buffering and transport function of high-energy phosphates, creatine is important for neurite growth cone migration, dendritic and axonal elongation, co-transmission on GABA postsynaptic receptors in the central nervous system (CNS)1, 2, 3, 4 and neurotransmitter release.5 Most cells do not rely on ATP/ADP free diffusion; instead, creatine kinase/phosphocreatine (CK/PCr) serves as energy storage for the immediate regeneration of ATP as a shuttle of high-energy phosphates between sites of ATP production and energy consumption.6
Parallel to dietary consumption, creatine biosynthesis occurs in two enzymatic steps primarily in the liver, kidneys, and pancreas. l-Arginine:glycine amidinotransferase (AGAT) catalyzes the formation of guanidinoacetate (GAA) from arginine and glycine; guanidinoacetate N-methyltransferase (GAMT; EC 2.1.1.2) subsequently catalyzes the formation of creatine by GAA methylation from S-adenosylmethionine.7 Once synthesized, creatine is distributed through the bloodstream and is taken up through the cellular creatine transporter solute carrier family 6 member 8 (SLC6A8), a sodium and chloride-dependent symporter, against a large concentration gradient.8 Phosphocreatine reversibly transfers its N-phosphoryl group to ADP to regenerate ATP to prevent tissues from running out of energy. As at least half of creatine is synthesized endogenously, deficits in synthesis or transport result in cerebral creatine deficiency syndromes.
The cerebral creatine deficiency syndromes include the two autosomal recessive creatine biosynthetic disorders GAMT deficiency8,9 (MIM: 601240) and AGAT deficiency8 (MIM: 602360). Mutations of SLC6A8 (MIM: 300352) affect creatine transport into cells. The hallmark of this family of disorders is the near-complete absence of creatine in the brain10 and the associated, predominantly neurological, disease. While signs and symptoms can range from mild to severe, intellectual disability, global developmental delay, speech impairment, extrapyramidal movement disorders, autism spectrum disorder, and seizures are common in all three.8,11,12 Together, the creatine deficiency disorders may represent one of the most frequent metabolic disorders with a primarily neurological phenotype7.
Of the creatine deficiency disorders, GAMT loss-of-function mutations tend to result in the most severe phenotype. While likely underdiagnosed,5 the prevalence is estimated to range from 1 in 114,07213 to 1 in 250,000 births,14 with a carrier frequency from 1 in 1,47515 to 1 in 812;16 numerous different mutations (missense being the most common) have been reported15 to be scattered throughout the gene, with no hotspot or predominant mutation. The alteration of the Cr/PCr/CK system appears to be of particular importance during early brain development.7 Developmental delay is typically detected at 3–12 months;8 muscular hypotonia, involuntary movements, ataxia, and autistic or self-aggressive behavior are common.8,17,18 Severe expressive language delay is an almost constant feature;19 most patients have no speech or language and, if present, is extremely limited, with marked intellectual disability. Extrapyramidal movements and seizures are characteristic and often refractory to antiepileptics. With deficiency of GAMT, creatine synthesis is markedly impaired, while GAA, accumulating in the plasma, cerebrospinal fluid (CSF), urine, brain, and other tissues, is thought to be the cause of the severe phenotype,8,17 with the associated neurocognitive dysfunction likely due to both the deficiency of creatine and the accumulation of guanidinoacetate.5
In GAMT deficiency, treatment requires life-long high-dose creatine due to the low blood-brain barrier permeability,18,20 as endogenous synthesis is not possible. Oral creatine has an unpleasant taste, making it at times difficult to administer to children. In addition, high-dose creatine administration is not always benign, having resulted in nephrolithiasis in some creatine-deficient patients.21 With creatine supplementation, however, GAA still accumulates from peripheral excess,5,20 and while GAA-lowering strategies (e.g., ornithine supplementation, arginine restriction,17 which can be difficult to maintain15) can greatly decrease plasma and CSF GAA, brain levels can remain 10 times above normal levels.18 This leaves children at risk for seizures and progressive CNS injury due to the neurotoxicity of GAA.22
Here, we describe studies developing a gene therapy approach for GAMT deficiency to overcome the limitations of oral creatine therapy. Restored hepatic gene expression led to weight gain, normalization of plasma and urine GAA levels, restoration of brain and plasma creatine, and resolution of behavioral abnormalities when administered to a murine model of the disorder. These findings have implications for the development of a new therapeutic approach for GAMT deficiency.
Results
AAV-GAMT results in control of GAA and restoration of creatine with a dose-dependent effect
Transgenic mice deficient in Gamt were developed as a knockout model and biochemically replicate GAMT deficiency in patients with markedly elevated guanidinoacetic acid and markedly reduced creatine in plasma and tissues.23 While mice are biochemically similar to human patients, few behavioral deficits have been found.24 Gamt-deficient mice (8 weeks of age, C57Bl/6 background) were administered one of four escalating doses of adeno-associated virus (AAV) expressing human codon-optimized GAMT (hcoGAMT) under a liver-specific (thyroxine-binding globulin [TBG]) promoter to determine the optimal dose for long-term testing (n = 5 per group). Doses of 5 × 10¹², 1 × 10¹³, 5 × 10¹³, and 1 × 10¹⁴ genome copies per kilogram (GCs/kg) were intravenously administered after baseline blood sampling. Mice were euthanized 30 days after administration to assess dose and effect by multiple parameters.
AAV vector copy number per diploid hepatic genome in these Gamt−/− mice was determined at each dose (Figure 1A). As expected, AAV copy numbers increased with increasing dose (mean copies per diploid hepatic genome ±standard deviation [SD]): 5 × 10¹² GC/kg: 0.37 ± 0.35; 1 × 10¹³ GC/kg: 1.58 ± 1.2; 5 × 10¹³ GC/kg: 33.98 ± 18.28; and 1 × 10¹⁴ GC/kg: 75.32 ± 28.60 copy numbers per diploid hepatic genome (n = 5 for 5 × 10¹², n = 4 for 1 × 10¹³, n = 4 for 5 × 10¹³, and n = 3 for 1 × 10¹⁴). Human codon-optimized GAMT RNA was quantified as fold change in gene expression by real-time PCR (n = 5 per dose) (Figure 1B). AAV-mediated hepatocyte GAMT RNA increased with increasing dose (mean ± SD): 5 × 10¹² GC/kg: 6,818 ± 4,018; 1 × 10¹³ GC/kg: 12,058 ± 8,259; 5 × 10¹³ GC/kg: 41,428 ± 11,590; and 1 × 10¹⁴ GC/kg: 69,709 ± 27,152. GAMT protein was examined by western blot, with β-actin as an internal housekeeping protein to evaluate loading. Incremental increases in band density for GAMT were detected with increasing dose (Figure 1C). With quantitation (n = 3 per group), increased protein expression was objectively determined relative to β-actin: 5 × 10¹²: 0.32 ± 0.17; 1 × 10¹³: 0.56 ± 0.46; 5 × 10¹³: 1.11 ± 0.08; and 1 × 10¹⁴: 1.63 ± 0.24 (Figure 1D).
Figure 1.

Dose-finding studies demonstrate quantitative increases in GAMT expression
Adult Gamt−/− mice were intravenously administered AAVrh10 expressing human codon-optimized GAMT and analyzed 30 days after the injection. AAV DNA copy-number analysis (A) per diploid nucleus of the liver, RNA expression (B) by quantitative real-time PCR of human codon-optimized GAMT, and GAMT protein expression (C and D) demonstrate increases with escalating dose. (RT-PCR, n = 5 per group; quantitative western blot analysis, n = 3 per group). (C shows representative images). Values represent means ± standard deviations. GC, genome copies; GAMT, guanidino N-methyltransferase.
AAV-mediated liver-specific GAMT expression was also evaluated by in situ hybridization with a codon-optimized human GAMT-specific probe in Gamt−/− mice. With increasing administered AAV doses, hepatic codon-optimized GAMT RNA expression increases, as demonstrated by the greater density of probe-specific chromogenic deposition (red; representative images in Figure 2: A, wild-type [WT] Gamt+/+; B, 5 × 10¹² GC/kg; C, 1 × 10¹³ GC/kg; D, 5 × 10¹³ GC/kg; E, 1 × 10¹⁴ GC/kg). Similarly, hepatic GAMT protein expression (in these Gamt−/− mice) increased with escalating doses as demonstrated by human GAMT-specific immunohistochemistry (representative images in Figure 2: F, WT Gamt+/+; G, 5 × 10¹² GC/kg; H, 1 × 10¹³ GC/kg; I, 5 × 10¹³ GC/kg; J, 1 × 10¹⁴ GC/kg).
Figure 2.

Increasing AAV dose results in augmented GAMT expression and biochemical response
Adult Gamt−/− mice were administered AAVrh10 expressing human codon-optimized GAMT intravenously and analyzed 30 days after the injection. RNA expression (A–E) by in situ hybridization (RNAscope) is demonstrated by increasing red precipitate in these representative images (A, untreated; B, 5 × 10¹² GC/kg; C, 1 × 10¹³ GC/kg; D, 5 × 10¹³ GC/kg; E, 1 × 10¹⁴ GC/kg). Protein expression simultaneously increases as detected by immunohistochemical detection and DAB staining (F–J) in these representative images (F, untreated; G, 5 × 10¹² GC/kg; H, 1 × 10¹³ GC/kg; I, 5 × 10¹³ GC/kg; J, 1 × 10¹⁴ GC/kg). With increasing doses, the plasma biochemical response to hepatic hcoGAMT expression increases; plasma creatine incrementally increases and normalizes (K) as elevated plasma guanidinoacetic acid levels abate (L). Values represent means ± standard deviations. (F) and (L) n = 5 per group. Red represents baseline levels in Gamt−/− mice. Blue represents plasma values at 30 days after AAV administration. Black dotted line demonstrates mean plasma creatine level (with range of minimum and maximum represented with gray dotted line) in (K) and mean plasma guanidinoacetic acid level in (L). GAA, guanidinoacetic acid. Bar size in (F) and (G), 100 μm.
With the marked increase in GAMT hepatic protein, there is an improvement in the metabolic response. While plasma creatine (Figure 2K) did increase (96.38 ± 84.8 nmol/mL) with the lowest dose of vector (5 × 10¹² GC/kg) from the pretreatment level (35.53 ± 13.75 nmol/mL [p = 0.013 versus Gamt+/+]), plasma creatine continued to increase sequentially with each dose escalation, becoming equivalent (p = 0.997) to WT plasma creatine levels (249.39 ± 37.6 nmol/mL) at the highest dose (1 × 10¹⁴ GC/kg: 237.57 ± 37.4 nmol/mL). Lower doses of vector also resulted in improved plasma creatine levels (1 × 10¹³ GC/kg: 148.54 ± 96.60, p = 0.13 versus Gamt+/+; 5 × 10¹³ GC/kg: 196.13 ± 62.10, p = 0.60 versus Gamt+/+) (Figure 2K; n = 5 per group). High-level antibodies to AAV serotype rh10 were present as expected when plasma was tested at 4 months after vector administration (data not shown).
Simultaneous with increases in creatine, plasma GAA levels declined. While markedly elevated pretreatment (red data points), a steady decline was detected with incremental dose increases (blue data points) (5 × 10¹² GC/kg: 101.55 ± 13.70 versusversus 128.36 ± 22.00 nmol/mL pretreatment, p < 0.0001 versus WT; 1 × 10¹³ GC/kg: 82.83 ± 29.00 versus 128.69 ± 30.10 nmol/mL pretreatment, p < 0.0001 versus WT; 5 × 10¹³ GC/kg: 19.512 ± 7.90 versus 119.45 ± 19.00 nmol/mL pretreatment, p = 0.43 versus WT; 1 × 10¹⁴ GC/kg: 11.37 ± 0.97 versus 126.37 ± 5.8 nmol/mL pretreatment, expressed as treated versus untreated, n = 5 per group) (Figure 2L). With a dose of 1 × 10¹⁴ GC/kg, near equivalency (p = 0.92) to WT (Gamt+/+) mouse plasma levels of GAA (5.17 ± 0.52 nmol/mL) were achieved. As the dose of 1 × 10¹⁴ GC/kg achieved the restoration of plasma creatine levels and amelioration of elevated plasma GAA, this dose was chosen for administration and assessment in long-term studies.
A single intravenous dose of AAV expressing human codon-optimized GAMT results in improved weight gain
With the optimal intravenous dose now determined, equal numbers of genders and groups (Gamt+/+, Gamt−/−, treated Gamt−/−) of 2-month-old mice were analyzed (n = 8 per genotype group, with 4 males and 4 females included in each group) in a 12-month study. Gamt+/+ and untreated Gamt−/− mice received vehicle alone, while the experimental Gamt−/− group received 1 × 10¹⁴ GC/kg of AAV-TBG-hcoGAMT intravenously after baseline blood sampling. Mice were followed for 1 year, with all groups having 100% survival (data not shown). While all male groups started with similar weights (time 0: Gamt+/+ 26.18 ± 1.10 g; Gamt−/− 24.85 ± 1.03 g; treated Gamt−/− 24.53 ± 0.75 g; WT versus treated mutant p = 0.091, WT versus untreated mutant p = 0.214) (Figure 3A), male mice demonstrated a dichotomy in response: untreated Gamt−/− mice (red data points) had little change in weight after week 10, while WT mice (black data points) continually gained weight throughout the period of study (week 54: untreated Gamt−/− 26.80 ± 1.02 g; Gamt+/+ 38.23 ± 4.53; treated Gamt−/− 32.83 ± 0.83). Overall, by 1 year, AAV-TBG-treated Gamt−/− male mice also demonstrated substantial weight gain (blue data points; 32.83 ± 0.83 g; p = 0.16 versus Gamt+/+) when compared with untreated Gamt−/− mice (26.80 ± 1.02 g; p = 0.02 versus WT), but not to the same extent of the WT controls (38.23 ± 4.53 g).
Figure 3.

GAMT expression by AAV promotes marked improvement in weight and adipose deposits
Mice were weighed weekly from before treatment (week 0) to end of study (week 54). While male AAV-treated Gamt−/− mice gain weight (A, blue line), female mice (B, blue line) within several weeks equal that of the Gamt+/+ (wild type [WT]) littermates (black line); untreated Gamt−/− mice (red line) of both genders were not seen to substantially gain weight after 10 weeks in the study. (C) In these representative images, a female AAV-treated Gamt−/− mouse (right) is of similar size and appearance when compared to a WT littermate (center), while an untreated Gamt−/− mouse remains smaller (left). (Image is from week 54.) (D) Representative microCT images of body fat (brown) in WT mice (Gamt+/+, left), untreated GAMT-deficient mice (center), and GAMT-deficient mice with gene therapy (right). Quantification of weight (E) and body fat amount (F) by microCT at 8 months of age with imaging of Gamt+/+ (WT), Gamt−/−, and Gamt-deficient mice treated with gene therapy. (D–F) Correlation between body weight and body fat in (G) female mice, (H) male mice, and (I) mice of both sexes, determined by the linear regression method using GraphPad Prism 8.0.1. Values represent means ± standard deviations. (A) and (B) n = 4 per group; red represents Gamt−/− mice; blue represents treated Gamt−/− mice; black represents WT controls. (E)–(I) n = 4 per group, except untreated males, where n = 3.
Female AAV-TBG-treated Gamt−/− mice fared even better. Female mice were of a similar weight at the beginning of the study (WT versus treated mutant p = 0.603; WT versus untreated mutant p = 0.338). Similar to the male cohort, untreated Gamt−/− mice (red data points) had little weight gain after week 10 (weight at beginning of study: untreated Gamt−/− 19.08 ± 1.25 g versus 20.23 ± 1.24 g at week 54). AAV-TBG-treated Gamt−/− mice (blue data points) were nearly equivalent in their course of weight gain and weights at 1 year to WT controls (black data points) (at week 54, Gamt+/+ 25.70 ± 1.45 versus 24.95 ± 0.58 g in treated Gamt−/−) (Figures 3B and 3C). Overall, by 1 year, AAV-treated Gamt−/− female mice had substantial weight gain and were comparable to WT mice (p = 0.58), unlike untreated Gamt−/− mice (p = 0.002 versus Gamt+/+).
Untreated Gamt−/− mice of both genders were visibly thinner and, when handled, demonstrated less subcutaneous adipose tissue. To better understand the recovery in weight with gene therapy, mice were imaged with whole-body microcomputed tomography (microCT) at 8 months of age, and the adipose tissues were quantified by AMIDE software and visualized in the three-dimensional (3D) mode by ORS Dragonfly software. With this imaging, the adipose tissue is easily identified as the visualization demonstrates. Comparing the three groups, there is a relative restoration of the adipose tissue in the treated Gamt−/− mice such that they resemble that of the Gamt WT in both genders. microCT imaging of all of the groups (Figure 3D) was performed and representative images of body fat (brown) in WT mice (Gamt+/+, left), untreated Gamt−/− mice (center), and Gamt−/− mice treated with gene therapy (right) are presented. Visibly, the untreated female Gamt−/− mice demonstrate reduced fat when compared with Gamt+/+ and treated Gamt−/− mice. Quantification of body weight (Figure 3E, left) (WT 23.8 ± 1.3 g, untreated Gamt−/− 18.75 ± 0.13 g, treated Gamt−/− 22.78 ± 2.24 g; p = 0.610 Gamt+/+ versus treated Gamt−/−) and body fat (Figure 3F, left) by microCT at 8 months (Gamt+/+ 3,510 ± 516, untreated Gamt−/− 2,347 ± 363, treated Gamt−/− 2,774.5 ± 971.5 g, p = 0.313 comparing treated Gamt−/− and Gamt+/+) in female mice demonstrates the marked improvement of body weight and some non-statistically significant improvement in adipose tissue deposition 8 months after AAV was administered.
Male mice demonstrate similar physical findings subjectively when handled, and microCT imaging also demonstrates reduced adipose tissue in untreated Gamt-deficient mice; similarly, some restoration of adipose tissue deposition was achieved with AAV-liver-specific-based gene therapy. Quantification of body weight (Figure 3E, right) in male mice (WT 36.70 ± 4.73 g, untreated Gamt−/− 27.90 ± 0.92 g, treated Gamt−/− 31.25 ± 1.28 g; p = 0.08 WT versus treated Gamt−/−) and body fat (Figure 3F) by microCT (WT 6,046.2 ± 4,280.7 mm3, untreated Gamt−/− 2,680.6 ± 347 mm3, treated Gamt−/− 4,089.4 ± 1,226.5 mm3, p = 0.590 comparing treated Gamt−/− and WT) also demonstrates the marked improvement in body weight and fat 8 months after AAV administration. There is a correlation between body weight and body fat in in both female (Figure 3G) and male (Figure 3H) mice and mice of both genders (Figure 3I) when analyzed together, indicating that the body weight changes are, at least partially, contributed to by the amount of adipose tissue present.
AAV administration results in long-term hepatic GAMT expression with control of GAA and restoration of creatine levels in plasma, urine, and tissues
AAV viral genomes (Figure 4A) are maintained in hepatocytes for at least 1 year (length of study), albeit reduced when compared to the 30-day data, when administered in adult mice. Copy number variability per hepatocyte diploid genome when comparing male (66.44 ± 23.04 vector copies per diploid genome) and female mice (29.85 ± 14.90 vector copies per diploid genome) is detected, as previously described25 (n = 8 for WT, n = 4 for Gamt−/−, and n = 8 for treated Gamt−/−). Human liver demonstrates the pan-hepatic expression of GAMT (Figure 4B); the antibody used in these studies is specific for the human enzyme and does not cross-react with murine Gamt (Figure 4C is Gamt+/+). Transgene-encoded expression of GAMT from AAV is detected in the murine liver of both genders (representative images, Figure 4D [female], 4E [male]; western blot in 4F). Immunohistochemistry demonstrates a greater density of expression around vascular structures, with more sparse expression with distance from vasculature. Plasma alanine aminotransferase (ALT) and aspartate aminotransferase (AST) were compared between Gamt+/+, untreated Gamt−/−, and treated Gamt−/− (4 mice per group); no statistically significant differences were found between Gamt WT and AAV-treated Gamt−/− mice (Figures 4G and 4H).
Figure 4.

AAV administration results in long-term hepatic genome persistence and GAMT protein expression
Mice were euthanized 1 year after intravenous administration of AAVrh10 expressing hcoGAMT under a liver-specific promoter. Hepatic AAV copy-number analysis (A) demonstrates AAV genome persistence. Representative images of immunohistochemistry specific for human GAMT protein show, for comparison, widespread expression in human liver (B), no GAMT expression in WT murine hepatocytes (C), and hepatic GAMT expression, most prominently in hepatocytes near the hepatic veins, in both female (D) and male (E) AAV-treated Gamt−/− mice. Western blotting (F) demonstrates the specificity of antibody for human GAMT and evidence of hepatic expression in AAV-treated GAMT−/− mice. Plasma alanine aminotransferase (G) and aspartate aminotransferase (H) were determined in WT-treated Gamt−/−, and untreated Gamt−/− mice. Values represent means ± standard deviations. For (A), n = 4–8 per group; for (G) and (H), n = 4 per group. AAV, adeno-associated virus.
Pathognomonic to GAMT deficiency is markedly reduced plasma creatine with elevated GAA levels. GAA in Gamt−/− mice (Figures 5A and 5B) was markedly elevated before vector administration in both male (time 0: 154.93 ± 26.00 in Gamt−/− [red] vs. 5.17 ± 0.52 nmol/mL in Gamt+/+ [black], p < 0.01) and female (time 0: 140.84 ± 15.38 in Gamt−/− [red] versus 8.64 ± 5.53 nmol/mL in Gamt+/+ [black], p < 0.01) mice. Plasma GAA levels were markedly reduced with hepatic-based gene therapy in treated males (Figure 5A) (blue data points: plasma GAA at 12 months: Gamt+/+ 4.90 ± 1.67 versus treated Gamt−/− 7.33 ± 0.70 nmol/mL [p = 0.115]; untreated versus treated Gamt−/− and Gamt+/+ both p = 0.001 [n = 4 per group]) and females (Figure 5B) (plasma GAA at 12 months: Gamt+/+ 6.49 ± 5.63 versus treated Gamt−/− 11.67 ± 4.41 nmol/mL [p = 0.379]; untreated versus treated Gamt−/− and Gamt+/+, both p ≤ 0.002 [n = 4 per group]). The therapeutic response in plasma creatine was similar (Figures 5C and 5D). Creatine in untreated Gamt−/− mice is markedly reduced in both males (Gamt+/+ [black] 249.39 ± 37.60 versus 30.10 ± 7.80 nmol/mL in Gamt−/− [red], p < 0.01) and females (Gamt+/+ 275.39 ± 55.36 versus 26.72 ± 6.77 nmol/mL in Gamt−/−, p < 0.01 [n = 4 per group]). Plasma creatine levels were normalized in treated males (blue data points) (at 12 months: Gamt+/+ 313.08 ± 97.04 versus treated Gamt−/− 294.13 ± 41.04 nmol/mL [p = 0.95]; untreated versus treated Gamt−/− p < 0.01) and treated females (plasma creatine 12 months: Gamt+/+ 286.74 ± 109.99 versus treated Gamt−/− 277.45 ± 102.15 nmol/mL [p = 0.992]; untreated versus treated Gamt−/− and Gamt+/+ both p < 0.03).
Figure 5.

AAV expressing human codon-optimized GAMT results in normalization of guanidinoacetic acid and creatine in plasma and urine of male and female Gamt-deficient mice
Blood was collected monthly to determine plasma levels of GAA and creatine in both male and female study mice. Comparing with WT (black) and untreated Gamt−/− littermate controls (red), mice administered AAV expressing human codon-optimized GAMT under a liver-specific promoter (blue) had normalization of both plasma GAA (A, males; B, females) and creatine (C, males; D, females) within 1 month of vector administration that persisted for the length of the study. Urine was collected every 3 months and demonstrated resolution of guanidinoacetic aciduria (E) and increase in urinary creatine (F) for the length of the study. Data represent means ± standard deviations, except in (E) and (F), where means ± standard errors of the mean are presented. For plasma samples, n = 4 all groups; for urine samples, n = 4–8 samples per group. Time 0 is pre-injection, as indicated by arrow.
In GAMT deficiency, urinary GAA (Figure 5E) is markedly elevated (Gamt+/+ [black] 0.87 ± 0.52 nmol/mL versus Gamt−/− [red] 10.34 ± 3.18 nmol/mL, p < 0.001) while creatine (Figure 5F) is reduced (Gamt+/+ [black] 2.12 ± 1.90 nmol/mL versus Gamt−/− [red] 0.04 ± 0.02 nmol/mL, p = 0.04). These are both normalized (blue data points) with hepatic-based gene therapy (GAA at 12 months: Gamt+/+ 1.67 ± 0.65 nmol/mL versus treated Gamt−/− 2.20 ± 1.08 nmol/mL [p = 0.49]; untreated Gamt−/− is 11.26 ± 2.19 nmol/mL [p = 0.005 compared to both]; creatine at 12 months: Gamt+/+ 4.06 ± 1.51 nmol/mL versus treated Gamt−/− 1.93 ± 1.42 nmol/mL [p = 0.054]; untreated Gamt−/− is 0.06 ± 0.01 nmol/mL [p < 0.01 compared to both]). (Urine samples, n = 4–8 samples per time point.)
Tissue levels of GAA are markedly elevated in Gamt−/− mice; these declined substantially with AAV-mediated restoration of the hepatic expression of enzyme (Figure 6): Brain (Figure 6A) 1,283.08 ± 474.46 nmol/g in Gamt−/− to 601.12 ± 231.37 nmol/g in treated Gamt−/− (12.38 ± 10.41 in Gamt+/+); heart (Figure 6B) 5,933.20 ± 1,920.99 nmol/g in Gamt−/− to 14.49 ± 5.82 nmol/g in treated Gamt−/− (7.38 ± 3.73 in Gamt+/+); kidney (Figure 6C) 896.74 ± 141.99 nmol/g in Gamt−/− to 285.22 ± 110.62 nmol/g in treated Gamt−/− (135.03 ± 18.31 in Gamt+/+); liver (Figure 6D) 1,735.30 ± 477.71 nmol/g in Gamt−/− to 47.56 ± 43.72 nmol/g in treated Gamt−/− (13.47 ± 4.89 in Gamt+/+); muscle (Figure 6E) 9,915.83 ± 3,502.52 nmol/g in Gamt−/− to 16.50 ± 5.47 nmol/g in treated Gamt−/− (4.77 ± 2.71 in Gamt+/+) (all p < 0.001 comparing untreated Gamt−/− with treated).
Figure 6.

AAV expressing human codon-optimized GAMT results in improvement in tissue levels of GAA while increasing creatine concentrations in male and female Gamt-deficient mice
GAA levels are markedly elevated in the brain (A), heart (B), kidney (C), liver (D), and skeletal muscle (E) of untreated Gamt−/− mice (red data points). Normalization of elevated GAA occurs with AAV-based hepatic gene therapy in the heart, liver, and skeletal muscle, with marked reductions in the brain and kidney. Creatine is nearly undetectable in brain (F), heart (G), kidney (H), liver (I), and skeletal muscle (J) in untreated Gamt−/− mice (red data points). Tissue levels are markedly improved, with complete restoration in the brain, heart and skeletal muscle in treated mice. Values represent means ± standard deviations. n = 3–8 per group. Red represents untreated Gamt−/− mice; blue represents treated Gamt−/− mice; black represents WT controls.
Mice also demonstrated a marked improvement in creatine levels in tissues: Brain (Figure 6F) 55.19 ± 12.21 nmol/g in Gamt−/− to 7,923.47 ± 1,601.89 nmol/g in treated Gamt−/− (8,510.81 ± 1,373.37 in Gamt+/+), p = 0.683 to Gamt+/+; heart (Figure 6G) 41.92 ± 13.58 nmol/g in Gamt−/− to 8,203.54 ± 2,356.80 nmol/g in treated Gamt−/− (8,225.95 ± 2,160.20 in Gamt+/+), p > 0.999 to Gamt+/+; kidney (H) 0.00 ± 0.00 nmol/g in Gamt−/− to 612.16 ± 132.63 nmol/g in treated Gamt−/− (868.65 ± 117.10 in Gamt+/+), p = 0.003 to Gamt+/+; liver (Figure 6I) 0.00 ± 0.00 nmol/g in Gamt−/− to 175.10 ± 37.40 nmol/g in treated Gamt−/− (195.18 ± 33.10 in Gamt+/+), p = 0.485 to Gamt+/+; muscle (Figure 6J) 180.18 ± 30.23 nmol/g in Gamt−/− to 17,519.90 ± 890.08 nmol/g in treated Gamt−/− (18,681.10 ± 2661.17 in Gamt+/+), p = 0.442 to Gamt+/+.
CNS metabolism and behavioral studies show resolution of deficits with gene therapy
Considering the importance of the creatine/phosphocreatine shuttle to cells with high-energy expenditures, we examined the uptake of glucose to the brain in Gamt-deficient mice. Fluorodeoxyglucose (18F-FDG)-positron emission tomography (PET) is a well-established non-invasive imaging tool for monitoring changes in cerebral brain glucose metabolism in vivo. To examine the restoration of hepatic Gamt and its effect as a treatment strategy in GAMT deficiency, we sought to examine the brain of this preclinical model. By measuring cerebral glucose metabolism with 18F-FDG-PET we can detect neuronal dysfunction in vivo as brain glucose metabolism is determined by synaptic activity mainly to restore membrane potentials.26 To semi-quantitate tissue activity, we determined the activity divided by the decay-corrected activity injected into the mouse; this ratio is defined as the percent-injected dose per cubic centimeter in tissue (%ID/cc). Gamt-deficient mice showed decreased glucose uptake (Figure 7A) (red data points, 5.52 ± 1.23 %ID/cc) compared to Gamt+/+ littermate controls (black data points, 8.84 ± 0.90 %ID/cc, p = 0.024). With the restoration of hepatic GAMT enzymatic activity, normalization of GAA levels, and restoration of creatine in plasma, uptake improves to 7.55 ± 1.17 %ID/cc (blue data points) (p = 0.389 compared to WT; n = 3 per group). This improved glucose uptake is visualized in the representative images of Figure 7B.
Figure 7.

Gamt deficiency reduced brain glucose consumption that is restored with gene transfer of GAMT to hepatocytes
(A) Quantitative analysis of Gamt-deficient mice (red data points), compared with WT controls (black data points), demonstrates reduced brain 18F-FDG uptake; this is rescued by gene therapy restoring hepatic expression in Gamt−/− littermates (blue data points). 18F-FDG uptake was measured by microPET imaging. (B) Representative microPET images of 18F-FDG uptake in the brains of WT (Gamt+/+), Gamt-deficient (Gamt−/−), and Gamt-deficient mice with gene therapy (treated Gamt−/−); the brain area is circled. (C) Quantitative analysis of individual areas of the brain. (D) Comparison of regular mouse chow, supplementation with oral creatine, and hepatic gene therapy (with quantitation [E]) and effect on 18F-FDG uptake in the brain as measured by microPET imaging. Values represent means ± standard errors. For (A), (C) and (E), n = 3 per group. Errors bars represent mean +/- standard deviation. FDG, fluorodeoxyglucose; %ID/cc, percent injected dose per cc tissue. ∗p < 0.05, ∗∗p < 0.01, and ∗∗∗p < 0.001; ns, not significant.
We similarly analyzed areas of the brain regarding the effect of GAMT deficiency and potential resolution with AAV-based hepatic gene therapy (Figure 7C). Almost all 20 brain areas examined demonstrated similar changes in 18F-FDG uptake compared to the whole-brain data. In the whole-brain data as above, 18F-FDG uptake by the untreated Gamt-deficient brain was reduced by 37.6% compared to the WT brain. Among the 20 brain areas, the most affected area was the thalamus, with a 43.8% decrease; the least affected area was the brainstem (29% decrease). While most areas were sufficiently rescued by gene therapy (to erase the statistical difference between WT and untreated Gamt−/−), the areas that were not include the globus pallidus, internal capsule, rest of midbrain, superior colliculus, amygdala, and basal forebrain.
We evaluated whether there was a substantial improvement in brain metabolism with the restoration of GAMT activity in hepatocytes with a gene therapy approach and compared this to present-day therapy with oral creatine supplementation. Regular chow was provided, followed by oral creatine supplementation, and later with AAV-based hepatic gene therapy (regular chow only), in which each mouse served as its own control (Figures 7D and 7E). In these studies, we did not detect a significant difference in brain metabolism with regular mouse chow followed by supplementation with oral creatine (5.24 ± 0.76% ID/cc versus 5.26 ± 1.10 %ID/cc, respectively; p > 0.05, not significant [ns]). However, with AAV administration, imaging demonstrated a 40.1% increase over regular chow with creatine supplementation (7.37 ± 0.92 %ID/cc; p < 0.05).
Behavioral testing was performed at 8 months of age (Figure 8) to analyze for abnormalities in learning and motor activity. While the murine biochemical abnormalities are comparable to humans with the disorder,9 there is only one previous study reporting behavioral data,24 and there mice did not display severe neurological abnormalities. To further explore for behavioral abnormalities and their potential resolution with liver-specific gene therapy, male and female WT, untreated Gamt−/−, and AAV-hcoGAMT-treated mice were subjected to testing in both learning and motor-based assessments.
Figure 8.

Behavioral testing in Gamt deficiency reveals a learning deficit, resolved with hepatic GAMT gene therapy
Behavioral testing was performed at 8 months of age (n = 8 per group). Untreated Gamt−/− mice showed deficits in learning, with an increase in primary latency to the escape hole (A and B), resolving with AAV-based gene therapy. Differences were present in distance traveled during acquisition (C and D). Short-term reference memory during the probe trial at 24 h showed no statistically significant difference in latency or distance traveled between the groups (E and F). However, at 1 week, testing longer term memory, primary latency for the untreated Gamt−/− mice was prolonged (G), but there was no difference in distance traveled (H). Using 1 of 3 search strategies in the Barnes maze (I), Gamt+/+ and treated Gamt−/− mice switch from using primarily non-hippocampal random (gray) and serial (orange) strategies to a more hippocampal-based direct strategy (blue) (J–M). In contrast, untreated GAMT−/− mice rely primarily on the serial search strategy, with reduced spatial pathway activity. In the probe trial at 24 h (O), untreated Gamt-deficient mice have reduced direct pathway activity, and by 1 week (P), a test of longer-term memory, the direct strategy is absent, unlike WT or treated Gamt−/− mice. Error bars represent mean +/- standard deviation.
The Barnes maze is a hippocampus-dependent learning and memory task, similar to the Morris water maze, where mice learn the relationship between distal spatial cues and a fixed escape location.27 During the acquisition phase, mice undergo four daily training trials. After 4 days, the escape tunnel is removed, and a probe trial is conducted to assess reference memory 24 h after the final training session (short-term memory) and 7 days after the final training session (long-term memory).
Untreated Gamt−/− mice showed deficits in learning, with an increase in primary latency to the escape hole, demonstrated by increased area under the curve (AUC) of the learning curve (see red data points in Figure 8A and red bar in Figure 8B) (p = 0.038 compared to WT mice). This was resolved with AAV-based liver-specific gene therapy (p = 0.916 compared to WT [blue data points]). There were also differences in distance traveled by mice during the acquisition phase (Figures 8C and 8D). Untreated Gamt−/− mice (red data points) travel a longer distance to reach the escape location compared to WT mice (black data points) (p = 0.024). The distance traveled is reduced in Gamt−/− mice treated with gene therapy (blue data points) and was not statistically different from WT controls (p = 0.119).
Examination of short-term reference memory during the probe trial at 24 h showed no statistically significant difference in latency or distance traveled between the groups (Figures 8E and 8F). However, at 1 week, again a test of longer term memory, the primary latency for the untreated Gamt−/− mice was prolonged (Figure 8G, red data points) when compared, approaching statistical significance (p = 0.074) to treated Gamt−/− mice. However, there was no difference in distance traveled (Figure 8H).
Mice are known to use one of three search strategies when looking for the escape hole: a direct strategy using extra-maze spatial cues, a serial strategy around the perimeter of the maze, or a random strategy (Figure 8). As learning progresses, Gamt+/+ and the treated Gamt−/− mice switch from using primarily non-hippocampal random (gray) and serial (orange) strategies, to a more hippocampal-based direct strategy. (Note the increase in the size of the blue proportion of activity from day 1 to day 4 in Gamt+/+ and treated Gamt−/− mice [from Figures 8J to 8M].) In contrast, untreated GAMT−/− mice rely primarily on the serial search strategy, with reduced spatial pathway activity by day 4 compared to both the Gamt+/+ mice. In the probe trial at 24 h (Figure 8O), untreated Gamt-deficient mice (middle bar) have reduced direct pathway activity compared to the treated-Gamt−/− mice and Gamt WTs; by 1 week (Figure 8P), a test of longer-term memory, the direct strategy is absent in untreated Gamt−/− mice (see middle bar). Here, mice rely primarily on the serial pathway and some random searching, the latter completely absent from WT or treated Gamt−/− mice (see Figure 8P, left and right bars).
The evaluation of muscle strength is an essential component of behavioral testing, particularly with concern for a neuromuscular disorder or to evaluate treatments on motor performance. Grip strength was studied to measure the neuromuscular function as maximal muscle strength of forelimbs and hind limbs. The mice were assessed by a mouse gently grasping a grid connected to a sensor. All of the values obtained were normalized against mouse body weight (Figure 9). For both forepaw (Figure 9A) and backpaw (Figure 9B) grip strength was reduced in untreated Gamt−/− mice (forepaws: 2.83 ± 0.25, backpaws: 3.40 ± 0.56 N/g) compared to Gamt+/+ WT controls (forepaws: 3.54 ± 0.49 [p = 0.002 compared to Gamt−/−], backpaws: 4.08 ± 0.51 N/g [p = 0.045 compared to Gamt−/−]). There was marked recovery with AAV-based liver-specific gene therapy (forepaws: 3.20 ± 0.34, backpaws: 4.07 ± 0.61 N/g), with no statistically detectable difference between treated Gamt knockout and WT mice (forepaws p = 0.171, backpaws p = 0.999) (n = 4 per group).
Figure 9.

Behavioral testing in Gamt deficiency reveals a motor abnormality, resolved with hepatic GAMT gene therapy
Gamt-deficient mice did demonstrate a reduction in grip strength of the (A) fore- and (B) hindpaws; these motor performance issues were resolved with the gene therapy approach (n = 8 per group). Error bars represent mean +/- standard deviation.
Discussion
GAMT deficiency (OMIM: 601240) is one of the more common creatine deficiency disorders. Creatine has a critical role in the energy metabolism of muscle and neurons, both tissues with high-energy demand, and serves as a phosphate energy buffer recycling ATP by the creatine/phosphocreatine system. Despite optimal present-day medical therapy, including protein restriction and ornithine supplementation, chronically elevated GAA levels have plagued some children and are likely responsible for persistent seizures, autistic features, and other cognitive abnormalities.5,18 While it has been hypothesized that GAA interacts with GABAA receptors,4,28 the exact mechanism of brain injury has not been completely elucidated; both diminished creatine and elevated GAA likely contribute to the neurological phenotype.9,29 Here, we sought to explore and have demonstrated a gene therapy approach for GAMT deficiency that allows for normal and stable plasma creatine levels with the control of plasma GAA.
The main findings of these studies demonstrate that the expression of human codon-optimized guanidinoacetate N-methyltransferase in hepatocytes of affected mice results in the sustained expression of hepatic GAMT with restoration of plasma creatine levels and resolution of hyperguanidinoacetic acidemia. Urinary GAA was normalized, and creatine levels were similar to WT controls. While brain creatine levels were restored, cerebral GAA was not completely normalized; this is likely due to the lack of restoration of brain GAMT expression, as the AAV vector is tissue limited to hepatocytes by the TBG promoter. The dose of vector administered is substantial, and while the TBG promoter has been associated with hepatocellular carcinoma at times when used in vectors administered to neonatal mice, we did not detect any tumors or other liver abnormalities in the mice in our study (when euthanized 12 months after vector administration at ∼14 months of age). While AAV8 may be the prototypical murine hepatotropic AAV, multiple other natural AAV serotypes are effective in transducing murine hepatocytes. These include AAV7, AAV9, and rh10, the latter being in the same clade (clade E) as serotype 8. We have successfully used serotype rh10 previously in murine hemophilia studies30 and murine arginase studies,31, 32, 33 and it was used here for hepatocyte transduction in Gamt deficiency. Nevertheless, animals thrived, with overall weight gain being similar to WT littermate controls, including improvement in adipose deposition. Glucose consumption in the brain, while reduced in Gamt-deficient mice, was normalized with hepatic-based gene therapy. Motor and learning abnormalities present in mice with marked hyperguanidinoacetic acidemia and low creatine levels, as detected in behavioral testing, were largely resolved.
While GAMT in humans is expressed in high amounts in skeletal muscle, liver, heart, and kidney, it is also expressed in the brain, albeit perhaps at lower levels;23 brain expression appears to be found predominantly in oligodendrocytes.34 The gene therapy approach in these studies used an adeno-associated viral vector expressing human GAMT under a liver-specific promoter, thus restricting expression to hepatocytes. It is evident from the data that this results in markedly improved and normalized creatine levels in the plasma, which is AAV dose dependent. In addition, hepatocytes in male mice express GAMT from AAV at higher levels than from hepatocytes in female mice, consistent with the androgen dependency of AAV transduction that has been demonstrated previously.25 There is some reduction in AAV genomes per hepatocyte from 1 month after administration to over 12 months at study completion. Hepatocyte turnover in the normal adult murine liver is slow overall, as the life span of a hepatocyte is from 200 to 400 days; this may in part be the cause of this reduction.35 Levels of creatine are also normalized in the brain, heart, kidney, liver, and skeletal muscle. While GAA levels are simultaneously controlled in the plasma, heart, liver, and skeletal muscle, the brain and kidney, although markedly reduced, have persistent GAA levels. Unlike the heart and skeletal muscle, where reduction in tissue GAA is likely from metabolic network flux through the plasma from reduction by the liver with restoration of GAMT enzymatic activity, this is less effective in the brain and kidney, where endogenous enzymatic activity may be necessary for metabolic flux to be optimal. Both of these tissues normally possess endogenous Gamt expression, which is not restored with an AAV vector limited by a liver-specific promoter. Altering the vector to express in more tissues may address mildly persistent levels in these two organs.
While these studies demonstrate that despite the comparable mouse weights when these investigations began at 2 months of age, Gamt−/− mice gain less with time than Gamt+/+ controls and, as the PET-CT images demonstrate, do not appear to be due to mouse length or skeletal differences. While a marked reduction in adipose tissue mass has been previously described in murine Gamt deficiency,23 the studies conducted herein demonstrate that with the restoration of GAMT expression, there is improvement in the absolute fat mass as compared to both untreated Gamt−/− and Gamt+/+ controls. As has been previously demonstrated,23 the reduction in fat mass does not appear to be related to changes in levels of leptin, insulin, or adiponectin levels. It is not known whether such reduced adiposity is present in GAMT-deficient patients.
Gamt-deficient mice in our studies demonstrated reduced brain glucose consumption; this was nearly resolved with hepatic-based GAMT gene therapy and was superior to mouse chow with creatine supplementation. In fact, the improvement in brain metabolism may be underestimated by the PET-CT studies. FDG uptake in the mouse brain decreases with age36,37 and this may have offset the signal increase that creatine supplementation may have provided and reduced the signal intensity with the gene therapy approach.
In GAMT-deficient patients, free ATP molecules and thus ATP levels in the brain are reported to be increased.38 High ATP levels inhibit glucose/fluorodeoxyglucose uptake and glycolysis through allosteric inhibition of phosphofructokinase,39,40 consistent with the observation in our data. Thus, it is not unexpected that some behavioral findings would be present in affected mice. While the murine biochemical abnormalities of high plasma and urinary GAA along with low creatine are comparable to those of humans with the disorder,9 there is only one previous study reporting behavioral data in the murine Gamt-deficient model.24 In that report, Gamt−/− mice did not display severe neurological abnormalities; there was no gross ataxia or seizures.23 With more detailed investigation, the authors found that Gamt-deficient mice did show an inconspicuous finding of impaired retrieval of learned information;24 overall, this identified a subtle cognitive deficit. In the behavioral assays performed as part of this investigation, we found several previously undescribed abnormalities. Using the Barnes maze, a hippocampal-dependent task similar to the Morris water maze, allowed for testing the ability of mice to learn the relationship between distal cues and a fixed escape location.27 In these studies, we detected evidence of a learning deficit during the acquisition phase. Compared to the Gamt+/+ mice, the untreated Gamt−/− mice acquire more slowly, having an abnormality in primary latency; untreated Gamt−/− mice also travel a longer distance to reach the escape location. These abnormalities in primary latency and distance traveled are resolved with AAV-based gene therapy. While the examination of short-term memory lacked a statistically significant difference in latency, distance traveled, or search strategy in Gamt-deficient mice, in tests of longer-term memory, the primary latency for the untreated Gamt−/− mice was prolonged approaching statistical significance. In addition, untreated Gamt−/− mice used a search strategy relying exclusively on serial and random methods, while Gamt+/+ mice and treated Gamt−/− mice used a direct or spatial method as a much larger component of their search strategy. Together, these findings suggest an abnormality in long-term memory that is largely resolved with AAV-based hepatic gene therapy even with incomplete resolution of brain GAA levels.
While gross ataxia was not detected in Gamt-deficient mice, motor abnormalities were present. While our studies were likely underpowered to detect statistically significant abnormalities in cerebellar function by rotarod testing (data not shown), Gamt-deficient mice did demonstrate a reduction in the grip strength of the fore- and hindpaws; these motor performance issues were resolved with the gene therapy approach.
In conclusion, these studies in developing a gene therapy method for GAMT deficiency led to the resolution of the majority of biochemical abnormalities in plasma, tissues, and urine. Behavioral abnormalities in learning and motor activities, not previously reported in a murine model of the disorder, and abnormal brain metabolism were resolved with a gene therapy approach. GAA levels did not completely normalize in the brain; a more effective approach may include a ubiquitous promoter and a serotype that has an increased ability to cross the blood-brain barrier. Additional alterations in the vector construct may also allow for a decreased dose of administration. This first successful application of AAV-based gene therapy to GAMT deficiency suggests a path forward for the clinical development of a gene therapy vector.
Materials and methods
Molecular cloning
Full-length hcoGAMT transcript variant 1 was synthesized and subcloned into pUC57-Simple vector by GenScript Biotech (Piscataway, NJ). The transgene containing 711 bp of hcoGAMT preceded by the Kozak sequence (GCCACC) was excised and subcloned into the pENN-AAV-TBG vector (provided by Julie Johnston PhD, University of Pennsylvania Vector Core) using MluI and KpnI restriction sites by standard molecular biology techniques. After confirmation of the transgene cloning using restriction digestion and Sanger sequencing (5′-ACGAATTGCTTCCGAGTGAGAGA-3′ and 5′-AAACTGGGCTTGTCGAGACAGAG-3′), plasmid DNA (AAVrh10.TBG.PI.hGAMT-TV1co.rBG) was prepared using an EndoFree Plasmid Mega Kit (cat. no. 12,381, Qiagen, Hilden, Germany).
The following is the complete hcoGAMT sequence:
ATGTCCGCCCCTTCAGCCACCCCCATCTTCGCCCCCGGGGAAAACTGTAGTCCAGCATGGGGCGCCGCACCAGCCGCCTACGATGCCGCCGACACACACCTTAGGATTCTGGGTAAACCTGTAATGGAACGATGGGAGACCCCCTATATGCACGCACTCGCAGCCGCCGCCTCTTCCAAAGGAGGGCGCGTTCTTGAAGTCGGCTTTGGAATGGCGATCGCAGCTTCAAAGGTTCAGGAGGCCCCTATTGATGAGCATTGGATAATTGAATGTAATGATGGTGTGTTTCAGAGATTGCGGGATTGGGCCCCAAGACAAACACACAAGGTTATACCTCTTAAAGGACTGTGGGAAGACGTCGCGCCAACTCTCCCTGATGGACACTTTGACGGCATTTTGTATGACACCTACCCCCTCTCCGAAGAAACATGGCACACGCATCAGTTCAACTTTATTAAAAATCACGCTTTTCGACTCCTCAAACCGGGTGGAGTCCTCACATACTGCAACTTGACATCTTGGGGTGAACTTATGAAATCTAAATATTCCGATATCACCATAATGTTCGAGGAGACCCAAGTGCCAGCGCTCCTTGAGGCCGGTTTTAGACGCGAAAACATCAGAACTGAAGTCATGGCGCTTGTGCCCCCCGCCGATTGCCGCTATTATGCCTTTCCTCAAATGATTACCCCACTTGTGACAAAAGGTTAG. A comparison with the codon-optimized sequence is in Figure S1.
AAV vector development
Recombinant serotype rh10 adeno-associated viral vectors were produced at the University of Pennsylvania Vector Core (Philadelphia, PA), as previously described.41 In brief, polyethylenimine as a transfection agent was used to transfect AAV cis, AAV trans, and adenovirus helper plasmids into HEK 293 cells. Three days post-transfection, culture supernatants were collected and AAV particles were then purified by ultracentrifugation iodixanol step gradient. Viral titering by genome copy number was performed by digital droplet PCR using a sequence from the polyadenylation signal.
Mouse procedures
The constitutive guanidinoacetate methyltransferase knockout mouse (Gamt−/−, B6.Cg-Gamttm1Isb)23 was obtained from Dr. Jeff Huang (Department of Biology, Georgetown University, Washington, DC) (Material transfer agreement obtained from Dr. Dirk Isbrandt, University of Cologne, Cologne, Germany) that had been maintained on the C57BL/6 background and was used for these studies. The procedures conducted were approved by the the UCLA Chancellor's Animal Research Committee, These mice were housed at UCLA under specific pathogen-free conditions; food and water were provided ad libitum and there were no periods of fasting. Mice were fed mouse chow free of animal fat or protein sources (Labdiet/PMI Nutrition International, St. Louis, MO [Picolab Selected Mouse 30 IF/9F, 5V5M]). Mice underwent genotyping by collecting a small ear clip and performing PCR. Every attempt was made to include equal numbers of male and female mice with littermate controls. At 8–12 weeks of age, mice were administered 1 × 10¹⁴ GC/kg AAVrh10-TBG-hcoGAMT by intravenous injection; AAV was diluted in sterile pharmaceutical grade normal saline for injection. Mice were weighed weekly, blood was sampled by retroorbital collection under isoflurane anesthesia monthly, and urine was collected every 3 months. Mice were euthanized at 12 months by isoflurane overdose; tissues were collected and snap frozen with liquid nitrogen. Creatine (Sigma-Aldrich, St. Louis, MO) was supplemented by oral gavage, dissolved in water.
Genotyping PCR
Ear tissue snip was obtained and genomic DNA isolated and purified (Extracta DNA Prep for PCR-Tissue, cat # 95,091, Quantabio, Beverly, MA). PCR was performed using AccuStart II GelTrack PCR SuperMix (QuantaBio, #89235). The primer sequences were Forward GAMT Primer: mGAMT 60nc 5′-CCTCAGGCTCCCACCCACTTG-3′; WT Reverse GAMT Primer: mGAMT 59nc 5′-GGTCTCCCAACGCTCCATCACT-3′; Knockout Reverse GAMT Primer: mGAMT 56nc 5′-AGGCCTACCCGCTTCCATTG-3′. PCR conditions were performed for 35 cycles: 94°C × 30 s, 63°C × 30 s, 72°C for 30 s. The WT amplicon was 265 bp and the mutant amplicon was 430 bp.
Anti-AAV ELISA
A number of 96-well plates were coated overnight at 4°C with 1 × 10⁹ GC of AAVrh10 vector preparations per well in PBS. UV light was used for 30 min to inactivate the AAV. Plates were then washed with 1X PBS +5% Tween 4 times followed by the addition of 200 μL blocking buffer (1X PBS + 5% fetal calf serum [FCS]) per well and incubated at 37°C for 2 h. Plates were then washed with 1X PBS +5% Tween 4 times, followed by the addition of a 100-μL diluted plasma sample per well with incubation at 37°C for 2 h. Plates were washed with 1X PBS +5% Tween 4 times, followed by the addition of 50 μL 1:1,000 diluted horseradish peroxidase (HRP)-conjugated anti-mouse immunoglobulin G (IgG) (Thermo Fisher, Waltham, MA) to each well and were incubated at 37°C for 1 h. Wells were washed with 1X PBS +5% Tween 6 times. Color development was then performed with the addition of 50 μL OPD substrate followed by incubation at room temperature (RT) for 4 min. The reaction was then stopped by adding 50 μL 2.5M H2SO4 and the plate was read at a wavelength of 492 nm. Positive control sera were obtained from serum samples of adult mice that had been injected with AAV and had previously anti-AAV antibody levels. AAV-treated animals (n = 5) and uninjected controls (n = 5) were tested 4 months after administration.
Analysis of metabolic profile from urine and plasma
The concentrations of guanidino compounds, including creatine, creatinine, and guanidinoacetic acid, were determined in plasma or urine samples using Agilent 1260 liquid chromatography (LC) combined with triple-quad 6410B mass spectrometry (MS) (Santa Clara, CA). Briefly, 10 μL 1 mM internal standard (IS) epsilon amino caproic acid (EACA) was added to 10 μL plasma or urine sample. For measuring creatinine, samples were deproteinized, dried down, and reconstituted in 0.1% formate in H2O (solution A) and used for analysis by LC-MS. For measuring creatine and GAA, the plasma or urine sample was derivatized with 3N HCl-butanol, heated for 15 min at 60°C, then dried and reconstituted with 100 μL solution A for LC-MS analysis. Separation was performed with Agilent Poroshell 120 EC-C18 column, with the mobile phase consisting of solution A and solution B (0.1% formate in acetonitrile and 0.005% Trifluoroacetic acid). For underivatized samples, we used multiple reaction monitoring (MRM), 114-44 and 132-41, for creatinine and IS, respectively. For derivatized samples, we used MRM, 188-44, 188-69, and 174-101 for creatinine, GAA, and IS, respectively.
ALT and AST were determined at the Children’s Hospital of Philadelphia (CHOP) Metabolomic Core using kits from BioVision (Milpitas, CA). (ALT Catalog #K752-100, AST kit cat. no. 753-100). Analyses were performed per the manufacturer’s instructions, with the final measurement completedwith a PerkinElmer spectrometer.
Analysis of metabolic profile from tissues
Reagents
Formic acid LC-MS grade and methanol high-performance liquid chromatography (HPLC) grade were purchased from Fisher Scientific (Ottawa, ON, Canada). Trichloroacetic acid (TCA) was supplied by VWR International (Radnor, PA) and butanol·HCl (3M) was from Regis (Morton Grove, IL). Chemicals for calibrators and ISs, GAA, l-arginine (Arg), creatine, creatinine (CTN), ornithine-d6, arginine-d7, creatine-d3, and creatinine-d3 were purchased from Sigma-Aldrich Canada (Oakville, ON, Canada). Tubes for tissue homogenization, VWR 2 mL × 2.8 mm Ceramic Hard Tissue Homogenizing Mix and VWR 2 mL × 1.4 mm Ceramic Soft Tissue Homogenizing Mix were purchased from VWR International.
Tissue metabolites preparation
A total of 30–60 mg flash frozen kidney, heart, or muscle were placed in a 2-mL tube containing 2.8 mm ceramic beads, and liver or brain into a 2-mL tube containing 1.4 mm ceramic beads. Tubes were filled with 1 mL cold water and processed on Omni Bead Raptor Elite at 5.65 m/s for 2 cycles of 1 min with a 10-s dwell time for kidney, heart, and muscle and 4.85 m/s for 1 cycle of 20 s for liver and brain. Tissue homogenates, 300 μL, were mixed with 75 μL 30% TCA, vortexed, and spun down at 130,00× rpm for 5 min to precipitate the proteins. The cleared tissue homogenates were transferred into Eppendorf tubes and stored at −80°C or processed immediately for metabolites extraction. To extract metabolites for LC-MS/MS, 10 μL of the cleared tissue homogenate was mixed with 10 μL of the IS and 500 μL methanol. All of the tubes were vortexed and spun down at 130,00× rpm for 5 min. The supernatant was transferred into a clean glass test tube and loaded onto the Microvap (Organomation, Berlin, MA) at 37°C to evaporate the excess solvent. Dry residue was dissolved in 100 μL butanol·HCl (3M) by vortexing and incubated at 60°C for 30 min. After cooling to RT, derivatized samples were transferred onto the Microvap at 37°C to evaporate the excess solvent. Dry residue was resuspended in 700 μL methanol and transferred into a 2-mL glass vial.
LC-MS/MS
The method for CT metabolites analysis on LC-MS/MS was adapted with slight modifications from Tran at el.42 The LC-MS/MS system consisted of an ExionLC AD UHPLC system coupled with QTRAP 6500plus (AB Sciex, Framingham, MA). The metabolites separation was achieved using gradient binary elution at a flow rate of 0.7 mL/min and a temperature at 45°C on a Kinetex C18 100-Å, 5-μm, 100 × 4.6-mm LC column (Phenomenex, Torrance, CA). Solvent A consisted of 0.5 mmol/L ammonium formate, 0.1% (v/v) formic acid in water, and solvent B consisted of 0.5 mmol/L ammonium formate, 0.1% (v/v) formic acid in methanol. The mobile phase was used at 100% A at 0 min, 100% B at 5.0 min, 100% B at 7.5 min, 100% A at 7.55 min, and 100% A at 10 min. The injection volume was 1 μL. The MS was performed at the positive ionization and MRM scan mode. The optimal ion transitions were as follows: creatine, 188.2 → 90.0; CTN, 114.2 → 44.0; GAA, 174.2 → 101.1; ARG, 231.2 → 172.2; ORN, 189.2 → 70.1; creatine-d3, 191.2 → 93.0; creatinine-d3, 117.2 → 47.0; guanidinoacetate-d2, 176.2 → 103.1; arginine-d7, 238.2 → 179.2; and ornithine-d6, 195.2 → 76.1. The ion source parameters were set at temperature 600°C; de-clustering potential, 60.0; capillary voltage, 5,500 V; curtain gas, 30; GS1, 30; and GS2, 20. Data processing and quantification was performed using Analyst 1.7.0 software (AB Sciex).
Calibrators and IS for LC-MS/MS
Calibrator stock solutions were prepared by individually weighing compounds using an analytical balance and dissolving each in water at concentrations of 5 mM for creatine, ORN, ARG, and CTN and 0.1 mM for GAA. Working solutions of calibrators were prepared from stocks by serial dilution to achieve final concentrations of 500, 250, 100, 50, 25, 10, 5, 2.5, and 0 μM for creatine, ORN, ARG, and CTN and 10, 5, 2, 1, 0.5, 0.25, 0.1, 0.05, and0 μM for GAA. The IS was prepared as a mixture of ornithine-d6, arginine-d7, creatine-d3, and creatinine-d3 at a concentration of 100 μM and guanidinoacetate-d2 at a concentration of 10 μM in water. Calibrators and the IS were stored at −20°C until use. Analytes were quantified using the signal intensity ratio of the compound to its IS and related to external calibration using the signal intensity ratio of the calibrator to its IS.
Western blot
General preparation of the protein samples and western blotting were carried out as described.43 Briefly, liver specimens were homogenized in radioimmunoprecipitation assay (RIPA) buffer containing Halt Protease Inhibitor Cocktail (cat. no. 78430, ThermoFisher, Waltham, MA) to isolate proteins. Total protein extract, 50 μg, quantified with Bio-Rad Protein Assay Dye (cat. no. 5000006, BioRad, Hercules, CA), were separated by SDS-PAGE and probed with human GAMT antibody (Abcam, Cambridge, UK, cat. no. ab126736; 1:1,000 dilution). HRP-conjugated β-actin antibody (Santa Cruz Biotechnology, Dallas, TX, cat. no. sc-47778; 1:5,000) was used as loading control. hGAMT was labeled by HRP-conjugated goat anti-rabbit IgG (Santa Cruz Biotechnology, cat. no. sc-2004; 1:5,000), and targeted proteins were detected using SuperSignal West Pico PLUS Chemiluminescent Substrate (cat. no. PI34579, ThermoFisher).
In situ hybridization
RNAscope in situ hybridization was performed using the Bond RX platform (Leica Biosystems) and the RNAscope 2.5 L reagent kit (Advanced Cell Diagnostics [ACD]) according to the manufacturer’s protocol (document no. 322750-USM). Briefly, freshly cut 4-μm-thick paraffin sections were stained. Following heat-induced epitope retrieval (HIER) (ACD HIER 15 min with ER2 at 95°C) and proteinase digestion (ACD 15 min protease), the slides were incubated for 2 h at 40°C with hGAMT-codon-No-XMm-C1 (ACD-ref. 1003128-C1). Amplification steps were performed according to the ACD protocol. The chromogen was detected with the ACD RNAscope 2.5LSx Reagent Kit-RED (ACD, cat. no. 322750). All stained slides were scanned at high magnification (400×) using a whole-slide scanning microscope (Aperio, Leica Biosystems).
GAMT qRT-PCR
Livers were removed from mice, and specimens were snap frozen in liquid nitrogen after being placed in Eppendorf tubes. RNA was extracted from livers with the RNeasy Fibrous Tissue Mini Kit according to the manufacturer’s instructions (Qiagen, 74704). Briefly, tissue was homogenized in buffer and then digested with proteinase K before extracting the supernatant containing unpurified RNA. RNA was then isolated by RNeasy column extraction, and pure RNA was eluted with RNase-free water.
Once RNA was extracted, cDNA was synthesized with Applied Biosystems High-Capacity cDNA Reverse Transcription Kit with RNase Inhibitor Kit (ThermoFisher, cat. no. 43-749-66) following the manufacturer’s instructions. Quantitative RT-PCR was performed using SYBR Green Supermix (BioRad, cat. no. 17256274) and primers specific for the hcoGAMT, taking advantage of base pair differences in exon 1 between the human and mouse variants of GAMT (MluI 19 F [CACACCTTAGGATTCTGGGT] and MluI R 3 [CCTCCTGAACCTTTGAAGC]) were synthesized. Primers for β-actin (mBeta-actin F [CTAAGGCCAACCGTGAAAAG] and mBeta-actin R [ACCAGAGGCATACAGGGACA]) were used as a reference gene. qRT-PCR was performed for 40 cycles at a melting temperature of 56°C. Fold changes using the −ΔΔCt method were calculated. Animals as n = 5 per group with males and females equally represented overall (20 mice).
AAV copy-number determination
Unfixed livers were homogenized and DNA was extracted according to the manufacturer’s instructions (Qiagen, cat. no. 56605223). Standards were made using serial dilution of the parental viral plasmid. Both standards and extracted DNA were then loaded onto 96-well PCR plates (USA Scientific, cat. no. 21034). qPCR was then performed according to protocol, detected by SYBR Green (Bio-Rad, cat. no.1725174). The vector copy number per diploid genome was calculated from equations obtained from the standards and their Ct values. The average of mice per group was used for comparisons.
Histology and immunohistochemistry of liver
Portions of explanted livers from euthanized animals were fixed in 10% neutral buffered formalin (v/v) for 48 h and subsequently stored in 70% ethanol. Standard procedures were used for processing and paraffin embedding of the tissues. Paraffin-embedded sections were cut at 4μm thickness and paraffin removed with xylene and rehydrated through graded ethanol. Endogenous peroxidase activity was blocked with 3% hydrogen peroxide in methanol for 10 min. HIER was carried out for all of the sections in 0.001 M EDTA buffer, pH 8.00 using a Biocare decloaker at 95°C for 25 min. The slides were then stained with anti-GAMT antibody (cat. no. ab126736, 1-100, Abcam); the signal was detected using the Dakocytomation Envision⊕ System Labeled Polymer HRP anti-rabbit (Agilent K4003, ready to use). All of the sections were visualized with the diaminobenzidine reaction and counterstained with hematoxylin.
microPET/microCT imaging
Animals were anesthetized with 1.5% vaporized isoflurane, and injected with 18F-FDG via tail vein. After 60 min 18F-FDG uptake under conscious conditions, animals underwent microPET imaging (10 min static data acquisition) immediately followed by microCT imaging using the Genisys8 PET/CT scanner (Sofie Biosciences, Culver City, CA). PET data were decay corrected, and attenuation correction was performed using the CT images. Co-registered PET/CT data were analyzed and quantified using AMIDE software. Fat tissues in the CT scans were visualized in the 3D mode using the ORS Dragonfly software. Quantification of FDG uptake in individual areas of the brain was performed using the mouse brain atlas previously developed.44
Behavioral testing
All behavioral testing included 8 mice per group (4 male and 4 female).
Grip strength
The grip strength of the mice was assessed to examine muscle strength and stamina. Fore- and hindlimb strength was measured using a customized grip strength meter (Chantillon apparatus, Ametek, Largo, FL) mounted on a Plexiglas weighted base. Five trials were completed for the forelimbs and the hindlimbs, with at least 1 min of rest between trials. Mice had at least 30 min of rest between the forelimb and hindlimb grip strength tests. For both tests, the maximum force was recorded in Newtons. For the forelimb test, the wire mesh grid grip was attached to the grip meter so that it would be parallel to the table surface. The mouse was lifted by the tail and lowered so that the forelimbs were grasping the mesh grid and then pulled away from the meter parallel to the table by the base of the tail rapidly. The results were then recorded, and after 1 min, the test was repeated until 5 trials were achieved. For the hindlimb test, the mesh grid grip was adjusted to sit at a 45° angle from the line of the table. The mouse was again held by the base of the tail and allowed to grip the mesh grid with the hindlimbs. The angle prevented it from gripping with the forepaws. The mouse was then pulled parallel to the table in a quick manner. After 1 min, the test was repeated until 5 trials were achieved.
Barnes maze
Mice were trained on the Barnes maze as described previously.45,46 The maze consisted of a gray, non-reflective circular platform (91 cm diameter; Stoelting, Wood Dale, IL) with 20 holes around the perimeter (5 cm diameter). Nineteen holes contained shallow, false-escape bottoms and one hole had the escape box. The arena was located in the center of the room with many extra-maze visual cues, including black and white geometric signs, two large lamps for bright light, and a speaker for producing white noise.
Each day, the mice were tested in squads of 4. Mice were placed on the center of the table under a 2-L beaker for 30 s before the start of the trial. The first day consisted of one 5-min habituation trial under low light (<20 lux) with no escape and 2 trials under bright light, in which the mouse was guided to the escape box after 3 min of free exploration. Days 2–4 consisted of four 90-s trials with an inter-trial interval of ∼15 min, under bright lighting and white noise. The location of the escape box randomly varied by squad, but remained the same for each squad across training days. If mice did not enter the escape box by the end of the trial, then they were guided to the escape box by the experimenter. Once the mouse entered the escape box, they were left for 30 s before being returned to their home cage. On days 6 and 13, mice were given a probe trial to assess short- and long-term memory, respectively. For the probe trial, all of the holes contained the false-escape bottom, and mice were allowed to explore for 90 s.
All of the videos were recorded and analyzed using AnyMaze software (Stoelting). Because mice are more hesitant to enter the escape box, latency to head-first entry (i.e., primary latency) into the escape box was used to assess learning.45 In addition, each training trial was scored for the approach used to find the hole (e.g., direct, serial, random). A direct approach was scored when the mouse moved toward the escape (within 2 holes of the escape box), and likely reflects the use of extra-maze cues and spatial memory to find the escape. A serial approach was scored when the mouse approached a hole more than two holes from the escape box and continued around the perimeter of the maze to find the escape. A random approach was scored when the mouse was more than two holes from the escape box and visited no more than three holes in a row to find the escape.
Statistical evaluation
All of the collected data were analyzed with the GraphPad Prism version 9.0.1 (GraphPad Software, San Diego, CA) statistical package. All of the numerical data were expressed as means ± SDs, except where noted otherwise, and p values, considered significant when <0.05, were determined using one-way ANOVA with Tukey’s multiple comparison test (i.e., for quantitative real-time PCR), or two-way ANOVA with Dunnett’s multiple comparison test. The error bars represent SDs.
Acknowledgments
The authors thank Oskana Horyn, Ilana Nissim, and Daikhin Evgueni for performing the plasma and urine metabolite measurements in the Metabolomics Core Facility, Children’s Hospital of Philadelphia. The authors also thank the Semel Institute for Neuroscience and the Intellectual and Developmental Disabilities Research Center at UCLA for their support. The Crump Preclinical Imaging Technology Center is supported by the JCCC Cancer Center Support Grant (CCSG) (NIH/NCI). This work was supported by NIH grant R01NS110596, to G.S.L. Additional funding was provided by the Association for Creatine Deficiencies to support these studies; however, all of the experimental design and data interpretation was performed independently. The authors also thank Heidi Wallis for helpful discussions.
Author contributions
S.K. performed the experiments and analyzed the data; J.L. designed and performed the experiments, performed the statistical analysis, and analyzed the data; M.N., M.T., A.E., Y.Z., P.P., and I.T. performed the experiments and analyzed the data; E.N. and C.T.L. analyzed the data and critically reviewed the manuscript; Y.L. and I.Z. performed the experiments; L.M.L., S.X., and I.N. performed the experiments, analyzed the data, and critically reviewed the manuscript; A.S. critically reviewed the data and manuscript; and G.S.L. developed the concepts, designed the experiments, performed the experiments, analyzed the data, and wrote the manuscript.
Declaration of interests
G.S.L. has served as a consultant to Audentes Therapeutics and is on the scientific advisory board (SAB) of Taysha in areas unrelated to this work. A.S. has served as consultant to and has received research funds from Aeglea BioTherapeutics. He is on the SAB of and has received fellowship grants from the Association of Creatine Deficiencies. All of the other authors declare no competing interests.
Footnotes
Supplemental information can be found online at https://doi.org/10.1016/j.omtm.2022.03.015.
Supplemental information
References
- 1.Wallimann T., Wyss M., Brdiczka D., Nicolay K., Eppenberger H.M. Intracellular compartmentation, structure and function of creatine kinase isoenzymes in tissues with high and fluctuating energy demands: the 'phosphocreatine circuit' for cellular energy homeostasis. Biochem. J. 1992;281:21–40. doi: 10.1042/bj2810021. [DOI] [PMC free article] [PubMed] [Google Scholar]
- 2.Wyss M., Kaddurah-Daouk R. Creatine and creatinine metabolism. Physiol. Rev. 2000;80:1107–1213. doi: 10.1152/physrev.2000.80.3.1107. [DOI] [PubMed] [Google Scholar]
- 3.Almeida L.S., Salomons G.S., Hogenboom F., Jakobs C., Schoffelmeer A.N. Exocytotic release of creatine in rat brain. Synapse. 2006;60:118–123. doi: 10.1002/syn.20280. [DOI] [PubMed] [Google Scholar]
- 4.Neu A., Neuhoff H., Trube G., Fehr S., Ullrich K., Roeper J., Isbrandt D. Activation of GABA(A) receptors by guanidinoacetate: a novel pathophysiological mechanism. Neurobiol. Dis. 2002;11:298–307. doi: 10.1006/nbdi.2002.0547. [DOI] [PubMed] [Google Scholar]
- 5.Hanna-El-Daher L., Beard E., Henry H., Tenenbaum L., Braissant O. Mild guanidinoacetate increase under partial guanidinoacetate methyltransferase deficiency strongly affects brain cell development. Neurobiol. Dis. 2015;79:14–27. doi: 10.1016/j.nbd.2015.03.029. [DOI] [PubMed] [Google Scholar]
- 6.Wallimann T., Tokarska-Schlattner M., Schlattner U. The creatine kinase system and pleiotropic effects of creatine. Amino Acids. 2011;40:1271–1296. doi: 10.1007/s00726-011-0877-3. [DOI] [PMC free article] [PubMed] [Google Scholar]
- 7.Sinha A., Ahmed S., George C., Tsagaris M., Naufer A., von Both I., Tkachyova I., van Eede M., Henkelman M., Schulze A. Magnetic resonance imaging reveals specific anatomical changes in the brain of Agat- and Gamt-mice attributed to creatine depletion and guanidinoacetate alteration. J. Inherit. Metab. Dis. 2020;43:827–842. doi: 10.1002/jimd.12215. [DOI] [PubMed] [Google Scholar]
- 8.Schulze A. Creatine deficiency syndromes. Mol. Cell Biochem. 2003;244:143–150. [PubMed] [Google Scholar]
- 9.Stockler S., Marescau B., De Deyn P.P., Trijbels J.M., Hanefeld F. Guanidino compounds in guanidinoacetate methyltransferase deficiency, a new inborn error of creatine synthesis. Metabolism. 1997;46:1189–1193. doi: 10.1016/s0026-0495(97)90215-8. [DOI] [PubMed] [Google Scholar]
- 10.Schulze A., Bachert P., Schlemmer H., Harting I., Polster T., Salomons G.S., Verhoeven N.M., Jakobs C., Fowler B., Hoffman G.F., et al. Lack of creatine in muscle and brain in an adult with GAMT deficiency. Ann. Neurol. 2003;53:248–251. doi: 10.1002/ana.10455. [DOI] [PubMed] [Google Scholar]
- 11.Arias A., Corbella M., Fons C., Sempere A., Garcia-Villoria J., Ormazabal A., Poo P., Pineda M., Vilaseca M.A., Campistol J., et al. Creatine transporter deficiency: prevalence among patients with mental retardation and pitfalls in metabolite screening. Clin. Biochem. 2007;40:1328–1331. doi: 10.1016/j.clinbiochem.2007.07.010. [DOI] [PubMed] [Google Scholar]
- 12.Braissant O., Henry H., Beard E., Uldry J. Creatine deficiency syndromes and the importance of creatine synthesis in the brain. Amino Acids. 2011;40:1315–1324. doi: 10.1007/s00726-011-0852-z. [DOI] [PubMed] [Google Scholar]
- 13.Viau K.S., Ernst S.L., Pasquali M., Botto L.D., Hedlund G., Longo N. Evidence-based treatment of guanidinoacetate methyltransferase (GAMT) deficiency. Mol. Genet. Metab. 2013;110:255–262. doi: 10.1016/j.ymgme.2013.08.020. [DOI] [PubMed] [Google Scholar]
- 14.Mercimek-Mahmutoglu S., Pop A., Kanhai W., Fernandez Ojeda M., Holwerda U., Smith D., Loeber J., Schielen P.C., Salomons A pilot study to estimate incidence of guanidinoacetate methyltransferase deficiency in newborns by direct sequencing of the GAMT gene. Gene. 2016;575:127–131. doi: 10.1016/j.gene.2015.08.045. [DOI] [PubMed] [Google Scholar]
- 15.Mercimek-Mahmutoglu S., Ndika J., Kanhai W., de Villemeur T.B., Cheillan D., Christensen E., Dorison N., Hannig Y., Hofstede F.C., Lion-Francois L., et al. Thirteen new patients with guanidinoacetate methyltransferase deficiency and functional characterization of nineteen novel missense variants in the GAMT gene. Hum. Mutat. 2014;35:462–469. doi: 10.1002/humu.22511. [DOI] [PubMed] [Google Scholar]
- 16.Desroches C.L., Patel J., Wang P., Minassian B., Marshall C.R., Salomons G.S., Mercimek-Mahmutoglu S. Carrier frequency of guanidinoacetate methyltransferase deficiency in the general population by functional characterization of missense variants in the GAMT gene. Mol. Genet. Genomics. 2015;290:2163–2171. doi: 10.1007/s00438-015-1067-x. [DOI] [PubMed] [Google Scholar]
- 17.Schulze A., Ebinger F., Rating D., Mayatepek E. Improving treatment of guanidinoacetate methyltransferase deficiency: reduction of guanidinoacetic acid in body fluids by arginine restriction and ornithine supplementation. Mol. Genet. Metab. 2001;74:413–419. doi: 10.1006/mgme.2001.3257. [DOI] [PubMed] [Google Scholar]
- 18.Stockler-Ipsiroglu S., van Karnebeek C., Longo N., Korenke G.C., Mercimek-Mahmutoglu S., Marquart I., Barshop B., Grolik C., Schlune A., Angle B., et al. Guanidinoacetate methyltransferase (GAMT) deficiency: outcomes in 48 individuals and recommendations for diagnosis, treatment and monitoring. Mol. Genet. Metab. 2014;111:16–25. doi: 10.1016/j.ymgme.2013.10.018. [DOI] [PubMed] [Google Scholar]
- 19.Vodopiutz J., Item C.B., Hausler M., Korall H., Bodamer O.A. Severe speech delay as the presenting symptom of guanidinoacetate methyltransferase deficiency. J. Child Neurol. 2007;22:773–774. doi: 10.1177/0883073807304015. [DOI] [PubMed] [Google Scholar]
- 20.Braissant O. Creatine and guanidinoacetate transport at blood-brain and blood-cerebrospinal fluid barriers. J. Inherit. Metab. Dis. 2012;35:655–664. doi: 10.1007/s10545-011-9433-2. [DOI] [PubMed] [Google Scholar]
- 21.Battini R., Alessandri M.G., Casalini C., Casarano M., Tosetti M., Cioni G. Fifteen-year follow-up of Italian families affected by arginine glycine amidinotransferase deficiency. Orphanet J. Rare Dis. 2017;12:21. doi: 10.1186/s13023-017-0577-5. [DOI] [PMC free article] [PubMed] [Google Scholar]
- 22.Hirayasu Y., Morimoto K., Otsuki S. Increase of methylguanidine and guanidinoacetic acid in the brain of amygdala-kindled rats. Epilepsia. 1991;32:761–766. doi: 10.1111/j.1528-1157.1991.tb05531.x. [DOI] [PubMed] [Google Scholar]
- 23.Schmidt A., Marescau B., Boehm E.A., Renema W.K., Peco R., Das A., Steinfeld R., Chas S., Wallis J., Davidoff M., et al. Severely altered guanidino compound levels, disturbed body weight homeostasis and impaired fertility in a mouse model of guanidinoacetate N-methyltransferase (GAMT) deficiency. Hum. Mol. Genet. 2004;13:905–921. doi: 10.1093/hmg/ddh112. [DOI] [PubMed] [Google Scholar]
- 24.Torremans A., Marescau B., Possemiers I., Van Dam D., D'Hooge R., Isbrandt D., De Deyn P.P. Biochemical and behavioural phenotyping of a mouse model for GAMT deficiency. J. Neurol. Sci. 2005;231:49–55. doi: 10.1016/j.jns.2004.12.014. [DOI] [PubMed] [Google Scholar]
- 25.Davidoff A.M., Ng C.Y., Zhou J., Spence Y., Nathwani A.C. Sex significantly influences transduction of murine liver by recombinant adeno-associated viral vectors through an androgen-dependent pathway. Blood. 2003;102:480–488. doi: 10.1182/blood-2002-09-2889. [DOI] [PubMed] [Google Scholar]
- 26.Kadekaro M., Crane A.M., Sokoloff L. Differential effects of electrical stimulation of sciatic nerve on metabolic activity in spinal cord and dorsal root ganglion in the rat. Proc. Natl. Acad. Sci. U S A. 1985;82:6010–6013. doi: 10.1073/pnas.82.17.6010. [DOI] [PMC free article] [PubMed] [Google Scholar]
- 27.Pitts M.W. Barnes maze procedure for spatial learning and memory in mice. Bio Protoc. 2018;8:e2744. doi: 10.21769/BioProtoc.2744. [DOI] [PMC free article] [PubMed] [Google Scholar]
- 28.Schulze A., Tran C., Levandovskiy V., Patel V., Cortez M.A. Systemic availability of guanidinoacetate affects GABAA receptor function and seizure threshold in GAMT deficient mice. Amino Acids. 2016;48:2041–2047. doi: 10.1007/s00726-016-2197-0. [DOI] [PubMed] [Google Scholar]
- 29.Schulze A., Mayatepek E., Bachert P., Marescau B., De Deyn P.P., Rating D. Therapeutic trial of arginine restriction in creatine deficiency syndrome. Eur. J. Pediatr. 1998;157:606–607. doi: 10.1007/s004310050890. [DOI] [PubMed] [Google Scholar]
- 30.Hu C., Lipshutz G.S. AAV-based neonatal gene therapy for hemophilia A: long-term correction and avoidance of immune responses in mice. Gene Ther. 2012;19:1166–1176. doi: 10.1038/gt.2011.200. [DOI] [PMC free article] [PubMed] [Google Scholar]
- 31.Hu C., Kasten J., Park H., Bhargava R., Tai D.S., Grody W.W., Nguyen Q.G., Hauschka S.D., Cederbaum S.D., Lipshutz G.S. Myocyte-mediated arginase expression controls hyperargininemia but not hyperammonemia in arginase-deficient mice. Mol. Ther. 2014;22:1792–1802. doi: 10.1038/mt.2014.99. [DOI] [PMC free article] [PubMed] [Google Scholar]
- 32.Lee E.K., Hu C., Bhargava R., Ponnusamy R., Park H., Novicoff S., Rozengurt N., Marescau B., De Deyn P., Stout D., et al. AAV-based gene therapy prevents neuropathology and results in normal cognitive development in the hyperargininemic mouse. Gene Ther. 2013;20:785–796. doi: 10.1038/gt.2012.99. [DOI] [PMC free article] [PubMed] [Google Scholar]
- 33.Lee E.K., Hu C., Bhargava R., Rozengurt N., Stout D., Grody W.W., Cederbaum S.D., Lipshutz G.S. Long-term survival of the juvenile lethal arginase-deficient mouse with AAV gene therapy. Mol. Ther. 2012;20:1844–1851. doi: 10.1038/mt.2012.129. [DOI] [PMC free article] [PubMed] [Google Scholar]
- 34.Baker S.A., Gajera C.R., Wawro A.M., Corces M.R., Montine T.J. GATM and GAMT synthesize creatine locally throughout the mammalian body and within oligodendrocytes of the brain. Brain Res. 2021;1770:147627. doi: 10.1016/j.brainres.2021.147627. [DOI] [PubMed] [Google Scholar]
- 35.Magami Y., Azuma T., Inokuchi H., Kokuno S., Moriyasu F., Kawai K., Hattori T. Cell proliferation and renewal of normal hepatocytes and bile duct cells in adult mouse liver. Liver. 2002;22:419–425. doi: 10.1034/j.1600-0676.2002.01702.x. [DOI] [PubMed] [Google Scholar]
- 36.Ishibashi K., Onishi A., Fujiwara Y., Oda K., Ishiwata K., Ishii K. Longitudinal effects of aging on (18)F-FDG distribution in cognitively normal elderly individuals. Sci. Rep. 2018;8:11557. doi: 10.1038/s41598-018-29937-y. [DOI] [PMC free article] [PubMed] [Google Scholar]
- 37.Seifer F., Hajibonabi F., Parnianfard N., Ranjkesh M., Valikhani E., Yazdchi M. Age-related glucose metabolism in FDG-PET brain studies. Transl Neurosci. Res. Rev. 2018;1:5–9. [Google Scholar]
- 38.Bianchi M.C., Tosetti M., Battini R., Leuzzi V., Alessandri M.G., Carducci C., Antonozzi I., Cioni G. Treatment monitoring of brain creatine deficiency syndromes: a 1H- and 31P-MR spectroscopy study. AJNR Am. J. Neuroradiol. 2007;28:548–554. [PMC free article] [PubMed] [Google Scholar]
- 39.Depre C., Rider M.H., Hue L. Mechanisms of control of heart glycolysis. Eur. J. Biochem. 1998;258:277–290. doi: 10.1046/j.1432-1327.1998.2580277.x. [DOI] [PubMed] [Google Scholar]
- 40.Berg J.M., Tymoczko J.L., Stryer L. W H Freeman; 2002. Biochemistry. [Google Scholar]
- 41.Lock M., Alvira M., Vandenberghe L.H., Samanta A., Toelen J., Debyser Z., Wilson J.M. Rapid, simple, and versatile manufacturing of recombinant adeno-associated viral vectors at scale. Hum. Gene Ther. 2010;21:1259–1271. doi: 10.1089/hum.2010.055. [DOI] [PMC free article] [PubMed] [Google Scholar]
- 42.Tran C., Yazdanpanah M., Kyriakopoulou L., Levandovskiy V., Zahid H., Naufer A., Isbrandt D., Schulze A. Stable isotope dilution microquantification of creatine metabolites in plasma, whole blood and dried blood spots for pharmacological studies in mouse models of creatine deficiency. Clin. Chim. Acta. 2014;436:160–168. doi: 10.1016/j.cca.2014.05.007. [DOI] [PubMed] [Google Scholar]
- 43.Khoja S., Nitzahn M., Hermann K., Truong B., Borzone R., Willis B., Rudd M., Palmer D.J., Ng P., Brunetti-Pieri N., et al. Conditional disruption of hepatic carbamoyl phosphate synthetase 1 in mice results in hyperammonemia without orotic aciduria and can be corrected by liver-directed gene therapy. Mol. Genet. Metab. 2018;124:243–253. doi: 10.1016/j.ymgme.2018.04.001. [DOI] [PMC free article] [PubMed] [Google Scholar]
- 44.Ma Y., Smith D., Hof P.R., Foerster B., Hamilton S., Blackband S.J., Yu M., Benveniste H. In vivo 3D digital atlas database of the adult C57BL/6J mouse brain by magnetic resonance microscopy. Front. Neuroanat. 2008;2:1. doi: 10.3389/neuro.05.001.2008. [DOI] [PMC free article] [PubMed] [Google Scholar]
- 45.Patil S.S., Sunyer B., Hoger H., Lubec G. Evaluation of spatial memory of C57BL/6J and CD1 mice in the Barnes maze, the Multiple T-maze and in the Morris water maze. Behav. Brain Res. 2009;198:58–68. doi: 10.1016/j.bbr.2008.10.029. [DOI] [PubMed] [Google Scholar]
- 46.Gawel K., Gibula E., Marszalek-Grabska M., Filarowska J., Kotlinska J.H. Assessment of spatial learning and memory in the Barnes maze task in rodents-methodological consideration. Naunyn Schmiedebergs Arch. Pharmacol. 2019;392:1–18. doi: 10.1007/s00210-018-1589-y. [DOI] [PMC free article] [PubMed] [Google Scholar]
Associated Data
This section collects any data citations, data availability statements, or supplementary materials included in this article.