Abstract
Inorganic nano-layered double hydroxide (LDH) materials are used in the catalytic field, and have demonstrated great applicability in the pharmacological fields. In the current study, we report Zn–Al LDH as an adsorbent for levofloxacin (levo). The physical and chemical properties of the prepared material before and after adsorption were monitored using X-ray diffraction, Fourier-transform infrared (FT-IR) spectroscopic analysis, energy dispersive X-ray spectroscopy (EDX), Brunauer–Emmett–Teller (BET) surface area measurements, high-resolution transmission electron microscopy (HRTEM), and field emission scanning electron microscopy (FESEM). Density functional theory (DFT) calculations for levo and its protonated species were studied at the B3LYP/6-311G (d,p) level of theory. The removal percentage of levo was 73.5%. The adsorption isotherm was investigated using nine different models at pH 9, where the obtained correlation coefficients (R2) using the Redlich–Peterson and Toth models were 0.977. The thermodynamic parameters ΔS°, ΔG° and ΔH° were estimated and discussed in detail. Also, to support the adsorption research field, the applicability of the formed waste after the adsorption of levo onto Zn–Al LDH was investigated for medical purposes. The toxicity of levo in both normal and nanocomposite form was studied. Neither toxicological symptoms nor harmless effects were exhibited throughout the in vivo study. The oral anti-inflammatory activity, tested using 6% formalin to produce edema in the footpad, was manifested as a significant increase of 37% in the anti-inflammatory effect of the Zn–Al LDH/levo nanocomposite compared to levo in its normal form.
Zn-Al LDH was synthesized using the co-precipitation method, characterized and used as an efficient adsorbent for the removal of levofloxacin. The safety and toxicity of the administered Zn-AL LDH/levo as a safe anti-inflammatory material.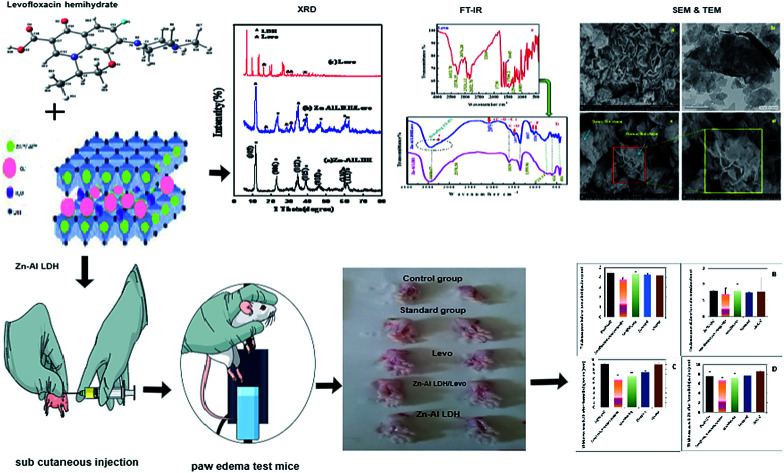
1. Introduction
In the 20th century, the discovery of antibiotics was one of the most relevant achievements, resulting in a great revolution in both human and veterinary medicine.1 However, their residual presence in the environment poses a threat to human health and the ecological system. These residues may lead to proliferation of antibiotic-resistant strains of bacteria.2–4 Scientists found that the presence of traces of these drugs or their presence in sub-lethal concentrations in sewage is more than enough to have a harmful impact, as these traces can induce the evolution of antibiotic-resistant bacteria, which increase the risks to human health.5,6 The residual antibiotics enter the environment through different pathways as wastewater effluent discharge, agricultural runoff, and leaching.7,8 One of these antibiotics is levofloxacin (levo), which has been detected in wastewater and river water of rural Shandong province, China, at concentrations 12.5 and 0.5 ng L−1, respectively. The risk quotient (RQ) for the estimated ecological risk of antibiotic resistance selection was found to be >1 (≈2.587) in wastewater, illustrating its high ecological risk for the development of resistance.9 Although, many techniques have been used to remove these antibiotic residues from the sewage system, such as conventional treatment processes, for example adsorption, and non-conventional methods, they suffer from some limitations. Conventional treatment processes (filtration, flocculation, sedimentation, coagulation or ozonation)10–12 fail to remove these residual antibiotics completely due to their high solubility and polarity and low degradability in water,13 which then enables their passage through the filtration steps in the treatment process so that they reach our drinking water. Moreover, ozonation is high in cost and requires high energy and the need for backwashing.10 Non-conventional methods include reverse osmosis, nano-filtration, ion exchange, chlorination and oxidation. Nano-filtration through graphene-based nanomaterial membranes14 and reverse osmosis are techniques that have shortcomings because the membranes are susceptible to malfunction when they come into direct contact with oxidants.10 Chlorination processes are limited due to the evolution of dangerous by-products.12 Under different conditions, the adsorption processes are considered to be one of the most effective techniques in the removal of pollutants such as heavy metals and residual antibiotics from wastewater effluent due to their known merits such as: the ease of applicability for the removal of different types of pollutants, either soluble or insoluble, its low cost, simplicity of use, and the reusability of the adsorbents in different aspects.15,16 Since layered double hydroxide (LDHs) have unique properties such as a high surface area, low cytotoxicity, good compatibility, magnetism, a porous structure and are easy to synthesise17 so, this improves the action of the adsorption process.18,19 Besides this, its efficient role as a nano-delivery system means that it allows the manufacturing of drugs at the nanoscale level, facilitating drug delivery to the different parts of the body and enhancing their pharmacological functions without any alterations, when compared to pure drugs.20–22 Moreover, LDH nanoparticles, if compared to other inorganic nanoparticles, have no significant cytotoxic effect at exposure times of 72 h and below a concentration of 250 μg mL−1 which is far too high for use in a drug delivery system.20 On the other hand, the influence of freely ionized metal ions such as Al3+ on the absorption of the antibiotic levofloxacin in the small intestine of rats was investigated in terms of the inhibition of levo absorption in the small intestine of the rats and how it affects its anti-inflammatory and antibacterial activity. This is due to the strong adsorption of levo by the aluminum free ions in the aluminum hydroxide, which reduces its absorption in the small intestine and inhibition of its activity occurs, so on using the stable synthesized LDH, we could overcome this problem. Besides the enhancement of both the absorption and the activity of levo,23 many research studies have revealed the significant and effective role of the adsorption technique, such as the effectiveness of a magnetic carbon nanocomposite for the removal of levo from wastewater.24 Also, the adsorption of levo from aqueous solution has been studied using a humic acid treated zeolite, which showed efficient adsorption of levofloxacin.25 Also, activated carbon, silica gel and LDHs have been used for the treatment of wastewater.26 Moreover, the adsorption of levo onto the surface of Fe3O4 and Fe3O4@SiO2 nanomaterials has been studied and the maximum adsorption capacity of levo on Fe3O4 nanoparticles was estimated to be in the range of 6.094 to 6.848 mg g−1. Yu et al.27 applied agricultural waste corn bracts (CBs) modified by zirconium cations as promising adsorbent materials for the removal of levo. Also, Yi et al.28 used rice husk (RH) and wood chip (WC) biochars in the removal of levo from aqueous solution, estimating the maximum adsorption capacities of the biochars to be in the range of 1.49 to 7.72 mg g−1. Also, Limbikai et al.29 successfully removed levo from water using a low-cost adsorbent prepared from coconut coir impregnated with alumina nanoparticles, which showed a removal percentage in the range of 56.6–64%. Low cost natural waste adsorbents such as activated carbon, barley husks and eggshells have also been used to remove levofloxacin from wastewater, with removal efficiencies of 74, 71 and 42%, respectively.30
Independent of its antibacterial activity, levofloxacin has been found to have anti-inflammatory effects because of its immunomodulatory activity on cytokine production. In human epithelial cells, levofloxacin has shown a dose dependent decrease in interlukin-6 and interlukin-8 concentrations.31 In peripheral blood mononuclear cells, levofloxacin suppressed, in a concentration dependent manner, the production of interlukin-1β, resulting from their stimulation by lipopolysaccharides.32
Levofloxacin is not only used as an antibacterial or anti-inflammatory material but is also used with meloxicam in a combined treatment in order to enhance the immunolocalization of the ABCG-2 transporter protein found in rabbit retinas (adenosine triphosphate-binding cassette (ABC) sub-family G member-2 (ABCG-2)) which is involved in multi-drug efflux from tissues.33 So, in the present study we aim to remove levofloxacin present in wastewater effluent by loading it on a Zn–Al LDH, thereby eliminating the threat of antibiotic resistance, and utilize the formed novel nanocomposite to sustain release, improve the activity and avoid the risks associated with dose escalation to obtain the desired anti-inflammatory action. Despite the prevailing opinion that the therapeutic effect of drugs is concentration dependent, the anti-inflammatory action was improved by the levofloxacin nanocomposite even though the amount loaded on the Zn–Al LDH was lower than that of pure levofloxacin used during in vivo experiments.
2. Experimental
2.1. Materials
Zinc chloride (ZnCl2) and aluminum chloride (AlCl3) were purchased from Sigma-Aldrich. Twice distilled water was used in all preparations. Sodium hydroxide and ethanol with a purity of 99.8% from Sigma-Aldrich and hydrochloric acid (ACS BASIC Scharlau) were of HPLC analytical grade. Diclofenac sodium (Voltaren®, 75 mg/3 ml NOVARTIS Pharmaceuticals) and levo were obtained from Aarti Drugs Ltd pharmaceutical company.
2.2. Synthesis of Zn–Al LDH
Zn–Al LDH with a molar ratio 3 : 1 (Fig. 1) was prepared using a co-precipitation method reported in previous work.34 In the co-precipitation method, aqueous solutions of Zn2+ and Al3+ are mixed, then, NaOH (0.5 mol L−1) solution is added through a titration system under continuous stirring until pH 10.0 is reached. The obtained precipitate is then aged for 24 h at 70 °C. The resulting suspension was centrifuged to separate the precipitate, which was washed several times using distilled water, and finally with ethanol until pH 7 was reached, and the formed precipitate was left at 50 °C in an oven for 24 h until it was completely dry.
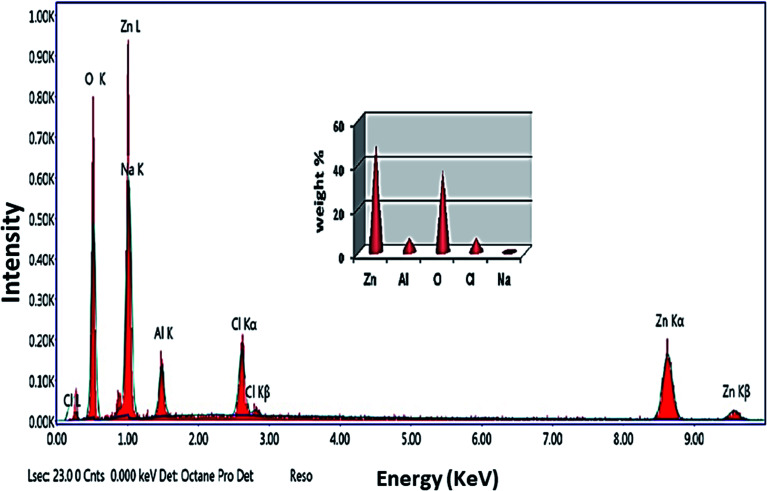
Fig. 1. EDX spectrum of the prepared Zn–Al LDH in which the inset shows the elemental composition percentage.
2.3. Characterization of the Zn–Al LDH
The prepared adsorbent was characterized using different tools A PANalytical (Empyrean) X-ray diffractometer equipped with a Cu-Kα radiation source (wavelength 0.154 nm) operated at a current of 35 mA and voltage 40 kV, and scanning at a rate of 8° min−1 from 5° to 80° (2θ) was used to determine the crystallinity and structural composition of the synthesized Zn–Al LDH. An amount of 0.50 mg of the prepared material was homogenized in an agate mortar with 300 mg of optically high purity KBr, vacuumed for 5 min then pressed under 10 ton per cm2 for 15 min to form a KBr pellet, the area of which was 1.13 cm2 (Zeiss standard). A light grey transparent pellet without visually noticeable grains was obtained and its IR spectra were recorded using a Bruker-Vertex 70spectrometer (Germany) in the wavenumber range of 4000–400 cm−1.35 Also, the microstructure and morphology of the synthesized Zn–Al LDH were investigated using a high-resolution transmission electron microscope (HRTEM, JEOL JEM-2100) with an acceleration voltage of 200 kV) and a field emission scanning electron microscope (FESEM). The Brunauer–Emmett–Teller (BET) analysis of the specific surface area, pore size distribution and specific pore volume of the prepared sample were determined (TriStar II 3020, Micrometrics, USA).
2.4. Adsorption study
To perform this experiment, we used a batch operating system at ambient temperature using a standard stock aqueous solution of levo with a concentration 150 ppm, which allowed the preparation of a series of diluted concentrations to obtain an ideal calibration curve (5–100 ppm). Firstly, five 50 ml Falcon tubes were prepared by placing in each: 0.05 g of the synthesized catalyst (Zn–Al LDH) and pollutant (levo) with a concentration of 15 ppm, and then the pH of the five tubes was adjusted to 3, 5, 7, 9, and 11 using 0.1 N NaOH or 0.1 N HCl, recorded using a pH meter (Metrohm 751 Titrino).
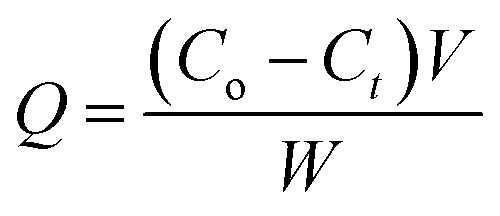
The same previous steps were performed in another five tubes, but including the catalyst. This experiment was performed in the absence of light and the tubes were placed on an orbital shaker (S-O330-Pro), leaving them overnight for ≈20 h at 250 rpm until equilibrium was reached. A syringe filter (Millipore, Nylon, 0.22 μm pore size) was used to filter the prepared solution before measurements. The residual concentration of the pollutant (levo) was measured using a double beam UV-visible spectrophotometer (UV-2600 UV-Vis Spectrophotometer, Shimadzu) at a wavelength of 289 nm.36–38 The amount of levo adsorbed per gram of Zn–Al LDH (Q) and the removal percentage were calculated according to the following equations:
 |
1 |
 |
2 |
where Q is the amount of levo adsorbed per gram, Co is the initial concentration of levo, Ct is the levo concentration in mg L−1 after adsorption at time t (min), W is the weight of the catalyst in grams and V is the volume of the levo solution (L).
The point of zero charge (PZC) of the Zn–Al LDH was measured by adding 0.05 g of the synthesized LDH to a 25 mL aqueous solution at different pH values (3, 5, 7, 9 and 11).39,40 Then, the solution was left for 24 h to reach the final pH. The difference between the final and the initial pH was plotted versus the initial pH. The PZC is equal to the initial pH at which ΔpH = 0. The effect of the dose of the adsorbent was studied at a constant concentration of levo (15 ppm) and different weights of adsorbent (0.0125 g to 0.20 g), adjusting the pH of each tube at pH = 9 (an optimal condition that was obtained from the effect of pH). Also, the effect of pollutant concentration was studied by adding a constant weight of the adsorbent (0.125 g which was obtained under optimal conditions of the dose of the absorbent), and different concentrations of levo ranging from 5 ppm to 50 ppm, adjusting the pH of each tube to the optimal pH then the two, three and four parameter isotherm models were applied. Finally, the effect of different temperatures was examined at 15, 25, 35, 45 and 55 °C and the thermodynamic parameters were calculated.
The remaining samples from the above adsorption experiments were collected and centrifuged to obtain a precipitate containing the Zn–Al LDH/levo nanocomposite, then the ppt was washed several times using twice distilled water and the washed precipitate was dried in the oven at 50 °C for 24 h until completely dry. Finally, we used the dried Zn–Al LDH/levo as a safe anti-inflammatory treatment.
A potentiometric titration was carried out to investigate the dissociation constants of levo using a Metrohm 686 titroprocessor with a 665 dosimat (Switzerland-Herisau) attached. Glass-calomel combined electrodes (Metrohm) and a thermometric probe were used. The titroprocessor and the electrode were calibrated with standard buffer solutions. The ionic strength was maintained at 0.1 mol dm−3 with sodium nitrate.41 Levofloxacin solution was prepared in its protonated form (H3L2+) by dissolving it in HNO3 solution. The acid dissociation constant of the protonated form of the ligand was determined by titrating 1.25 mmol of it with a standard 0.05 M NaOH solution. The detailed method and calculation of the formation constant and the concentration distribution diagram as a function of pH have previously been described elsewhere.41
2.5. In vivo study in experimental animals
Animals used for testing the anti-inflammatory effects were obtained from the faculty of veterinary medicine, Beni-Suef University. Animals were kept under standard conditions in terms of animal weights, dosing, anesthesia, drinking, and feeding. Inflammation induction and treatment were approved according to the guidelines of the care and use of laboratory animals of the faculty of veterinary medicine, Beni-Suef University, and according to the institutional animal care and ethical committee of Beni-Suef University, Egypt.
About 30 albino rats of both sexes with 200–250 g per b wt were used for each of the anti-inflammatory activity and LD50 studies, divided into five groups: control group (administered orally with distilled water), standard group (administered with diclofenac sodium at 30 mg per kg per b wt) and three differently treated groups (G3, G4 and G5) were orally administered using normal levo, nanocomposite Zn–Al LDH/levo and Zn–Al LDH, respectively, at doses of 10 mg per kg per b wt, for LD50 study. All of our treatments were orally administrated after good dissolution of the materials in twice distilled water.
2.5.1. Investigation of the anti-inflammatory activity
Firstly, inflammation was induced via the subcutaneous injection of 0.1 mL of formalin (6%) in normal saline into the left hind paw of all animals and 30 min later the treatments were orally administrated. Each group was administrated with specific substances the control group was administered using distilled water, the standard group using diclofenac sodium at 30 mg per kg per b wt, and the last three groups (G3, G4 and G5) using normal form of levo, nanocomposite Zn–Al LDH/levo and the loading vehicle Zn–Al LDH, respectively, at doses of 10 mg per kg per b wt. The paw thickness was measured hourly in mm for four hours post administration of the different treatments. At the end of the observation period, the animals were euthanized using an anesthetic of ketamine (90 mg kg−1) and xylazine (5 mg kg−1) in a ratio of 1 : 1 at a dose of 0.1 mL per kg b wt intraperitoneally (I/P), then samples were collected for histopathological studies (Scheme S1†).
2.5.2. Estimation of LD50 for Zn–Al LDH/levo in in vivo trials
A set of thirty rats was used in the experimental design. The rats were divided into nine study groups besides the control group (in each group n = 3). LD50 estimation was carried out in three phases according to a previous study.42 Rats were administered orally using the tested Zn–Al LDH/levo nanocomposite in increasing doses as follows: dosing started with 100, 200 and 400 mg per kg per b wt for the first three groups. While the next three groups were administered with 400, 600, and 800 mg per kg per b wt, respectively. Finally, in the last three groups, rats were administered with 600, 800, and 1000 mg per kg per b wt. On the other hand, rats in the control group were administered using distilled water. Mortality and other signs of toxicity were monitored for 24 h post-administration.
LD50 values were calculated according to the following eqn (3):
 |
3 |
where DM is the dose that results in 100% mortality or the largest dose that kills all animals, A, constant factor between two successive doses representing the dose difference between two successive groups. Constant factor between two successive doses representing the dose difference between two successive groups. B is the mean number of dead animals between two successive groups, N is the number of animals in each group, and ∑ is the summation of multiplying A and B together.
2.5.3. Histopathological findings
After the animals were euthanized as described earlier, the necropsy technique was used for sample collection followed by histopathological examinations. The paws of the ats were collected and fixed in 10% neutral buffered formalin solution for 48 h at room temperature, then they were trimmed to one cubic centimeter in size. The collected samples underwent a sequence of routine histopathological examinations (dehydration using ascending grades of alcohols, fixation and paraffin embedding at 56 °C in a hot air oven) microtomy sections of 4–6 in thickness were obtained, which were then routinely stained using hematoxylin and eosin, and finally examined using a light microscope.43
2.5.4. Statistical analysis
One-way analysis of variance (ANOVA), Tukey's post hoc test, and LSD were used for determining the significance levels using the SPSS software (IBM SPSS Statistic 20.0, Armonk, NY, USA). P values of less than 0.05 were considered statistically significant.44
2.6. DFT calculations
Density functional theory (DFT) was used to calculate the lowest energy geometries of levo and its protonated forms using the Gaussian 09 program45 at the B3LYP/6-311G (d,p) level of theory.
3. Results and discussion
3.1. Characterization of the Zn–Al LDH
3.1.1. X-ray diffraction
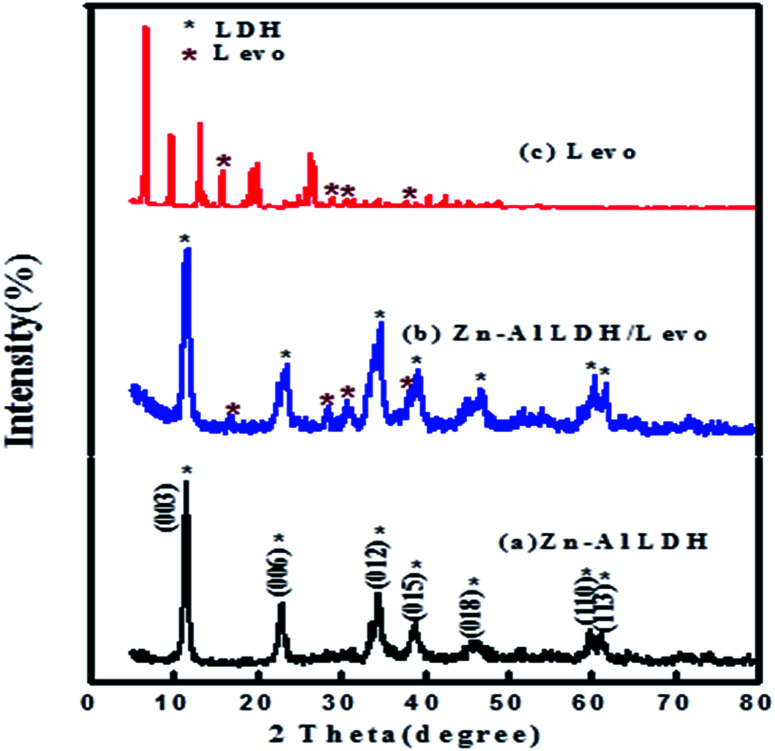
Significant similarities were determined between the XRD patterns of the prepared materials and typical XRD patterns of hydrotalcite-like LDH materials (Fig. 2).46,47 The XRD pattern of the prepared Zn–Al LDH confirmed its high crystallinity via the sharpness of its diffraction peaks. The native Zn–Al LDH diffraction peaks were in good agreement with those of a synthetic hydrotalcite-like compound with the ICDD card no. (00-058-0178). The layered structure of the Zn–Al LDH, the XRD pattern of which is shown in (Fig. 2a), was confirmed by the presence of the characteristic reflections of LDHs, with basal planes of (003), (006) peaks at low 2θ angles, and other peaks for (012), (015), (018), (110), and (113) planes at high 2θ angles.48 Comparing the XRD patterns before and after the adsorption of levo, it was found that some significant alterations occurred, such as peak shifting to higher diffraction angles and a change in the relative intensity of the peaks, as shown in (Fig. 2b), where some new diffraction peaks appeared in the XRD pattern after adsorption at 2θ angles of 16.82°, 28.61°, 30.71°, and 38.01°, which are characteristic peaks for levo as shown in its pattern in Fig. 2c. In addition, the d003 of the LDH and the LDH/levo nanocomposite was double the d006, illustrating its good layered structure (Table 1).49 The broadening and low crystallinity of the XRD peaks of the nanocomposite compared with the native LDH illustrated the successful adsorption of levofloxacin on the Zn–Al LDH without affecting the stable structure of the LDH.
Fig. 2. XRD patterns of the (a) Zn–Al LDH, (b) Zn–Al LDH/levo and (c) levo.
Main crystal plane spacing and lattice parameters calculated from XRD patterns of the Zn–Al LDH and the Zn–Al LDH/levo nanocomposite.
| XRD patterns | d(003) (Å) | d(006) (Å) | d(110) (Å) | a (Å) | c (Å) |
|---|---|---|---|---|---|
| Zn–Al LDH | 7.65 | 3.79 | 2.71 | 5.42 | 22.95 |
| Zn–Al/levo nanocomposite | 7.72 | 3.76 | 2.70 | 5.41 | 23.17 |
3.1.2. Fourier-transform infrared spectroscopy
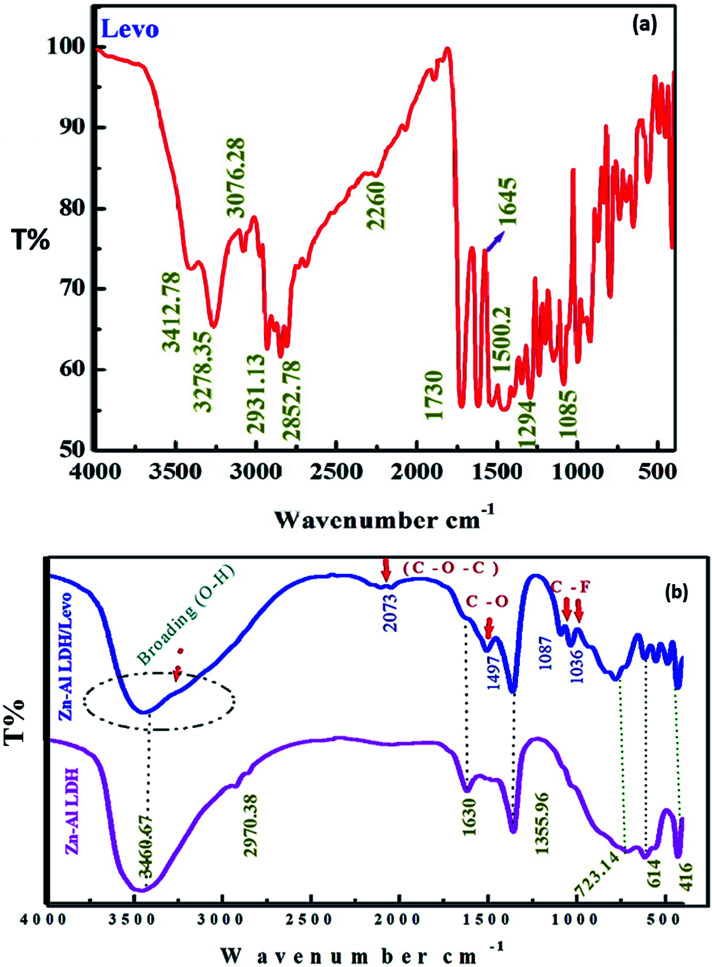
The FT-IR spectra were recorded to characterize the interactions in the prepared materials, as shown in Fig. 3. The spectrum of Zn–Al LDH shows an intense broad band at 3460.67 cm−1, which might be due to the O–H stretching vibrations of the physically adsorbed water molecules and the hydrogen bonding of the –OH interlayer groups. A bending vibration appeared at 1630 cm−1,34,50 and peaks at 723.14, 614 and 416 cm−1 can be ascribed to the stretching vibrations of M–O and M–O–H.51 Moreover, an intense peak was observed at 1355.96 cm−1, which might be due to the symmetric and asymmetric stretching vibrations of the carbonate group (CO3)2− that may be formed during the sample preparation. Fig. 3 shows the FT-IR spectrum of levo, where the obtained data was compared with the standard pattern of levo.52 The peaks at 3278.35 and 3412.78 cm−1 can be attributed to the N–H and –COOH stretching vibrations. The appearance of the bands in the range of 2800–3076 cm−1 indicates the presence of aromatic stretching. Also, the peaks at 1085, 1294 and 1730 cm−1 are characteristic of C–halogen, C–N and (C O) of aromatic rings, respectively.53 The FTIR spectrum of Zn–Al LDH after levo adsorption shows the interaction between the LDH and levo as a result of the adsorption process (Fig. 3) via some features like the broadening of the –OH band at 3400 cm−1. This broadening might be attributed to the O–H bond stretching vibration of water molecules adsorbed on the material surface and their interactions with the adsorbed levo molecules via hydrogen or chemical bonding with LDH. In general, the decrease in the band intensity or the disappearance of peaks involved in the H-bond interactions infers the presence of both intermolecular and intramolecular hydrogen bonding interactions. From the observed spectra in Fig. 3, the FTIR investigations confirmed the intramolecular H-bonding among the LDH/levo components. The hydrogen bonding intensity was calculated from the ratio of the absorbance bands at 3460.67 and 3421.85 cm−1 (for the –OH peak) and 1355.96 and 1347.44 cm−1 (for the C O peak) in Zn–Al LDH and Zn–Al LDH/levo, respectively, showing a significant increase in the case of the Zn–Al LDH/levo nanocomposite (0.55) compared to that of Zn–Al LDH (0.17), confirming the H-bonding interactions between the Zn–Al LDH and the Zn–Al LDH/levo.54 Through FTIR investigations, some levo bands were observed in the Zn–Al LDH/levo nanocomposite spectrum, which confirmed the successful loading of levo onto the Zn–Al LDH surface, as observed in the appearance of peaks at 2037, 1497 and 1087–1036 cm−1, which are related to C–O–C, C–O and C–F, respectively.28,47,50,54–58 Besides this, some peaks were shifted to a lower wavenumber, as shown in Table 2.
Fig. 3. FTIR spectra of levo, Zn–Al LDH/levo and the Zn–Al LDH.
Band frequencies from the FTIR spectra of levofloxacin, the Zn–Al LDH and Zn–Al LDH/levo.
| No. | Name | Wavelength | Functional Groups |
|---|---|---|---|
| 1 | Levo | 1085 cm−1 | C–halogen group |
| 1294 cm−1 | Amines (C–N) | ||
| 1730 cm−1, 1645 cm−1 | Carbonyl group | ||
| 1250–1200 cm−1 | C–O–C of acrylates and ethers | ||
| 2800–3076.28 cm−1 | Aromatic group | ||
| 3278.35 cm−1 | N–H stretching vibration indicative of the C O stretching of the esteric group | ||
| 3412.78 cm−1 | Hydroxyl groups of –COOH | ||
| 2 | Zn–Al LDH | 723.14 cm−1, 614 cm−1 and 416 cm−1 | Stretching vibrations of M–O and M–O–H |
| 1355.96 cm−1 | C–O asymmetric stretching due to carbonate ions | ||
| 1630 cm−1 | O–H bending vibration | ||
| 2970.38 cm−1 | Bonding between CO32− and hydrogen in water | ||
| 3447.03 cm−1 | Adsorbed water and O–H groups | ||
| 3 | Zn–Al levo | 1089.63 cm−1, 1036 cm−1 | C–halogen group |
| 1362–1505.04 cm−1 | C–O asymmetric stretching due to carbonate ions | ||
| 2073 cm−1 | υ C–O–C of acrylates and ethers | ||
| 3446.72 cm−1 | Hydroxyl groups of –COOH of adsorbed levo and O–H of LDH |
3.1.3. Morphology and surface study (FESEM, HRTEM, and surface area)
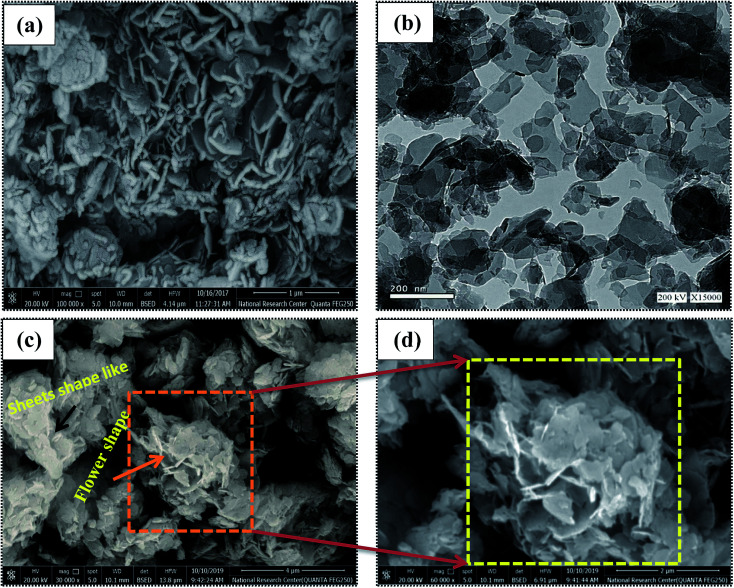
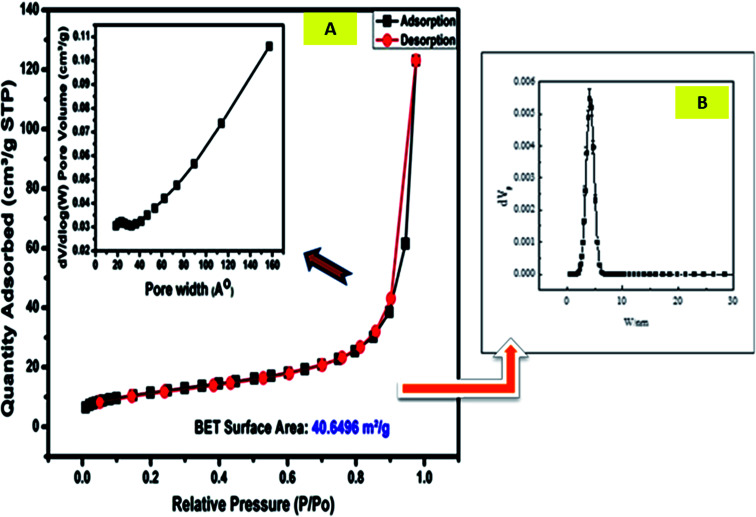
FESEM was used to determine the morphologies of the prepared materials. The FESEM image of the Zn–Al LDH (Fig. 4a) shows large aggregated layers in lamellar form or a structure with layers that are compatible with each other.59Fig. 4b displays the HRTEM micrograph of Zn–Al LDH, illustrating its plate-like shape and confirming its layered structure.60 The FESEM images of Zn–Al LDH/levo (Fig. 4c and d) show that its overall shape is flower-like with high porosity besides the layers and the sheet-like shapes. The pore diameter distribution and the N2 adsorption–desorption isotherms are shown in Fig. 5, which were used to study the porous structure of the Zn–Al LDH sample. The N2 adsorption–desorption isotherms of the Zn–Al LDH samples can be classified as type IV according to the IUPAC classification system of adsorption isotherms, indicating the presence of the micro- and mesoporous particles, which may be attributed to particle aggregation, in good agreement with the FESEM (Fig. 4a) and HRTEM (Fig. 4b) results of the Zn–Al LDH. As shown in Fig. 5, the pore-size distribution curves of the prepared samples show a range between 2 and 6 nm. Table 3 includes the experimental values of the surface structure parameters of the Zn–Al LDH, the pore diameter, specific surface area and pore volume.
Fig. 4. FESEM images of the (a) Zn–Al LDH, (c and d) Zn–Al LDH/levo and (b) HRTEM of the Zn–Al LDH.
Fig. 5. Adsorption–desorption isotherms of N2 for the Zn–Al LDH at 77 K, where the inset figures show (A) the pore width distribution and (B) the particle size distribution.
Surface and porous structure parameters of the Zn–Al LDH nanomateriala.
| Surface area (m2 g−1) | 40.65 m2 g−1 |
|---|---|
| Total pore volume (cm3 g−1) | 0.04 cm3 g−1 |
| The monolayer capacity Vm | 6.45 cm3 (STP) g−1 |
| Average pore diameter (nm) | 5.63 nm |
STP = standard temperature and pressure.
3.2. Molecular DFT calculation of levo
3.2.1. The optimized structures of all forms of levo at different pH values
DFT calculations were carried out to calculate the lowest energy geometries of levo and its protonated and un-protonated forms using the Gaussian 09 program at the B3LYP/6-311G(d,p) level of theory.45
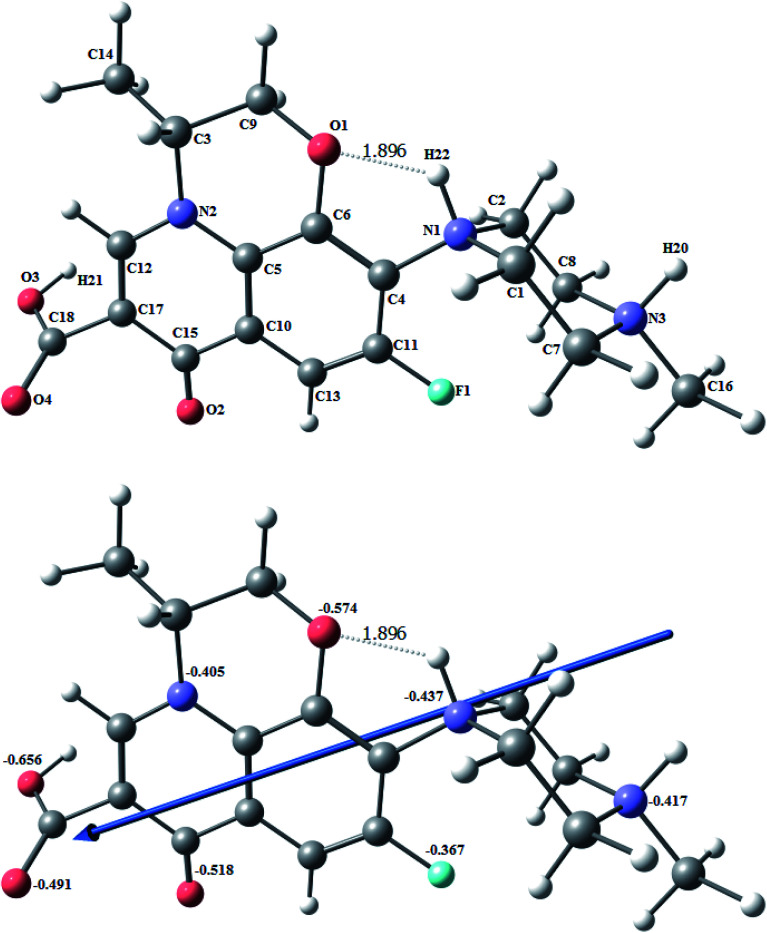
All optimized structures have a chair structure for the piperazine ring. Fig. 6 shows the optimized structures of protonated levo (H3L2+) as the lowest energy configurations. The natural charges obtained from natural bond orbital (NBO) analysis show that the negative active sites are: O1 (−0.574), O2 (−0.518), O3 (−0.656), O4 (−0.491), N1 (−0.437), N2 (−0.405), N3 (−0.417) and F (−0.367). The three protons are on the O3 of the carboxylate oxygen, and N3 and N1 of the piperazine ring. The optimized structure in Fig. 6 shows a strong H-bond between the N1–H and O1 with a length of 1.896 Å.
Fig. 6. The optimized structure of protonated levo (H3L2+), the vector of the dipole moment, and the natural charges on the active centers of the ligand using the B3LYP/6-311G(d,p) functional.
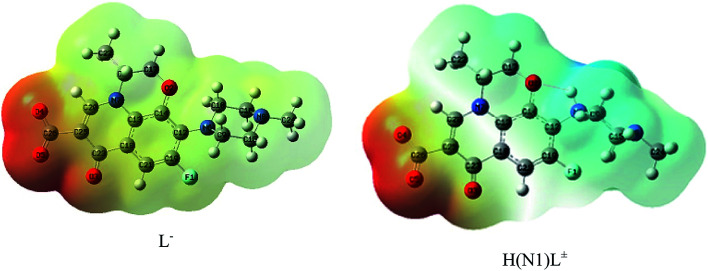
The molecular electrostatic potential (MEP) surface was used to locate the positively (blue color) and negatively (red color, it represents the loosely bound or excess electrons) charged electrostatic potential in the molecule (Fig. 7), showing that the fully un-protonated ligand (L−) is almost red to yellow in color with the maximum number of loosely bound or excess electrons. The mono-protonated species (H(N1)L±) has a positive blue colored part. The computed total energy, the highest occupied molecular orbital (HOMO) and lowest unoccupied molecular orbital (LUMO) energies, and the dipole moments of the ligands and complexes were calculated, as shown in Table 4.
Fig. 7. MEP surface of L− and zwitterionic H(N3)L± calculated using B3LYP/6-311G(d,p).
Calculated energies of levo and its protonated and un-protonated forms at the B3LYP/6-311G(d,p) level of theory.
| E a | HOMOb | LUMOc | E g d | Dipole momentee | |
|---|---|---|---|---|---|
| L- | −1262.71 | −1.16 | 1.75 | 2.91 | 24.64 |
| HL± | −1263.16 | −3.71 | −1.94 | 1.77 | 30.81 |
| H2L+ | −1263.48 | −6.01 | −5.60 | 0.40 | 46.46 |
| H3L2+ | −1263.88 | −11.53 | −7.82 | 3.71 | 31.25 |
E: the total energy (a.u.).
HOMO: highest occupied molecular orbital (eV).
LUMO: lowest unoccupied molecular orbital (eV).
E g = ELUMO − EHOMO (eV).
Dipole moment (Debye).
3.2.2. The optimized structures of all forms of levo at different pH values
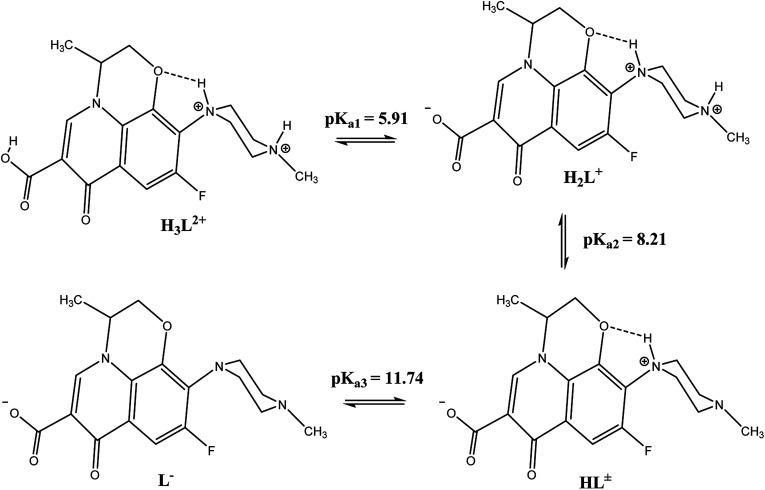
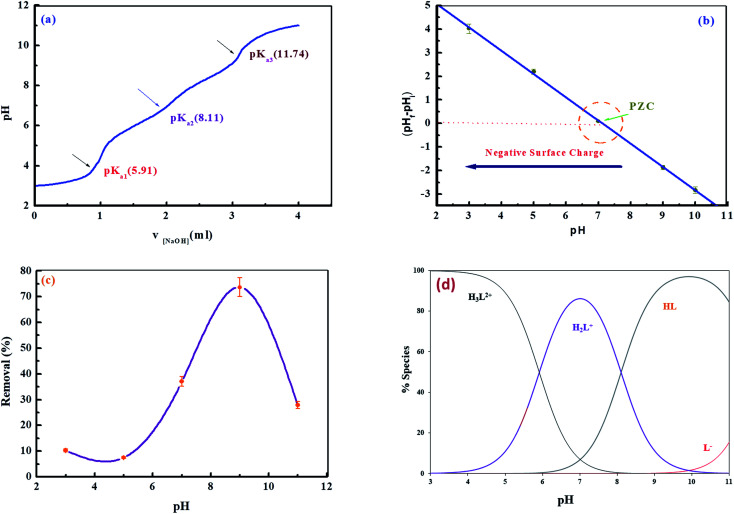
From Scheme 1 and Fig. 8d, which show the concentration distributions, the tri-protonated H3L2+ species is present at low pH up to pH ∼6, the dissociation of the first carboxylic proton occurs at low pH after pH ∼4, and H2L+ is predominant between pH ∼ 6–8.2. The second proton on N3 of the piperazine ring is dissociated after pH ∼ 6 and HL± is predominant in the range of pH ∼ 8.2–11.8. The last proton on N1 of the piperazine ring starts to dissociate after pH ∼ 10 (due to H-bonding between N1–H and O1) and L− is predominant at higher pH.
Scheme 1. The acid-base equilibria of levo at different pH values.
Fig. 8. (a) Potentiometric titration curve of an aqueous solution of levo, (b) point zero charge of the Zn–Al LDH, (c) the removal percentage of levo (15 ppm) by Zn–Al LDH (0.125 g/50 mL) at different solution pH values and (d) species distribution curves of levo at different pH values (d) species distribution curve of levo at different pH.
3.3. Adsorption analysis study
3.3.1. Effect of adsorption pH
The pH value of the solution for the addressed polluted is of critical value as it controls the surface charges of the Zn–Al LDH and the dissociation degrees of the dissolved pollutant.61 Therefore, the effect of pH value on the Zn–Al LDH adsorption system for the adsorption of levo was considered from pH 3 to 11 (Fig. 8c). The plotted curves show an increase in the adsorption percentages from around 10.8% to 50.6% upon an increase in the solution pH from 2 to 11, with the maximum removal percentage achieved at pH 9. The reason for choosing 9 as the optimum pH and not 7 is that the removal efficiency at high pH showed a significant increase at that pH rather than at pH 7, where the surface of the Zn–Al LDH at high pH (i.e. high alkalinity) is highly negatively charged, facilitating the adsorption of levo on its surface, and this was confirmed by the value of the point of zero charge (pH(PZC)), which equals 7 (as illustrated in Fig. 8b) and such reasons provide the LDH surface with promising surface properties for effective electrostatic attraction with the levo HL± zwitterions that have a concentration of 85% at pH 9 (Fig. 8d).62,63
As shown in Fig. 8c, the removal percentage of levo was low at pH 3, which may be due to the decomposition of the synthesized LDH in the acidic medium, causing turbidity of the solution,64 However, at a higher pH of 11 (highly alkaline medium) both the LDH and the pollutant (levo) carry plenty of negative charges on their surfaces leading to a vigorous repulsion force that weakens the adsorption efficacy on the LDH.65,66 Since theoretically it is preferable to carry out the adsorption experiments above the levo pKa, therefore, it is reasonable to experiment within a pH range of 7–9, as shown in Fig. 8c, where the levo is efficiently adsorbed at pH 9, showing the highest adsorption capacity, whereas the lowest was achieved at pH values lower than 5.
3.3.2. Effect of adsorbent dose
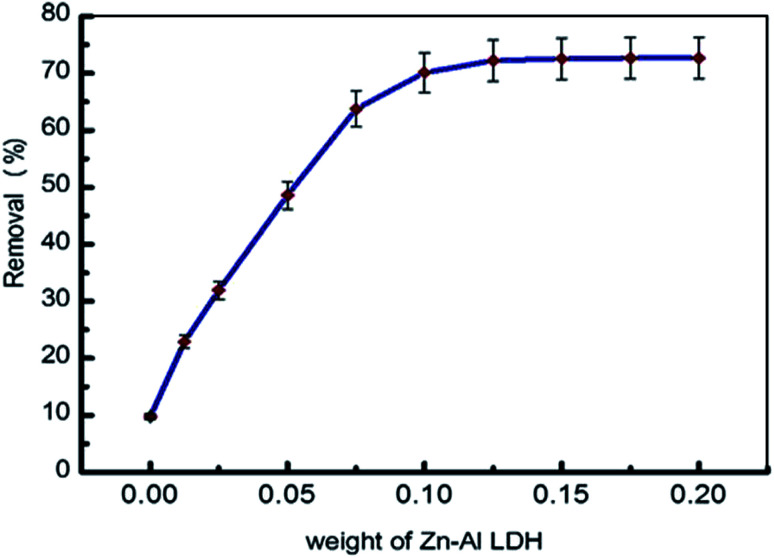
The efficiency of the adsorption process was investigated using various adsorbent doses ranging from 0.0125 g to 0.20 g/50 mL, as shown in Fig. 9, illustrating the significant influence of this parameter. As the Zn–Al LDH dose increases, the adsorption rate sharply increases up to 0.1 g/50 mL, because the number of active sites responsible for adsorption increases,34 but any further increase in the adsorbent dose shows a constancy of the quantity of levo adsorbed on the Zn–Al LDH. This may be related to the proper dispersion of the adsorbent particles in solution, where the adsorbed and exchanged sites of the materials are possibly more open.67
Fig. 9. Effect of the adsorbent dose on the adsorption of levo [15 ppm, 50 mL, and pH = 9].
3.3.3. Adsorption isotherms
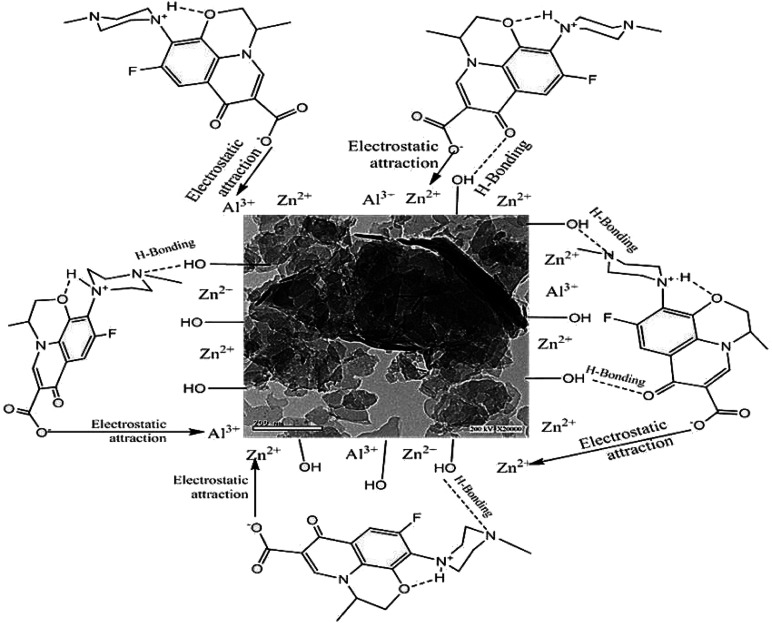
Adsorption isotherms provide us with information and data that can explain the mechanisms implicated in the elimination of the adsorbate by the adsorbent. The applied adsorption isotherm in our work can be used to explain and estimate the relationship between the molecules in the solid and liquid phases at equilibrium (Scheme 2).68
Scheme 2. Suggested mechanisms for the adsorption process.
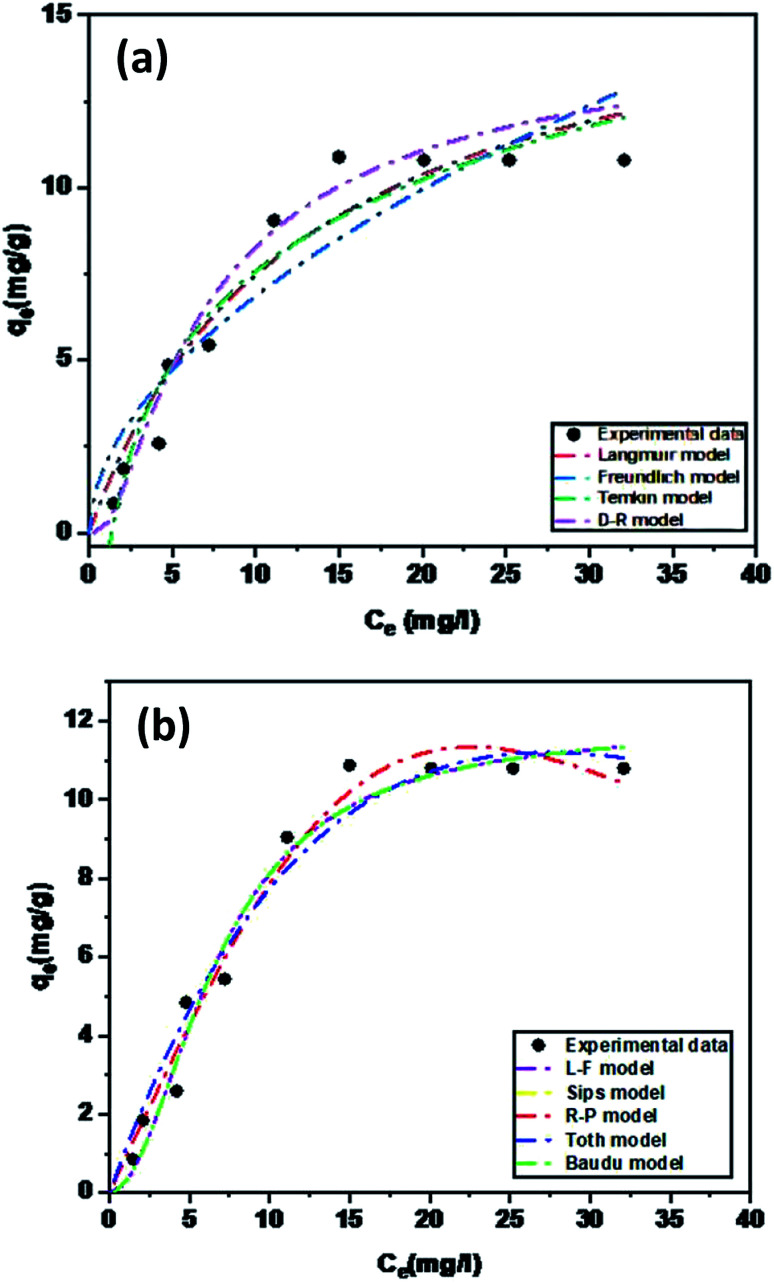
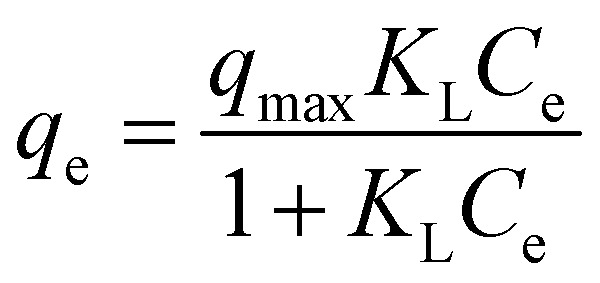
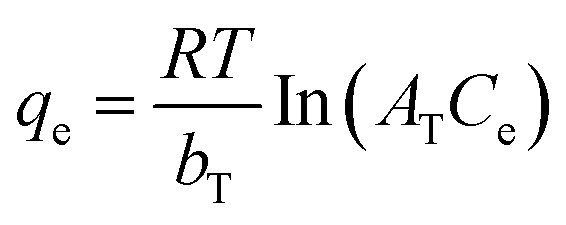
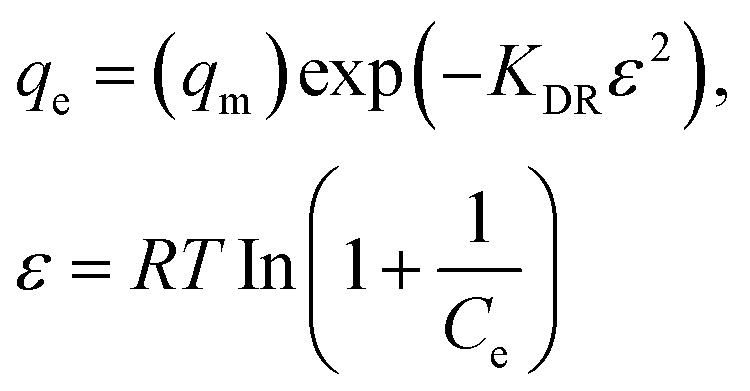
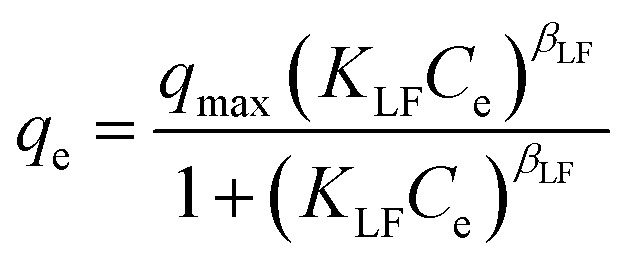
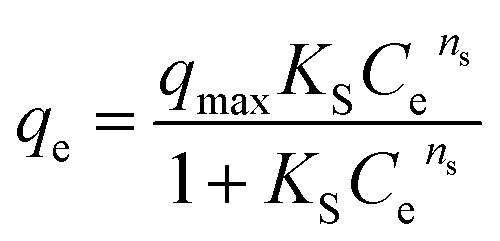
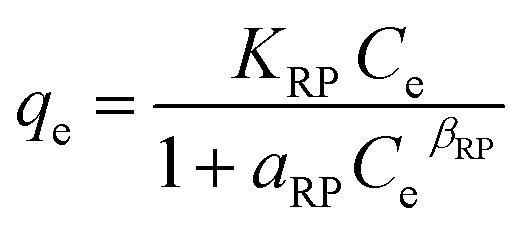
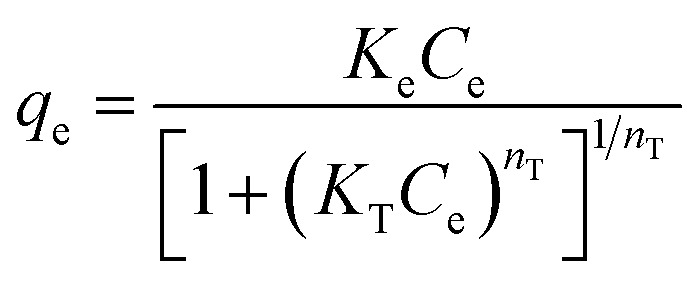
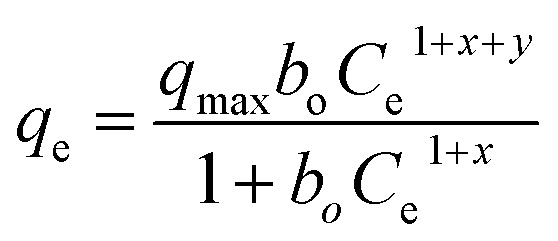
The equilibrium adsorption of levofloxacin onto Zn/Al LDH was studied using different concentrations of levo ranging from 5 to 50 ppm. Nine isotherm models were used to fit the data of the adsorption experiments: four of them were the two-parameter Langmuir, Freundlich, Temkin, and Dubinin–Radushkevich (D–R) isotherm models; four used the three-parameter isotherm models as Langmuir–Freundlich and Sips, Redlich–Peterson, Toth [T1] ; whereas Baudu used the four parameters isotherm model [T1]Q15 it has been modified. The Langmuir isotherm assumes the presence of a homogeneous surface of the adsorbent and the adsorbate accumulates over it as a monolayer coverage, where all the adsorption sites are alike and energetically comparable,69 whereas the Freundlich isotherm model is suitable for multi-layer adsorption on a heterogeneous surface of the adsorbent.70,71 The D–R model can be applied to distinguish between chemical and the physical adsorption.72 The Temkin isotherm model supposes that the adsorption process features an equal distribution of the binding energies and that the reduction in the adsorption heat is linear. The Redlich–Peterson isotherm (R–P) model73,74 can be applied either in heterogeneous or homogenous systems as it combines many elements from the Langmuir and the Freundlich equations.68 It can be used to estimate the equilibrium of the adsorption over a wide range of concentrations. The Sips isotherm model75 is a combination of the Freundlich and Langmuir models. At a low adsorbate concentration, this model is reduced successfully to the Freundlich isotherm, and does not obey Henry's law. The Toth isotherm model76 is another isotherm that helps us to explain the heterogeneous system of adsorption, satisfying both high and low-end boundaries of the concentration. At high concentrations of the adsorbate, it predicts monolayer sorption capacity at lower surface coverage and high concentrations of the adsorbate.77 However, the Baudu isotherm model can be reduced to the Freundlich model (Fig. 10).
Fig. 10. Experimental adsorption isotherm data of levo on the Zn–Al LDH fitted using (a) two-parameter isotherm models and (b) three and four-parameter non-linear isotherm models.
Table 5 shows the parameters of the isotherm models from the adsorption of levo on the Zn–Al LDH study. The adsorption process was well fitted by two, three, and four parameters isotherms. The Redlich–Peterson, Toth, Langmuir–Freundlich, Sips, and Baudu models displayed high regression coefficients. So, the Zn–Al LDH can be considered as an ideal adsorbent for the adsorption process of levo from aqueous solution showing an adsorption capacity (qmax) of 11.87 mg g−1, which was obtained using the five best isotherm models: Redlich–Peterson, Toth, Langmuir–Freundlich, Sips, and Baudu.
The non-linear adsorption isotherm models and their parameters obtained from the fitting results.
| Isotherm models | Expression | Adjustable model parameters* | Values | R 2 |
|---|---|---|---|---|
| Two parameter isotherms | ||||
| Langmuir |
|
q max | 17 | 0.93 |
| K L | 0.08 | |||
| Freundlich | q e = KfCe1/nf | K f | 1.98 | 0.86 |
| 1/nf | 0.53 | |||
| Temkin |
|
b T | 651.39 | 0.93 |
| A T | 0.72 | |||
| Dubinin–Radushkevich |
|
q max | 15 | 0.95 |
| K DR | 0.001 | |||
| Three parameter isotherms | ||||
| Langmuir–Freundlich |
|
q max | 11.87 | 0.97 |
| K LF | 0.15 | |||
| β LF | 1.97 | |||
| Sips |
|
q max | 11.87 | 0.97 |
| K S | 0.02 | |||
| n s | 1.97 | |||
| Redlich–Peterson |
|
K RP | 0.87 | 0.97 |
| a RP | 0.0005 | |||
| Toth |
|
K e | 2.02 | 0.97 |
| K T | 0.01 | |||
| n T | 2.30 | |||
| Four parameter isotherm | ||||
| Baudu |
|
q max | 11.87 | 0.97 |
| b o | 0.02 | |||
| X | 0.00 | |||
| Y | 0.96 | |||
3.3.4. Effect of temperature on the adsorption process
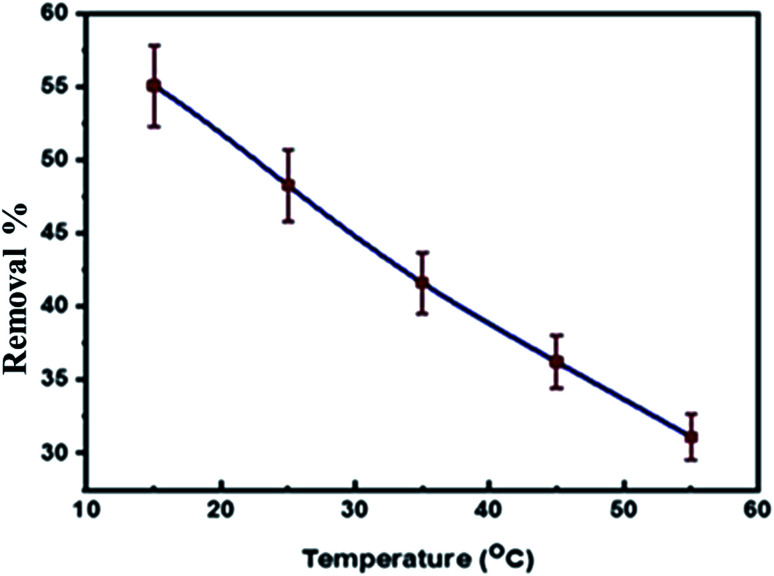
The temperature has a significant influence on the adsorption of levo onto the Zn–Al LDH. The effect of the temperature on the adsorption process was investigated under optimal conditions, which were determined in previous steps (0.125 g dose of adsorbent per 50 mL, 15 ppm concentration of levo, pH = 9 to equilibrium) at different temperatures of 15, 25, 35, 45 and 55 °C. As observed from Fig. 11, the removal efficiency decreased on increasing the temperature due to the exothermic physisorption process so any increase in temperature favors the reverse process, i.e. desorption according to Le Chatelier's principle.50 Therefore, the physisorption decreases with an increase in temperature. Also, it may be related to the weakness of the attraction forces and the hydrogen bonding between the pollutant and the synthesized LDH.78,79 The thermodynamic parameters ΔH°, ΔS° and ΔG° were calculated using the results of the previous experiments (Table 6) and the values of Kd = (qe/ce) were also calculated at various temperatures using the Van't Hoff equation to determine the mechanism of the adsorption process:80
| ln Kd = ΔS°/R − ΔH°/RT | 4 |
where Kd is the equilibrium constant (L mg−1), R is the gas rate constant (8.314 J mol−1 K−1), ΔH° is the enthalpy change of adsorption (kJ mol−1), ΔS° is the entropy of adsorption calculated from the intercept and the slope of the straight-line plot of ln Kdversus 1/T (K−1), and the Gibbs free energy (ΔG°) could be obtained using eqn (7) and (8):
| ΔG° = −RT ln Kd = ΔH° − TΔS° | 5 |
| ln Kd = −ΔH°/R(1/T) + ΔS°/R | 6 |
Fig. 11. The effect of temperature on the levo removal efficiency using Zn–Al LDH.
The thermodynamic parameters for the levo adsorption process using the Zn–Al LDH.
| T (K) | ΔG° (kJ mol−1) | ΔH°(kJ mol−1) | ΔS°(kJ mol−1 K−1) |
|---|---|---|---|
| 288 | 3366.77 | −19.57 | −79.66 |
| 298 | 4160.52 | −19.57 | −79.66 |
| 308 | 4987.72 | −19.57 | −79.66 |
| 318 | 5749.68 | −19.57 | −79.66 |
| 328 | 6553.41 | −19.57 | −79.66 |
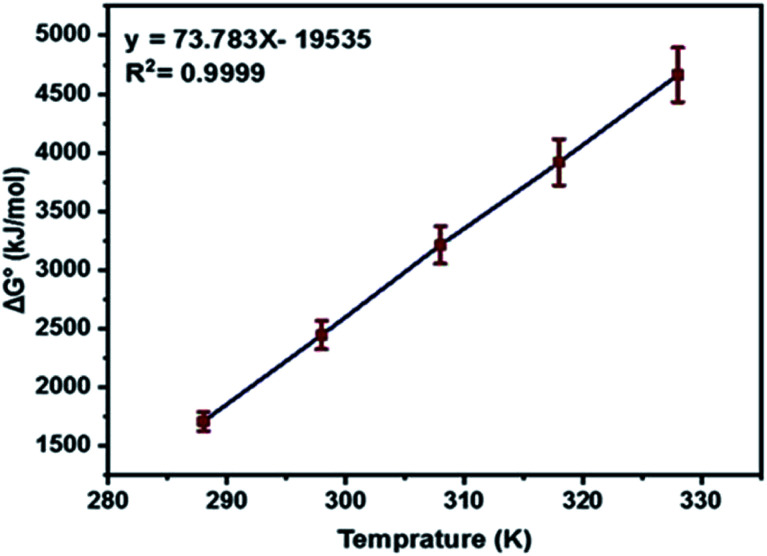
As shown in (Fig. 12) the plot of Gibbs free energy change, ΔG°, versus temperature, T, was a linear fitting. The entropy change, ΔS° and enthalpy change, ΔH°, were obtained from the slope and intercept of a plot of eqn (8).
Fig. 12. Plot of the Gibbs free energy change (ΔG°) versus temperature T (K).
The thermodynamic studies showed negative values for ΔH°, giving a clear idea of an exothermic adsorption experiment, so increasing the temperature of the system does not favor the process in certain cases,81 whereas ΔS° showed decreased randomness during the adsorption of levo onto the surface of Zn/Al LDH.82 The non-spontaneity of the adsorption process was detected according to the positive values of the Gibbs free energy change, ΔG°. Besides this, any further increase in temperature was accompanied by an increase in the Gibbs free energy change ΔG° values, which may be due to the exothermic nature of the adsorption process.83
3.4. Toxicological studies
The LD50 study is the most accurate method for studying the drug safety or the acute toxicological study, especially in an in vivo study as it gives information about the degree of safety of any pharmacological agent.84
Table 7 shows data for the acute toxicity studies of Zn–Al LDH/levo in rats after oral administration. Toxic signs such as arched back, rapid breathing, convulsions, and death were monitored for 48 h after administration in order to fully assess the signs of drug safety or death. After the oral administration of Zn–Al LDH/levo at different doses, the beginning of the mortality was found to be at 200 mg per kg per b wt. The LD50 was calculated to be 520 mg per kg per b wt, and 100% mortality (LD100) was achieved at a dose of 1000 mg per kg per b wt, showing no signs of toxicity or mortality in the rats which were administered by Zn–Al LDH/levo at the normal dose, indicating its safety.
Determination the LD50 values of Zn–Al LDH/levo after oral administration in ratsa.
| Experimental groups | Dose (mg per kg per b wt) | No. of rat/group | No. of dead | A | B | A × B | Σ (A × B) |
|---|---|---|---|---|---|---|---|
| 1st | 200 | 5 | 1 | 200 | 1.5 | 300 | 2400 |
| 2nd | 400 | 5 | 2 | 200 | 2.5 | 500 | |
| 3rd | 600 | 5 | 3 | 200 | 3.5 | 700 | |
| 4th | 800 | 5 | 4 | 200 | 4.5 | 900 | |
| 5th | 1000 | 5 | 5 | 200 | — | — |
 . “Minimum lethal dose of Zn–Al LDH/GA = 520 mg per kg per b wt”. Therapeutic dose 1/50th = 10 mg per kg per b wt.
3.5. Evaluation of the anti-inflammatory effect
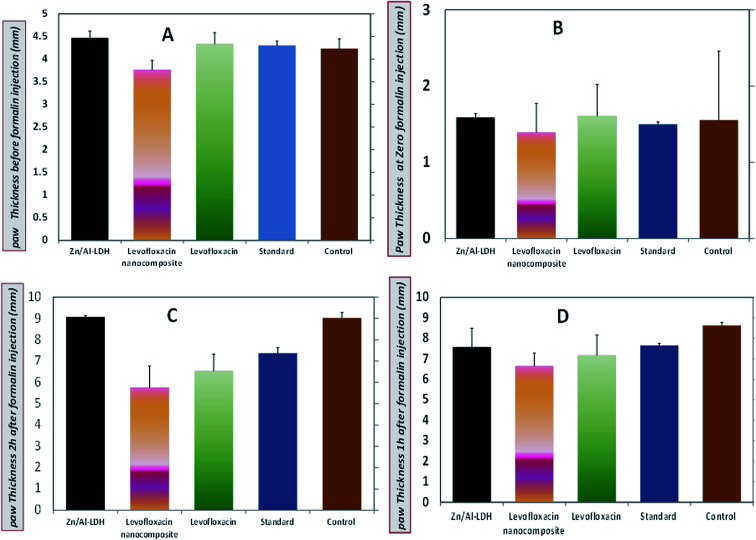
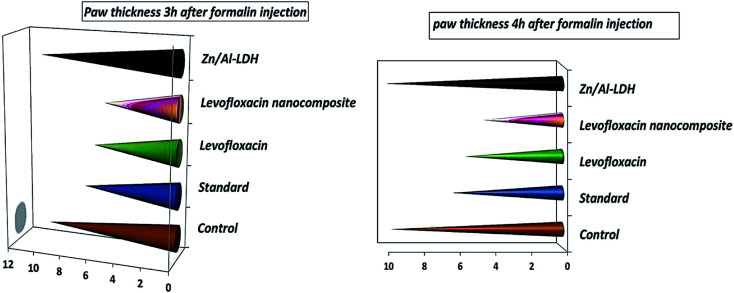
Zn–Al-LDH/levo at a dose of (10 mg per kg per b wt) exhibited anti-inflammatory activity against formalin induced-paw edema compared with that exhibited by standard diclofenac sodium at a dose of (30 mg kg−1) for 4 h post-administration (Fig. 13 and 14).
Fig. 13. Paw thickness (anti-inflammatory activity) of levo, Zn–Al LDH/levo, Zn–Al LDH, diclofenac sodium (standard group), and non-treated (control group) at (A) pre-inflammation, (B) zero time and (C and D) post inflammation induction at 1 and 2 h, respectively.
Fig. 14. Paw thickness (anti-inflammatory activity) of the levo, Zn–Al LDH/levo, Zn–Al LDH, diclofenac sodium (standard group), and non-treated (control group) groups at 3 and 4 h.
The larger the paw thickness the lower the anti-inflammatory activity due to edema and inflammation signs, so the largest value was for the control negative non-treated group followed by the Zn/Al-LDH, the standard, normal levo and the levo-nanocomposite.
Our novel nanocomposite played a significant role as an anti-inflammatory material in the inhibition of inflammation in a rat model of an inflamed paw, which is just as important as the crucial role played by nitroxyl (HNO) in the inhibition of induced inflammation in a rat model of gouty arthritis.85
3.6. Histopathological findings
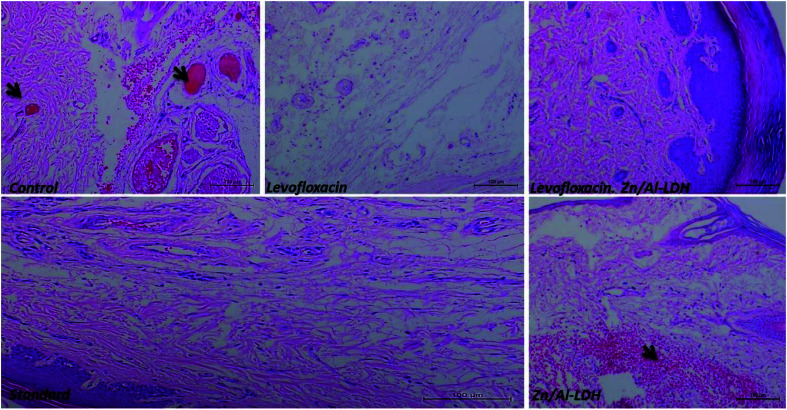
In the histopathological studies, the anti-inflammatory activity was evaluated through both macroscopic and microscopic investigation. All the inflammatory signs were still present in the control non-treated group when viewed microscopically whereas the rats administered with the Zn–Al LDH in the standard group suffered from slight congestion. However, all of the infiltrated inflammatory cells, inflammation signs like redness, congestion, and subcutaneous edema all disappeared in both cases where levofloxacin was administered, either in its normal or nanocomposite form, indicating their anti-inflammatory effects (Fig. 15). Also, the anti-inflammatory activity increased significantly in the case of the nanocomposite than for the drug alone. This was determined microscopically from the significant decrease in the skin size and edema signs in the case of the nanocomposite treatment compared with the drug alone, which showed low inflammatory cells like mast cells with the appearance of a slight congestion, whereas their absence in the microscopy images of the sample treated with the nanocomposite treatment might be attributed to an increase in the surface area of the levo on the surface of the Zn–Al LDH. This follows a study on the intercalation of mefenamic acid with a LDH, illustrating the enhancement in the anti-inflammatory activity, hemolytic effect, and antinociceptive potential against induced inflammation,86 and also the improvement in the anti-inflammatory activity of non-steroidal ketoprofen when intercalated with the LDH,87 whereas a significant reduction in cell viability of BxPC3 cells was achieved when treated with VP-intercalated LDH, resulting in a 30-fold reduction in the IC50 compared to that of the drug alone.88 The importance of using a nanocomposite formed via the intercalation of a drug with a nanoscale LDH was also clearly illustrated when loading certain antibiotics such as doxycycline (DOX) and amoxicillin (AMOX) onto the surface of Mg–Al/LDH, used to prevent ulcer formation and improve wound healing process in a shorter time than using the drugs alone.89
Fig. 15. Histopathological investigation of the paws of rats carried out 4 h post-inflammation induction in the different groups. The black arrows refer to the signs of inflammation (congestion, redness), thrombus formation, edema, and the appearance of inflammatory cells like mast cells and eosinophils in control non-treated, Zn–Al LDH, which were very mild in the standard group. There was the absence of inflammation signs in the levofloxacin and levofloxacin nanocomposite groups samples.
Our study determined that Zn–Al LDH/levo can be safely used in various biomedical purposes, taking into consideration the previous studies on LDH systems that stated their safety and biocompatibility,36 facilitating their wide use in different pharmaceutical technologies,90 besides their use as drug supports or drug delivery systems following various previous studies about the safety of LDHs.34,89,91
In this study, levofloxacin showed a noticeable increase in its effectiveness and activity as an anti-inflammatory substance after being loading onto Zn–Al LDH as a result of the increase in its surface area.
4. Conclusion
In this study, a Zn–Al LDH was synthesized using a co-precipitation method and used as an efficient adsorbent for the removal of levofloxacin from aqueous solution. Based on batch adsorption experiments, it was found that the adsorption efficiency was greatly influenced by pH, adsorbent dose, and temperature, showing a high adsorption capacity at pH 9, for an adsorbent dose of 0.125 g at a temperature of 15 °C. Also, the adsorption process of levofloxacin on Zn–Al LDH was characterized and confirmed using different techniques such as FTIR spectroscopy, XRD, FESEM, HRTEM, and surface area measurements. The equilibrium data were confirmed using nine isothermal models, where the qmax was determined to be 11.87 mg g−1. Also, the safety and toxicity of the administered Zn–Al LDH/levo were investigated, illustrating the safety of the formed nanocomposite (Zn–Al LDH/levo), and qualifying its use as a safe anti-inflammatory material.
Abbreviations
- LDH
Layered double hydroxide
- Levo
Levofloxacin hemihydrate
- DFT
Density functional theory
- EDX
Energy dispersive X-ray spectroscopy
- LD
Lethal dose
- LD50
The amount of a material, given all at once, which causes the death of 50% (one half) of a group of test animals
- LD100
The lowest dose of a substance that under defined conditions is lethal for 100% of exposed animals
- b wt
Bodyweight
- RQ
Risk quotient
- FDA
The Food and Drug Administration
- FESEM
Field emission scanning electron microscopy
- FTIR
Fourier-transform infrared
- BET
Brunauer–Emmett–Teller
- Ppm
parts per million
- PZC
Point of zero charge
- H-Bonding
Hydrogen-bonding
- IAEC
Institutional Animal Ethics Committee
- XRD
X-ray diffraction
- q max
Maximum adsorption capacity (mg g−1)
- q e
Refers to the amount of adsorbate in the adsorbent at equilibrium (mg g−1)
- C e
The equilibrium concentration (mg L−1)
- K f
Freundlich adsorption capacity (mg g−1)
- b T
Temkin isotherm constant
- A T
Temkin isotherm equilibrium binding constant (L mg−1)
- K DR
Dubinin–Radushkevich constant
- R
The gas constant (8.31 J mol−1 K−1)
- T
The absolute temperature (K)
- K LF
Langmuir–Freundlich equilibrium constant for heterogeneous solids
- 1/nF
Freundlich adsorption intensity
- K S
The Sips isotherm model constant (L mg−1)
- n s
The Sips isotherm exponent
- b o
The Baudu equilibrium constant
- x and y
The Baudu parameters
- Kd
The equilibrium constant (L mg−1)
- ΔS°
The entropy of adsorption
- ΔH°
The enthalpy change of adsorption (kJ mol−1)
- ΔG°
Gibbs free energy
Conflicts of interest
The authors confirm that there are no conflicts of interest associated with this publication.
Supplementary Material
Electronic supplementary information (ESI) available. See DOI: 10.1039/d0ra04898d
References
- Carvalho I. T. Santos L. Environ. Int. 2016;94:736–757. doi: 10.1016/j.envint.2016.06.025. [DOI] [PubMed] [Google Scholar]
- Martínez J. L. Science. 2008;321(5887):365–367. doi: 10.1126/science.1159483. [DOI] [PubMed] [Google Scholar]
- Martinez J. L. Proc. R. Soc. London, Ser. B. 2009;276:2521–2530. doi: 10.1098/rspb.2009.0320. [DOI] [PMC free article] [PubMed] [Google Scholar]
- Diwan V. Tamhankar A. J. Khandal R. K. Sen S. Aggarwal M. Marothi Y. V Iyer R. Sundblad-Tonderski K. Stålsby-Lundborg C. BMC Public Health. 2010;10:414. doi: 10.1186/1471-2458-10-414. [DOI] [PMC free article] [PubMed] [Google Scholar]
- Kümmerer K. Chemosphere. 2009;75:417–434. doi: 10.1016/j.chemosphere.2008.11.086. [DOI] [PubMed] [Google Scholar]
- Al-Bahry S. N. Al-Hinai J. A. Mahmoud I. Y. Al-Musharafi S. K. APCBEE Proc. 2013;5:339–343. doi: 10.1016/j.apcbee.2013.05.058. [DOI] [Google Scholar]
- Le-Minh N. Khan S. J. Drewes J. E. Stuetz R. M. Water Res. 2010;44:4295–4323. doi: 10.1016/j.watres.2010.06.020. [DOI] [PubMed] [Google Scholar]
- Hashimoto S. Matsumoto K. Gon Y. Maruoka S. Hayashi S. Asai Y. Machino T. Horie T. Life Sci. 2000;66:77–82. doi: 10.1016/S0024-3205(00)00410-0. [DOI] [PubMed] [Google Scholar]
- Hanna N. Sun P. Sun Q. Li X. Yang X. Ji X. Zou H. Ottoson J. Nilsson L. E. Berglund B. Environ. Int. 2018;114:131–142. doi: 10.1016/j.envint.2018.02.003. [DOI] [PubMed] [Google Scholar]
- Homem V. Santos L. J. Environ. Manage. 2011;92:2304–2347. doi: 10.1016/j.jenvman.2011.05.023. [DOI] [PubMed] [Google Scholar]
- Ali I. Sep. Purif. Rev. 2014;43:175–205. doi: 10.1080/15422119.2012.748671. [DOI] [Google Scholar]
- Li M. Wei D. Du Y. J. Environ. Sci. 2014;26:1837–1842. doi: 10.1016/j.jes.2014.06.023. [DOI] [PubMed] [Google Scholar]
- Gulkowska A. He Y. So M. K. Yeung L. W. Y. Leung H. W. Giesy J. P. Lam P. K. S. Martin M. Richardson B. J. Mar. Pollut. Bull. 2007;54:1287–1293. doi: 10.1016/j.marpolbul.2007.04.008. [DOI] [PubMed] [Google Scholar]
- Zhu X. Yang K. Chen B. Environ. Sci.: Nano. 2017;4:2267–2285. doi: 10.1039/C7EN00548B. [DOI] [Google Scholar]
- Santhosh C. Velmurugan V. Jacob G. Jeong S. K. Grace A. N. Bhatnagar A. Chem. Eng. J. 2016;306:1116–1137. doi: 10.1016/j.cej.2016.08.053. [DOI] [Google Scholar]
- Fu F. Wang Q. J. Environ. Manage. 2011;92:407–418. doi: 10.1016/j.jenvman.2010.11.011. [DOI] [PubMed] [Google Scholar]
- Perioli L. Ambrogi V. Pagano C. Massetti E. Rossi C. Colloids Surf., B. 2011;84:413–420. doi: 10.1016/j.colsurfb.2011.01.035. [DOI] [PubMed] [Google Scholar]
- Halling-Sørensen B. Nielsen S. N. Lanzky P. F. Ingerslev F. Lützhøft H. C. H. Jørgensen S. Chemosphere. 1998;36:357–393. doi: 10.1016/S0045-6535(97)00354-8. [DOI] [PubMed] [Google Scholar]
- Petrović M. Gonzalez S. Barceló D. TrAC, Trends Anal. Chem. 2003;22:685–696. doi: 10.1016/S0165-9936(03)01105-1. [DOI] [Google Scholar]
- Choi S.-J. Oh J.-M. Choy J.-H. J. Mater. Chem. 2008;18:615–620. doi: 10.1039/B711208D. [DOI] [Google Scholar]
- Xu Z. P. Lu G. Q. Pure Appl. Chem. 2006;78:1771–1779. [Google Scholar]
- Albrecht W. S., Albrecht C. C. and Albrecht C. O., Fraud examination, Thomson South-Western, Mason, OH, 2006 [Google Scholar]
- Tanaka M. Kurata T. Fujisawa C. Ohshima Y. Aoki H. Okazaki O. Hakusui H. Antimicrob. Agents Chemother. 1993;37:2173–2178. doi: 10.1128/AAC.37.10.2173. [DOI] [PMC free article] [PubMed] [Google Scholar]
- Ullah A. Zahoor M. Alam S. Ullah R. Alqahtani A. S. Mahmood H. M. BioMed Res. Int. 2019;1:1–13. doi: 10.1155/2019/5276841. [DOI] [PMC free article] [PubMed] [Google Scholar]
- Chen Z. Ma W. Lu G. Meng F. Duan S. Zhang Z. Wei L. Sep. Purif. Technol. 2019;222:30–34. doi: 10.1016/j.seppur.2019.04.010. [DOI] [Google Scholar]
- Tony M. A. Parker H. L. Clark J. H. Water Environ. J. 2019;33:401–408. doi: 10.1111/wej.12412. [DOI] [Google Scholar]
- Yu Y. Wang W. Shi J. Zhu S. Yan Y. Environ. Sci. Pollut. Res. 2017;24:10685–10694. doi: 10.1007/s11356-017-8700-7. [DOI] [PubMed] [Google Scholar]
- Yi S. Gao B. Sun Y. Wu J. Shi X. Wu B. Hu X. Chemosphere. 2016;150:694–701. doi: 10.1016/j.chemosphere.2015.12.112. [DOI] [PubMed] [Google Scholar]
- Limbikai S. S. Deshpande N. A. Kulkarni R. M. Khan A. A. P. Khan A. Desalin. Water Treat. 2016;57:23918–23926. doi: 10.1080/19443994.2016.1138330. [DOI] [Google Scholar]
- Mohammed-Ridha M. J. Abdul-Ahad M. Y. J. Eng. 2014;20:88–104. [Google Scholar]
- Tsivkovskii R. Sabet M. Tarazi Z. Griffith D. C. Lomovskaya O. Dudley M. N. FEMS Immunol. Med. Microbiol. 2011;61:141–146. doi: 10.1111/j.1574-695X.2010.00755.x. [DOI] [PubMed] [Google Scholar]
- Yoshimura T. Kurita C. Usami E. Nakao T. Shino W. Kobayashi J. Yamazaki F. Nagai Y. Chemotherapy. 1996;42:459–464. doi: 10.1159/000239480. [DOI] [PubMed] [Google Scholar]
- Khan A. M. Rampal S. Sood N. K. Environ. Sci. Pollut. Res. 2018;25:8853–8860. doi: 10.1007/s11356-018-1216-y. [DOI] [PubMed] [Google Scholar]
- Younes H. Khaled R. Mahmoud H. Hossam F. Abdelrahman M. Abo El-Ela F. Taha M. J. Taiwan Inst. Chem. Eng. 2019;102:297–311. doi: 10.1016/j.jtice.2019.06.018. [DOI] [Google Scholar]
- Şepeli D. Goreacioc T. Lupaşcu T. Filippov M. Rusu M. Chem. J. Mold. 2015;10:113–115. [Google Scholar]
- Cavani F. Trifirò F. Vaccari A. Catal. Today. 1991;11:173–301. doi: 10.1016/0920-5861(91)80068-K. [DOI] [Google Scholar]
- Reichle W. T. Solid State Ionics. 1986;22:135–141. doi: 10.1016/0167-2738(86)90067-6. [DOI] [Google Scholar]
- Del Arco M. Cebadera E. Gutiérrez S. Martín C. Montero M. J. Rives V. Rocha J. Sevilla M. A. J. Pharm. Sci. 2004;93:1649–1658. doi: 10.1002/jps.20054. [DOI] [PubMed] [Google Scholar]
- Zou W. Bai H. Gao S. Li K. Korean J. Chem. Eng. 2013;30:111–122. doi: 10.1007/s11814-012-0096-y. [DOI] [Google Scholar]
- Larous S. Meniai A.-H. Int. J. Hydrogen Energy. 2016;41:10380–10390. doi: 10.1016/j.ijhydene.2016.01.096. [DOI] [Google Scholar]
- Shehata M. R. Shoukry M. M. Abdel Wahab A. M. Phys. Chem. Liq. 2020:1–14. doi: 10.1080/00319104.2020.1752689. [DOI] [Google Scholar]
- Lorke D. Arch. Toxicol. 1983;54:275–287. doi: 10.1007/BF01234480. [DOI] [PubMed] [Google Scholar]
- Suvarna K. S., Layton C. and Bancroft J. D., Bancroft's Theory and Practice of Histological Techniques E-Book, Elsevier Health Sciences, 2018 [Google Scholar]
- Snedecor G. W. and Cochran W. G., Statistical Methods (7th Edit., 2nd printing), IOWA State Univ. Press. Ames, IWA, USA, 1982, vol. 507, pp. 53–57 [Google Scholar]
- Abu-Dief A. M. Abdel-Rahman L. H. Abdelhamid A. A. Marzouk A. A. Shehata M. R. Bakheet M. A. Almaghrabi O. A. Nafady A. Spectrochim. Acta, Part A. 2020;228:117700. doi: 10.1016/j.saa.2019.117700. [DOI] [PubMed] [Google Scholar]
- Mahjoubi F. Z. Khalidi A. Abdennouri M. Barka N. J. Taibah Univ. Sci. 2017;11(1):90–100. doi: 10.1016/j.jtusci.2015.10.007. [DOI] [Google Scholar]
- Abd Elhaleem M. B. Farghali A. A. El-Shahawy A. A. G. El-Ela F. I. A. Eldine Z. E. Mahmoud R. K. RSC Adv. 2020;10:13196–13214. doi: 10.1039/C9RA08355C. [DOI] [PMC free article] [PubMed] [Google Scholar]
- Kloprogge T. Wharton D. Hickey L. Frost R. Am. Mineral. 2002;87:623–629. doi: 10.2138/am-2002-5-604. [DOI] [Google Scholar]
- Balcomb B. Singh M. Singh S. ChemistryOpen. 2015;4:137–145. doi: 10.1002/open.201402074. [DOI] [PMC free article] [PubMed] [Google Scholar]
- Abo El-Reesh G. Y. Farghali A. A. Taha M. Mahmoud R. K. Sci. Rep. 2020;10:1–20. doi: 10.1038/s41598-019-56847-4. [DOI] [PMC free article] [PubMed] [Google Scholar]
- Zhu S. Jiao S. Liu Z. Pang G. Feng S. Environ. Sci.: Nano. 2014;1:172–180. doi: 10.1039/C3EN00078H. [DOI] [Google Scholar]
- Kavitha K. Rajas N. J. Int. J. PharmTech Res. 2011;3(2):702–706. [Google Scholar]
- Mouzam M. I. Dehghan M. H. G. Asif S. Sahuji T. Chudiwal P. Saudi Pharm J. 2011;19(2):85–93. doi: 10.1016/j.jsps.2011.01.004. [DOI] [PMC free article] [PubMed] [Google Scholar]
- Komarala E. P. Doshi S. Thiyagarajan S. Aslam M. Bahadur D. New J. Chem. 2018;42:129–136. doi: 10.1039/C7NJ03622A. [DOI] [Google Scholar]
- Siafaka P. Okur M. E. Ayla Ş. Er S. Cağlar E. Ş. Okur N. Ü. Brazilian J. Pharm. Sci. [Google Scholar]
- Zhao X. Yi S. Dong S. Xu H. Sun Y. Hu X. Chem. Speciation Bioavailability. 2018;30:68–75. doi: 10.1080/09542299.2018.1487775. [DOI] [Google Scholar]
- Balaji R. A. Raghunathan S. Revathy R. Egypt. Pharm. J. 2015;14:30. doi: 10.4103/1687-4315.154705. [DOI] [Google Scholar]
- Liu H. Adhikari R. Guo Q. Adhikari B. J. Food Eng. 2013;116:588–597. doi: 10.1016/j.jfoodeng.2012.12.037. [DOI] [Google Scholar]
- Naseem S. Gevers B. Boldt R. Labuschagné F. J. W. J. Leuteritz A. RSC Adv. 2019;9:3030–3040. doi: 10.1039/C8RA10165E. [DOI] [PMC free article] [PubMed] [Google Scholar]
- Moaty S. A. Mahmoud R. K. Mohamed N. A. Gaber Y. Farghali A. A. Wahed M. S. M. Younes H. A. Microporous Mesoporous Mater. 2018;260:84–92. doi: 10.1016/j.micromeso.2017.10.041. [DOI] [Google Scholar]
- Li J. Wang X. Wang J. Li Y. Xia S. Zhao J. Chem. Eng. J. 2019;362:802–811. doi: 10.1016/j.cej.2019.01.094. [DOI] [Google Scholar]
- Elkhattabi E. H. Lakraimi M. Berraho M. Legrouri A. Hammal R. El Gaini L. Bull. Mater. Sci. 2017;40:745–751. doi: 10.1007/s12034-017-1414-0. [DOI] [Google Scholar]
- Starukh G. Rozovik O. Oranska O. Nanoscale Res. Lett. 2016;11:228. doi: 10.1186/s11671-016-1402-0. [DOI] [PMC free article] [PubMed] [Google Scholar]
- Khan A. I. O’Hare D. ChemInform. 2003;34:3191–3198. [Google Scholar]
- Mohammed-Ali M. A. J. J. Chem. Pharm. Res. 2012;4:1319–1326. [Google Scholar]
- Tariq S. Rizvi S. F. A. Anwar U. Biomed. J. Sci. & Tech. Res. 2018;7(2):10–11. [Google Scholar]
- Abdelkader N. B. H. Bentouami A. Derriche Z. Bettahar N. De Menorval L. C. Chem. Eng. J. 2011;169(1–3):231–238. doi: 10.1016/j.cej.2011.03.019. [DOI] [Google Scholar]
- Brdar M. Šćiban M. Takači A. Došenović T. Chem. Eng. J. 2012;183:108–111. doi: 10.1016/j.cej.2011.12.036. [DOI] [Google Scholar]
- Langmuir I. J. Am. Chem. Soc. 1918;40:1361–1403. doi: 10.1021/ja02242a004. [DOI] [Google Scholar]
- Nagy B. Mânzatu C. Măicăneanu A. Indolean C. Barbu-Tudoran L. Majdik C. Arabian J. Chem. 2017;10:S3569–S3579. doi: 10.1016/j.arabjc.2014.03.004. [DOI] [Google Scholar]
- Sadeghalvad B. Khosravi S. Azadmehr A. R. Russ. J. Phys. Chem. A. 2016;90:2285–2291. doi: 10.1134/S0036024416110030. [DOI] [Google Scholar]
- Dubinin M. M. Chem. Rev. 1960;60:235–241. doi: 10.1021/cr60204a006. [DOI] [Google Scholar]
- Temkin M. I. Acta Physicochim. URSS. 1940;12:327–356. [Google Scholar]
- Redlich O. Peterson D. L. J. Phys. Chem. 1959;63:1024. doi: 10.1021/j150576a611. [DOI] [Google Scholar]
- Sips R. J. Chem. Phys. 1948;16:490–495. doi: 10.1063/1.1746922. [DOI] [Google Scholar]
- Toth J. Acta Chim. Hung. 1971;69:311–328. [Google Scholar]
- Zaher A. Taha M. Farghali A. Environ. Sci. Pollut. Res. 2020;27:12256–12269. doi: 10.1007/s11356-020-07750-3. [DOI] [PubMed] [Google Scholar]
- Sakurai A. Yamamoto T. Makabe A. Kinoshita S. Sakakibara M. J. Chem. Technol. Biotechnol. 2002;77:92–101. doi: 10.1002/jctb.519. [DOI] [Google Scholar]
- Horsfall Jnr M. Spiff A. Electron. J. Biotechnol. 2005;8(2):162–169. doi: 10.2225/vol8-issue2-fulltext-4. [DOI] [Google Scholar]
- Sarin V. Singh T. S. Pant K. K. Bioresour. Technol. 2006;97:1986–1993. doi: 10.1016/j.biortech.2005.10.001. [DOI] [PubMed] [Google Scholar]
- Sepehr M. N. Al-Musawi T. J. Ghahramani E. Kazemian H. Zarrabi M. Arabian J. Chem. 2017;10:611–623. doi: 10.1016/j.arabjc.2016.07.003. [DOI] [Google Scholar]
- Gupta V. K. Ind. Eng. Chem. Res. 1998;37:192–202. doi: 10.1021/ie9703898. [DOI] [Google Scholar]
- Elwakeel K. Z. Atia A. A. Guibal E. Bioresour. Technol. 2014;160:107–114. doi: 10.1016/j.biortech.2014.01.037. [DOI] [PubMed] [Google Scholar]
- Akhila J. S. Shyamjith D. Alwar M. C. Curr. Sci. 2007:917–920. [Google Scholar]
- Huang Y. Zhang X. He N. Wang Y. Kang Q. Shen D. Yu F. Chen L. J. Mater. Chem. B. 2019;7:305–313. doi: 10.1039/C8TB02494D. [DOI] [PubMed] [Google Scholar]
- Cunha V. R. R. Guilherme V. A. de Paula E. de Araujo D. R. Silva R. O. Medeiros J. V. R. Leite J. R. S. A. Petersen P. A. D. Foldvari M. Petrilli H. M. Constantino V. R. L. Mater. Sci. Eng., C. 2016;58:629–638. doi: 10.1016/j.msec.2015.08.037. [DOI] [PubMed] [Google Scholar]
- Park M. C. Kim H. Park D. H. Yang J. H. Choy J. H. Bull. Korean Chem. Soc. 2012;33:1827–1828. doi: 10.5012/bkcs.2012.33.6.1827. [DOI] [Google Scholar]
- Nagaraj V. J. Sun X. Mehta J. Martin M. Ngo T. Dey S. K. J. Nanotechnol. 2015:350370. [Google Scholar]
- El-Ela F. I. A. Farghali A. A. Mahmoud R. K. Mohamed N. A. Moaty S. A. A. Sci. Rep. 2019;9:6418. doi: 10.1038/s41598-019-42842-2. [DOI] [PMC free article] [PubMed] [Google Scholar]
- Khan A. I. Lei L. Norquist A. J. O'Hare D. Chem. Commun. 2001:2342–2343. doi: 10.1039/B106465G. [DOI] [PubMed] [Google Scholar]
- Kura A. U. Cheah P.-S. Hussein M. Z. Hassan Z. Tengku Azmi T. I. Hussein N. F. Fakurazi S. Nanoscale Res. Lett. 2014;9:261. doi: 10.1186/1556-276X-9-261. [DOI] [PMC free article] [PubMed] [Google Scholar]
Associated Data
This section collects any data citations, data availability statements, or supplementary materials included in this article.


