Abstract
The exploitation of beidellite clay (BDT), used as a nanofiller in the preparation of poly(butylene succinate) (PBS)/organoclay biodegradable nanocomposites, was investigated. A series of bionanocomposites with various loadings of the organoclay (3CTA-BDT) were prepared by in situ polycondensation reaction between succinic anhydride (SuAh) and 1,4-butanediol (1,4-BD) at atmospheric pressure in refluxing decalin with azeotropic removal of water, and the reaction was catalyzed by non-toxic bismuth chloride (BiCl3). X-ray diffraction (XRD) and scanning electron microscopy (SEM) results showed that 3CTA-BDT was likely exfoliated and well dispersed in PBS matrix. Thermal properties (TGA, DSC and thermal conductivity), contact angle measurements and water vapor sorption behavior of the corresponding nanocomposites were also discussed. Compared to pure PBS, a significant reduction of the diffusion coefficient and the water vapor permeability (WVP) by 44 and 37%, respectively, was observed by adding only 5 wt% of 3CTA-BDT. These results could make these bionanocomposites suitable materials for food packaging application.
The exploitation of beidellite clay (BDT), used as a nanofiller in the preparation of poly(butylene succinate) (PBS)/organoclay biodegradable nanocomposites, was investigated. Their thermal and water vapor barrier properties were also studied.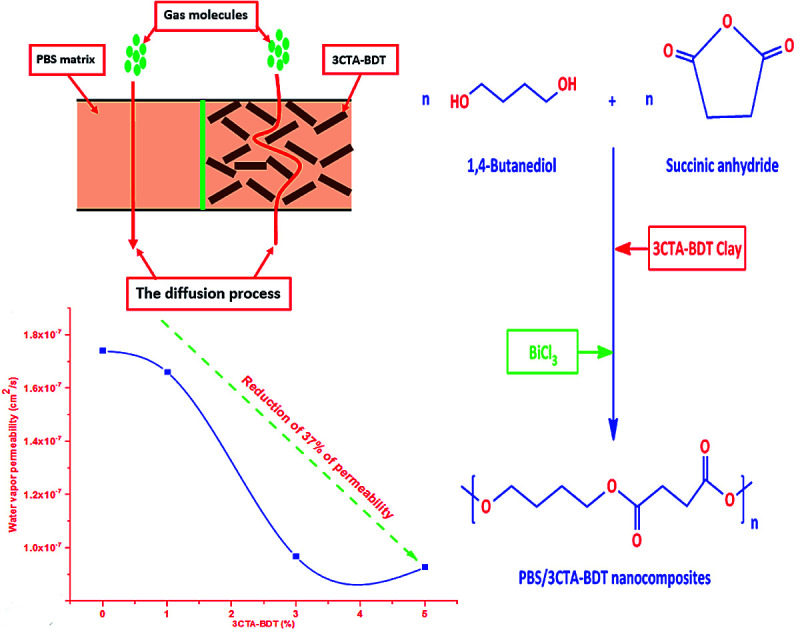
1. Introduction
Petrochemical-based synthetic polymers have brought extensive benefits to mankind in many aspects such as in packaging and agricultural applications. The production volume of plastics worldwide increased from 1950 to 2018. In 2018, global plastics production was estimated at around 359 million tons while its production in 1950 was only 1.5 million tons.1 The rapid growth of the use of plastics in our daily life has become an important issue due to the resulting global environmental problems. In particular because the packaging materials end up as dangerous, non-biodegradable waste. Therefore, to solve the problems related to the recovery of plastic waste, biobased and synthetic biodegradable polymers with excellent and promising properties are still an attractive solution for researchers, scientists, and engineers throughout the world today. In particular, aliphatic biodegradable polyesters have attracted considerable attention as substitutes for traditional polymers in high-volume agriculture and packaging applications, as well as in more specialized biomedical and pharmaceutical areas.2–6 Poly(butylene succinate), PBS, is one of the most promising biodegradable aliphatic polyesters. It is chemically synthesized by polycondensation of 1,4-butanediol and succinic acid (monomer based on renewable resources), and is commercially available under the trade name Bionolle™ 1001, supplied by Showa Polymers, Japan. PBS is a biodegradable aliphatic semicrystalline polyester, possessing very attractive properties. It exhibits a melting point close to that of low-density polyethylene (LDPE) and its tensile strength lies between that of high density polyethylene (HDPE) and isotactic polypropylene (PP). Furthermore, PBS has many outstanding features, apart from the aforementioned biodegradability characteristics, such as melt processability and excellent thermal and chemical resistance, which open up a wide area of potential applications such as food packaging and agriculture.7–11 However, other properties of PBS, such as tensile, melt viscosity for further processing, and gas-barrier properties, are frequently insufficient for various end-use applications.12–14 Moreover, the modulus of PBS plastic is relatively low, (300–500 MPa), and its price is much higher than traditional thermoplastics. Packaging materials must provide sufficient barriers against water vapor and atmospheric gases to prevent oxidation and degradation of food and to preserve the aromas and the flavors of the food and also to evaluate the compatibility of these materials with the food.15 To overcome some of these drawbacks of PBS, there are several potential approaches available for enhancing the gas barrier properties of a polymer including copolymerization, use of polymer blends, and introduction of fillers.16–18 In fact, PBS has been copolymerized with adipic acid in the presence of a multifunctional glycol and the resulting poly(butylene succinate-co-adipate) copolymer was found to be exceptional for production of films or bottles, without significantly altered biodegradation characteristics. This copolymer is commercially available under the trade name Bionolle™ 3000MD. Indeed, the compatibility of biodegradable PBS and poly(lactic acid) (PLA) blends for packaging application was studied.19,20 Siracusa et al. have investigated the permeability behavior of PBS and poly(butylene succinate-co-adipate) (PBSA) blend polymers after food contact simulants and photo and thermal-oxidative degradation processes.21 However, the higher cost of these packaging materials has an impact on the food prices. The higher cost of PBS and its polymers blends can be lowered with the addition of inexpensive fillers, which allow to have a significant improvement of mechanical and thermal properties of the polymer matrices. In addition, the dispersion of nanoscale fillers in polymer matrices has been found to be an effective and relatively inexpensive means for decreasing water vapor permeability (WVP).22 In the past decades, many attempts have been focused on creating PBS-based composites with improved properties by blending with nanofiller such as cellulose whisker,23 layered silicate,24 carbon nanotubes,25,26 graphene,27 layered double hydroxide,28 modified talc,29 grape pomace30 and silica.31 Layered silicates such as montmorillonite (MMT)32 also referred to as nanoclays, are the most intensively investigated as they are non-toxic and readily available from natural and cheaper sources. MMT belonging to the 2 : 1 type of phyllosilicate group is frequently used as an additive agent in the preparation of nanocomposite structures owing to its remarkable properties such as water holding nature between layers, swelling, high cation exchange capacity and high specific surface area.33,34 Their lamellar structure acts as impermeable platelets with aspect ratios ranging from tens to thousands. Indeed, when dispersed in a polymer phase, MMT provides a significant barrier to penetrating gases.35,36 In the particular case of composites based on PBS and its copolymers, their higher cost can be reduced with the addition of inexpensive layered silicate. Organophilic montmorillonite (OMMT) was employed to improve the foaming performance of PLA/PBS.37 The gas barrier behavior of PBS/organomodified clay nanocomposite films was effectively enhanced by introducing confined crystals due to incorporation of nanofiller.38 Compared to pure PBS, 45% reduction in gas permeability coefficient was obtained in composite films with 6.9 vol% clay.12 Several authors have reported the preparation of biodegradable PBS/organomodified MMT nanocomposites with different organomontmorillonite loadings.39–43 The addition of organoclay into PBS is able to improve the mechanical properties, gas-barrier properties, thermal stability, and melt viscosity of PBS with preserving its biocompatibility and biodegradability. Among the various possible routes to fabricate PBS/clay nanocomposites, solution- and melt-mixing are simpler but may result in less effective polymer intercalation and/or exfoliation of clay layers in the polymer matrix, as a consequence of solvent co-intercalation or, for melt processing, slow polymer transport into the interlayer space and the high cost of solvents. In addition, they require a further processing step after polymer synthesis, adding to the cost of the final product. In contrast, the simpler in situ polymerization has often been found to yield nanocomposites with homogeneous distribution of well-exfoliated clay layers within the polymer matrix.44 In contrast to montmorillonite, which is the most studied smectite, Moroccan beidellite clay (BDT) is arguably the most interesting member of the smectite family, which was used in the present study, due especially to its acidic and catalytic properties.45–47 Recently, in situ polymerization technique was used to prepare bionanocomposites poly(butylene adipate) and poly(ε-caprolactone) in the presence of organomodified BDT.48,49
In the present work, PBS was prepared by one step in situ polycondensation between 1,4-butanediol and succinic anhydride in refluxing decalin as solvent in the presence of organomodified beidellite clay (BDT). Bismuth chloride, BiCl3, was used as a non-toxic polymerization catalyst in contrast to highly toxic dibutyltin compound which generally used for this reaction.50 The influence of organomodified BDT on the molar mass, crystallinity, thermal stability, surface characteristics, thermal conductivity and water vapor sorption behavior of the resulting PBS/BDT nanocomposites is also discussed.
2. Experimental section
2.1. Materials
Mineralogical and physico-chemical textural and structural characterizations of raw ferruginous beidellite clay (BDT) from the area of Agadir (Morocco) were reported in details by Bouna et al.45 Sodium beidellite (Na-BDT), having particle size <2 μm, was isolated from the raw clay according to the procedure described in ref. 45 and found to be made up of 93% of beidellite, and 7% of kaolinite. Its cation exchange capacity (CEC), BET specific surface area and total pore volume were assessed to be around 58.2 meq/100 g, 82.2 m2 g−1 and 0.136 cm3 g−1, respectively. Succinic anhydride (SuAh; 99%), 1,4-butanediol (1,4-BD, 99%), were purchased from Alfa Aesar. Bismuth chloride (BiCl3), hexadecyltrimethylammonium bromide (CTAB, cetyltrimethylammonium bromide), and lithium chloride were supplied from Sigma-Aldrich. Chloroform and decalin were used as received without any further purification. Tetrahydrofuran (THF) was distilled prior to use.
2.2. Preparation methods
2.2.1. Organo-modification of Na-BDT
The organomodified BDT clay used in this study was prepared by the cation exchange reaction between beidellite (Na-BDT) and CTAB46 by using 3 equivalent ratio of CTAB to the Cation Exchange Capacity (CEC) of Na-BDT. The obtained organoclay is labelled hereafter 3CTA-BDT.
2.2.2. Preparation of PBS/3CTA-BDT nanocomposites
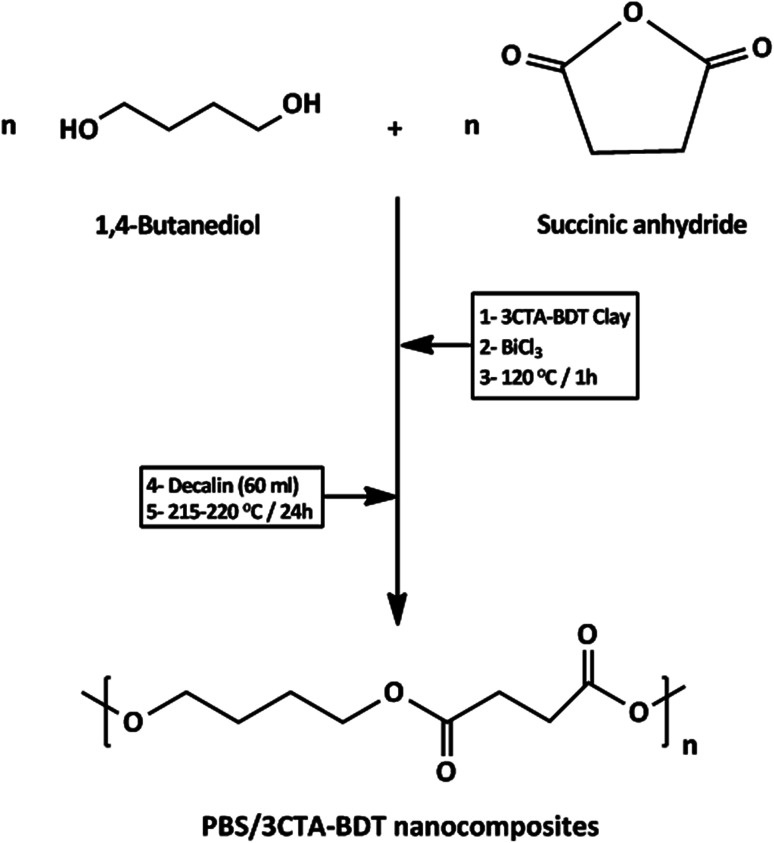
All samples were prepared by a polycondensation reaction according to protocol described by our group51 using a Dean–Stark apparatus. Since the synthesis procedures for all of the nanocomposites were the same, only a representative example, the preparation of nanocomposites containing 1 wt% organoclay, is given hereafter. In 250 mL round bottom flask, 0.114 g of organomodified clay (3CTA-BDT) dispersed in 5.4 g (60 mmol) of 1,4-butanediol (1,4-BD) under ultrasound for 30 min. After 6 g (60 mmol) of succinic anhydride, (SuAh) and 0.038 g (0.12 mmol) of BiCl3 were added to mixture. In a first step, the mixture was heated at 120 °C using an oil bath and stirred for 1 h. In a second step, 60 mL of decalin was added to the reaction mixture, then the bath temperature is slowly increased to 215–220 °C (boiling temperature of decalin). The mixture was kept at this temperature for 24 h under stirring. Scheme 1 presents the procedure for the preparation of PBS nanocomposites by in situ polycondensation of 1,4-BD and SuAh. Table S1 (in ESI)† summarises the molar masses of the samples (monomers, clay, catalyst) used in the preparation of these nanocomposites. The resulting materials are labelled PBS/y% 3CTA-BDT (y: 1, 3 and 5), where y% stands for weight ratio of organomodified beidellite equivalent to initial weight of both monomers 1,4-BD and SuAh.
Scheme 1. Synthesis of PBS nanocomposites by in situ polycondensation.
2.2.3. Extraction of PBS from nanocomposites
PBS chains were separated from the clay by a reverse ion-exchange reaction. An amount of 3 g of as-synthesized powdered PBS/3CTA-BDT nanocomposite was dispersed in 50 mL of chloroform/THF mixture (20/80 v/v) and kept under stirring for 2 h at ambient temperature. LiCl solution (2 mL) in THF (2% w/w) was thereafter added, and the suspension was stirred for an additional 24 h at room temperature. The obtained colloidal aggregates were centrifuged (4000 rpm, 30 min) and the supernatant liquid was concentrated and precipitated into methanol to obtain the precipitate of polymer. The obtained polymer was filtered, dried in vacuum at 60 °C for 6 h and used for further analysis. The average molecular weight was determined by size exclusion chromatography (SEC).
2.3. Instrumentation
2.3.1. Fourier transform infrared (FTIR) spectroscopy
Fourier transform infrared (FTIR) spectroscopy was carried out using a Thermo Fischer Nicolet 6700 spectrometer in attenuated total reflection mode. The spectra were scanned within the 400–4000 cm−1 range with a resolution of 4 cm−1.
2.3.2. Size exclusion chromatography (SEC)
SEC analyses were carried out using a Jasco PLUS system consisting of a PU-2089 pump, CO 2063 oven set at 80 °C equipped with RI-2031 differential refractometer and UV-2077 UV detector. Column calibration was performed with narrow-distribution polystyrene standards, Polymer Laboratories. A 40 mg mL−1 solution of the polymer in LiBr/THF (0.1% w/v) was filtered through a 0.2 μm membrane syringe filter and passed through two PL-Gel Mixed D columns at a flow rate 1 mL min−1. Polystyrene standards (233, 83, 23.8, 4.85 kg mol−1) served for calibration.
2.3.3. X-ray diffraction (XRD)
XRD patterns were acquired with X'Pert Pro powder diffractometer (PANalytical, The Netherlands) equipped with Cu tube, that was operated at λ = 0.1542 nm, 30 kV and 40 mA. Samples were scanned in the range of 1.5–35° 2 theta. Samples were put on zero background sample holders with Si plate.
2.3.4. Scanning electronic microscopy (SEM)
Imaging of pure PBS and nanocomposites PBS/3CTA-BDT was done using scanning electron microscope Mira (Tescan, Czech Republic). The microscope was operated at 5 kV or 7 kV. The used detectors were SE or mix of BSE and SE. Cross-sections of the samples were observed. The cross-sections of the samples were obtained by breaking the samples in half after freezing them in liquid nitrogen. The samples were attached to sample holders with electroconductive double sided carbon tape. Further, the samples were coated with thin gold layers under argon atmosphere using a sputter coater K550x (Quorum Technologies, UK).
2.3.5. Differential scanning calorimetry (DSC)
DSC analyses were carried out using Mettler Toledo DSC1 coupled with intracooler. Samples (∼10 mg) were measured in 40 mL aluminium pans under a constant nitrogen purge (60 mL min−1) and were heated from −80 to 150 °C at a heating rate of 10 °C min−1, and followed by a cooling stage from 150 to −80 °C at a cooling rate of 10 °C min−1. The samples were further heated to 150 °C at a heating rate of 10 °C min−1. The data were analyzed to determine the melting temperature, Tm and crystallization temperature, Tc from subsequent heating–cooling–heating cycles performed. Calibration of the instrument was performed with indium sample (Tm = 156.6 °C).
2.3.6. Thermogravimetric analysis (TGA)
TGA was performed by using a Mettler Toledo TGA/DSC-1-SF. The samples were placed into a platinum pan and heated to 600 °C at temperature ramp rate of 10 °C min−1, under nitrogen atmosphere, with a flow rate of 60 mL min−1.
2.3.7. Density
Density was determined by using a Sartorius AG density measurement kit YDK 01 equipped with Sartorius AG electronic balance KB BA 100 (with precision 10−5 g).
2.3.8. Water contact angle
Contact angle measurements were carried out at room temperature using a OCA Neurtek contact angle instrument. The system was equipped with a video camera and image analyzer. Measurements were performed in triplicate by deposition of 5 μL deionized water droplets on the surface of each sample at different spots using a micro-syringe. The PBS/3CTA-BDT clay nanocomposites were sandwiched in two Teflon films, which were put between two heated plates of a press at 150 °C under 70 bar for 10 min. The disc of organomodified clay (3CTA-BDT) was also performed.
2.3.9. Thermal conductivity
Thermo-physical characteristics were determined by using LFA447 NanoFlash apparatus (Netzsch Geratebau GmbH). The front and backsides of the sample were coated with graphite. Experiments were made at room temperature. The thermal conductivity (λ) (W m−1 K−1) was calculated from the thermal diffusivity (α) (m2 s−1) using the eqn (1):52
| λ = αρCp | 1 |
where ρ (kg m−3) and Cp (J kg−1 K−1) are the density and specific heat of the samples, respectively.
2.3.10. Water vapor sorption
Kinetic gravimetric sorption experiments were performed using solvent vapor sorption and single gas analyzer IGA 002 (Hiden Isochema Ltd) equipped with an electronic microbalance. Water uptakes were achieved on a small section of PBS film (0.5 mm). All samples were first dried in oven at 40 °C for overnight until a constant sample weight was reached. After dry mass was obtained, water vapor sorption experiments were carried out at 25 °C in the partial pressure range from 3 to 27 mbar and the mass uptake was measured as a function of time. The water vapor sorption properties were determined by gravimetric measurement of the amount of water vapor absorbed by the polymer film as function of time. The water mass gain at sorption equilibrium (expressed in gram of water per gram of sample), Mt (%) was calculated for the applied water vapor using the following equation:
 |
2 |
where m0 (g) is the weight of the dry film and mt (g) is the weight of the film after water vapor absorption at time t.
The water sorption data are used to calculate the diffusion coefficient (D) (cm3 s−1), which is a measure of the ability of the solvent molecules to move through the polymer and the solubility coefficient (S) (g g−1), which gives an idea about the equilibrium sorption.
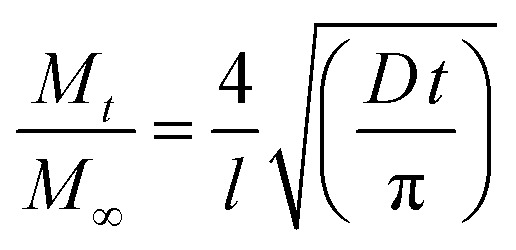
The diffusion coefficient can be calculated from Fick's second law for gaseous diffusion in a planar sheet as:53–56
 |
3 |
where π = 3.14, Mt (%) is the mass of penetrant uptake at time t (s), M∞ (%) is the mass of penetrant uptake at equilibrium state reached at Mt constant (Mt/M∞ is the relative mass uptake), D (cm2 s−1) is the diffusion coefficient and l (cm) the thickness of the dry sample.
The diffusion coefficient is determined from the initial gradient of the slope of the initial linear portion of the plots of the relative Mt/M∞versus when the mass gain is below 50% (i.e. where Mt/M∞ ≤ 0.5).
The sorption coefficient (S) (g g−1) can be obtained reporting the equilibrium concentration (C∞) of the permeant vapor vs. the partial pressure (p). It is defined as:
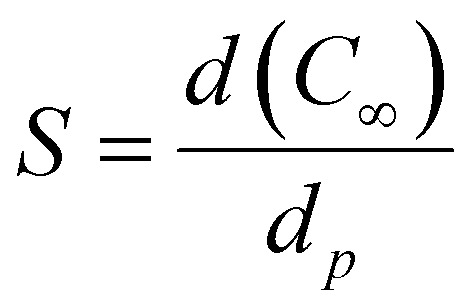 |
4 |
The permeability (P) (cm2 s−1) of the samples to the vapors is calculated as the of sorption coefficient (S) (g g−1) and diffusion coefficient (D) (g g−1):
| P = S × D | 5 |
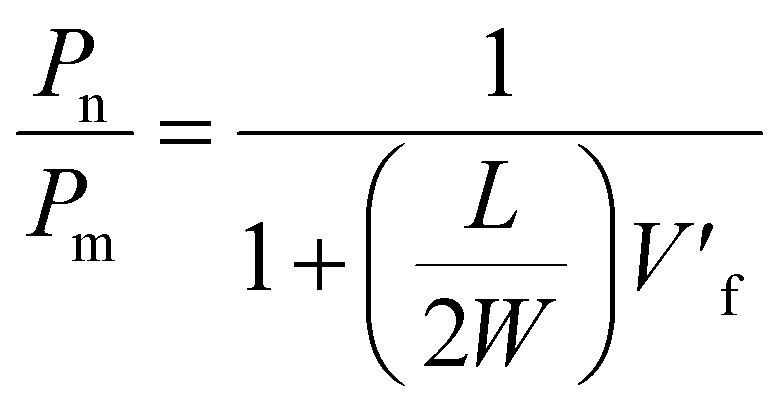
The relative permeability can be calculated using:
 |
6 |
where Pn (cm2 s−1) and Pm (cm2 s−1) are the permeability coefficient of the composite and the pure polymer,  and L/W are the volume fraction and the aspect ratio of the barrier, respectively.
3. Results and discussion
The synthesis of high molecular weight poly(butylene succinate) (PBS) by direct polyesterification of succinic acid with 1,4-butanediol was described.57 This melt polycondensation occurs in two steps (esterification and polycondensation) and under reduced pressure. It is very important to develop an easy synthetic process to manufacture polymers. In fact, the synthesis of high molecular weight of PBS by direct polyesterification of succinic acid with 1,4-butanediol in decalin at 190 °C under azeotropic condition was described.51,58 The polycondensation was catalyzed using highly toxic distannoxane compounds which limit the PBS applications in packing and biomedical sectors. Bismuth salts are the less toxic for the preparation of biodegradable polyesters.59,60 This property is particularly important, when applications of the polyesters in packing, and biomedicine and agriculture are considered. Here, the PBS/3CTA-BDT nanocomposites with different loadings of clay were synthesized in one step by in situ polycondensation of succinic anhydride (SuAh) and 1,4-butanediol (1,4-BD) in decalin as solvent with azeotropic elimination of water as a byproduct of the reaction using a Dean–Stark apparatus to shift the equilibrium towards the formation of PBS. The reaction was catalyzed by BiCl3. Our team reported that the highest molar masses were achieved with BiCl3 compared to others bismuth salts such as Bi-halides and Bi-triflate.51 Furthermore, in previous study reported by our team, it was demonstrated that the highest molar masses were obtained with BiCl3 compared to others bismuth salts such as BiBr3, BiI3, and Bi-triflate.51 The obtained nanocomposites are characterized in terms of structural, morphological, thermal, surface and barrier properties.
3.1. Structure and morphology characterizations
3.1.1. Infrared spectroscopy
The FT-IR spectroscopy was used to reveal the eventually specific interactions between 3CTA-BDT and PBS in nanocomposites. Fig. S1 (in ESI)† shows the superposition of FT-IR spectra of 3CTA-BDT, pure PBS and its nanocomposites.
The successful organomodification of Na-BDT was confirmed by the presence, in the FTIR spectra, of absorptions from the diagnostic CTA stretching bands at 2947, 2853 and 1485 cm−1. In the FTIR spectrum of pure PBS, the characteristic intense absorption band at 1714 cm−1 is related to stretching vibrations of the carbonyl of the ester group, while the absorption bands at 1257 and 1156 cm−1 correspond to stretching of the –COC– bonds in the ester group. The peaks in the 1046 cm−1 region are assigned to the stretching vibrations of O–C–C bonds in this polymer. The FTIR spectra of the PBS/y% 3CTA-BDT nanocomposites present the same absorption bands than those of pure PBS. The main differences are in the two extra peaks at 2947 and 2853 cm−1 corresponding to the methylene C–H stretching of CTA, their relative intensity increasing slightly with the organoclay loading.
3.1.2. Size exclusion chromatography (SEC)
For SEC measurement, the polymer samples from the nanocomposite were obtained after cleaving off from the clay using lithium bromide. The molecular masses of the extracted PBS are listed in Table 1.
Molar masses of PBS extracted from nanocomposites.
| Samples | M̄ n a (g mol−1) | M̄ w (g mol−1) | Đ |
|---|---|---|---|
| PBS/1% 3CTA-BDT | 15 600 | 30 400 | 1.95 |
| PBS/3% 3CTA-BDT | 10 700 | 20 500 | 1.91 |
| PBS/5% 3CTA-BDT | 5400 | 10 400 | 1.92 |
Eluent: THF, room temperature.
The molar masses of PBS decrease by increasing the 3CTA-BDT content (Table 1). The side reactions either catalysed by, or involving directly, the organomodified clay, such as transesterification among the growing PBS chains48 and/or grafting onto the nanoparticle surface are responsible of the lower molar masses.61 The highest molar mass was obtained in the case of nanocomposite loaded with 1 wt% of 3CTA-BDT (M̄w = 30 400 g mol−1). This can be explained by better monomers diffusion in the interlayer space of the clay and therefore better dispersion between the clay and the monomers.48,62 On the other hand, at high nanoclay content (5% 3CTA-BDT) the viscosity of the reaction medium becomes quite high even at the reaction temperature of 220 °C, and the lower molecular mass might thus be related to the diffusion-controlled termination of the polymerization reaction.48,49 Katiyar et al., reported similar results corresponding to the synthesis of poly(l-lactic acid)/clay nanocomposites.63
The X-ray diffraction and scanning electron microscopy (SEM) were used to quantify and qualify the dispersion of silicate layers in the polymer matrix as well as the intercalation of polymer chains into the silicate galleries and the phase structure.
3.1.3. X-ray diffraction (XRD)
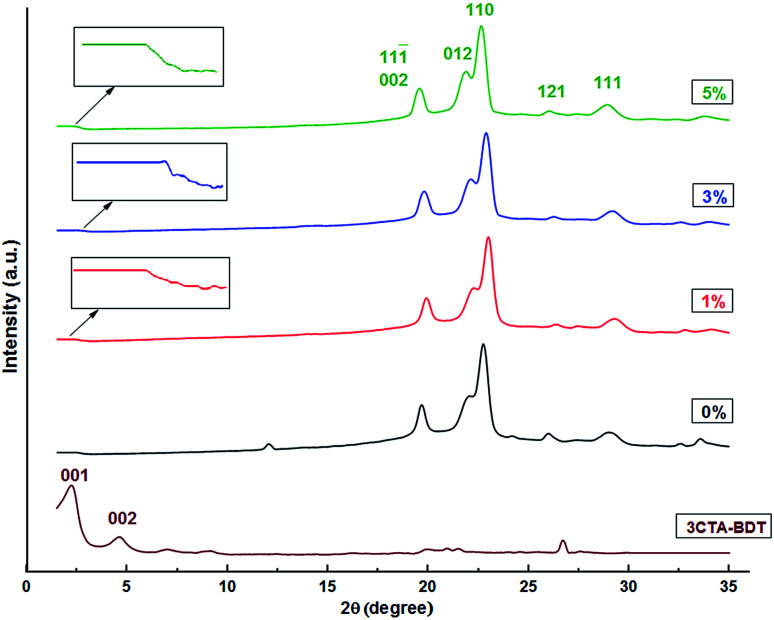
The XRD patterns of 3CTA-BDT, pure PBS and PBS nanocomposites with a varying amount of 3CTA-BDT are shown in Fig. 1. For 3CTA-BDT, two basal reflections at around 2.24° and 4.67° are observed, corresponding to the basal reflection (001) at 39.91 Å and its harmonic (002) at 19.13 Å, respectively.
Fig. 1. XRD patterns for 3CTA-BDT, pure PBS and its nanocomposites PBS/y% 3CTA-BDT.
The X-ray diffraction of pure PBS reveals five peaks at 2θ = 19.55 (111̄) or (002), 21.83 (012), 22.58 (110), 26 (121) and 28.9° (111) attributed to the crystalline phase of PBS.64 These peak positions remain unaffected by the presence of 3CTA-BDT clay in the nanocomposites with only minor changes in intensity and shape suggesting that the 3CTA-BDT clay does not significantly affect the crystallinity of PBS. However, in the case of PBS loaded with 1 wt%, the XRD patterns does not show any clay characteristic peaks in the range of 2θ = 2–8°. In addition, in the case of PBS containing 3 and 5 wt% of clay, a small peak is hardly observed at 2θ = 2.08° corresponding to a basic distance of almost 42.4 Å. The quite disappearance of organomodified BDT basal reflection in derivative polymer–clay nanocomposites could be due to its amounts lower than XRD detection threshold. Nonetheless, it could also denote the occurrence of clay mineral exfoliation as a result of the involvement of the in situ polycondensation of monomers inside its interlayer spaces although the coexistence of some unaffected interlayers cannot be ruled out.48 This likely result indicates that the modification of the surface of clay reduces microvoids, resulting in a fine dispersion of clay in the PBS matrix, and the organomodification of clay increased the physical affinity between the clay and the PBS matrix. These are the two most significant driving forces for exfoliated nanostructure.65
3.1.4. Scanning electron microscopy (SEM)
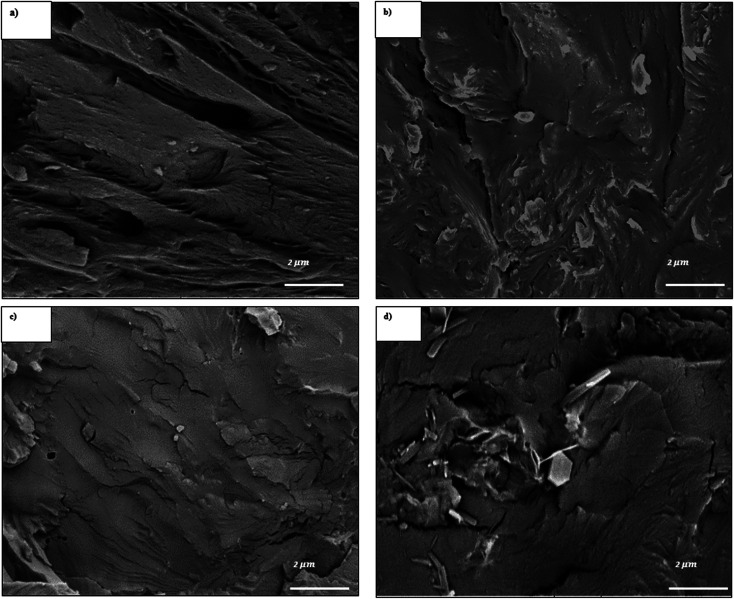
The morphology of the surface and the extent degree of phase dispersion were examined by scanning electron microscope (SEM). The cross-sections of the pure PBS and its nanocomposites PBS/3CTA-BDT after cryobreaking of specimens were shown in Fig. 2.
Fig. 2. SEM images of: (a) pure PBS, (b) 1 wt%, (c) 3 wt% and (d) 5 wt% of 3CTA-BDT in PBS nanocomposites.
According to these micrographs, some agglomerates of several micrometers can be observed, constituted by small particles. The images reveal also that the surface impact fracture morphology of composites is affected by the presence of the particles of the 3CTA-BDT, which causes the reduction of the microvoids in the case of the nanocomposites (1 and 3 wt%) with respect to the pure matrix. This indicates a better distribution and therefore a favorable affinity between the particle surface of 3CTA-BDT and the PBS matrix.
3.1.5. Contact angle measurements
The hydrophilic character of the nanoclay can therefore have a strong influence on the rate and extent of the biodegradation.66 Therefore, the contact angle analysis was carried out in order to study the surface properties and to evaluate the effect of 3CTA-BDT nanoclay on the PBS hydrophilicity. The contact angle value is taken as the average of at least three measurements for each sample. The results of the contact angle measurements for PBS and its nanocomposites are summarized in Table 2.
Static water contact angle (WCA) for PBS and its nanocomposites at different loading.
| Samples | Water contact angle (°) |
|---|---|
| Pure PBS | 72.0 ± 0.8 |
| 3CTA-BDT | 62.0 ± 2.2 |
| PBS/1% 3CTA-BDT | 58.9 ± 1.6 |
| PBS/3% 3CTA-BDT | 49.4 ± 0.8 |
| PBS/5% 3CTA-BDT | 45.5 ± 1.1 |
The obtained data (Table 2) demonstrate that the addition of the 3CTA-BDT clay, coherently with the polar nature of the nanofiller, leads to a decreasing of the contact angles and a lowering of the interfacial tension for the PBS/3CTA-BDT nanocomposites, whose surfaces gain a more hydrophilic character than that of the pure PBS. On the other hand, reducing the contact angle and thus the hydrophobicity of the different nanocomposites could allow water to spread more throughout the hybrid material by creating a more uniform layer on the surface of the nanocomposite films. It can be explained by the strong interaction between the organomodified mineral clay and the PBS matrix and by the presence of the polar groups (hydroxyl group O–H) on the surface of the 3CTA-BDT and also by the dispersion of clay nanoparticles in the PBS matrix.67
3.2. Thermal analysis
The thermal stability and degradation behavior of different nanocomposites films were studied by thermogravimetric analysis (TGA) and the thermal properties in terms of fusion and crystallization phenomena of PBS in presence of 3CTA-BDT were studied by Differential Scanning Calorimetry (DSC).
3.2.1. Thermogravimetric analysis TGA
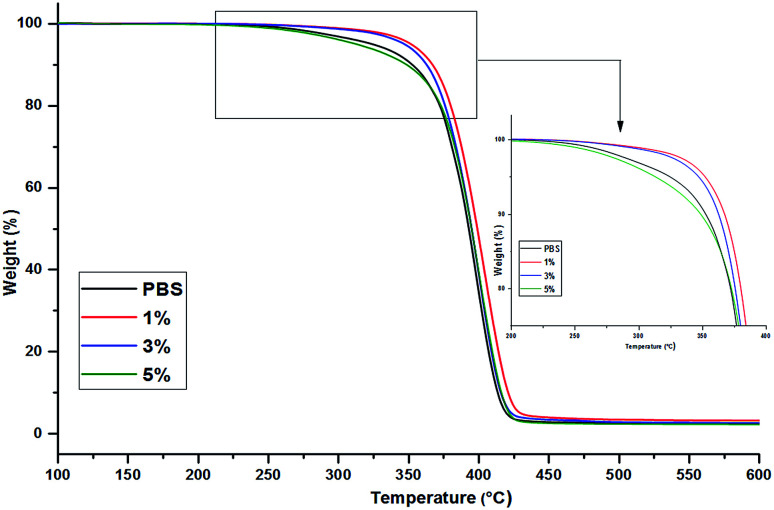
To evaluate the thermal stability of the polyesters, TGA measurements were performed. Fig. 3 shows the TGA thermograms of pure PBS and PBS/3CTA-BDT nanocomposites under nitrogen atmosphere. Thermal stability parameters such as the temperature at 5%, 10%, 50% weight loss, the maximum decomposition temperature Td (dTGA) and the residue at 550 °C are summarized in Table 3.
Fig. 3. TGA thermograms of organoclay, and PBS hybrid with various organoclay contents.
Thermal degradation properties of PBS nanocomposites.
| 3CTA-BDT in PBS | T d (5%) | T d (10%) | T d (50%) | T d (dTGA) (°C) | Residue at 550 °C (%) |
|---|---|---|---|---|---|
| 0% (pure PBS) | 320 | 353 | 392 | 396 | 2.31 |
| 1% | 354 | 368 | 400 | 400 | 3.16 |
| 3% | 349 | 363 | 395 | 399 | 2.84 |
| 5% | 312 | 347 | 395 | 400 | 2.77 |
The PBS loaded with 1–3% nanocomposites show an improvement of thermal stability, with an increase of 29–40 °C in Td (5%) compared to that of pure PBS. In fact, introduction of a well-dispersed clay into polymeric matrices can improve their thermal stability as the dispersed silicate layers hinder the permeability of volatile degradation products out of the materials, the 3CTA-BDT clay generates a barrier effect, which delays the release of thermal degradation products in comparison to the neat polymer.68
Indeed, the high residual weight (char%) of the nanocomposites compared to the pure PBS mainly comes from the inorganic part of 3CTA-BDT organoclay.49 The slight decrease of the Td (5%) for the nanocomposite with higher organoclay content (5 wt%), may be attributed to a less efficient barrier caused by the poorer quality of organoclay dispersion, and possibly to a further contribution related to the lower molar mass of extracted PBS (M̄n = 5400 g mol−1, Table 1).48
3.2.2. Differential scanning calorimetry
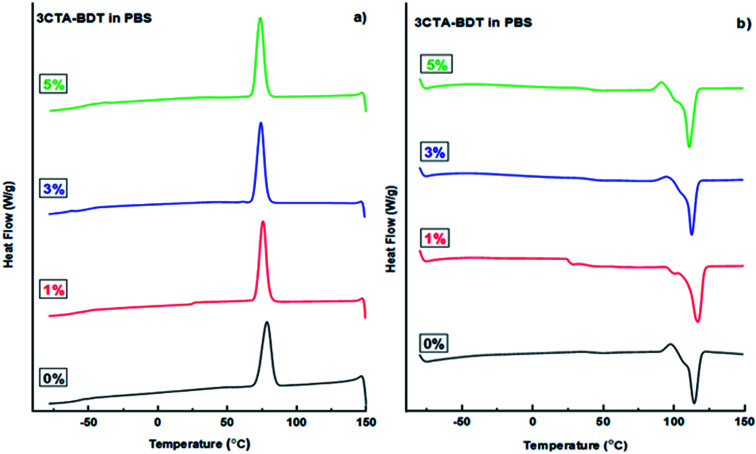
Differential scanning calorimetry (DSC) was used to study different interactions and crystallization behavior in the PBS/3CTA-BDT nanocomposites. In Fig. 4 we displayed the heating and the cooling DSC curves of pure PBS and its PBS/3CTA-BDT nanocomposites. The details of the thermal properties are also collected in Table 4. The crystallinity of samples was calculated according to the following eqn (7):
 |
7 |
where ΔHm: melting enthalpy of sample, ΔH0m: melting enthalpy of 100% crystalline PBS (200 J g−1)30 and ф: clay weight fraction in nanocomposites.
Fig. 4. DSC thermograms from (a) crystallization from first cooling and (b) meeting from the second heating of pure PBS and its nanocomposites with various organoclay contents.
Calorimetric data for PBS nanocomposites prepared with 3CTA-BDT.
| 3CTA-BDT in PBS | T m (°C) | T c (°C) | ΔHc (J g−1) | ΔHm (J g−1) | χ c (%) |
|---|---|---|---|---|---|
| 0% (pure PBS) | 114 | 75 | 82.05 | 99.7 | 49.8 |
| 1% | 117 | 76 | 81.44 | 104.0 | 52.5 |
| 3% | 113 | 74 | 84.30 | 104.0 | 53.6 |
| 5% | 111 | 74 | 86.43 | 105.1 | 55.3 |
Table 4 and Fig. 4b show that the melting temperature of PBS (Tm) was moving to slightly higher values from 114 to 117 °C when the 3CTA-BDT clay increases to 1 wt%. Therefore, the melting endotherm of PBS is moderately affected by the presence of the organoclay.48 On other hand, the nanoclay may be act as a heterophase nucleating agent.69,70
From Fig. 4a, it can be noticed that the crystallization temperature (Tc) remained stable at 74–76 °C, which suggests the independence of the crystallization behavior of the samples on organoclay. The nucleating effect of the nanoclay is indirectly but more noticeably confirmed by ΔHc values of the nanocomposites, those with increasing 3CTA-BDT loading (3 and 5 wt%) are higher than that of pure PBS (Table 4). Moreover, the crystallinity index, χc of the samples increased with the increasing of 3CTA-BDT content (Table 4). This indicates that 3CTA-BDT particles might play the role of nucleating agents.
Obviously, the presence and the quality of nanoclay dispersion may significantly affect the crystallization behaviour of PBS. To study the nucleation effect of 3CTA-BDT on the crystallization of PBS, the isothermal crystallization kinetics and morphology of the nanocomposites of PBS and 1–5 wt% 3CTA-BDT nanoclay by differential scanning calorimetry, polarizing optical microscopy, and X-ray diffraction is under investigation.
3.2.3. Thermal conductivity
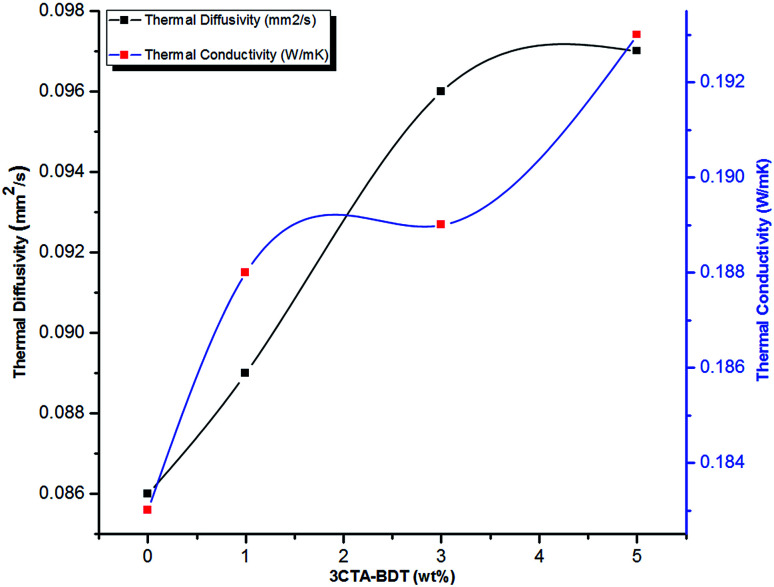
Fig. 5 displays the evolution of the thermal diffusivity and thermal conductivity versus of 3CTA-BDT content of various samples at room temperature. The thermal conductivity is calculated according to eqn (1).
Fig. 5. Thermal diffusivity and conductivity versus 3CTA-BDT loading in PBS.
Fig. 5 shows that the thermal conductivity of the neat PBS was too low (0.183 W m−1 K−1). Indeed, the addition of 3CTA-BDT clay in PBS increases both the thermal diffusivity and the thermal conductivity of the nanocomposites. Considering only 5 wt% 3CTA-BDT clay was added, the enhancement of 5.5% on thermal conductivity of the PBS composites was observed compared to pure PBS.
Many parameters are known to play a role in conductivity performance, including interfacial resistance, which depends on the physical contact between organoclay and matrix, clay distribution and dispersion, because the increase in porosity decreases the density of the composite, and consequently its thermal conductivity.71
According to the classic Maxwell thermal conduction model,72 the presence of clay will result in an increase of the thermal conductivity of polymer/clay nanocomposites since the thermal conductivity of clay (1 W m−1 K−1)73 is generally higher than that of polymers (usually less than 0.5 W m−1 K−1).71
Lule et al.74 reported that the thermal conductivity of PBS/5 wt% of modified aluminium nitride with (3-aminopropyl)triethoxysilane (APTES) nanocomposite is close to 0.295 W m−1 K−1. This value is higher than PBS/5 wt% 3CTA-BDT and attributed to highly thermal conductivity of aluminium nitride filler (200 W m−1 K−1)71 compared to that of clay (1 W m−1 K−1).73 Therefore, the incorporation of poor thermal conductive clay in PBS matrix and its low cost could lead to the development of suitable insulating thermal materials.
3.3. Water vapor sorption
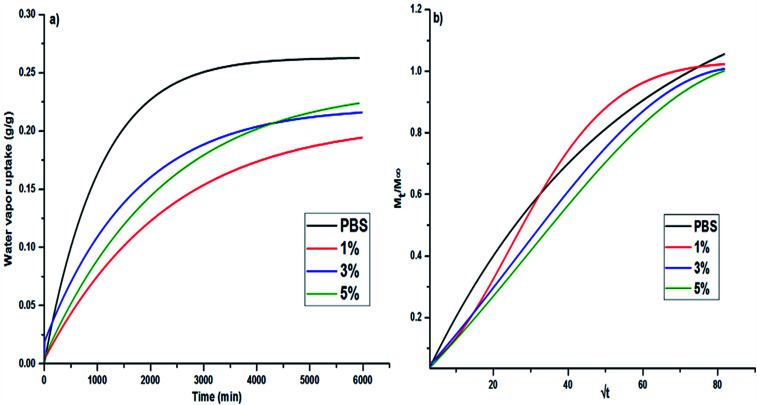
Fig. 6a shows kinetic curves of water vapor sorption test at 25 °C and 24 mbar pressure for different PBS/3CTA-BDT films (0–5 wt%).
Fig. 6. Water vapor uptake (a) and the relative mass uptake Mt/M∞ (b) in pure PBS and its nanocomposites films vs. time.
The absorption of the water vapor increases with time and reaches a saturation after 25 h. As shown in Fig. 6a, the stronger water sorption increases for the pure PBS, in comparison with PBS based nanocomposites, suggesting a larger affinity of the pure PBS for water. This can be attributed to specific interactions (hydrogen bonds) between incoming water molecules and polar groups (ester functions) of polyester chain backbone, increasing the water affinity of the film, and therefore its weight gain.55,56 On the other hand, the addition of 3CTA-BDT organoclay filler reduces the absorption of vapor compared to the pure PBS. Due to its hydrophobic character (modification with CTAB surfactant) and its lamellar structure, 3CTA-BDT organoclay reduces the sorption and the diffusion of vapor and thus acts as a barrier for the water diffusion.
Fig. 6b displays typical curves of the relative mass uptake Mt/M∞vs. for pure PBS and its PBS/3CTA-BDT nanocomposites. For pure PBS, the ratio increases with
  and becomes saturated within
 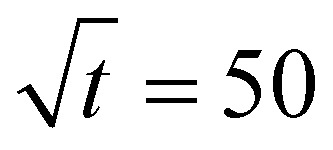 . These results are similar that those reported by Gorrasi et al., who had studied the effect of clay dispersion on the vapor barrier properties of polycaprolactone montmorillonite nanocomposites but with longer times to reach saturation.35 It should also be noted that the Mt/M∞ ratio decreases with the clay content. These different behaviors of the adsorbed water vapor are due to the different of 3CTA-BDT clay percentages and attributed to the coexistence of intercalated and/or exfoliated structures and therefore the dispersion of the clay particles in the PSB matrix. It is possible to derive the mean diffusion coefficient from the linear part of the reduced sorption curves.36 The diffusion coefficient can be calculated using the second solution of the Fick's law (eqn (3)). It was determined from the initial gradient of the slope of the linear part of the reduced sorption curves Mt/M∞vs.
 (Fig. 6b).
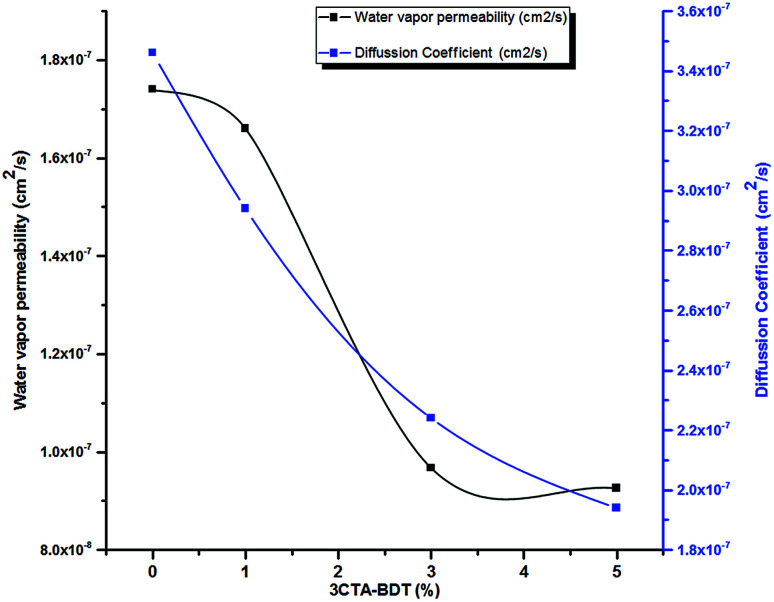
Fig. 7 shows the diffusion coefficient of PBS/3CTA-BDT nanocomposites as a function of the 3CTA-BDT content.
Fig. 7. Diffusion coefficient and water vapor permeability of nanocomposites films as a function of 3CTA-BDT contents.
The solubility (S) as well the permeability (P) coefficients of the different PBS nanocomposites were calculated according to the eqn (4) and (5) are summarized in Table 5.
Diffusion coefficient (D), solubility coefficient (S) and permeability coefficient (P) for pure PBS and its nanocomposites.
| Sample | 107 × D (cm2 s−1) | S (g g−1) | 107 × P (cm2 s−1) |
|---|---|---|---|
| PBS (0%) | 3.46 | 0.565 | 1.47 |
| 1% | 2.94 | 0.563 | 1.66 |
| 3% | 2.24 | 0.441 | 0.967 |
| 5% | 1.94 | 0.478 | 0.926 |
The diffusion coefficient values tend to decrease as the clay content increases (Fig. 7 and Table 5). Compared to pure PBS, a remarkable reduction of 44% in the diffusivity was obtained in PBS/3CTA-BDT nanocomposite by adding 5 wt% of 3CTA-BDT. Indeed, the presence of 3CTA-BDT in the films increases also the tortuosity of the diffusion path for water vapor molecules related to the degree of dispersion according to the intercalation/exfoliation of nanoplatelets in the matrix, and thus reduces swelling and water absorption by the polymer chains.75 Choudalakis et al., reported that the exfoliated structures exhibit much higher values for the tortuosity factor compared to those of the intercalated structures, and it's much more effective to be used in barrier for gasses.54
Fig. 7 shows also the water vapor permeability (WVP) of the PBS/3CT-BDT films as a function of the percentage of the 3CTA-BDT clay.
It can be observed that the addition of the clay particles resulted in a significant decrease in WVP in comparison to the uncharged system. The WVP of the pure PBS film was 1.47 10−7 cm2 s−1 and this parameter decreased significantly with the increase in clay concentration up to 0.926 10−7 cm2 s−1 for nanocomposite with 5 wt% of 3CTA-BDT, representing a significantly reduction of 37% of WVP. The decrease of WVP with clay incorporation has already been observed in various organic–inorganic hybrid systems.76–78
We noticed that the increase in crystallinity induces a reduction in WVP due to the reduction of the amorphous phase and consequently the decrease of the diffusion due to a more tortuous path for the diffusing molecules (Tables 4 and 5). Similar results were reported in previous studies.35,79
Only few papers have reported the permeability to water vapor and gases of nanocomposites films based PBS. In order to confirm the effectiveness of the organomodified 3CTA-BDT used in this study to improve the barrier properties of PBS nanocomposites, the reduction in water vapor permeability (WVP) related to the pure PBS, was compared with others nanomaterials based on PBS from previous studies using different nanofillers.80–84Table 6 summarises these results.
Comparison of barrier properties of PBS nanocomposites with various nanofillers.
| Starting materials | Process preparations | Nanofiller | Wt% of nanofiller | Reduction efficiency in WVPb | Ref. |
|---|---|---|---|---|---|
| PBS/3CTA-BDT | In situ polymerization | 3CTA-BDT | 5 | 37% | This work |
| PBS/organomodified MMT | Melt extrusion | Na+-MMT | 5 | No reduction in WVP | 80 |
| Extrusion–calendaringa | Cloisite 30B | 5 | 25% | ||
| Melt extrusion | Na+-MMT | 5 | 36% | ||
| Compression-moldinga | Cloisite 30B | 5 | 40% | ||
| PLA (80 wt%)/PBS (20 wt%)/organomodified MMT | Melt extrusion | Cloisite 30B | 5 | 18% | 81 |
| PLA (50 wt%)/PBS (50 wt%)/organomodified MMT | Melt extrusion | Cloisite 30B | 5 | 34% | 82 |
| PBS/nanocrystalline cellulose (CNC) | Melt extrusion | CNC | 3 | 41% | 83 |
| PBS/CNC/4% methylene diphenyl diisocyanate (MDI) as compatibilizer | CNC | 3 | 62% | ||
| PBS/potato pulp filler | Melt extrusion | Potato pulp filler | 5 | 7% | 84 |
Technique used for the preparation of the film for WVP measurement.
Reduction in WVP = (WVPpure polymer − WVPcomposite) × 100/WVPpure polymer.
The reduction efficiency in WVP using 3CTA-BDT was similar to that reported for nanocomposites based on PBS with Na+-MMT and Cloisite 30B80 which has been fabricated by melt extrusion using commercial PBS with high molar mass (compared to those prepared in this work by in situ polymerization) and montmorillonite modified with a surfactant different than CTAB used in BDT clay. However, the value of the obtained result in our study was higher than the value reported for PBS/Cloisite 30B,80 in which the films were prepared by extrusion–calendaring, and also by melt extruded PLA/PBS/Cloisite 30B nanocomposite films.81,82 Indeed, our result was close to those achieved with cellulose nanocrystals (CNC).83 The reduction in WVP efficiency depend on the process of fabrication of the nanocomposites, the molar masses of the polymers based on PBS, the crystallinity, the temperature and the relative humidity for the WVP measurement, the nature of the nanofiller and the thickness of the films.80–84 For these reasons, it is very difficult to compare different studies in the literature.
By using in situ polymerization process fabrication of PBS/3CTA-BDT and adding only 5 wt% of 3CTA-BDT, an improvement of the diffusion coefficient and WVP by 44 and 37%, respectively, compared to pure PBS was observed. Therefore, one can conclude that the developed in situ polymerization of PBS nanocomposites demonstrates interesting barrier properties, which make them as more efficient and suitable materials for food packaging applications.
4. Conclusion
PBS/3CTA-BDT nanocomposites containing 1, 3 and 5 wt% of organomodified clay were prepared via in situ polycondensation. Their morphology was studied by XRD and SEM, which revealed the degree of the dispersion of 3CTA-BDT nanoparticles in PBS matrix and also the coexistence of the interacted and exfoliated structures. Contact angle measurement showed that the hydrophobicity of all nanocomposites was reduced compared to neat PBS. TGA analysis showed a remarkable improvement in thermal stability of the nanocomposites compared to pure PBS. DSC analysis showed a moderate variation in melting point while the crystallinity index, χc of the samples increased with the increasing of 3CTA-BDT content, which affects also the sorption properties. The effect of 3CTA-BDT nanofiller on the diffusion, solubility and permeability coefficients of nanocomposites was also evaluated. The reduction efficiency in WVP was estimated to be 37% compared to the pure PBS matrix when 5 wt% of nanoclay was used and was attributed to a more tortuous path for the diffusion of water molecules. However, the molar masses of the extracted PBS from these nanocomposites are lower compared to those of commercial PBS. Therefore, the PBS/3CTA-BDT can be used as masterbatch product in the preparation of commercial PBS with high molecular weight and beidellite clay nanocomposites through a melt-mixing process. The effect of unmodified and modified BDT clay on the mechanical and barrier properties is under investigation to study their potential for food packaging applications.
Author contributions
M. I.: methodology (synthesis and characterizations), investigation, writing original draft. M. R.: supervision, writing original draft, reviewing and editing, funding acquisition. B. R.: discussions related to the purification and organomodification of Na-BDT Moroccan clay, reviewing the draft. R. M. M.: conception and design of the experiments of WVP, supervision, reviewing the draft. J. V.: X-ray diffraction (XRD) and scanning electron microscopy (SEM) analysis. M. L.: supervision, analyzed the data (SEC, IR), reviewing the draft.
Conflicts of interest
The authors declare no conflict of interest.
Supplementary Material
Acknowledgments
Financial support for cooperative research came from the MESRSFC and CNRST of Morocco (PPR Program. ID: PPR/2015/73). The authors thank the financial supports from Erasmus Mundus program financed by the European Commission between Riga Technical University and University Cadi-Ayyad of Marrakech.
Electronic supplementary information (ESI) available. See DOI: 10.1039/d0ra07521c
References
- Production of plastics worldwide from 1950 to 2018, available: https://www.statista.com/statistics/282732/global-production-of-plastics-since-1950/, accessed May 22, 2020
- Lambert S. Wagner M. Chem. Soc. Rev. 2017;46:6855–6871. doi: 10.1039/C7CS00149E. doi: 10.1039/C7CS00149E. [DOI] [PubMed] [Google Scholar]
- Rujnić -Sokele M. Pilipović A. Waste Manage. Res. 2017;35:132–140. doi: 10.1177/0734242X16683272. doi: 10.1177/0734242X16683272. [DOI] [PubMed] [Google Scholar]
- Rozza F. and Cerutti A. K., Soil Degradable Bioplastics for a Sustainable Modern Agriculture, ed. M. Malinconico, Springer, Berlin, Heidelberg, 2017, vol. 7, pp. 169–185, 10.1007/978-3-662-54130-2 [DOI] [Google Scholar]
- Chinaglia S. Tosin M. Degli-innocenti F. Polym. Degrad. Stab. 2018;147:237–244. doi: 10.1016/j.polymdegradstab.2017.12.011. doi: 10.1016/j.polymdegradstab.2017.12.011. [DOI] [Google Scholar]
- Ahmed T. Shahid M. Azeem F. Rasul I. Shah A. A. Noman M. Hameed A. Manzoor N. Manzoor I. Muhammad S. Environ. Sci. Pollut. Res. 2018;25:7287–7298. doi: 10.1007/s11356-018-1234-9. [DOI] [PubMed] [Google Scholar]
- Gigli M. Fabbri M. Lotti N. Gamberini R. Rimini B. Munari A. Eur. Polym. J. 2016;75:431–460. doi: 10.1016/j.eurpolymj.2016.01.016. doi: 10.1016/j.eurpolymj.2016.01.016. [DOI] [Google Scholar]
- Ikehara T. Kataoka T. Polym. J. 2018;50:431–438. doi: 10.1038/s41428-018-0029-7. doi: 10.1038/s41428-018-0029-7. [DOI] [Google Scholar]
- Pan W. Bai Z. Su T. Wang Z. Int. J. Biol. Macromol. 2018;111:1040–1046. doi: 10.1016/j.ijbiomac.2018.01.107. doi: 10.1016/j.ijbiomac.2018.01.107. [DOI] [PubMed] [Google Scholar]
- Uesaka T. Nakane K. Maeda S. Ogihara T. Ogata N. Polymer. 2000;41:8449–8454. doi: 10.1016/S0032-3861(00)00206-8. doi: 10.1016/S0032-3861(00)00206-8. [DOI] [Google Scholar]
- Gan Z. Abe H. Kurokawa H. Doi Y. Biomacromolecules. 2001;2:605–613. doi: 10.1021/bm015535e. doi: 10.1021/bm015535e. [DOI] [PubMed] [Google Scholar]
- Someya Y. Nakazato T. Teramoto N. Shibata M. J. Appl. Polym. Sci. 2004;91:1463–1475. doi: 10.1002/app.13366. doi: 10.1002/app.13366. [DOI] [Google Scholar]
- Wei Z. Chen G. Shi Y. Song P. Zhan M. Zhang W. J. Polym. Res. 2012;19:9930. doi: 10.1007/s10965-012-9930-5. doi: 10.1007/s10965-012-9930-5. [DOI] [Google Scholar]
- Mallardo S., De Vito V., Malinconico M., Volpe M. G., Santagata G. and Di Lorenzo M. L., Proceedings of the International Conference on Microplastic Pollution in the Mediterranean Sea, ed. M. Cocca, E. D. Pace, M. E. Errico, G. Gentile, A. Montarsolo and R. Mossotti, Springer, Cham, 2017, vol. 27, pp. 199–204, 10.1007/978-3-319-71279-6 [DOI] [Google Scholar]
- Oliveira N. S. Oliveira J. Gomes T. Ferreira A. Dorgan J. Marrucho I. M. Fluid Phase Equilib. 2004;15:317–324. doi: 10.1016/j.fluid.2004.06.032. doi: 10.1016/j.fluid.2004.06.032. [DOI] [Google Scholar]
- Seethamraju S. Kumar S. Bharadwaj K. B. Madras G. Raghavan S. Ramamurthy P. C. ACS Nano. 2016;10:6501–6509. doi: 10.1021/acsnano.6b02588. doi: 10.1021/acsnano.6b02588. [DOI] [PubMed] [Google Scholar]
- Frounchi M. Dadbin S. Salehpour Z. Noferesti M. J. Membr. Sci. 2006;282:142–148. doi: 10.1016/j.memsci.2006.05.016. doi: 10.1016/j.memsci.2006.05.016. [DOI] [Google Scholar]
- Sangermano M. Periolatto M. Signore V. Russo Spena P. Prog. Org. Coat. 2017;103:152–155. doi: 10.1016/j.porgcoat.2016.10.032. doi: 10.1016/j.porgcoat.2016.10.032. [DOI] [Google Scholar]
- Bhatia A. Gupta R. K. Bhattacharya S. N. Choi H. J. Korea Aust. Rheol. J. 2007;19:125–131. [Google Scholar]
- Su S. Kopitzky R. Tolga S. Kabasci S. Polymers. 2019;11:1193. doi: 10.3390/polym11071193. doi: 10.3390/polym11071193. [DOI] [PMC free article] [PubMed] [Google Scholar]
- Siracusa V. Lotti N. Munari A. Dalla Rosa M. Polym. Degrad. Stab. 2015;119:35–45. doi: 10.1016/j.polymdegradstab.2015.04.026. doi: 10.1016/j.polymdegradstab.2015.04.026. [DOI] [Google Scholar]
- Zini E. Scandola M. Polym. Compos. 2011;32:1905–1915. doi: 10.1002/pc.21224. doi: 10.1002/pc.21224. [DOI] [Google Scholar]
- Lin N. Yu J. Chang P. R. Li J. Huang J. Polym. Compos. 2011;32:472–482. doi: 10.1002/pc.21066. doi: 10.1002/pc.21066. [DOI] [Google Scholar]
- Wang Y. Zhang S. Xiaoman W. Chaoliang L. Yuqu C. Lijun M. Guang S. Liting Y. J. Therm. Anal. Calorim. 2017;128:1417–1427. doi: 10.1007/s10973-017-6092-z. doi: 10.1007/s10973-017-6092-z. [DOI] [Google Scholar]
- Gumede T. P. Luyt A. S. Müller A. J. eXPRESS Polym. Lett. 2018;12:505–529. doi: 10.3144/expresspolymlett.2018.43. doi: 10.3144/expresspolymlett.2018.43. [DOI] [Google Scholar]
- Zeng R.-T. Hu W. Wang M. Zhang S.-D. Zeng J.-B. Polym. Test. 2016;50:182–190. doi: 10.1016/j.polymertesting.2016.01.003. doi: 10.1016/j.polymertesting.2016.01.003. [DOI] [Google Scholar]
- Bosq N. Guigo N. Aht-ong D. Sbirrazzuoli N. J. Phys. Chem. C. 2017;121:11915–11925. doi: 10.1021/acs.jpcc.7b02887. doi: 10.1021/acs.jpcc.7b02887. [DOI] [Google Scholar]
- Tataro G. Sisti L. Celli A. Askanian H. Verney V. Leroux F. RSC Adv. 2016;6:4780–4791. doi: 10.1039/C5RA24031J. [DOI] [Google Scholar]
- Sun B. Chuai C. Luo S. Guo Y. Han C. J. Polym. Eng. 2014;34:379–385. doi: 10.1515/polyeng-2013-0229. [DOI] [Google Scholar]
- Gowman A. Wang T. Rodriguez-Uribe A. Mohanty A. K. Misra M. ACS Omega. 2018;3:15205–15216. doi: 10.1021/acsomega.8b01675. doi: 10.1021/acsomega.8b01675. [DOI] [PMC free article] [PubMed] [Google Scholar]
- Vassiliou A. A. Bikiaris D. El Mabrouk K. Kontopoulou M. J. Appl. Polym. Sci. 2011;119:2010–2024. doi: 10.1002/app.32887. doi: 10.1002/app.32887. [DOI] [Google Scholar]
- Sinha Ray S. Okamoto M. Prog. Polym. Sci. 2003;28:1539–1641. doi: 10.1016/j.progpolymsci.2003.08.002. doi: 10.1016/j.progpolymsci.2003.08.002. [DOI] [Google Scholar]
- Polat T. G. Duman O. Tunç S. Colloids Surf., A. 2020;602:124987. doi: 10.1016/j.colsurfa.2020.124987. doi: 10.1016/j.colsurfa.2020.124987. [DOI] [Google Scholar]
- Bozoğlan B. K. Duman O. Tunç S. Int. J. Biol. Macromol. 2020;162:781–797. doi: 10.1016/j.ijbiomac.2020.06.087. doi: 10.1016/j.ijbiomac.2020.06.087. [DOI] [PubMed] [Google Scholar]
- Gorrasi G. Tortora M. Vittoria V. Pollet E. Lepoittevin B. Alexandre M. Dubois P. Polymer. 2003;44:2271–2279. doi: 10.1016/S0032-3861(03)00108-3. doi: 10.1016/S0032-3861(03)00108-3. [DOI] [Google Scholar]
- Livi S. Sar G. Bugatti V. Espuche E. Duchet-Rumeau J. RSC Adv. 2014;4:26452–26461. doi: 10.1039/C4RA02143F. doi: 10.1039/C4RA02143F. [DOI] [Google Scholar]
- Zhou J. Yao Z. Zhou C. Wei D. Li S. J. Appl. Polym. Sci. 2014;131:40773. doi: 10.1002/app.40773. doi: 10.1002/app.40773. [DOI] [Google Scholar]
- Zhou S.-Y. Bin Chen J. Li X.-J. Ji X. Zhong G.-J. Li Z.-M. RSC Adv. 2016;6:2530–2536. doi: 10.1039/c5ra22853k. doi: 10.1039/c5ra22853k. [DOI] [Google Scholar]
- Okamoto K. Ray S. S. Okamoto M. J. Polym. Sci., Part B: Polym. Phys. 2003;41:3160–3172. doi: 10.1002/polb.10708. doi: 10.1002/polb.10708. [DOI] [Google Scholar]
- Chen G.-X. Kim E.-S. Yoon J.-S. J. Appl. Polym. Sci. 2005;98:1727–1732. doi: 10.1002/app.22264. doi: 10.1002/app.22264. [DOI] [Google Scholar]
- Phua Y. J. Lau N.-S. Sudesh K. Chow W. S. Ishak Z. M. J. Compos. Mater. 2015;49:891–902. doi: 10.1177/0021998314527328. doi: 10.1177/0021998314527328. [DOI] [Google Scholar]
- Shih Y. F. Wang T. Y. Jeng R. J. Wu J. Y. Teng C. C. J. Polym. Environ. 2007;15:151–158. doi: 10.1007/s10924-007-0055-6. doi: 10.1007/s10924-007-0055-6. [DOI] [Google Scholar]
- Dumazert L. Rasselet D. Pang B. Gallard B. Kennouche S. Lopez-Cuesta J.-M. Polym. Adv. Technol. 2018;29:69–83. doi: 10.1002/pat.4090. doi: 10.1002/pat.4090. [DOI] [Google Scholar]
- Ojijo V. Sinha Ray S. Prog. Polym. Sci. 2013;38:1543–1589. doi: 10.1016/j.progpolymsci.2013.05.011. doi: 10.1016/j.progpolymsci.2013.05.011. [DOI] [Google Scholar]
- Bouna L. Rhouta B. Daoudi L. Maury F. Amjoud M. Senocq F. Lafont M. C. Jada A. Ait Aghzzaf A. Clays Clay Miner. 2012;60:278–290. doi: 10.1346/CCMN.2012.0600305. doi: 10.1346/CCMN.2012.0600305. [DOI] [Google Scholar]
- Rhouta B. Bouna L. Maury F. Senocq F. Lafont M. C. Jada A. Amjoud M. Daoudi L. Appl. Clay Sci. 2015;115:260–265. doi: 10.1016/j.clay.2015.04.025. doi: 10.1016/j.clay.2015.04.025. [DOI] [Google Scholar]
- Rhouta B. Bouna L. Maury F. Senocq F. Lafont M. C. Jada A. Amjoud M. Daoudi L. Appl. Clay Sci. 2015;115:266–274. doi: 10.1016/j.clay.2015.04.025. doi: 10.1016/j.clay.2015.04.025. [DOI] [Google Scholar]
- Ilsouk M. Raihane M. Castelvetro V. Lahcini M. Bronco S. Rhouta B. Bianchi S. Conzatti L. Polym. Int. 2017;66:939–949. doi: 10.1002/pi.5342. doi: 10.1002/pi.5342. [DOI] [Google Scholar]
- Ilsouk M. Raihane M. Lahcini M. Meri R. M. Zicāns J. Cimdina L. B. Kharas G. B. J. Macromol. Sci., Part A: Pure Appl.Chem. 2017;54:201–210. doi: 10.1080/10601325.2017.1282229. doi: 10.1080/10601325.2017.1282229. [DOI] [Google Scholar]
- Ishii M. Okazaki M. Shibasaki Y. Ueda M. Teranishi T. Biomacromolecules. 2001;2:1267–1270. doi: 10.1021/bm015576a. doi: 10.1021/bm015576a. [DOI] [PubMed] [Google Scholar]
- Lahcini M. Qayouh H. Yashiro T. Simon P. Kricheldorf H. R. J. Macromol. Sci., Part A: Pure Appl. Chem. 2010;47:503–509. doi: 10.1080/10601321003741875. doi: 10.1080/10601321003741875. [DOI] [Google Scholar]
- Dos Santos W. N. Polym. Test. 2007;26:556–566. doi: 10.1016/j.polymertesting.2007.02.005. doi: 10.1016/j.polymertesting.2007.02.005. [DOI] [Google Scholar]
- Ajithkumar S. Patel N. K. Kansara S. S. Eur. Polym. J. 2000;36:2387–2393. doi: 10.1016/S0014-3057(00)00025-2. doi: 10.1016/S0014-3057(00)00025-2. [DOI] [Google Scholar]
- Choudalakis G. Gotsis A. D. Eur. Polym. J. 2009;45:967–984. doi: 10.1016/j.eurpolymj.2009.01.027. doi: 10.1016/j.eurpolymj.2009.01.027. [DOI] [Google Scholar]
- Follain N. Crétois R. Lebrun L. Marais S. Phys. Chem. Chem. Phys. 2016;18:20345–20356. doi: 10.1039/c6cp04147g. doi: 10.1039/c6cp04147g. [DOI] [PubMed] [Google Scholar]
- Wilson R. Follain N. Tenn N. Kumar S. A. Thomas S. Marais S. Phys. Chem. Chem. Phys. 2015;17:19527–19537. doi: 10.1039/C5CP02574E. doi: 10.1039/C5CP02574E. [DOI] [PubMed] [Google Scholar]
- Jacquel N. Freyermouth F. Fenouillot F. Rousseau A. Pascault J. P. Fuertes P. Saint-Loup R. J. Polym. Sci., Part A: Polym. Chem. 2011;49:5301–5312. doi: 10.1002/pola.25009. doi: 10.1002/pola.25009. [DOI] [Google Scholar]
- Takahashi H. Hayakawa T. Ueda M. Chem. Lett. 2000;29:684–685. doi: 10.1246/cl.2000.684. doi: 10.1246/cl.2000.684. [DOI] [Google Scholar]
- Buzin P. Lahcini M. Schwarz G. Kricheldorf H. R. Macromolecules. 2008;41:8491–8495. doi: 10.1021/MA8017662. doi: 10.1021/MA8017662. [DOI] [Google Scholar]
- Kricheldorf H. R. Chem. Rev. 2009;109:5579–5594. doi: 10.1021/cr900029e. doi: 10.1021/cr900029e. [DOI] [PubMed] [Google Scholar]
- Karamane M. Raihane M. Tasdelen M. A. Uyar T. Lahcini M. Ilsouk M. Yagci Y. J. Polym. Sci., Part A: Polym. Chem. 2017;55:411–418. doi: 10.1002/pola.28403. doi: 10.1002/pola.28403. [DOI] [Google Scholar]
- Herrera-Alonso J. M. Sedlakova Z. Marand E. J. Membr. Sci. 2010;349:251–257. doi: 10.1016/j.memsci.2009.11.057. doi: 10.1016/j.memsci.2009.11.057. [DOI] [Google Scholar]
- Katiyar V. Naavati H. Polym. Eng. Sci. 2011;51:2066–2077. doi: 10.1002/pen.22120. doi: 10.1002/pen.22120. [DOI] [Google Scholar]
- Tserki V. Matzinos P. Pavlidou E. Vachliotis D. Panayiotou C. Polym. Degrad. Stab. 2006;91:367–376. doi: 10.1016/j.polymdegradstab.2005.04.035. doi: 10.1016/j.polymdegradstab.2005.04.035. [DOI] [Google Scholar]
- Hwang S. Y. Yoo E. S. Im S. S. The synthesis of copolymers, blends and composites based on poly(butylene succinate) Polym. J. 2012;44:1179–1190. doi: 10.1038/pj.2012.157. doi: 10.1038/pj.2012.157. [DOI] [Google Scholar]
- Darie R. N. Pâslaru E. Sdrobis A. Pricope G. M. Hitruc G. E. Poiatǎ A. Baklavaridis A. Vasile C. Ind. Eng. Chem. Res. 2014;53:7877–7890. doi: 10.1021/ie500577m. doi: 10.1021/ie500577m. [DOI] [Google Scholar]
- Nerantzaki M. Papageorgiou G. Z. Bikiaris D. N. Polym. Degrad. Stab. 2014;108:257–268. doi: 10.1016/j.polymdegradstab.2014.03.018. doi: 10.1016/j.polymdegradstab.2014.03.018. [DOI] [Google Scholar]
- Chen J.-H. Yang M.-C. Mater. Sci. Eng., C. 2015;46:301–308. doi: 10.1016/j.msec.2014.10.045. doi: 10.1016/j.msec.2014.10.045. [DOI] [PubMed] [Google Scholar]
- Chen R.-Y. Zou W. Zhang H.-C. Zhang G.-Z. Yang Z.-T. Jin G. Qu J.-P. Polym. Test. 2015;42:160–167. doi: 10.1016/j.polymertesting.2015.01.015. doi: 10.1016/j.polymertesting.2015.01.015. [DOI] [Google Scholar]
- Ojijo V. Ray S. S. Prog. Mater. Sci. 2014;62:1–57. doi: 10.1016/j.pmatsci.2014.01.001. doi: 10.1016/j.pmatsci.2014.01.001. [DOI] [Google Scholar]
- Nejad S. J. J. E-Polymers. 2012;12:1–38. doi: 10.1515/epoly.2012.12.1.253. [DOI] [Google Scholar]
- Maxwell J. C., A Treatise on Electricity and Magnetism, New York, 1954, vol. 2, p. 500 [Google Scholar]
- Abu-Hamdeh N. H. Reeder R. C. Soil Sci. Soc. Am. J. 2000;64:1285–1290. doi: 10.2136/sssaj2000.6441285x. doi: 10.2136/sssaj2000.6441285x. [DOI] [Google Scholar]
- Lule Z. Kim J. Polymers. 2019;11:148. doi: 10.3390/polym11010148. doi: 10.3390/polym11010148. [DOI] [PMC free article] [PubMed] [Google Scholar]
- Slavutsky A. M. Bertuzzi M. A. Armada M. Braz. J. Food Technol. 2012;15:208–218. doi: 10.1590/s1981-67232012005000014. doi: 10.1590/s1981-67232012005000014. [DOI] [Google Scholar]
- Gorrasi G. Tortora M. Vittoria V. Galli G. Chiellini E. J. Polym. Sci., Part B: Polym. Phys. 2002;40:1118–1124. doi: 10.1002/polb.10170. doi: 10.1002/polb.10170. [DOI] [Google Scholar]
- Cussler E. L. Hughes S. E. Ward W. J. Aris R. J. Membr. Sci. 1998;38:161–174. doi: 10.1016/S0376-7388(00)80877-7. [DOI] [Google Scholar]
- Sun L. Boo W.-J. Clearfield A. Sue H.-J. Pham H. Q. J. Membr. Sci. 2008;318:129–136. doi: 10.1016/j.memsci.2008.02.041. doi: 10.1016/j.memsci.2008.02.041. [DOI] [Google Scholar]
- Kwak J., Layered Silicate Particles Filled Polymer Nanocomposite for Barrier Application, ProQuest Dissertations Publishing, University of Florida, 2010 [Google Scholar]
- Charlon S. Marais S. Dargent E. Soulestin J. Sclavons M. Follain N. Phys. Chem. Chem. Phys. 2015;15:29918–29934. doi: 10.1039/c5cp04969e. doi: 10.1039/c5cp04969e. [DOI] [PubMed] [Google Scholar]
- Bhatia A. Gupta R. K. Bhattacharya S. N. Choi H. J. J. Nanomater. 2012;11:1–11. doi: 10.1155/2012/249094. [DOI] [Google Scholar]
- Risse S. Tighzert L. Berzin F. Vergnes B. J. Appl. Polym. Sci. 2014;131:40364. doi: 10.1002/app.40364. doi: 10.1002/app.40364. [DOI] [Google Scholar]
- Xu J. Manepalli P. H. Zhu L. Narayan-Sarathy S. Alavi S. J. Polym. Res. 2019;26:188. doi: 10.1007/s10965-019-1783-8. doi: 10.1007/s10965-019-1783-8. [DOI] [Google Scholar]
- Schmid M. Herbst C. Müller K. Stäbler A. Schlemmer D. Coltelli M. B. Lazzeri A. Polym.-Plast. Technol. Eng. 2016;55:510–517. doi: 10.1080/03602559.2015.1098690. doi: 10.1080/03602559.2015.1098690. [DOI] [Google Scholar]
Associated Data
This section collects any data citations, data availability statements, or supplementary materials included in this article.


