Abstract
In this study, the MIL-101(Cr) metal–organic framework was functionalized with a Dowson-type polyoxometalate (P2W18O626−; POM) and magnetic spinel cobalt ferrite (CoFe2O4; CFO) through a hydrothermal route and was characterized by means of FT-IR, XRD, FE-SEM, EDX, BET, and VSM measurements. All analyses confirmed the successful encapsulation of POM (∼32.2 wt%) into the magnetic MIL-101(Cr) framework. Compared to the pristine MIL-101(Cr) MOF, the as-prepared magnetic ternary nanocomposite (abbreviated as POM/CFO/MIL-101(Cr)) demonstrated a notable decrease in both the surface area and pore volume because of the incorporation of CoFe2O4 nanoparticles and huge P2W18O626− polyanions into the cages of the MIL-101(Cr) framework. The POM/CFO/MIL-101(Cr) was then applied as a magnetically separable adsorbent for the rapid elimination of rhodamine B (RhB), methyl orange (MO), and methylene blue (MB) dye pollutants from aqueous solutions. For achieving the optimized conditions, the effects of initial pH, initial dye concentration, temperature, salt effect, and adsorbent dose on MB and RhB elimination were investigated. The dye adsorption isotherms followed the Langmuir model and pseudo-second-order kinetic model. The POM/CFO/MIL-101(Cr) composite material not only exhibited a fast adsorption rate towards dye molecules, but also demonstrated the selective adsorption of the cationic dyes in wastewater. The recycling experiments also demonstrated that the POM/CFO/MIL-101(Cr) adsorbent was highly stable and could be quickly recovered under a magnetic field without any alteration in the structure. The high adsorption capacity, simple fabrication method, rapid separation by a magnet and supreme reusability of the POM/CFO/MIL-101(Cr) nanocomposite make it an attractive adsorbent for the elimination of cationic dyes from wastewater.
The magnetic CoFe2O4/MIL-101 (Cr) metal–organic framework nanocomposite containing P2W18O626− polyoxometalate was fabricated and applied as an ultrafast adsorbent to remove organic dyes from water.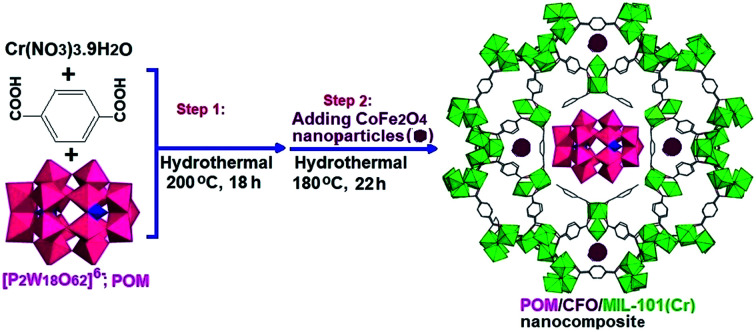
1. Introduction
Nowadays, dye effluents are an important source of water contamination. The pollution of waterways by organic dyes from the painting, pharmaceuticals, textiles, plastic leather, cosmetics, paper, rubber, and printing industries cause widespread environmental harm and can lead to unalterable damage to human beings and to other forms of life.1–3 Thus, it is crucial to find optimal procedures for the elimination of dye effluents from aqueous solutions. Various chemical, physical and biological methods have been utilized for the treatment of these pollutants, such as reverse osmosis, chemical coagulation/flocculation, biological treatments, membrane filtration, photodegradation, and adsorption processes.4–8 Each of these procedures has its disadvantages and advantages. The adsorption method is the most popular, simple and low-cost method for removing the dye effluents from aquatic media on a large scale.9–11 Therefore, finding a more effective adsorbent is the main key to the industrial application of the adsorption method.
Metal–organic frameworks (MOFs) are a new type of porous crystalline material, which make up a category of inorganic–organic hybrid solids constructed by the self-assembly of metal ions or metallic clusters and organic ligands.12,13 MIL-101(Cr), a MOF with the properties of large surface area, high porosity and high stability, is one of the most frequently utilized MOFs.14 MIL-101(Cr) has attracted special attention because the pores and pore windows are large enough to give access to voluminous reactant molecules diffusing into the pores.15 However, the MOF-based materials are difficult to recycle from solution and the tedious and laborious processes in both the preparation and applications limit their practical use. To overcome this problem, MOFs are combined with magnetic nanoparticles due to their easy isolation with an external magnetic field.16,17 In this context, various magnetic Fe3O4@MOFs, including Fe3O4/Cu3(BTC)2,18 CoFe2O4/MIL-100(Fe),19 Fe3O4/MIL-101(Cr),20,21 Fe3O4/Pt/MIL-100(Fe),22 Fe3O4/GO/MIL-100(Fe),23 Fe3O4/MIL-100(Fe),24 and Fe3O4/silica/MIL-100(Fe)/β-CD25 have been developed to remove environmental inorganic/organic pollutants from water. These magnetic MOFs-based materials exhibit fast and excellent adsorption capacity, and easy separation from the solution with an external magnet. However, a critical drawback of these magnetic MOF-based systems is the non-selective dye adsorption.
One strategy to improve the adsorption performance of MOFs is the encapsulation of polyoxometalates (POMs) in their mesoporous cages.26 POMs are significant metal-oxide clusters with highly negative charge and abundant topologies, which have been employed in many research fields such as optics, magnetism, catalysis, and biological medicine.27 However, their applications are limited by their relatively small surface areas (<10 m2 g−1), which hinder the accessibility to the active sites. Also, the high solubility in aqueous solutions is not convenient for their recycling and reuse. Accordingly, outstanding work has been done to encapsulate POMs within porous solid MOFs.28 POM-based metal–organic frameworks (POM@MOFs) are a class of crystalline porous materials integrating the advantages of polyoxometalates (POMs) and metal–organic frameworks (MOFs), and are widely used as catalysts and adsorbents.29–31 When the POM@MOFs materials are used in the fields of adsorption, adsorbate molecules can diffuse into the cages of MOF, and the POM polyanions previously encapsulated in the cages can act as additional active sites for adsorption. The introduction of POM clusters into MOF cages is an effective strategy for producing materials with enhanced adsorption performances. However, it is difficult to recover and reuse binary POM@MOFs materials, and the tedious and laborious processes in both preparation and application limit their practical use.
Based on the above background, our goal in this work is to combine magnetic CoFe2O4 nanoparticles and P2W18O626− polyoxometalate (POM) with MIL-101(Cr) MOF to produce materials with enhanced adsorption performances. By combining the advantages of the magnetic properties of CoFe2O4 nanoparticles and the high adsorption capacity of MOF, the P2W18O626− polyanion was incorporated into the magnetic CoFe2O4/MOF in the design of a novel magnetic ternary hybrid material for the rapid and selective removal of organic dyes from polluted water. The selective adsorption of cationic methylene blue (MB) and rhodamine B (RhB) organic dyes onto POM/CFO/MIL-101(Cr) and the influences of the dye concentration, ionic strength, pH, adsorbent dose, and temperature on the adsorption process were studied. To the best of our knowledge, this is the first report on the preparation of the magnetic POM/CFO/MIL-101(Cr) ternary nanocomposite and its application as an efficient selective adsorbent for the elimination of cationic organic dyes from aqueous solutions.
2. Experimental
2.1. Materials
All analytical grade chemicals were used without further purification. Chromium(iii) nitrate (Cr(NO3)3·9H2O, 98%), terephthalic acid (H2BDC, 99%), Na2WO4·2H2O, H3PO4, cobalt(ii) nitrate (Co(NO3)2·6H2O, 98%), sodium hydroxide (NaOH, 99%), iron(iii) nitrate (Fe(NO3)3·9H2O, 98%), DMF and ethanol (C2H5OH, 99%) were obtained from Sigma-Aldrich. Methyl orange (MO, C14H14N3NaO3S, 98%), methylene blue (MB, C16H18ClN3S, 98%), hydrochloric acid (HCl, 36%) and rhodamine B (RhB, C28H31ClN2O3, 98%) were provided by Merck.
2.2. Preparation of MIL-101(Cr)
MIL-101(Cr) was synthesized according to an earlier report, with some modifications.32 Cr(NO3)3·9H2O (24 g) and H2BDC (0.98 g) were blended in 29 mL distilled water and stirred at room temperature for 10–20 min. The suspension was poured into a 50 mL Teflon-lined autoclave and was heated in an oven at 200 °C for 24 h. After slowly cooling to room temperature, the green solid was filtered and washed with DMF at 60 °C for 3 h and then with ethanol at 70 °C for 2.5 h to remove the untreated H2BDC. Finally, the green MIL-101(Cr) solid was separated by centrifugation and was dried at room temperature.
2.3. Preparation of polyoxometalate (POM)
α-K6P2W18O62·14H2O POM was prepared according to the reported method.33 A sample of Na2WO4·2H2O (300 g; 0.91 mol) dissolved in 350 mL distilled water was acidified by fractional addition of HCl 4 M (250 mL; 1.00 mol) under vigorous stirring. When the cloudy solution became limpid, H3PO4 4 M (250 mL; 1.00 mol) was added slowly. The pale yellow solution was refluxed for at least 24 h. After this reaction time, the yellow color of the solution became more intense. This solution was allowed to cool to room temperature and was then treated with 150 g of KCl. The precipitate was filtered off and air-dried by aspiration. This crude material was dissolved in 650 mL distilled water, and the solution was, eventually, filtered to remove insoluble impurities. The clear solution was then heated at 80 °C for 72 h. After this period, the solution was allowed to cool to room temperature before being placed in a refrigerator at 4 °C. After a few days, stable yellow crystals of α-K6P2W18O62·14H2O polyoxometalate were collected (232.5 g; 95%).
2.4. Preparation of magnetic CFO/MIL-101(Cr)
The CFO/MIL-101(Cr) sample was produced as follows: MIL-101(Cr) (1 g), Co(NO3)2·6H2O (0.62 g), Fe(NO3)3·9H2O (1.72 g), and 20 mL of deionized water were poured into 50 milliliter Teflon-lined autoclave and stirred for 30 min. The pH of the mixture was adjusted at 12 by adding NaOH (6 M) and stirred for 60 min. The Teflon-autoclave was then heated at 180 °C for 12 hours. After completion of the reaction, the precipitate was separated using a magnet and washed with ethanol and deionized water and then dried at room temperature.
2.5. Preparation of POM/MIL-101(Cr)
POM/MIL-101(Cr) was fabricated as follows: Cr(NO3)3·9H2O (2.0 g, 5 mmol), H2BDC (0.83 g, 5 mmol), POM (2.0 g, 0.7 mmol) were dispersed in 20 mL of distilled water for 15 min by sonicating. The suspension became dark blue with a pH of 2.58. The suspension was transferred to a 50 mL Teflon-lined autoclave and heated at 200 °C for 18 h under autogenous pressure. The green powder was separated by centrifugation, washed five times with distilled water, one-time with ethanol, and acetone, and then dried at room temperature. The ICP-AES results indicated that the loading amount of POM in the as-prepared POM/MIL-101 nanocomposite was estimated to be 32.2 wt%.
2.6. Preparation of magnetic POM/CFO/MIL-101(Cr) nanocomposite
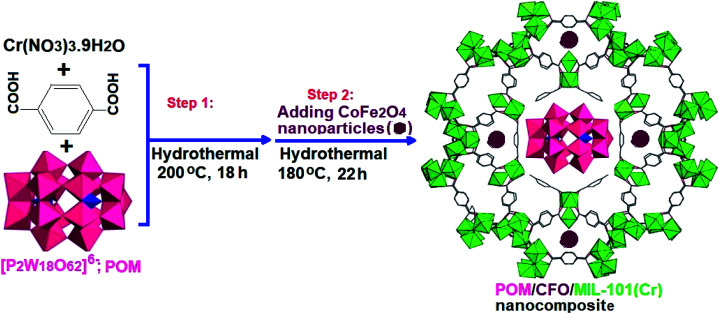
For the synthesis of POM/CFO/MIL-101(Cr), 0.5 g of the POM/Cr-MIL-101 sample and 0.21 g of CoFe2O4 in 25 mL of deionized water were sonicated for 30 min. The mixture was heated at 180 °C in a Teflon-lined autoclave for 22 h. After completing the reaction, the precipitate was separated by a magnet and dried at 25 °C. The preparation process of the POM/CFO/MIL-101(Cr) nanocomposite is presented in Scheme 1.
Scheme 1. The preparation process of the POM/CFO/MIL-101(Cr) nanocomposite.
2.7. Characterization
XRD patterns were acquired on a Panalytical X'PERT PRO X-ray diffractometer at 40 kV using Ni-filtered Cu Kα radiation (λ = 1.5406 Å). FT-IR spectra were recorded on a Shimadzu-8400S (Japan) spectrometer. The distribution and morphology of MIL-101(Cr) and POM/CFO/MIL-101(Cr) samples were analyzed via scanning electron microscopy (SEM, MIRA3 TESCAN) connected with energy-dispersive X-ray (EDX). The surface areas of the samples were investigated by N2 adsorption isotherm via the BET procedure (Micro metrics PHS-1020, Japan). UV-visible spectra were obtained using quartz cells on a Varian Cary 100 dual-beam spectrophotometer using water as the solvent. The VSM evaluation was checked by an MDKFD vibrating magnetometer (Daneshpajoohan Co., Iran) through a high magnetic field of 10 kOe. The loading amount of POM in the composite adsorbent and the concentrations of Cr and W metals in the filtrates and solutions after recovering the adsorbent were determined by inductively coupled plasma atomic emission spectrometer (PerkinElmer ICP-AES, USA). The zeta potentials of MIL-101(Cr) and POM/CFO/MIL-101(Cr) were measured by a zeta potential analyzer (Zetasizer Nano zs90) at varying pH values.
2.8. Adsorption tests
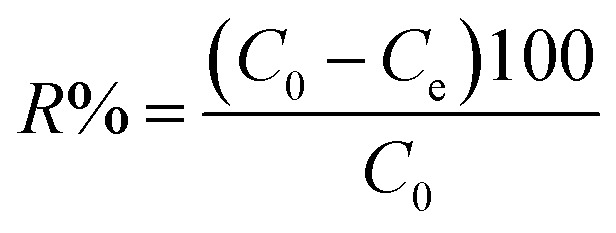
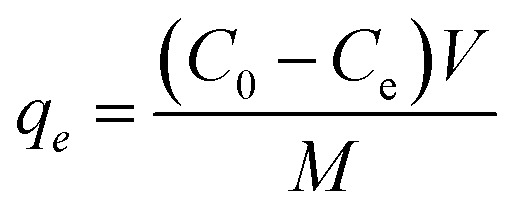
The aqueous supply solutions (500 ppm) of the dyes were manufactured via dissolving MO, MB, and RhB powders in deionized water. Working solutions of these dyes were obtained by the consecutive dilution of the supply solution with deionized water. The concentrations of MO, MB, and RhB dyes were determined using a UV-vis spectrometer at 463, 664, and 553 nanometers, respectively. To investigate the influence of the primary dye concentration, 30 mg of the adsorbent was added to 30 mL of MB solution with the concentration within 25–200 mg L−1. The solution pH was adjusted by adding 6 M NaOH or HCl aqueous solution. The experiment was accomplished in Erlenmeyer flasks and stirred at room temperature at 300 rpm for the desired time, then the magnetic adsorbent was detached by employing the magnet, and the equilibrium concentration was specified by UV-vis analysis. The elimination percentage (R%) and equilibrium adsorption capacity qe (mg g−1) were calculated by the following equations:
 |
1 |
 |
2 |
where Ce and C0 (mg L−1) are the equilibrium and primary concentrations of the dye pollutant, V (L) and M (g) is the volume of pollutant solution and the mass of adsorbent, respectively.
3. Results and discussion
3.1. XRD patterns
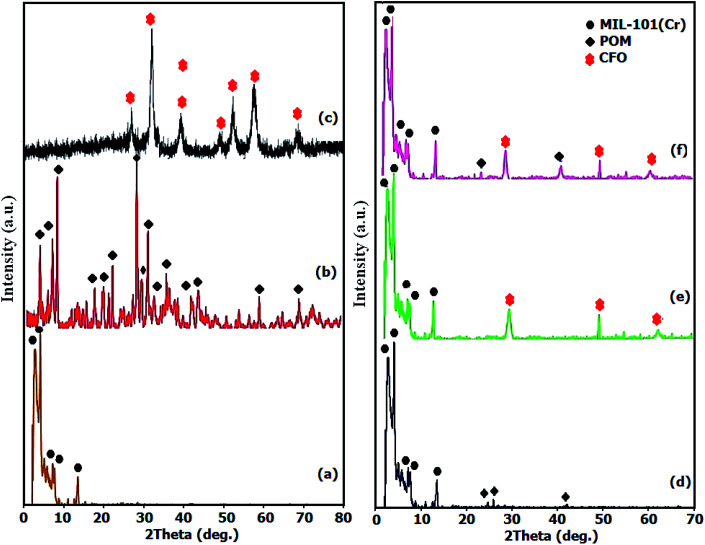
To investigate the phase and crystalline structures of the fabricated MIL-101(Cr), CFO, POM, POM/MIL-101(Cr), CFO/MIL-101(Cr) and POM/CFO/MIL-101(Cr) samples, the XRD patterns were recorded as elucidated in Fig. 1. In agreement with the literature, Fig. 1a demonstrates the normal characterization peaks of MIL-101(Cr) at 2.8° and 3.3° with high intensity, which shows the good crystallinity of the fabricated MIL-101(Cr).34 In Fig. 1b, the diffraction peaks of POM are observed at 2θ of 6–10°, 15–22° and 24–30°.34 As illustrated in Fig. 1c, the general peaks observed at 74.33°, 62.70°, 57.17°, 53.68°, 43.37°, 35.7° and 30.36° were assigned to the (533), (440), (511), (422), (400), (311), and (220) planes of CFO spinel ferrite (JCPDS no. 22-1086).35 The existence of several diffraction bands was attributed to the POM polyanion and CFO nanoparticles in Fig. 1d and e, respectively, though with very poor intensities, indicating the homogeneous distribution of the POM polyanions and CFO nanoparticles in the mesoporous structure of Cr-MIL-101. The main peaks of MIL-101(Cr) in POM/CFO/MIL-101(Cr) (Fig. 1f), were preserved after loading the CFO nanoparticles and POM anion components, which indicated that after incorporating the CFO and POM components, the structure of MIL-101(Cr) remained intact.36 However, peaks assigned to POM in the nanocomposite sample were hardly observed, possibly due to the low content and high dispersion of POM molecules.
Fig. 1. The XRD patterns of MIL-101(Cr) (a), POM (b), CFO (c), POM/MIL-101(Cr) (d), CFO/MIL-101(Cr) (e), and POM/CFO/MIL-101(Cr) (f).
3.2. FTIR analysis
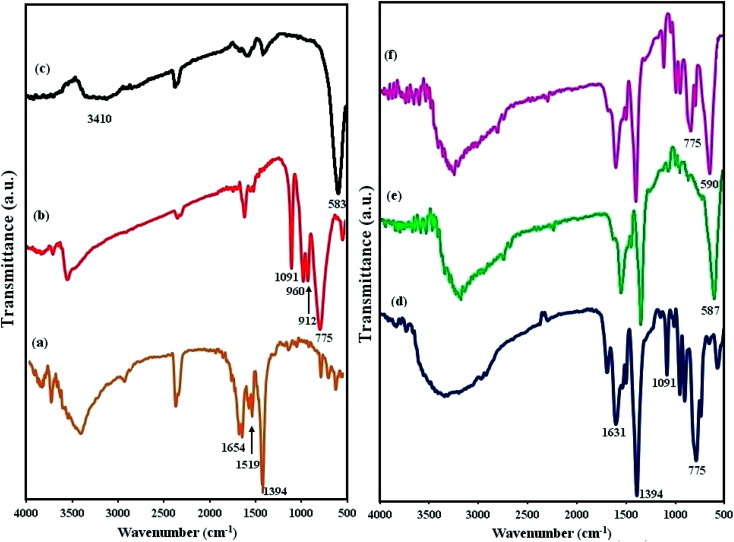
The FT-IR spectra of MIL-101(Cr), POM, CFO, POM/MIL-101(Cr), CFO/MIL-101(Cr), and POM/CFO/MIL-101(Cr) are represented in Fig. 2. In Fig. 2a, the two strong peaks at 1654 and 1394 cm−1 correspond to the symmetric and asymmetric stretching of carboxylate groups (CO2−) in H2BDC molecules, respectively, authenticating the existence of the dicarboxylate linker in the fabricated sample.37–39 In the FT-IR spectrum of POM (Fig. 2b), the characteristic peaks of 912 and 775 cm−1 are linked to the vibrations of inter and intra W–Ob–W bridges, respectively, and the peaks at 1091, and 960 cm−1 were attributed to the vibrations in (P–Oa) and (W–Od) of the POM polyanion. In Fig. 2c, the broad bands at 3410 cm−1 and 583 cm−1 are related to the OH group and Fe–O bond vibrations of CFO nanoparticles, respectively.40 Based on Fig. 2f, it seems that after constructing the POM/CFO/MIL-101(Cr), the characteristic bands related to MIL-101(Cr) were approximately the same. On comparing the spectra of POM/MIL-101(Cr), CFO/MIL-101(Cr) and POM/CFO/MIL-101(Cr) samples, the peaks related to pure CFO and POM were slightly shifted (Fig. 2d–f). These shifts confirmed strong interactions of the CFO and POM anions with MIL-101(Cr).41
Fig. 2. The FT-IR spectra of MIL-101(Cr) (a), POM (b), CFO (c), POM/MIL-101(Cr) (d), CFO/MIL-101(Cr) (e), and POM/CFO/MIL-101(Cr) (f).
3.3. FE-SEM and EDX analyses
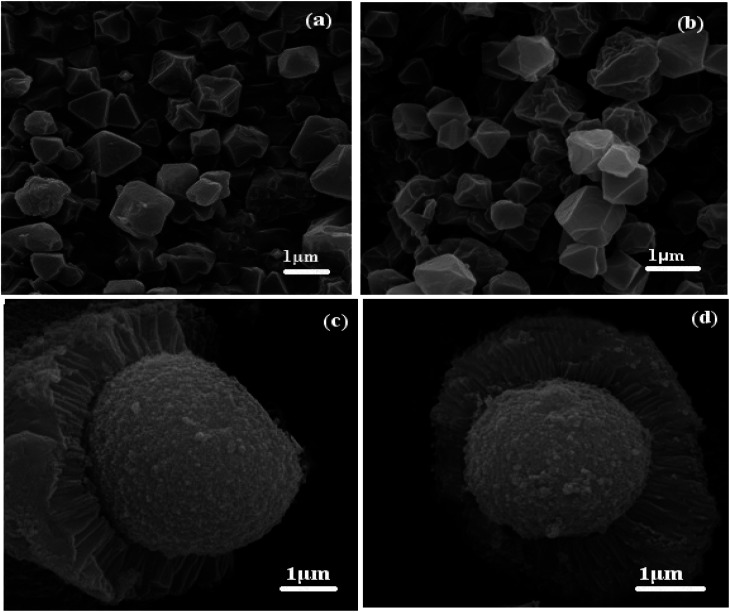
The morphologies of the MIL-101(Cr) and POM/CFO/MIL-101(Cr) samples were investigated utilizing FE-SEM analyses as illustrated in Fig. 3. According to Fig. 3a and b, pristineMIL-101(Cr) particles have an orderly octahedral morphology with narrow size distribution and good porosity in the submicrometer scope. However, comparing FE-SEM images of POM/CFO/MIL-101(Cr) (Fig. 3c and d) with MIL-101(Cr) images did not show any specific morphology of MIL-101(Cr), indicating that due to the presence of POM and CFO, the formation mechanism was different. FE-SEM images in Fig. 3c and d show that the POM/CFO/MIL-101(Cr) particles have core–shell morphology with submicrometer thickness. However, the XRD and FT-IR results established that the framework of MIL-101(Cr) did not collapse or degrade after encapsulation with CFO and POM anions, albeit its morphology was altered.
Fig. 3. SEM images of (a and b) MIL-101(Cr) and (c and d) POM/CFO/MIL-101(Cr).
To further investigate the distribution and chemical composition of the POM/CFO/MIL-101(Cr) core–shell, EDX spectroscopy was performed (Fig. S1†). The elemental peaks attributed to Co, Fe, O, P, C, W, K, and Cr in the introduced EDX spectrum without other impure peaks in Fig. S1a† confirmed the presence of these elements in the prepared core–shell sample. A representative SEM image with corresponding EDX elemental mappings in Fig. S1(b–j)† displayed the map of C, O, P, K, Cr, Fe, Co and W elements, which were uniformly distributed in the core–shell POM/CFO/MIL-101(Cr) particles, emphasizing the homogeneity of the prepared sample.
3.4. Magnetic properties
VSM analysis was applied to study the magnetic characteristics of the CFO and POM/CFO/MIL-101(Cr) samples in the utilized magnetic field from −8000 to 8000 Oe, at 25 °C (Fig. S2†). The saturation magnetization (Ms) values of the CFO and POM/CFO/MIL-101(Cr) were about 63 and 13.7 emu g−1, respectively, which were adequate for fast separation, by using an external magnet. The Ms decreased by nearly 81% in the nanocomposite sample as compared to the CFO nanoparticles, providing evidence that the CFO was encapsulated in the framework of MIL-101(Cr). The magnetic property of the POM/CFO/MIL-101(Cr) sample in aqueous media was examined by bringing a magnet beside a glass vial containing dispersed magnetic POM/CFO/MIL-101(Cr) in aqueous media (the inset in Fig. S2†). It was observed that the cloudy magnetic particles of the sample were separated within 30 seconds under an outer magnetic field.
3.5. BET specific surface areas
The N2 desorption/adsorption isotherms of MOF and POM/CFO/MIL-101(Cr) samples are displayed in Fig. S3.† Based on the IUPAC classification, the N2 adsorption–desorption isotherms of the three samples revealed mixed type I/IV isotherms with the H2-type hysteresis loop, which is characteristic of solids with microporous windows and mesoporous cages. The specific surface area, average pore size and whole pore volume of these materials are presented in Table 1. From Fig. S3a,† the BET surface areas of MIL-101(Cr) and POM/CFO/MIL-101(Cr) were calculated from the adsorption isotherms as 2692.40 and 799.56 m2 g−1, respectively. The average pore size of the MIL-101(Cr) and POM/CFO/MIL-101(Cr) were 0.77 and 0.52 nm, respectively, which were calculated using the BJH method (Fig. S3b† and Table 1). As shown in Table 1, the POM/CFO/MIL-101(Cr) showed the lower surface area and pore volume and also smaller average pore size as compared with the MIL-101(Cr). The great difference between MIL-101(Cr) and POM/CFO/MIL-101(Cr) was ascribed to the insertion of large POM anions and CFO nanoparticles into the pores of MIL-101(Cr), which can occupy main parts of the pore space.
The textural parameters of pristine MIL-101(Cr) and POM/CFO/MIL-101(Cr) samples.
| Sample | BET surface area (m2 g−1) | Langmuir surface area (m2 g−1) | Total pore volume (cm3 g−1) | Average pore diameter (nm) |
|---|---|---|---|---|
| MIL-101(Cr) | 2692.40 | 3455.00 | 2.48 | 0.77 |
| POM/CFO/Cr-MIL-101 | 799.56 | 1117.67 | 0.60 | 0.52 |
3.6. Dye adsorption study
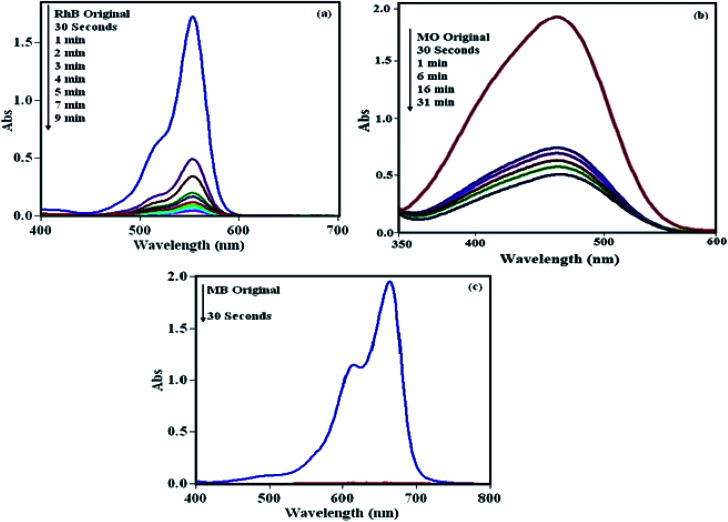
To check the efficiency of the POM/CFO/MIL-101(Cr) sample, the elimination of RhB, MO and MB dyes from pollutant waters were accomplished. The adsorption procedure was specified through specific absorption bands, i.e., 553, 463 and 664 nm for RhB, MO and MB, respectively. As illustrated in Fig. 4, the peaks gradually diminished with adsorption time, denoting a decrease in dye concentration in the solution. As shown in Fig. 4a and b, the adsorption bands of cationic RhB and MB dyes disappeared in 30 s and 9 min, respectively, with an adsorption yield of 100%. Also, the result in Fig. 4c indicated that the POM/CFO/MIL-101(Cr) sample is a weak adsorbent for the elimination of anionic MO dye from pollutant solution, even after 30 min.
Fig. 4. UV-vis spectra of the adsorption of three dyes over POM/CFO/MIL-101(Cr): (a) RhB, (b) MO, and (c) MB. Adsorbent dosage = 30 mg, [dye]0 = 25 mg L−1, 30 mL, temp = 25 °C.
3.6.1. The effect of initial dye concentration
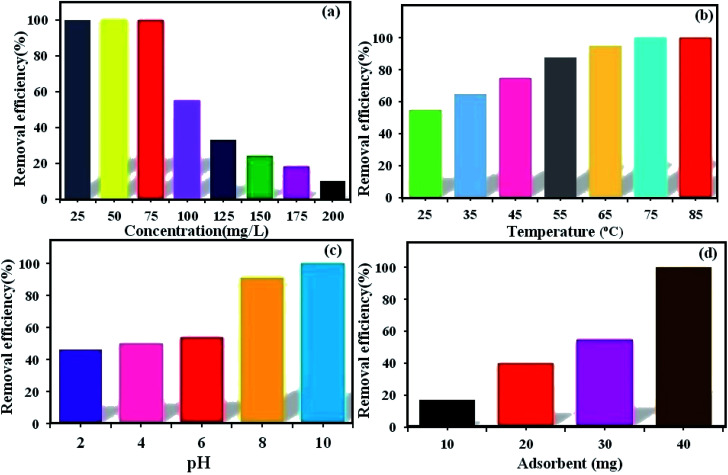
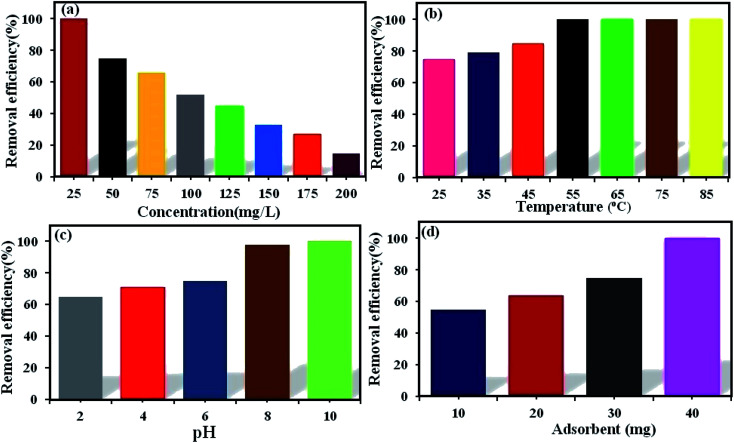
The initial dye concentration has a prominent function in the quantity of dye adsorbed and the efficiency of dye removal. Generally, enhancing the primary dye concentration diminishes the yield of dye removal, due to the impregnation of adsorption sites upon the adsorbing surface.42 The effects of the initial concentrations (25, 50, 75, 100, 125, 150, 175, and 200 mg L−1) of MB (Fig. 5a) and RhB (Fig. 6a) on the adsorption under the fixed conditions of pH 6, adsorbent dosage (30 mg) and 25 °C were studied. The outcomes indicated that on enhancing the primary dye concentration, the elimination of dye decreases. The reason for this phenomenon is that by enhancing the concentration of dye, the active sites on the surface of POM/CFO/MIL-101(Cr) diminished. Thus, the optimum concentrations of 100 and 75 mg L−1 were selected for MB and RhB, respectively, to achieve the maximum removal of dyes.
Fig. 5. The influence of MB concentration (a), reaction temperature (b), pH (c), and adsorbent dosage (d) on the elimination of MB dye via the POM/CFO/MIL-101(Cr) adsorbent. Conditions: C0(MB) = 100 mg L−1, adsorbent dose = 30 mg, pH = 6 and temp. = 25 °C. The fixed contact adsorption time for all tests was 7 min.
Fig. 6. The influence of RhB concentration (a), reaction temperature (b), pH (c), and adsorbent dosage (d) on the elimination of RhB dye via POM/CFO/MIL-101(Cr) adsorbent. Conditions: C0(RhB) = 50 mg L−1, adsorbent dose = 30 mg, pH = 6 and temp. = 25 °C. The fixed contact time for all tests was 16 min.
3.6.2. The effect of temperature
The reaction temperature plays a substantial role in the adsorption procedure. If the adsorption capacity increases with enhancing the temperature, the adsorption is endothermic.43 The influence of temperature on the elimination of MB (Fig. 5b) and RhB (Fig. 6b) from aqueous solutions via POM/CFO/MIL-101(Cr) was checked at several temperatures (25, 35, 45, 55, 65, and 75 °C) under fixed conditions of pH = 6 and adsorbent dosage of 30 mg. The increase in the adsorption efficiency with temperature indicates that the dye absorption is a spontaneous and endothermic process. As the temperature increases, the number of molecules that may gain adequate energy to interact with the active sites on the surface of the adsorbent also increases. Likewise, enhancing the temperature can have an expanding influence on the inner structure of the POM/CFO/MIL-101(Cr), enabling a huge dye molecule to penetrate further.36
3.6.3. The effect of initial pH
The primary pH of the solution is a very important variable in the adsorption system, which can influence the charges of the POM/CFO/MIL-101(Cr) adsorbent, the ionization, and stability of the dyes.44 As such, the influence of primary pH was investigated in the elimination of MB (Fig. 5c) and RhB (Fig. 6c) by POM/CFO/MIL-101(Cr). At natural pH (ca. 6–6.5), the zeta potential measured for POM/CFO/MIL-101(Cr) adsorbent was about −11.2 mV, while the zeta potential of unencapsulated MIL-101(Cr) was about −2.7 mV (see Fig. S1†). This finding indicates that the POM/CFO/MIL-101(Cr) surface was more negatively charged. As shown in Fig. 5c and 6c, the efficiencies of removal of MB and RhB dyes were directly proportional to pH in the range of 2–11 and the dye removal efficiency increased with the increase in pH. At low pH, the less-negative surface of POM/CFO/MIL-101(Cr) does not favor the adsorption process as a result of the electrostatic repulsion but substantial dye adsorption onto POM/CFO/MIL-101(Cr) still takes place, suggesting π–π stacking interactions and/or hydrophobic interactions between MB and RhB molecules and P2Mo18/MIL-101(Cr). At higher pH, the surface of the adsorbent is negatively charged, which favors the electrostatic interactions of cationic species of dyes with the negatively charged surface. The electrostatic attraction force of cationic dyes with POM/CFO/MIL-101(Cr) is greater at higher values of pH.45
3.6.4. The effect of POM/CFO/MIL-101(Cr) dosage
For the optimization of the initial adsorbent dose, a series of experiments was accomplished with varied POM/CFO/MIL-101(Cr) adsorbent amounts (10, 20, 30, and 40 mg) at pH 6 in 30 mL of 100 mg L−1 MB solutions (Fig. 5d) and 50 mg L−1 RhB solutions (Fig. 6d). The obtained results indicated that with increasing the dosage of the adsorbent, the yield elimination of dyes was enhanced, which could be connected to more adsorption sites. The 100% elimination of dyes was achieved in the presence of 40 mg POM/CFO/MIL-101(Cr), which denoted that an adsorbent dosage of 40 mg could be used for the optimum elimination of MB and RhB dyes from polluted water.
3.6.5. The effect of salinity
It has been reported that the addition of salts can affect the removal efficiency due to the salting-out effect. The effect of salt on the removal efficiency was studied in the presence of 0.01 M NaCl, (NH4)2SO4 and Na2HPO4 aqueous solutions. The results in Fig. S4a and b† show that the dye removal efficiency by POM/CFO/MIL-101(Cr) increases in the presence of inorganic salts. As shown in Fig. S4a and b,† the dye removal efficiency improved markedly with increasing salt. This proves that the presence of salt promotes the adsorption of dyes on POM/CFO/MIL-101(Cr). The facilitation of adsorption by salt can be demonstrated by the salting-out theory.46,47 With the increase in the concentration of the salt, the dissolution of dye in water is gradually restrained. The solubility of the dye declines due to the salting-out effect, which impels the diffusion of more dye molecules to the surface of POM/CFO/MIL-101(Cr) and increases the adsorption efficiency. For this reason, the maximum removal of MB and RhB was achieved in the presence of Na2HPO4 salt.
3.6.6. The use of the POM/CFO/MIL-101(Cr) adsorbent for mixed dyes
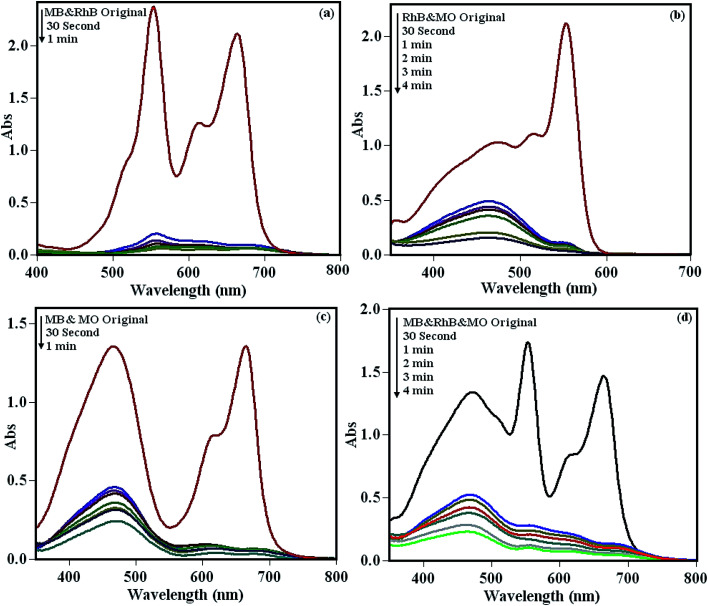
To investigate the adsorption capability of the POM/CFO/MIL-101(Cr) adsorbent for mixtures of dyes, the binary MB/RhB, RhB/MO and MB/MO, and ternary MB/RhB/MO mixtures were selected and their adsorption process were monitored by UV-vis spectroscopy. The results in Fig. 7a–d demonstrate that the POM/CFO/MIL-101(Cr) adsorbed the cationic dyes faster than the anionic dye in the aqueous mixed dyes solutions. The existence of negative charges on the surface of POM/CFO/MIL-101(Cr) depicted by the zeta potential (see Fig. S5†) corresponds well with the results of the adsorptions of differently charged dye molecules. The electrostatic repulsion between the negatively charged POM/CFO/MIL-101(Cr) and anionic MO molecules resulted in their lesser adsorption as compared to cationic dye molecules. However, a relatively high adsorption of anionic MO dye was also observed in the mixed dye solutions, indicating that other interactions such as hydrogen bonding, π–π stacking interactions, and/or hydrophobic interactions are involved in the adsorption process. On the other hand, the adsorption of anionic MO molecules onto the adsorbent could increase after the adsorption of cationic dyes such as MB in the mixture of dyes.
Fig. 7. The selective adsorption potency of POM/CFO/MIL-101(Cr) in the dye mixture solutions of (a) MB and RhB, (b) RhB and MO, (c) MB and MO, (d) RhB, MB and MO. Reaction conditions: C0(MO) = C0(RhB) = C0(MB) = 25 mg L−1, and adsorbent dose = 40 mg.
3.6.7. Adsorption performance of the nanocomposite components
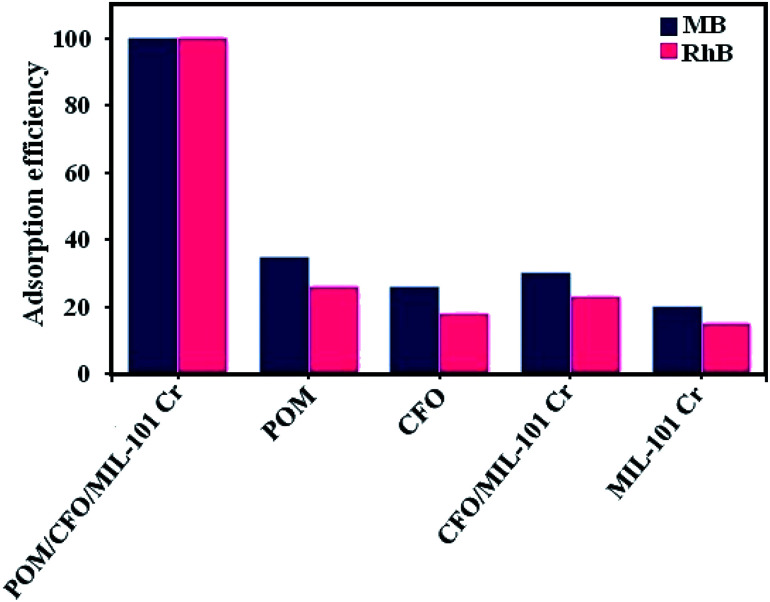
The adsorption performance of the POM/CFO/MIL-101(Cr) components in the elimination of MB (100 mg L−1) and RhB (50 mg L−1) dyes from aqueous solutions was studied. As shown in Fig. 8, POM/CFO/MIL-101(Cr) exhibited greater adsorption efficiency than MIL-101(Cr), POM, CFO, and CFO/MIL-101(Cr), which indicates that the MB and RhB adsorption performances of the MIL-101-based adsorbents were enhanced, after the POM cluster was introduced on the surface and into the cages of MIL-101(Cr).
Fig. 8. Adsorption yield of MB and RhB dyes with the components of the POM/CFO/MIL-101(Cr) sample. Conditions: C0(MB) = 100 mg L−1, C0(RhB) = 50 mg L−1, adsorbent dose = 30 mg, pH = 6 and temp. = 25 °C. The fixed contact adsorption times for MB and RhB dyes were 20 and 25 min, respectively.
3.6.8. Comparison with other reported adsorbents
To show the advantage of the present adsorbent, we compared the obtained results in the removal of MB from aqueous solution by the POM/CFO/MIL-101(Cr) nanocomposite with some similarly reported adsorbents in the literature.48–65 From Table S1 (see ESI†), with respect to the adsorption capacity, time and initial dye concentration, it is clear that the present method is more suitable and/or superior. We can see that the adsorption process in the presence of most reported adsorbents required a longer reaction time as compared to the POM/CFO/MIL-101(Cr) nanocomposite. The POM polyanions with higher negative charges incorporated in the hybrid have a stronger force of attraction to the positive charges of the cationic dyes (e.g. MB). In fact, the higher adsorption capacity of the POM/CFO/MIL-101(Cr) is due to the synergistic effect between MIL-101(Cr) and POM polyanions having high negative charges (6−).
3.7. Study of adsorption isotherms
The adsorption isotherms of cationic dyes with various primary concentrations (125–200 mg L−1) onto the POM/CFO/MIL-101(Cr) adsorbent at room temperature are illustrated in Fig S6(a–f).† To survey the adsorption mechanisms, the Freundlich and Langmuir isotherm models were applied. The Langmuir model is displayed in linear form eqn (S1),† and assumes that the adsorption occurs at specific homogeneous sites, in monolayer form, onto the adsorbing surface.66,67 From Table 2, the adsorption capacities of POM/CFO/MIL-101(Cr) for cationic MB and RhB dyes are 200 and 153.84 mg g−1, respectively, affirming that the sample presents supreme adsorption capacities for these dyes. To predict the desirability of the adsorption system, the RL factor has been reported from eqn (S1).† The RL factor indicates whether the kind of isotherm is favorable (0 < RL< 1), irreversible (RL = 0), linear (RL = 1), or unfavorable (RL> 1 or RL< 0).68 As shown in Table 2, The RL factors are between 0 and 1, indicating that the adsorption of selected cationic dyes on the POM/CFO/MIL-101(Cr) sample was desirable.
The Freundlich and Langmuir isotherm parameters for the adsorption of organic dyes using the POM/CFO/MIL-101(Cr) samplea.
| Langmuir | Freundlich | ||||||
|---|---|---|---|---|---|---|---|
| Dye | q m (mg g−1) | K L (L mg−1) | R 2 | R L | K f (mg g−1) | n | R 2 |
| MB | 200 | 1.67 | 0.9964 | 0.0031–0.005 | 121.06 | 4.40 | 0.9913 |
| RhB | 153.84 | 0.16 | 0.9995 | 0.059–0.11 | 23.88 | 1.67 | 0.9914 |
K L, q m, and Ce are the Langmuir constant (mg L−1), high adsorption capacity (mg g−1), and the equilibrium concentration of the pollutant solution (mg L−1), respectively. The RL factor indicates whether the isotherm is favorable (0 < RL< 1), irreversible (RL = 0), linear (RL = 1), or unfavorable (RL> 1 or RL< 0). Kf (mg g−1) and n indicate the Freundlich constant and heterogeneity factor, respectively.
The Freundlich model, which is extensively applied to explain the adsorption on non-homogeneous surfaces caused through the diverse functional groups on the surface and some adsorbate–adsorbent interactions, was investigated for fitting the results from the MB and RhB adsorption isotherms by using the eqn (S3).†69 The Freundlich isotherms are depicted in Fig. S6e† for MB and Fig. S6f† for RhB. With regard to the R2 values in Table 2, the adsorptions showed a better fit to the Langmuir isotherm as compared to the Freundlich isotherm.
3.8. Adsorption kinetics
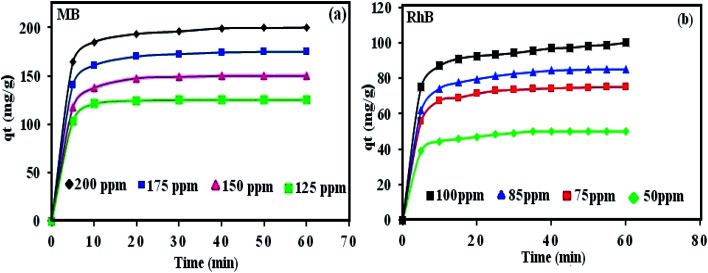
The time-dependent adsorption capacities of RhB and MB dyes on POM/CFO/MIL-101(Cr) were investigated versus contact time (Fig. 9). To investigate the adsorption process, including the rate and mechanism of adsorption, the three kinetic models (pseudo-first-order (eqn (S4)),† pseudo-second-order (eqn (S5)),† and intra-particle diffusion (eqn (S6))†) were utilized to test the experimental data at various initial concentrations of RhB (50, 75, 80, and 100 mg L−1), and MB (125, 150, 175, and 200 mg L−1).70 The values of k2 and qe(cal) were computed from the intercept and slope of the linear isotherm of t/qt vs. t in Fig. S7.† According to Table 3, the values of the qe(exp) for MB and RhB dyes are close to qe(cal) based on the pseudo-second-order equation, which supports that the pseudo-second-order model can be applied to explain the adsorption of these dyes onto the POM/CFO/MIL-101(Cr). These indicate that chemisorption is relatively dominant and controls the adsorption process.36,44 The coefficients (R2) of the pseudo-second-order and first-order equations are presented in Table 3. It can be seen that the correlation coefficient of the pseudo-second-order model was higher than the pseudo-first-order equation. Thus, these results demonstrate that the adsorption of RhB and MB on POM/CFO/MIL-101(Cr) followed the pseudo-second-order model. Moreover, the obtained results displayed that the surface adsorption via the diffusion of the particles may be accomplished, and the sorption follows an intraparticle diffusion model.
Fig. 9. The influence of the primary dye concentration and contact time on the adsorption processes of MB (a) and RhB (b) onto the POM/CFO/MIL-101(Cr) adsorbent.
Kinetics constants for MB and RhB adsorption at different dye concentrationsa.
| Pseudo-first-order kinetics | Pseudo-second-order kinetics | Intraparticle diffusion | ||||||||
|---|---|---|---|---|---|---|---|---|---|---|
| Dye | q e,exp (mg g−1) | q e,cal (mg g−1) | k 1 (min−1) | R 1 2 | k 2 (g mg−1 min−1) | q e,cal (mg g−1) | R 2 2 | k p | I | R 3 2 |
| MB | ||||||||||
| 125 | 124.4 | 2.5 | 0.08 | 0.9631 | 0.058 | 125 | 1.00 | 13.7 | 31.1 | 0.7704 |
| 150 | 147.59 | 2.8 | 0.09 | 0.9575 | 0.021 | 151.5 | 0.9999 | 16.8 | 32.6 | 0.819 |
| 175 | 170.08 | 3.4 | 0.1 | 0.9732 | 0.016 | 175.4 | 0.9998 | 19.3 | 38.9 | 0.8089 |
| 200 | 193.3 | 4.3 | 0.11 | 0.9852 | 0.017 | 200 | 0.9999 | 21.8 | 47.2 | 0.7869 |
| RhB | ||||||||||
| 50 | 47 | 1.7 | 0.08 | 0.9622 | 0.019 | 51.02 | 0.9994 | 5.4 | 12.6 | 0.7646 |
| 75 | 69 | 1.9 | 0.09 | 0.9542 | 0.012 | 76.33 | 0.9994 | 8.2 | 16.7 | 0.8018 |
| 85 | 77.5 | 2.4 | 0.10 | 0.9634 | 0.009 | 86.95 | 0.9992 | 9.2 | 18.2 | 0.8144 |
| 100 | 91 | 3.4 | 0.17 | 0.989 | 0.007 | 101.01 | 0.9989 | 10.4 | 23.1 | 0.7781 |
q t and qe (mg g−1) are the concentrations of dye adsorbed at any time t and equilibrium time (min), respectively. k1 (min−1) and k2 (g mg−1 min−1) are the rate constants of adsorption for the pseudo-first-order and the pseudo-second-order models respectively, and kp (mg g−1 min−1) and I are the intraparticle dissemination rate constant and intercept for the first linear phase.
3.9. Stability and recyclability of the POM/CFO/MIL-101(Cr) adsorbent
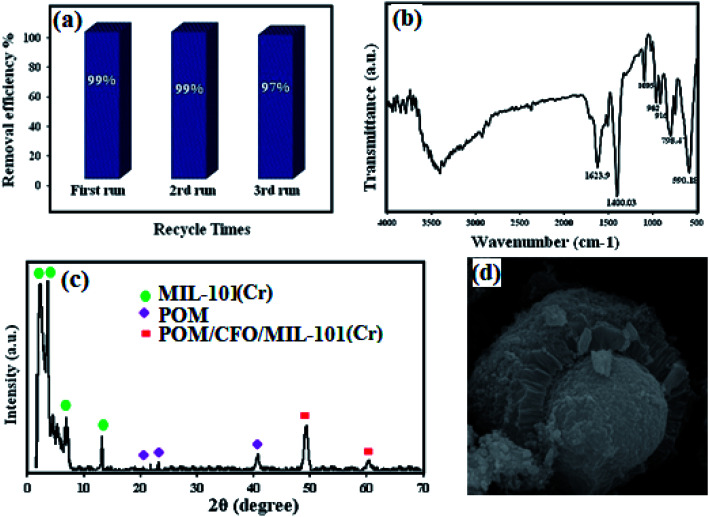
An important factor for considering a solid material as an efficient adsorbent in the industry is its ability to be recycled. To investigate the reusability of the POM/CFO/MIL-101(Cr) sample, cycling experiments were conducted via utilizing a combination of distilled water, 0.1 M of NaCl and ethanol as desorption solvents. For this purpose, 30 mg of the sample was added to the MB solution at a concentration of 100 mg L−1 and stirred for 20 min. In the next step, the sample was thoroughly separated by using an external magnetic field, and washed four times with distilled water and ultimately dried for 12 h at 60 °C. The dried sample was reused for another adsorption process under identical conditions. The results revealed that the adsorbent is reusable for 3 runs without considerable loss of activity (Fig. 10a). As represented in Fig. 10b and c, FT-IR, XRD, and SEM analyses of the recycled POM/CFO/MIL-101(Cr) sample after 3 runs were the same as for the fresh sample. These outcomes proved that the structure of the magnetic POM/CFO/MIL-101(Cr) sample was stable and was not altered after reusing.
Fig. 10. The reusability of the POM/CFO/MIL-101(Cr) adsorbent in the elimination of MB (a). FTIR spectrum (b), XRD pattern (c), and SEM photograph (d) of the recovered sample after 3 runs.
4. Conclusions
A magnetic nanocomposite based on MIL-101(Cr), POM, and CoFe2O4 was designed and synthesized by the hydrothermal method. In comparison with the MIL-101(Cr), the magnetic POM/CFO/MIL-101(Cr) sample nanocomposite sample demonstrated high adsorption capacity, considerable stability, and effective elimination of cationic dyes from aqueous solutions. Effective factors affecting the adsorption capacity such as primary pH, temperature, initial dye concentration, and adsorbent amount of the solution were investigated. Also, the adsorption kinetics and isotherm experiments demonstrated that the adsorption processes of RhB and MB dyes follow the pseudo-second-order and Langmuir isotherm, respectively. The MB yield elimination was 97% after recycling the magnetic sample for 3 runs. Thus, the POM/CFO/MIL-101(Cr) sample can potentially be utilized as an adsorbent for treating industrial effluents containing complex dyes. These remarkable results suggest that the POM/CFO/MIL-101(Cr) nanocomposite is a useful, economical and efficient adsorption and separation material that can be further utilized in the capture and separation of organic dyes in contaminated water.
Conflicts of interest
There are no conflicts of interest to declare.
Supplementary Material
Acknowledgments
This work is financially supported by the Lorestan University Research Council and Iran Nanotechnology Initiative Council (INIC).
Electronic supplementary information (ESI) available. See DOI: 10.1039/d0ra04603e
References
- Fan J. Chen D. Li N. Xu Q. Li H. He J. Lu J. Chemosphere. 2018;191:315–323. doi: 10.1016/j.chemosphere.2017.10.042. [DOI] [PubMed] [Google Scholar]
- Khan N. A. Hasan Z. Jhung S. H. J. Hazard. Mater. 2013;244:444–456. doi: 10.1016/j.jhazmat.2012.11.011. [DOI] [PubMed] [Google Scholar]
- Katheresan V. Kansedo J. Lau S. Y. J. Environ. Chem. Eng. 2018;6:4676–4697. doi: 10.1016/j.jece.2018.06.060. [DOI] [Google Scholar]
- Hamedi A. Zarandi M. B. Nateghi M. R. J. Environ. Chem. Eng. 2019;7:102882. doi: 10.1016/j.jece.2019.102882. [DOI] [Google Scholar]
- Hitkari G. Singh S. Pandey G. Int. Adv. Res. J. Sci. Eng. Technol. 2017;4:3960–3965. [Google Scholar]
- Zhang C. H. Ai L. H. Jiang J. Ind. Eng. Chem. Res. 2015;54:153–163. doi: 10.1021/ie504111y. [DOI] [Google Scholar]
- Bhatia D. Sharma N. R. Singh J. Kanwar R. S. Crit. Rev. Environ. Sci. Technol. 2017;47:1836–1876. doi: 10.1080/10643389.2017.1393263. [DOI] [Google Scholar]
- Seow T. W. Lim C. K. Int. J. Appl. Bioeng. 2016;11:2675–2679. [Google Scholar]
- Saber-Samandari S. Joneidi-Yekta H. Mohseni M. Chem. Eng. J. 2017;308:1133–1144. doi: 10.1016/j.cej.2016.10.017. [DOI] [Google Scholar]
- Guo S. Wu K. Gao Y. Liu L. Zhu X. Li X. Zhang F. J. Chem. Eng. Data. 2018;63:3902–3912. doi: 10.1021/acs.jced.8b00526. [DOI] [Google Scholar]
- Nasar A. Shakoor S. Mater. Res. Forum. 2017;15:1–33. [Google Scholar]
- Hao X. L. Ma Y. Y. Zang H. Y. Wang Y. H. Li Y. G. Wang E. B. Chem.–Eur. J. 2015;21:3778–3784. doi: 10.1002/chem.201405825. [DOI] [PubMed] [Google Scholar]
- Salomon W. Yazigi F.-J. Roch-Marchal C. Mialane P. Horcajada P. Serre C. Haouas M. Taulelle F. Dolbecq A. Dalton Trans. 2014;43:12698–12705. doi: 10.1039/C4DT01286K. [DOI] [PubMed] [Google Scholar]
- Bhattacharjee S. Chen C. Ahn W. S. RSC Adv. 2014;4:52500–52525. doi: 10.1039/C4RA11259H. [DOI] [Google Scholar]
- Ma J. Guo X. Ying Y. Liu D. Zhong C. Chem. Eng. J. 2017;313:890–898. doi: 10.1016/j.cej.2016.10.127. [DOI] [Google Scholar]
- Espallargas G. M. Coronado E. Chem. Soc. Rev. 2018;47:533–557. doi: 10.1039/C7CS00653E. [DOI] [PubMed] [Google Scholar]
- Zhu L. Liu X. Q. Jiang H. L. Sun L. B. Chem. Rev. 2017;117:8129–8176. doi: 10.1021/acs.chemrev.7b00091. [DOI] [PubMed] [Google Scholar]
- Ke F. Jiang J. Li Y. Liang J. Wan X. Ko S. Appl. Surf. Sci. 2017;413:266–274. doi: 10.1016/j.apsusc.2017.03.303. [DOI] [Google Scholar]
- Yang J. C. Yin X.-B. Sci. Rep. 2007;7:40955. doi: 10.1038/srep40955. [DOI] [PMC free article] [PubMed] [Google Scholar]
- Wang T. Zhao P. Lu N. Chen H. Zhang C. Hou X. Chem. Eng. J. 2016;295:403–413. doi: 10.1016/j.cej.2016.03.016. [DOI] [Google Scholar]
- Huang L. Cai J. He M. Chen B. Hu B. Ind. Eng. Chem. Res. 2018;57:6201–6209. doi: 10.1021/acs.iecr.7b05294. [DOI] [Google Scholar]
- Chen X. Zhang Y. Zhao Y. Wang S. Liu L. Xu W. Guo Z. Wang S. Liu Y. Zhang J. Inorg. Chem. 2019;58:12433–12440. doi: 10.1021/acs.inorgchem.9b02114. [DOI] [PubMed] [Google Scholar]
- Gong Q. Liu Y. Dang Z. J. Hazard. Mater. 2019;371:677–686. doi: 10.1016/j.jhazmat.2019.03.019. [DOI] [PubMed] [Google Scholar]
- Tian H. Peng J. Du Q. Hui X. He H. Dalton Trans. 2018;47:3417–3424. doi: 10.1039/C7DT04819J. [DOI] [PubMed] [Google Scholar]
- Lajevardi A. Hossaini-Sadr M. Tavakkoli-Yaraki M. Badiei A. Armaghan M. New J. Chem. 2018;42:9690–9701. doi: 10.1039/C8NJ01375F. [DOI] [Google Scholar]
- Du D. Y. Qin J. S. Li S. L. Su Z. M. Lan Y. Q. Chem. Soc. Rev. 2014;43:4615–4632. doi: 10.1039/C3CS60404G. [DOI] [PubMed] [Google Scholar]
- Weinstock I. A. Schreiber R. E. Neumann R. Chem. Rev. 2018;118:2680–2717. doi: 10.1021/acs.chemrev.7b00444. [DOI] [PubMed] [Google Scholar]
- Buru C. T. Farha O. K. ACS Appl. Mater. Interfaces. 2020;12(5):5345–5360. doi: 10.1021/acsami.9b19785. [DOI] [PubMed] [Google Scholar]
- Lin Z. J. Zheng H. Q. Chen J. Zhuang W. E. Lin Y. X. Su J. W. Huang Y. B. Cao R. Inorg. Chem. 2018;57:13009–13019. doi: 10.1021/acs.inorgchem.8b02272. [DOI] [PubMed] [Google Scholar]
- Zhang Q. Yang T. Liu X. Yue C. Ao L. Deng T. Zhang Y. RSC Adv. 2019;9:16357–16365. doi: 10.1039/C9RA03209F. [DOI] [PMC free article] [PubMed] [Google Scholar]
- Li X. X. Zhao D. Zheng S. T. Coord. Chem. Rev. 2019;397:220–240. doi: 10.1016/j.ccr.2019.07.005. [DOI] [Google Scholar]
- Férey G. Mellot-Draznieks C. Serre C. Millange F. Dutour J. Surblé S. Margiolaki I. Science. 2005;309:2040–2042. doi: 10.1126/science.1116275. [DOI] [PubMed] [Google Scholar]
- Mbomekalle I. M. Lu Y. W. Keita B. Nadjo L. Inorg. Chem. Commun. 2004;7:86–90. doi: 10.1016/j.inoche.2003.10.011. [DOI] [Google Scholar]
- Feng C. Xu G. Liu X. J. Rare Earths. 2013;31:44–48. doi: 10.1016/S1002-0721(12)60232-4. [DOI] [Google Scholar]
- Abroushan E. Farhadi S. Zabardasti A. RSC Adv. 2017;7:18293–18304. doi: 10.1039/C7RA01728F. [DOI] [Google Scholar]
- Wang X. Peng J. Liu M. G. Wang D. D. Meng C. L. Li Y. Shi Z. Y. CrystEngComm. 2012;14:3220–3226. doi: 10.1039/C2CE06577K. [DOI] [Google Scholar]
- Wang X. Chang Z. Lin H. Xu C. Luan J. Liu G. Tian A. RSC Adv. 2015;5:35535–35540. doi: 10.1039/C5RA06204G. [DOI] [Google Scholar]
- Ribeiro S. Granadeiro C. M. Silva P. Paz F. A. A. Biani F. F. D. Cunha-Silva L. Balula S. S. Catal. Sci. Technol. 2013;3:2404–2414. doi: 10.1039/C3CY00287J. [DOI] [Google Scholar]
- Balula S. S. Granadeiroa C. M. Barbosa A. D. S. Santos I. C. M. S. Cunha-Silva L. Catal. Today. 2013;210:142–148. doi: 10.1016/j.cattod.2012.12.003. [DOI] [Google Scholar]
- Salleh M. A. M. Mahmoud D. K. Karim W. A. Idris A. Desalination. 2011;280:1–13. doi: 10.1016/j.desal.2011.07.019. [DOI] [Google Scholar]
- Dawood S. Sen T. J. Chem. Process Eng. 2014;1:1–11. [Google Scholar]
- Aslam S. Zeng J. Subhan F. Li M. Lyu F. Li Y. Yan Z. J. Colloid Interface Sci. 2017;505:186–195. doi: 10.1016/j.jcis.2017.05.090. [DOI] [PubMed] [Google Scholar]
- Yi F. Y. Zhu W. Dang S. Li J. P. Wu D. Li Y. H. Sun Z.-M. Chem. Commun. 2015;51:3336–3339. doi: 10.1039/C4CC09569C. [DOI] [PubMed] [Google Scholar]
- Muhammad A. Shah A. U. H. A. Bilal S. Rahman G. Materials. 2019;12:1764. doi: 10.3390/ma12111764. [DOI] [PMC free article] [PubMed] [Google Scholar]
- Benaïssa H. J. Taibah Univ. Sci. 2010;4:31–38. doi: 10.1016/S1658-3655(12)60024-7. [DOI] [Google Scholar]
- Sun H. Cao L. Lu L. Nano Res. 2011;4:550–562. doi: 10.1007/s12274-011-0111-3. [DOI] [Google Scholar]
- Huang J. Song H. Chen C. Yang Y. Xu N. Ji X. Li C. You J.-A. J. Environ. Chem. Eng. 2017;5:2579–2585. doi: 10.1016/j.jece.2017.05.012. [DOI] [Google Scholar]
- Liu X. Gong W. Luo J. Zou C. Yang Y. Yang S. Appl. Surf. Sci. 2016;362:517–524. doi: 10.1016/j.apsusc.2015.11.151. [DOI] [Google Scholar]
- Li L. Liu X. L. Geng H. Y. Hu B. Song G. W. Xu Z. S. J. Mater. Chem. A. 2013;1:10292–10299. doi: 10.1039/C3TA11478C. [DOI] [Google Scholar]
- Huang X.-X. Qiu L.-G. Zhang W. Yuan Y.-P. Jiang X. Xie A.-J. Shen Y.-H. Zhu J.-F. CrystEngComm. 2012;14:1613–1617. doi: 10.1039/C1CE06138K. [DOI] [Google Scholar]
- Haque E. Jun J. W. Jhung S. H. J. Hazard. Mater. 2011;185:507–511. doi: 10.1016/j.jhazmat.2010.09.035. [DOI] [PubMed] [Google Scholar]
- Zou C. Zhang Z. Xu X. Gong Q. Li J. Wu C.-D. J. Am. Chem. Soc. 2011;134:87–90. doi: 10.1021/ja209196t. [DOI] [PubMed] [Google Scholar]
- Lin S. Song Z. Che G. Ren A. Li P. Liu C. Zhang J. Microporous Mesoporous Mater. 2014;193:27–34. doi: 10.1016/j.micromeso.2014.03.004. [DOI] [Google Scholar]
- Liu X. Luo J. Zhu Y. Yang Y. Yang S. J. Alloys Compd. 2015;648:986–993. doi: 10.1016/j.jallcom.2015.07.065. [DOI] [Google Scholar]
- Yao Y. J. Xu F. F. Chen M. Xu Z. X. Zhu Z. W. Bioresour. Technol. 2010;101:3040–3046. doi: 10.1016/j.biortech.2009.12.042. [DOI] [PubMed] [Google Scholar]
- Rao V. B. Rao S. R. M. Chem. Eng. J. 2006;116:77–84. doi: 10.1016/j.cej.2005.09.029. [DOI] [Google Scholar]
- Zhang Z. Zhang F. Zhu Q. Zhao W. Ma B. Ding Y. J. Colloid Interface Sci. 2011;360:189–194. doi: 10.1016/j.jcis.2011.04.045. [DOI] [PubMed] [Google Scholar]
- Li R. Ren X. Q. Zhao J. S. Feng X. Jiang X. Fan X. X. Lin Z. G. Li X. G. Hu C. G. Wang B. J. Mater. Chem. A. 2014;2:2168–2173. doi: 10.1039/C3TA14267A. [DOI] [Google Scholar]
- Zhu T. T. Zhang Z.-M. Chen W.-L. Liu Z.-J. Wang E.-B. RSC Adv. 2016;6:81622–81630. doi: 10.1039/C6RA16716K. [DOI] [Google Scholar]
- Yan A. X. Yao S. Li Y. G. Zhang Z. M. Lu Y. Chen W. L. Wang E. B. Chem.–Eur. J. 2014;20:6927–6933. doi: 10.1002/chem.201400175. [DOI] [PubMed] [Google Scholar]
- Yao L. Zhang L. Wang R. Chou S. Dong Z. J. Hazard. Mater. 2016;301:462–470. doi: 10.1016/j.jhazmat.2015.09.027. [DOI] [PubMed] [Google Scholar]
- Liu F. Chung S. Y. Oh G. Seo T. S. ACS Appl. Mater. Interfaces. 2012;4:922–972. doi: 10.1021/am201590z. [DOI] [PubMed] [Google Scholar]
- Zhu Y. Wang Y. M. Zhao S. Y. Liu P. Wei C. Wu Y. L. Xia C. K. Xie J. M. Inorg. Chem. 2014;53:7692. doi: 10.1021/ic5009895. [DOI] [PubMed] [Google Scholar]
- Tong M. M. Liu D. H. Yang Q. Y. Devautour-Vinot S. Maurin G. Zhong C. L. J. Mater. Chem. A. 2013;1:8534. doi: 10.1039/C3TA11807J. [DOI] [Google Scholar]
- Yi F. Y. Zhu W. Dang S. Li J.-P. Wu D. Li Y. H. Sun Z. M. Chem. Commun. 2015;51:3336–3339. doi: 10.1039/C4CC09569C. [DOI] [PubMed] [Google Scholar]
- Zhang F. Song W. Lan J. Appl. Surf. Sci. 2015;326:195–203. doi: 10.1016/j.apsusc.2014.11.143. [DOI] [Google Scholar]
- Ding Z. Wang W. Zhang Y. Li F. Liu J. P. J. Alloys Compd. 2015;640:362–370. doi: 10.1016/j.jallcom.2015.04.020. [DOI] [Google Scholar]
- Lin K. Y. A. Chang H. A. Chemosphere. 2015;139:624–631. doi: 10.1016/j.chemosphere.2015.01.041. [DOI] [PubMed] [Google Scholar]
- Huo S. H. Yan X. P. J. Mater. Chem. 2012;22:7449–7455. doi: 10.1039/C2JM16513A. [DOI] [Google Scholar]
- Ren X. Shao D. Yang S. Hu J. Sheng G. Tan X. Wang X. Chem. Eng. J. 2011;170:170–177. doi: 10.1016/j.cej.2011.03.050. [DOI] [Google Scholar]
Associated Data
This section collects any data citations, data availability statements, or supplementary materials included in this article.


