

Abstract
Background
Black men are burdened by high cardiovascular risk and the highest all‐cause mortality rate in the United States. Socioeconomic status (SES) is associated with improved cardiovascular risk factors in majority populations, but there is a paucity of data in Black men.
Methods and Results
We examined the association of SES measures including educational attainment, annual income, employment status, and health insurance status with an ideal cardiovascular health (ICH) score, which included blood pressure, glucose, cholesterol, body mass index, physical activity, and smoking in African American Male Wellness Walks. Six metrics of ICH were categorized into a 3‐tiered ICH score 0 to 2, 3 to 4, and 5 to 6. Multinomial logistic regression modeling was performed to examine the association of SES measures with ICH scores adjusted for age. Among 1444 men, 7% attained 5 to 6 ICH metrics. Annual income <$20 000 was associated with a 56% lower odds of attaining 3 to 4 versus 0 to 2 ICH components compared with ≥$75 000 (P=0.016). Medicare and no insurance were associated with a 39% and 35% lower odds of 3 to 4 versus 0 to 2 ICH components, respectively, compared with private insurance (all P<0.05). Education and employment status were not associated with higher attainment of ICH in Black men.
Conclusions
Among community‐dwelling Black men, higher attainment of measures of SES showed mixed associations with greater attainment of ICH. The lack of association of higher levels of educational attainment and employment status with ICH suggests that in order to address the long–standing health inequities that affect Black men, strategies to increase attainment of cardiovascular health may need to address additional components beyond SES.
Keywords: Black Americans, cardiovascular health, education, health equity, income, socioeconomic status
Subject Categories: Health Equity, Race and Ethnicity, Cardiovascular Disease
Nonstandard Abbreviations and Acronyms
- AAMWA
African American Male Wellness Agency
- AAMWW
African American Male Wellness Walk
- AHA
American Heart Association
- ICH
ideal cardiovascular health
- NHW
non‐Hispanic White
- SDOH
social determinants of health
Clinical Perspective
What Is New?
In community‐dwelling Black men, only 7% had ideal cardiovascular health (ICH) scores in the highest category (5–6).
Having lower compared with higher income (<$20 000 versus ≥$75 000), and no health insurance and Medicare insurance status compared with private insurance, were associated with lower odds of attainment of 3 to 4 versus 0 to 2 ICH metrics.
Educational attainment and employment status were not associated with attainment of ICH metrics; collectively, these findings suggest mixed associations of traditional measures of socioeconomic status with cardiovascular disease risk factors in Black men.
What Are the Clinical Implications?
It is critical to develop strategies to improve cardiovascular health in Black men because of the low attainment of ICH.
Successful approaches to improve attainment of ICH may incorporate socioeconomic status and factors beyond socioeconomic status to improve attainment of ICH in Black men.
Racial and ethnic minorities in the United States have a higher prevalence of chronic diseases compared with non‐Hispanic White populations (NHWs). 1 Black individuals particularly have an excess burden of cardiovascular disease (CVD) and the shortest overall life expectancy compared with NHWs and Latinx populations. 2 , 3 One component of the excess burden of CVD in Black persons is poor levels of modifiable cardiovascular risk factors. 1 In an effort to reduce the prevalence of CVD in the United States, the medical and public health communities have made advancements in the identification and treatment of CVD risk factors including blood pressure, glucose, cholesterol, smoking, and weight. Despite these advancements, a significant burden of CVD risk factors remain elevated in Black populations. 1 For example, the incidence of diabetes in Black persons has not decreased over the past several decades, compared with observed declines in NHWs. 4 , 5 Black people have the highest rates of obesity among any racial/ethnic group. 6 The prevalence of hypertension in Black people is the highest in the world at >50%, and Black people achieve blood pressure control less often than NHWs. 1 , 7 Hypertension is attributed to 40.6% of CVD mortality, and differences in blood pressure control among Black people are a leading cause of the Black–White CVD disparity. 8 Black men have the highest rates of hypertension‐related CVD, ischemic heart disease, heart failure, and cerebrovascular disease in the United States. 9 Black men have the additional burden of the highest rates of out‐of‐hospital and in‐hospital cardiac death with persistent disparities and meager longitudinal declines compared with other race and sex groups. 9 , 10 Thus, approaches to improve cardiovascular health in Black men are urgently needed.
In 2010, the American Heart Association (AHA) released its 2020 Impact Goals in which they defined the concept of Life’s Simple 7, also known as ideal cardiovascular health (ICH), to address cardiovascular health at the population level. 11 The aim of the impact goals was to improve the cardiovascular health of all Americans by giving targets for modifiable health behaviors and CVD risk factors. The targets can be used in health behavior and health promotion interventions to encourage individuals to reduce blood glucose, control cholesterol, manage blood pressure, stop smoking, get physically active, eat healthfully, and lose weight. Since the inception of Life’s Simple 7, numerous studies have shown an association between attainment of better levels of Life’s Simple 7 with lower risk of diabetes, heart disease, cancer, heart failure, and cognitive impairment across racial/ethnic groups. 12 , 13 , 14 , 15
Socioeconomic status (SES) is known to influence both CVD risk factors and CVD. Studies have noted that SES may play a significant role in health outcomes and racial health disparities. 16 , 17 Global inequities exist between SES and CVD. 18 In the United States, Min et al identified an inverse relationship between socioeconomic gradient and CVD burden in the Jackson Heart Study cohort, with lower levels of education and income being associated with an increased prevalence of hypertension, myocardial infarction, and stroke. 2 Likewise, nonmanagement and nonprofessional jobs were also associated with a higher prevalence of CVD. 2 The extant literature also demonstrates an association between low SES and an increased risk of CVD risk factors. 19 , 20 Clark et al noted that in high‐income countries, individuals from a low SES background are more likely to have worse levels of modifiable and behavioral risk factors for CVD, as compared with high SES individuals. 19 Studies have shown an association between higher SES (education, income, and insurance status) and greater attainment of healthy levels of cardiovascular risk factors in majority populations. 21 , 22 , 23 , 24 In the Jackson Heart Study, higher levels of income and education were independently associated with better cardiovascular health, but sex‐specific findings were not evaluated. 25 While the impact of SES on health outcomes relative to CVD and its affiliated risk factors has been studied in broad populations, there remains a lack of data specifically in Black men, the US group with the highest rates of cardiovascular mortality. 7 Given the paucity of data on the impact of SES on ICH in Black men, we evaluated the association of health insurance status, educational attainment, annual income, and employment status with attainment of ICH in Black men in African American Male Wellness Walks (AAMWWs) from 2017 to 2019. We hypothesized that higher levels of SES would be associated with higher attainment of ICH in Black men.
Methods
Study Design and Study Population
The National African American Male Wellness Agency (AAMWA), established in Columbus, Ohio in 2004, aims to reduce disparities in premature death and chronic diseases among Black men through AAMWWs and annual health events. The AAMWA has expanded to other cities in Ohio and across the nation (eg, New Orleans, LA; Washington DC; Atlanta, GA; Silver Spring, MD; Renton, WA; Niagara Falls, NY; and Charlotte, NC). The AAMWWs (5k walks) host free health screenings for Black men, along with community partners. The events are promoted in the community through various methods (ie, mass and social media). Since its inception, the AAMWW mantra has been: “Know Your Numbers.” The AAMWA encouraged Black men to be more active in self‐management of their health through evaluations of blood pressure, glucose, cholesterol, body mass index (BMI), smoking, and physical activity. It has grown to average >50 000 participants annually. In 2016, the AAMWA and researchers at The Ohio State University formed a collaborative academic and community partnership, to move from health promotion awareness to reducing chronic diseases among Black men. In the academic–community partnership, The Ohio State University faculty members collaborate with the AAMWA to enhance quality improvement and catalyze community engagement. The partnership has led to a number of community engagement initiatives, including a community care kit distribution in the wake of the COVID‐19 pandemic and an ongoing community‐based lifestyle intervention with Black men. 26
The AAMWA has grown across the nation to average >50 000 participants of diverse ages, sexes, and races/ethnicities. The walks in different regions around the country vary in terms of the size, with the largest of the walks currently in Columbus, Ohio averaging 20 000 to 30 000 participants. The other cities include 5 other Ohio cities: Akron, Cincinnati, Cleveland, Toledo, and Youngstown, and 5 cities nationally including New Orleans, LA; Washington, DC; Niagara Falls, NY; Charlotte, NC; and Renton, WA. Black men may choose to have screenings performed at the walks and approximately 300 to 1100 Black men complete screenings at the various walks annually. In the 2017 to 2019 AAMWWs, 1905 individuals participated in the screenings. The participants who were excluded were <18 years of age (n=59), female or did not answer the question related to sex (n=78), non‐Black persons or missing data on race/ethnicity (n=84), or missing any ICH metric (n=240), as shown in Figure. After exclusions, 1444 participants were included in the analytic cohort. A majority of the participants included in the analytic cohort attended AAMWWs in 6 cities across Ohio (n=1234; 85.5%), with 9.6% (n=139) attending a walk in Charlotte, NC. The remaining participants attended walks in Washington, DC or Renton, WA (Table S1). This project used existing data collected for nonresearch purposes from participants in the AAMWW, with no identifiers linking human participants to the data. The project was approved for exempt status by The Ohio State University Biomedical Sciences Institutional Review Board. Because of the sensitive nature of the data collected for this study, requests to access the data set from qualified researchers trained in human subject confidentiality protocols may be sent to AAMWA at dgregory@ausohio.com.
Figure 1. In the 2017 to 2019 African American Male Wellness Walks, 1905 individuals participated in the screenings.
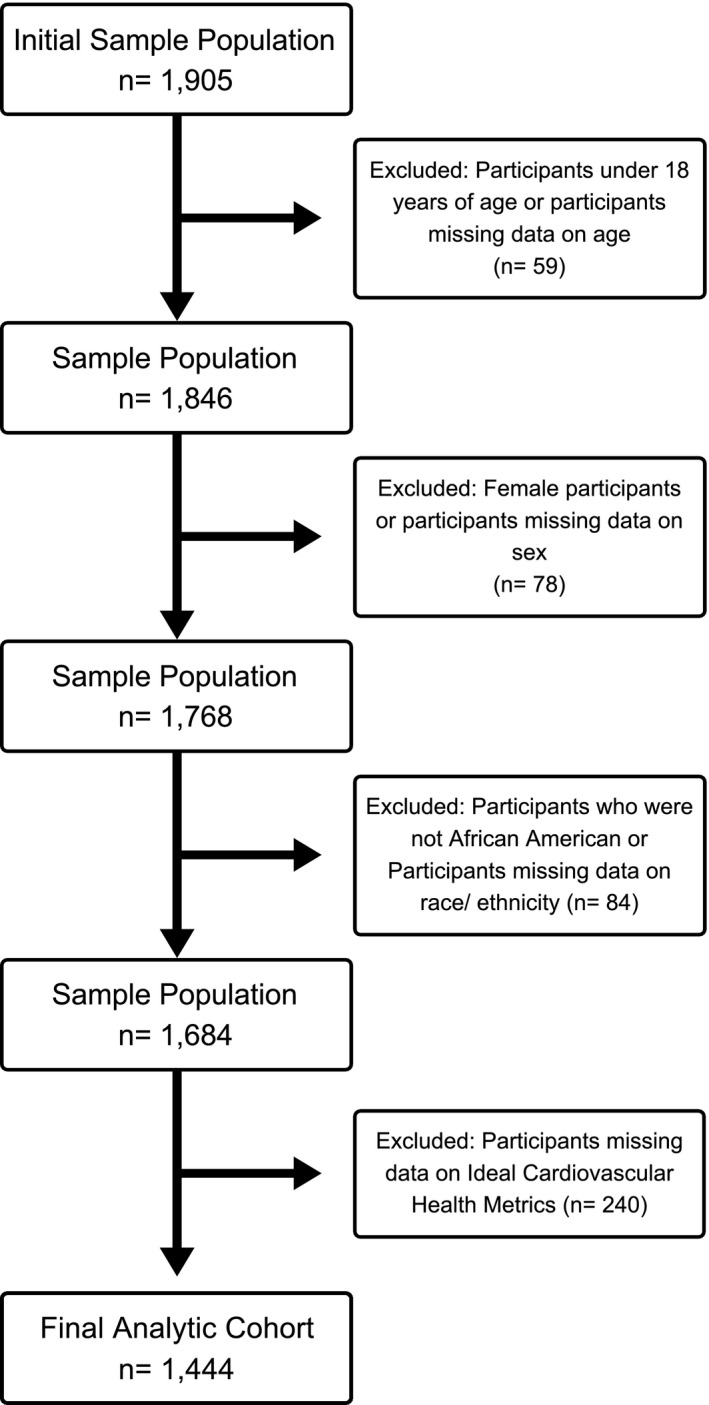
The participants excluded were <18 years of age (n=59), female or did not answer the question related to sex (n=78), non–Black or missing data on race/ethnicity (n=84), or missing any ideal cardiovascular health metric (n=240). After exclusions, 1444 participants were included in the analytic cohort.
During the AAMWW, a standardized questionnaire was used to collect information on demographics (age, sex [male/female], race/ethnicity [Black/AA, Asian, Caucasian/White, Native American, Hispanic, Other]), smoking status (Do you smoke? Yes/No), insurance status (Private Insurance, Medicaid, Medicare, No Insurance), chronic diseases (high blood pressure/hypertension, high cholesterol/hypercholesterolemia and diabetes, medications used for the chronic diseases [Yes/No], family history of diabetes [Yes/No], level of physical activity [I exercise 3 or more times per week, Yes/No]). Blood glucose and cholesterol were measured using the Cardio Check Silver (Polymer Technology, Inc., Heath, OH). Blood pressure was measured using Lifesource Automatic Blood Pressure Monitors (Lifesource Medical, Inc., Greensboro, NC). Weight was measured using various zeroed scales and height was self‐reported. BMI was calculated by multiplying weight (lb) by 703, and then dividing by height squared (in2). During the health screenings, cardiovascular health was measured using 6 of the AHA’s ICH metrics, which includes targets for blood pressure, cholesterol, glucose, BMI, smoking, and physical activity.
Exposures
Income
Income was categorized as <$10 000, $10 000 to $19 999, $20 000 to $29 999, $30 000 to $39 999, $40 000 to $49 999, $50 000 to $74 999, $75 000 to $99 999, $100 000 or more, or Rather Not Say. For the analysis, income was aggregated to <$20 000, $20 000 to $49 999, $50 000 to $74 999, and ≥$75 000 consistent with previous analyses. 25
Education
Education was queried using the question, “What is the highest level of education completed?” grammar school, high school or equivalent, vocational/technical school, some college, college graduate (4 year), Master’s degree, Doctoral Degree (PhD), Professional Degree (MD, JD, etc.) or other. Education was aggregated for analysis to (1) High School or Less; (2) Some College; (3) Completed College; (4) Professional Degree—Doctoral/Master’s/MD, JD, etc., (5) Other—Vocational/Technical School; or (6) Did Not Answer.
Health Insurance
Uninsured, Medicaid, Medicare, private insurance, combination of insurances, and did not answer were the categories. Combination of insurances was defined as having Medicare and private insurance.
Employment Status
Participants were asked if they were employed, unemployed, student, or retired.
Main Outcome: ICH Score
A composite ICH score was defined by the presence of ideal levels of the 6 metrics: untreated blood pressure <120/80 mm Hg, untreated cholesterol <200 mg/dL, untreated fasting glucose <100 mg/dL or an untreated random glucose <140 mg/dL, BMI <25 kg/m2, nonsmoking status, and/or physical activity 3 times or more per week. The score was categorized as 0 to 2, 3 to 4, and 5 to 6, as has been performed previously. 27 , 28 , 29
Covariates
The covariate in the analyses was age.
Statistical Analysis
Descriptive statistics were used to compare the baseline characteristics of included participants using appropriate parametric tests for continuous variables (ANOVA, t tests) and the χ2 or Fisher exact tests for categorical variables. Multinomial logistic regression was used to examine the cross‐sectional association of education, employment status, annual income, and health insurance with ICH score. Each of these analyses were performed separately utilizing the total analytical cohort (n=1444). The total analytic cohort included any Black male participant in the AAMWWs who was not missing any data metric for ICH and had data for at least 1 of the SES variables (educational attainment, employment status, annual income, and health insurance status). Odds ratios were estimated for exposures and the outcomes interpreted as odds of an ICH score of 5 to 6 or 3 to 4 compared with 0 to 2 in age‐adjusted models. Adjustment for location was not significant in the models and was not included in the final analytic models. Type III analyses were performed to determine the effect of the SES measures on ICH score when these measures were included separately in the age‐adjusted models. Sensitivity analyses were performed to determine the robustness of the main findings including (1) baseline characteristics of participants by location, individual SES measures, missingness of SES characteristics, and a complete case cohort (n=588) were analyzed in (Tables S1 through S7); (2) age‐adjusted multinomial logistic regression models were performed by location, among participants with data on all 4 SES variables (n=588) and excluding participants missing data for each specific SES variable only in Tables S8 through S10. In addition, age‐adjusted multinomial logistic regression models with all the SES measures together in the models were performed to compare ICH score of 5 to 6 or 3 to 4 to 0 to 2 for the final cohort and the complete case cohort in Tables S11 and S13, respectively. Type III analyses were performed to determine the effect of the SES measures on ICH score when these measures are included all together (Table S12), in the age‐adjusted models. All analyses were performed using SAS version 9.4 software (SAS Institute Inc., Cary, NC). Statistical significance was defined as a 2‐sided P value <0.05.
Results
Characteristics of the Analytic Cohort
The characteristics of the cohort overall and stratified by ICH score in categories 0 to 2, 3 to 4, and 5 to 6 are presented in Table 1. Among the 1444 participants in the final analytic cohort, the mean age of participants was 48 years. The percentage of cohort with scores of 0 to 2, 3 to 4, and 5 to 6 were 28%, 64%, and 7%, respectively. Overall, 60% of participants had private insurance, 48% had completed a college or professional degree, and 50% were employed. Only 4% of participants had an income <$20 000. Additionally, 20%, 20%, and 19% of participants had incomes in the $20 000 to $49 999, $50 000 to $74 999, and ≥$75 000 ranges, respectively. Differences existed across ICH score levels with highest prevalence of private insurance in the ICH 3 to 4 group and the highest incomes in the ICH 3 to 4 groups (all P<0.05). There was no difference by educational status across ICH score categories (P=0.3411). Blood pressure, cholesterol, and glucose were lower across increasing ICH score categories (all P<0.0001). Characteristics of the cohort by location, SES measures, missingness of SES characteristics, and a complete case cohort are summarized in Tables S1 through S7.
Table 1.
Characteristics of Participants in the African American Male Wellness Walk by Ideal Cardiovascular Health Score, 2017 to 2019
| Baseline characteristics* | All | 0 to 2 ideal cardiovascular health score | 3 to 4 ideal cardiovascular health score | 5 to 6 ideal cardiovascular health score | P value |
|---|---|---|---|---|---|
| n=1444 | n=411 | n=926 | n=107 | ||
| Age, y | 48 (14) | 52 (13) | 48 (14) | 41 (16) | <0.0001 |
| Insurance status, % † | <0.0001 | ||||
| Uninsured | 9 | 10 | 8 | 14 | |
| Medicaid | 7 | 7 | 6 | 12 | |
| Medicare | 13 | 17.5 | 11 | 15 | |
| Private insurance | 60 | 53 | 64 | 50 | |
| Combination | 2 | 4 | 2 | 0 | |
| Did not answer | 9 | 8.5 | 9 | 9 | |
| Education, % ‡ | 0.3411 | ||||
| High school or less | 23 | 23 | 22 | 22 | |
| Some college | 19 | 22 | 18 | 17 | |
| Completed college | 33 | 29 | 35 | 36 | |
| Professional degree | 15 | 15 | 15 | 17 | |
| Other | 4 | 5 | 4 | 1 | |
| Did not answer | 6 | 6 | 6 | 7 | |
| Occupation, % § | <0.0001 | ||||
| Student | 3 | 3 | 2 | 10 | |
| Unemployed | 4 | 5 | 4 | 6 | |
| Employed | 50 | 46 | 51.5 | 51 | |
| Retired | 12 | 17 | 9.5 | 8 | |
| Did not answer | 31 | 29 | 33 | 25 | |
| Income, % || | 0.0005 | ||||
| ≥$75 000 | 19 | 18 | 20 | 16 | |
| $50 000 to $74 999 | 20 | 19 | 23 | 7.5 | |
| $20 000 to $49 999 | 20 | 20 | 19 | 29 | |
| <$20 000 | 4 | 5 | 2 | 7.5 | |
| Did not answer | 37 | 38 | 36 | 40 | |
| Systolic blood pressure, mm Hg | 140 (19) | 145 (19) | 140 (18) | 121 (18) | <0.0001 |
| Diastolic blood pressure, mm Hg | 87 (13) | 91 (12) | 87 (13) | 76 (11) | <0.0001 |
| Blood glucose: fasting, mg/dL | 105 (43) | 123 (49) | 95 (35) | 82 (16) | <0.0001 |
| Blood glucose: nonfasting, mg/dL | 111 (42) | 143 (61) | 103 (28) | 92 (21) | <0.0001 |
| Cholesterol | 159 (41) | 167 (49) | 157 (38) | 146 (31) | <0.0001 |
| Body mass index, kg/m2 | 30 (6) | 32 (6) | 30 (6) | 24 (4) | <0.0001 |
| Blood pressure medication, % | 27 | 43 | 22 | 4 | <0.0001 |
| Diabetes medication, % | 9 | 25 | 4 | 0 | <0.0001 |
| Cholesterol medication, % | 13 | 33 | 6 | 0 | <0.0001 |
| Fasting status, % | 41 | 52 | 37 | 30 | <0.0001 |
| Ideal AHA smoking, % # | 85 | 72 | 90 | 93 | <0.0001 |
| Ideal AHA physical activity, % # | 60 | 31 | 69 | 95 | <0.0001 |
| Ideal AHA blood pressure, % # | 8 | 1 | 6 | 51 | <0.0001 |
| Ideal AHA glucose, % # | 67 | 25 | 83 | 97 | <0.0001 |
| Ideal AHA body mass index, % # | 16 | 3 | 14 | 79 | <0.0001 |
| Ideal AHA cholesterol, % # | 73 | 42 | 84 | 99 | <0.0001 |
AHA indicates American Heart Association.
Mean (SD) or percentages are listed, P values calculated using χ2 or Fisher exact (categorical variables), and ANOVA (parametric continuous variables).
Health Insurance: No insurance n=134, Medicaid n=100, Medicare n=186, private insurance n=869, combination n=30, did not answer n=125.
Education: High school or less n=324, some college n=272, completed college n=482, professional degree n=220, other n=57, did not answer n=89.
Occupation: Employed n=719, unemployed n=63, student n=44, retired n=168, did not answer n=450.
Income: ≥$75 000 n=274, $50 000 to $74 999 n=294, $20 000 to $49 999 n=292, <$20 000 n=52, did not answer n=532.
AHA ideal cardiovascular health recommendations were defined by AHA 2020 guidelines with the following modifications. Physical activity was considered ideal if participant exercised ≥3 times per week. Glucose was defined using standard fasting glucose guidelines and random glucose guidelines <140 ideal, 140 to 180 intermediate, and ≥180 “poor.”
Association of Annual Income With ICH Score
The association of annual income with ICH categories is presented in Table 2. Annual income <$20 000 compared with ≥$75 000 was associated with 56% lower odds of attaining 3 to 4 versus 0 to 2 ICH components (P=0.016). No categories of income were associated with higher attainment of 5 to 6 versus 0 to 2 ICH metrics, as compared with ≥$75 000 (all P>0.05).
Table 2.
Association of Educational Attainment, Employment Status, Health Insurance Status, and Annual Income with ICH (n=1444)*
| Multinomial logistic regression | 5 to 6 vs 0 to 2 ICH components, odds ratio (95% CI), P value | 3 to 4 vs 0 to 2 ICH components, odds ratio (95% CI), P value |
|---|---|---|
| Educational attainment† | ||
| High school or less | Referent | Referent |
| Some college | 0.88 (0.44, 1.76), P=0.723 | 0.87 (0.61, 1.24), P=0.444 |
| Completed college | 1.33 (0.74, 2.40), P=0.342 | 1.27 (0.92, 1.76), P=0.151 |
| Professional degree | 1.31 (0.65, 2.66), P=0.454 | 1.11 (0.75, 1.65), P=0.592 |
| Other | 0.22 (0.03, 1.76), P=0.154 | 0.82 (0.45, 1.49), P=0.509 |
| Did not answer | 1.31 (0.65, 2.66), P=0.587 | 1.06 (0.63, 1.80), P=0.823 |
| Employment status‡ | ||
| Employed | Referent | Referent |
| Unemployed | 1.14 (0.43, 2.04), P=0.791 | 0.72 (0.41, 1.28), P=0.263 |
| Student | 1.84 (0.74, 4.58), P=0.188 | 0.54 (0.26, 1.11), P=0.095 |
| Retired | 1.52 (0.64, 3.59), P=0.343 | 0.73 (0.49, 1.09), P=0.119 |
| Did not answer | 0.91 (0.54, 1.53), P=0.712 | 1.08 (0.82, 1.42), P=0.585 |
| Health insurance status§ | ||
| Private insurance | Referent | Referent |
| Medicaid | 1.68 (0.80, 3.51), P=0.172 | 0.73 (0.45, 1.17), P=0.189 |
| Medicare | 1.46 (0.76, 2.78), P=0.254 | 0.61 (0.42, 0.87), P=0.006 |
| No insurance | 1.23 (0.62, 2.42), P=0.553 | 0.65 (0.43, 0.99), P=0.042 |
| Combination | N/A | 0.62 (0.29, 1.32), P=0.215 |
| Did not answer | 1.15 (0.53, 2.49), P=0.728 | 0.84 (0.54, 1.28), P=0.409 |
| Annual income|| | ||
| ≥$75 000 | Referent | Referent |
| $50 000 to $74 999 | 0.41 (0.17, 1.02), P=0.055 | 1.08 (0.74, 1.57), P=0.705 |
| $20 000 to $49 999 | 1.32 (0.67, 2.62), P=0.422 | 0.83 (0.57, 1.21), P=0.326 |
| <$20 000 | 1.30 (0.47, 3.63), P=0.613 | 0.44 (0.23, 0.86), P=0.016 |
| Did not answer | 1.10 (0.58, 2.08), P=0.771 | 0.86 (0.62, 1.20), P=0.385 |
Model: Adjusted for age.
ICH indicates ideal cardiovascular health.
*The outcome (ICH score) included blood pressure, glucose, cholesterol, body mass index, smoking, physical activity.
†Education: High school or less n=324, some college n=272, completed college n=482, professional degree n=220, other n=57, did not answer n=89.
Example Interpretation: Completing college compared with high school education or less was associated with 33% higher odds of attaining 5 to 6 ideal metrics compared 0 with 2, which was nonsignificant with a P value of 0.342.
‡Employment status: Employed n=719, Unemployed n=63, Student n=44, Retired n=168, Missing/Did Not Answer n=450.
Example Interpretation: Student status compared with employed status was associated with 84% higher odds of attaining 5 to 6 ideal metrics compared with 0 to 2, which was nonsignificant with a P value of 0.188.
Student status compared with employed status was associated with 46% lower odds of attaining 3 to 4 ideal metrics compared with 0 to 2, which was nonsignificant with a P value of 0.095.
§Health Insurance Status: No insurance n=134, Medicaid n=100, Medicare n=186, private insurance n=869, combination n=30, did not answer n=125.
Example Interpretation: Medicaid compared with private insurance was associated with 68% higher odds of attaining 5 to 6 ideal metrics compared with 0 to 2, which was nonsignificant with a P value of 0.172.
Medicare compared with private insurance was associated with 39% lower odds of attaining 3 to 4 ideal metrics compared with 0 to 2, which was significant with a P value of 0.006.
||Annual Income: ≥$75 000 n=274, $50 000 to $74 999 n=294, $20 000 to $49 999 n=292, <$20 000 n=52, did not answer n=532.
Example Interpretation: Annual income $50 000 to $74 999 compared with ≥$75 000 was associated with 59% lower odds of attaining 5 to 6 ideal metrics compared with 0 to 2, which was nonsignificant with a P value of 0.055.
Annual income <$20 000 compared with ≥$75 000 was associated with 56% lower odds of attaining 3 to 4 ideal metrics compared with 0 to 2, which was significant with a P value of 0.016.
Association of Health Insurance Status With ICH Score
The association of health insurance with ICH categories is presented in Table 2. In age‐adjusted models, Medicare, compared with private insurance, was associated with 39% lower odds of attaining 3 to 4 versus 0 to 2 ICH components (P=0.006). No insurance, compared with private insurance, was associated with 35% lower odds of attaining 3 to 4 versus 0 to 2 ICH components (P=0.042). Health insurance status was not associated with odds of 5 to 6 versus 0 to 2 ICH components (P>0.05).
Association of Educational Attainment and Employment Status With ICH Score
The association of educational attainment and employment status with ICH is presented in Table 2. There was no association of categories of higher levels of education, including some college, completed college, and professional degrees, compared with high school education or less, with odds of 5 to 6 or 3 to 4 versus 0 to 2 ICH metrics. Similarly, there was no association of employment status with attainment of ICH (5 to 6 or 3 to 4 versus 0 to 2 metrics, all P>0.05).
Overall Effect of SES Measures on ICH Score
For the age‐adjusted models, the Type III analysis showed that there was no significant overall effect of educational attainment, employment status, health insurance status, or annual income on ICH scores (Table 3) when included separately in the model (all P>0.05).
Table 3.
Type III Analysis of the Effect of Educational Attainment, Employment Status, Health Insurance Status, and Annual Income on Ideal Cardiovascular Health
| Type III analysis of effect | |||
|---|---|---|---|
| Effect | Degrees of freedom | Wald χ2 | P value |
| Educational attainment | 5 | 6.9938 | 0.2211 |
| Employment status | 4 | 1.5746 | 0.8134 |
| Health insurance status | 5 | 2.2048 | 0.8201 |
| Annual income | 4 | 0.9966 | 0.9103 |
Model: Adjusted for age.
A P value >0.05 indicates that the corresponding socioeconomic status measure has no effect on ideal cardiovascular health in the model.
Association of Location and Varying Cohort Exclusions With ICH Score
The AAMWA walk location was not associated with ICH attainment (Table S8). Complete case analyses are shown in Table S9. Among 588 individuals, education status of completed college versus high school was associated with higher odds of 3 to 4 versus 0 to 2 (OR, 1.78 [95% CI, 1.08, 2.93]) ICH measures. Employment status of retired versus employed was associated with higher odds of 5 to 6 versus 0 to 2 (OR, 4.02 [95% CI, 1.05, 15.39]) and unemployed versus employed was associated with lower odds of 3 to 4 versus 0 to 2 (OR, 0.38 [95% CI, 0.17, 0.86]) ICH measures. Insurance status of Medicare versus private insurance was associated with higher odds of 5 to 6 versus 0 to 2 (OR, 3.04 [95% CI, 1.16, 7.99]) and no insurance versus private insurance was associated with lower odds of 3 to 4 versus 0 to 2 (OR, 0.50 [95% CI, 0.26, 0.95]) ICH measures. Annual income $50 000 to $74 999 compared with ≥$75 000 was associated with lower odds of 5 to 6 versus 0 to 2 (OR, 0.26 [95% CI, 0.08, 0.90]) and <$20 000 versus ≥$75 000 was associated with lower odds of 3 to 4 versus 0 to 2 (OR, 0.37 [95% CI, 0.18, 0.78]) ICH measures. The analyses excluding individuals who were missing data by category of SES were similar to the full sample analyses (Table S10).
For SES measures together with age in the model, Medicare, compared with private insurance, was associated with 33% lower odds of attaining 3 to 4 versus 0 to 2 ICH measures (P=0.039) in the full sample analyses. No SES measure was associated with odds of 5 to 6 versus 0 to 2 ICH measures (all P>0.05) (Table S11). In the corresponding Type III analysis, each SES measure was found to have no significant overall effect on ICH scores given the other SES measures in the age‐adjusted model (all P>0.05) (Table S12).
In the complete case analyses, education status of completed college versus high school or less was associated with higher odds of 5 to 6 versus 0 to 2 (OR, 3.97 [95% CI, 1.23, 12.76]) ICH measures. Also, professional degree versus high school education or less was associated with higher odds of 5 to 6 versus 0 to 2 (OR, 5.08 [95% CI, 1.23, 21.03]) ICH measures (Table S13).
Discussion
In this study of community‐dwelling Black men, lower compared with higher income (<$20 000 versus ≥$75 000), and no health insurance and Medicare insurance status compared with private insurance, were associated with lower odds of attainment of 3 to 4 versus 0 to 2 ICH metrics. Educational attainment and employment status were not associated with attainment of ICH metrics. Collectively, these findings suggest mixed associations of traditional measures of SES with cardiovascular disease risk factors in Black men. Furthermore, our study demonstrates that factors outside of one’s health and the health care system can have a profound impact on health behaviors and health outcomes in Black men. 30
Annual Income and ICH
Studies have highlighted that increased access to financial capital may be associated with a healthier lifestyle, better health outcomes, and increased access to care. 31 , 32 In the United States, a 40‐year‐old man in the highest 1% of income has a life expectancy that is 14.6 years longer than a man of equivalent age in the lowest 1% of income. 33 Having a higher income may allow individuals to afford healthier food and engage in physical activity more frequently than those with lower incomes. 25 Correspondingly, income may be a key driver of health for many Americans. In Black men and women combined, higher levels of income were associated with higher AHA ICH metrics in the Jackson Heart Study. 25 Similarly, Chetty et al showed that higher income was associated with prolonged life in large US race‐adjusted analysis. 33 However, the Gompertz Parameter Estimates for intercepts and slopes at age 40 years appeared to be different for Black men with high income (quartile 4) compared with NHW men, suggesting there may be some variance by race. 33 The findings of the association between annual income and ICH in Black men presented here with the lowest income category having a lower odds of 3 to 4 versus 0 to 2 ICH metrics compared with the highest income category is consistent with the literature that higher income is associated with attainment of better cardiovascular health. Notably, we did not see differences across categories from $20 000–$49 999 to $50 000–$74 999 compared with ≥$75 000. These findings may be partially explained by historical disparities in access to generational wealth and social capital between different races/ethnicities. There exists a longstanding history of societal inequities in which Black communities were not afforded equal opportunities to build wealth and social capital. Thus, contemporarily, there exists a Black–White wealth gap. In particular, a study of the median wealth for Black and White households from 1989 to 2019 demonstrated that in 2019, White households had a median wealth that was 7.8 times that of Black households ($188 200 for White households versus $24 100 for Black households). 34 The lack of generational wealth may explain why Black men do not achieve better health outcomes across all levels of income. Research studies and public policy should seek to create reformations that impact the deeply rooted historical inequities and not merely just the modern‐day manifestations of those inequities. Furthermore, more data are needed addressing income with ICH in Black men.
Health Insurance and ICH
Health insurance is often regarded as a means to attenuate health inequities in the US health care system. Thus, it is important to understand how insurance status may influence cardiovascular risk factors. A study by McClurkin et al demonstrated that lack of health insurance may be a barrier to attaining ICH for US adults. 24 Likewise, a study conducted by Brooks et al suggested that treatment and control of cardiovascular risk factors are poor among uninsured individuals, which may yield poorer health, as compared with insured individuals. 35 The findings of this analysis are consistent with the extant literature as compared with participants with private insurance. Black male participants with no insurance and Medicare had lower attainment of higher levels of ICH. These findings emphasize the importance of affordable, high‐quality health insurance in Black men. 36 There is a concern that health insurance as a proxy for access to health care may not be true for Black men. 36 As a whole, Black men are less likely to access and engage in health care compared with NHW men and all groups of women. 36 Additionally, Black individuals are more likely to experience discrimination in health care settings, 36 which may impact Black men to a greater extent than Black women. 37 The Tuskegee Study of Untreated Syphilis and other harmful medical practices that adversely impacted Black populations may still have modern‐day implications in the propagation of racial differences in mistrust of the medical system. 38 , 39 In part, this may explain why Black individuals are less likely to utilize primary care, yet more likely to use emergency departments. 40 Thus, there was a concern that health insurance as a proxy for access to care may not accurately contextualize the relationship between SES and cardiovascular health in Black men, but the results show that health insurance may be a reliable proxy for the relation of SES with cardiovascular health in Black men. In regard to the Medicare group having lower odds of ICH than the private group, further research is needed to understand the underlying reasons. This may be because of residual confounding based on age, because we know cardiovascular health decreases over the life course. Individuals on Medicare are generally older, but it is important to note that >31% of AAs in Medicare are <65 years of age. 41 The lack of association of Medicaid with lower levels of ICH was surprising, but while there are income requirements that would normally suggest that individuals would have lower ICH, there are many positive aspects to Medicaid including prescription drug coverage without a co‐pay that may influence relationships with ICH.
Educational Attainment and ICH
Higher education has generally been characterized as a means to promote health equity through its association with healthier, longer lives. 42 , 43 In broad populations, education is one of the strongest predictors of good health. 44 Previous studies in various racial/ethnic groups have found significant associations of education with cardiovascular risk factors, including AHA ICH metrics. In Europe, higher education levels (college and university education) were associated with more ideal levels of cardiovascular health as compared with those with low (no schooling, incomplete primary education, and primary education) or medium (3 or 4 years of secondary education) educational levels. 21 In a study of NHW, Asian, and LatinX populations in California, attainment of education was associated with higher levels of ICH, except for Asian participants. 45 In an analysis of National Health and Nutrition Examination Survey, including Black, NHW, and Mexican American women, education was associated with improved cardiovascular risk factors—BMI, blood pressure, cholesterol, diabetes status, leisure time physical activity, and current cigarette smoking—among Black women. 46 Accordingly, in the Jackson Heart Study, higher levels of education were associated with higher AHA ICH metrics in Black men and women. 25 The Jackson Heart Study findings were not disaggregated by sex to evaluate the association specifically in men, which is important because two thirds of the Jackson Heart Study participants are women. 25 Concordant with the current findings, in Chinese adults, higher SES, measured as education and income, was associated with higher attainment of Life’s Simple 7 in women, but not in men. 22 The current study extends the literature with the novel finding that education may not be associated with attainment of the AHA’s ICH metrics in Black men. 22 Further studies are needed to confirm this association and evaluate mechanisms for the potential discordance with other sex and race populations.
Employment Status and ICH
The findings of this study suggest that there may be no association between employment status with ICH in Black men, but it was not designed to capture differences across types of occupation, which may exist. Considering occupation, MacDonald et al conducted a cross‐sectional study of 6282 employed Black and NHW middle‐aged men and women in the REGARDS (Reasons for Geographic and Racial Differences in Stroke) study. The study demonstrated that optimal cardiovascular health was significantly higher for managers, architects, and engineers and significantly lower for those employed in sales, office, and administrative support combined and all service occupations combined. 47 Parks‐Yancy et al noted that even when Black persons obtain high‐profile occupational positions, these positions are often not essential to organizations and thus, the inhabitant of that position is not truly a part of the organization’s power structure. 48 Larger studies assessing employment status and various occupational roles would be beneficial to advance the understanding of the impact on ICH.
Measures of SES and ICH
These findings collectively exemplify that the relationships between SES, social determinants of heath (SDOH), and ICH are likely complex in Black men, who also battle discrimination and mistrust of the medical system. Public policy regards SES and SDOH as important drivers of health outcomes. 49 SDOH are the underlying conditions in the environments in which people are born, live, learn, work, play, worship, and age that affect the livelihood, health care, and health outcomes of individuals. 50 , 51 , 52 Three of the major SDOH components are evaluated in the current analysis including economic stability (employment and income), education, and access to health care (health insurance). These components of SDOH had mixed impacts on the attainment of ICH in Black men. The findings of this study yield a greater question: Why may there be a lack of effect of some measures of SES on ICH among Black men? Previous studies have shown that among individuals with high SES, Black people still have poorer health. In the Cooper Center Longitudinal Study, among high SES executives in Dallas, TX, Black men and women had a higher proportion of cardiovascular risk factors compared with NHWs. 53 Recently, Colen et al demonstrated that among upwardly mobile young adults in a national sample, the gaps demonstrated in self‐rated health were largely because of differential exposure to discrimination. 54 For NHWs, moderate income gains over time resulted in significantly less exposure to both acute and chronic discrimination. 54 Upwardly mobile Black people, however, were significantly more likely to experience acute and chronic discrimination than their socioeconomically stable NHW counterparts. 54 Thus, allostatic load, the physiological wear and tear because of accumulated psychological stresses on the body, may link psychological stress with poorer physiological outcomes in higher SES Black men. 55 , 56 , 57 , 58 Allostatic load is a known contributor to the disparate health care status between races and in particular, the overall poor health status of Black people in the United States. 55 , 58 , 59 Thus, discrimination and systemic racism may be examples of other SDOH that influence CVD risk factors through their impact on allostatic load and cumulative stress in blunting the positive association of higher SES with improved cardiovascular risk factors. Further research to delineate these and other potential effect modifiers of the association of SES on CVD risk factors in Black men is crucial. The importance is illustrated by the findings of the Meharry‐Hopkins Cohort study of Black and White male physicians. 60 Even with similar SES and occupations, there was a higher degree of cardiovascular risk factors, including incident hypertension and diabetes, in the Black physicians. Furthermore, an earlier onset and higher rate of CVD was shown in the Black physicians compared with White physicians. 60 Thus, increasing SES alone may not be the complete panacea to improving cardiovascular health in Black men. Community‐engaged and community‐based multilevel co‐developed (academic‐community) approaches using a holistic approach addressing cardiovascular health, mental health, social needs, and patient–provider engagement are one potential strategy. 61
Strengths and Limitations
Strengths of our study include the following: (1) The inclusion of a large, socioeconomically diverse cohort of Black men; (2) Structured and consistent questionnaires over the 3‐year time period; (3) Clinical assessments were performed by trained medical staff; and (4) De‐identified data from community‐focused testing that allowed for a diverse sample of community‐dwelling Black men. In spite of these strengths, our study should be considered with the following limitations. First, commonly available blood pressure cuffs and scales were used to measure blood pressure and weight, which may have been noncalibrated in some instances. However, this limitation may have been a potential strength because of the real‐world applicability of the measurements. Second, we did not assess dietary intake as a cardiovascular health metric because of the lack of a brief validated measure to assess all the components of AHA ideal diet. However, based on previous studies, only 0% to 1.8% of Black individuals attain ideal dietary intake 12 , 62 , 63 ; thus, the ICH score may be minimally impacted. Third, our study assessed the frequency of physical activity, but not the duration or intensity via self‐report or objective measurement. Accordingly, the measure may underestimate the actual adherence to the original definition of the AHA physical activity goal that is based on minutes of physical activity per week. Fourth, the original intent of the AAMWW was programmatic rather than research focused. Therefore, we used a structured questionnaire that was not assessed for its psychometric properties. Fifth, while community‐based testing served as a strength with participants of varying sociodemographic backgrounds, it also poses a limitation in the fact that participants self‐selected to participate in the AAMWWs and may be healthier than national representative samples. The prevalence of hypertension (63%), diabetes (16%), and obesity (48%) indicate that the sample was relatively representative and actually slightly less healthy than US prevalence statistics in Black men for hypertension (42%), diabetes (12%), and obesity (38%), respectively. 1 Sixth, employment status was not disaggregated to decipher types of occupations, and this is a potential limitation because we were only able to assess employment status. For example, the employed category can denote anyone from a CEO to frontline staff. Thus, future studies should seek to analyze the effect of various occupations on cardiovascular health in Black men. Seventh, the number of individuals who had combined insurance types represented a small proportion of the overall analytic cohort. Specifically, 30 participants had Medicare and private insurance. Thus, we were unable to assess the association of combined insurance with ICH because of insufficient power in the multinomial logistic regression model. Lastly, the proportion of missing values for income and employment status, although consistent with other studies, may pose a limitation. Nonetheless, our study provides novel knowledge regarding the influence of SES on ICH in Black men.
Conclusions
The burden of CVD risk factors in Black men is a persistent disparity in the United States. In the current study, higher SES measures, including income and health insurance status, were associated with higher attainment of ICH among AA men, while no association existed for educational attainment and employment status. Additionally, <10% of men had 5 to 6 ICH metrics in the ideal range. Thus, it is critical to develop strategies to improve cardiovascular health in Black men because of the high burden of CVD. Successful approaches to improve attainment of ICH may need to focus on multilevel, community‐engaged interventions that include SES and factors beyond SES to improve attainment of ICH status in Black men. 64 Potential avenues for future investigation include examining the impact of other SDOH, patient–physician engagement, and discrimination in attainment of ICH in Black men.
Sources of Funding
Preparation of this article was supported by The Robert Wood Johnson Foundation (Harold Amos Medical Faculty Development Program ID# 76236, JJJ) and the NIH National Institute of Diabetes and Digestive and Kidney Diseases (K23DK117041, JJJ). RA was supported through a The Ohio State University College of Medicine MD Student Research Scholarship and funding from the Columbus Chapter of Charms Inc. The funders had no role in study design, data collection and analysis, decision to publish, or preparation of the article.
Disclosures
None.
Supporting information
Tables S1–S13
Acknowledgments
The authors wish to thank the staff and participants of the AAMWW.
Supplementary Material for this article is available at https://www.ahajournals.org/doi/suppl/10.1161/JAHA.120.020184.
For Sources of Funding and Disclosures, see page 11.
References
- 1. Carnethon MR, Pu J, Howard G, Albert MA, Anderson CAM, Bertoni AG, Mujahid MS, Palaniappan L, Taylor HA, Willis M, et al. Cardiovascular health in African Americans: a scientific statement from the American Heart Association. Circulation. 2017;136:e393–e423. doi: 10.1161/CIR.0000000000000534 [DOI] [PubMed] [Google Scholar]
- 2. Min Y, Anugu P, Butler KR, Hartley TA, Mwasongwe S, Norwood AF, Sims M, Wang W, Winters KP, Correa A. Cardiovascular disease burden and socioeconomic correlates: findings from the Jackson Heart Study. J Am Heart Assoc. 2017;6:e004416. doi: 10.1161/JAHA.116.004416 [DOI] [PMC free article] [PubMed] [Google Scholar]
- 3. Arias E, Xu J. United States life tables, 2017. Natl Vital Stat Rep. 2019;68:66. [PubMed] [Google Scholar]
- 4. Geiss LS, Wang J, Cheng YJ, Thompson TJ, Barker L, Li Y, Albright AL, Gregg EW. Prevalence and incidence trends for diagnosed diabetes among adults aged 20 to 79 years, United States, 1980–2012. JAMA. 2014;312:1218. doi: 10.1001/jama.2014.11494 [DOI] [PubMed] [Google Scholar]
- 5. Benoit SR, Hora I, Albright AL, Gregg EW. New directions in incidence and prevalence of diagnosed diabetes in the USA. BMJ Open Diabetes Res Care. 2019;7:e000657. doi: 10.1136/bmjdrc-2019-000657 [DOI] [PMC free article] [PubMed] [Google Scholar]
- 6. Hales CM, Carroll MD, Fryar CD, Ogden CL. Prevalence of obesity and severe obesity among adults: United States, 2017–2018. NCHS Data Brief. 2020:1–8. [PubMed] [Google Scholar]
- 7. Benjamin EJ, Muntner P, Alonso A, Bittencourt MS, Callaway CW, Carson AP, Chamberlain AM, Chang AR, Cheng S, Das SR, et al.; On behalf of the American Heart Association Council on Epidemiology and Prevention Statistics Committee and Stroke Statistics Subcommittee . Heart disease and stroke statistics—2019 update: a report from the American Heart Association. Circulation. 2019;139:e56–e528. doi: 10.1161/CIR.0000000000000659 [DOI] [PubMed] [Google Scholar]
- 8. De Boer IH, Bangalore S, Benetos A, Davis AM, Michos ED, Muntner P, Rossing P, Zoungas S, Bakris G. Diabetes and hypertension: a position statement by the American Diabetes Association. Diabetes Care. 2017;40:1273–1284. doi: 10.2337/dci17-0026 [DOI] [PubMed] [Google Scholar]
- 9. Rethy L, Shah NS, Paparello JJ, Lloyd‐Jones DM, Khan SS. Trends in hypertension‐related cardiovascular mortality in the United States, 2000 to 2018. Hypertension. 2020;76:e23–e25. doi: 10.1161/HYPERTENSIONAHA.120.15153 [DOI] [PMC free article] [PubMed] [Google Scholar]
- 10. Jin Y, Song S, Zhang L, Trisolini MG, Labresh KA, Smith SC, Zheng Z. Disparities in premature cardiac death among US counties from 1999–2017: temporal trends and key drivers. J Am Heart Assoc. 2020;9:e016340. doi: 10.1161/JAHA.120.016340 [DOI] [PMC free article] [PubMed] [Google Scholar]
- 11. Lloyd‐Jones DM, Hong Y, Labarthe D, Mozaffarian D, Appel LJ, Van Horn L, Greenlund K, Daniels S, Nichol G, Tomaselli GF, et al.; American Heart Association Strategic Planning Task Force and Statistics Committee. Defining and setting national goals for cardiovascular health promotion and disease reduction: the American Heart Association’s strategic Impact Goal through 2020 and beyond. Circulation. 2010;121:586–613. doi: 10.1161/CIRCULATIONAHA.109.192703 [DOI] [PubMed] [Google Scholar]
- 12. Joseph JJ, Echouffo‐Tcheugui JB, Carnethon MR, Bertoni AG, Shay CM, Ahmed HM, Blumenthal RS, Cushman M, Golden SH. The association of ideal cardiovascular health with incident type 2 diabetes mellitus: the Multi‐Ethnic Study of Atherosclerosis. Diabetologia. 2016;59:1893–1903. doi: 10.1007/s00125-016-4003-7 [DOI] [PMC free article] [PubMed] [Google Scholar]
- 13. Folsom AR, Shah AM, Lutsey PL, Roetker NS, Alonso A, Avery CL, Miedema MD, Konety S, Chang PP, Solomon SD. American Heart Association’s life’s simple 7: avoiding heart failure and preserving cardiac structure and function. Am J Med. 2015;128:970–976.e2. doi: 10.1016/j.amjmed.2015.03.027 [DOI] [PMC free article] [PubMed] [Google Scholar]
- 14. Thacker EL, Gillett SR, Wadley VG, Unverzagt FW, Judd SE, McClure LA, Howard VJ, Cushman M. The American Heart Association life’s simple 7 and incident cognitive impairment: the REasons for Geographic and Racial Differences in Stroke (REGARDS) Study. J Am Heart Assoc. 2014;3:e000635. doi: 10.1161/JAHA.113.000635 [DOI] [PMC free article] [PubMed] [Google Scholar]
- 15. Kesireddy V, Tan Y, Kline D, Brock G, Odei JB, Kluwe B, Effoe VS, Echouffo Tcheugui JB, Kalyani RR, Sims M, et al. The association of life’s simple 7 with aldosterone among African Americans in the Jackson Heart Study. Nutrients. 2019;11:955. doi: 10.3390/nu11050955 [DOI] [PMC free article] [PubMed] [Google Scholar]
- 16. Schultz WM, Kelli HM, Lisko JC, Varghese T, Shen J, Sandesara P, Quyyumi AA, Taylor HA, Gulati M, Harold JG, et al. Socioeconomic status and cardiovascular outcomes: challenges and interventions. Circulation. 2018;137:2166–2178. doi: 10.1161/CIRCULATIONAHA.117.029652 [DOI] [PMC free article] [PubMed] [Google Scholar]
- 17. Hayward MD, Miles TP, Crimmins EM, Yang Y. The significance of socioeconomic status in explaining the racial gap in chronic health conditions. Am Sociol Rev. 2000;65:910. doi: 10.2307/2657519 [DOI] [Google Scholar]
- 18. Mackenbach J. Socioeconomic inequalities in cardiovascular disease mortality. An international study. Eur Heart J. 2000;21:1141–1151. doi: 10.1053/euhj.1999.1990 [DOI] [PubMed] [Google Scholar]
- 19. Clark AM, DesMeules M, Luo W, Duncan AS, Wielgosz A. Socioeconomic status and cardiovascular disease: risks and implications for care. Nat Rev Cardiol. 2009;6:712–722. doi: 10.1038/nrcardio.2009.163 [DOI] [PubMed] [Google Scholar]
- 20. Rosengren A, Smyth A, Rangarajan S, Ramasundarahettige C, Bangdiwala SI, AlHabib KF, Avezum A, Bengtsson Boström K, Chifamba J, Gulec S, et al. Socioeconomic status and risk of cardiovascular disease in 20 low‐income, middle‐income, and high‐income countries: the Prospective Urban Rural Epidemiologic (PURE) study. Lancet Glob Health. 2019;7:e748–e760. doi: 10.1016/S2214-109X(19)30045-2 [DOI] [PubMed] [Google Scholar]
- 21. Jankovi S, Stojisavljevi D, Jankovi J, Eri M, Marinkovi J. Association of socioeconomic status measured by education, and cardiovascular health: a population‐based cross‐sectional study. BMJ Open. 2014;4:e005222. doi: 10.1136/bmjopen-2014-005222 [DOI] [PMC free article] [PubMed] [Google Scholar]
- 22. Ren J, Guo XL, Lu ZL, Zhang JY, Tang JL, Chen X, Gao CC, Xu CX, Xu AQ. Ideal cardiovascular health status and its association with socioeconomic factors in Chinese adults in Shandong, China. BMC Public Health. 2016;16:942. doi: 10.1186/s12889-016-3632-6 [DOI] [PMC free article] [PubMed] [Google Scholar]
- 23. MacDonald LA, Bertke S, Hein MJ, Judd S, Baron S, Merritt R, Howard VJ. Prevalence of cardiovascular health by occupation: a cross‐sectional analysis among U.S. workers aged ≥45 years. Am J Prev Med. 2017;53:152–161. doi: 10.1016/j.amepre.2017.02.022 [DOI] [PMC free article] [PubMed] [Google Scholar]
- 24. McClurkin MA, Yingling LR, Ayers C, Cooper‐McCann R, Suresh V, Nothwehr A, Barrington DS, Powell‐Wiley TM. Health insurance status as a barrier to ideal cardiovascular health for U.S. adults: data from the National Health and Nutrition Examination Survey (NHANES). PLoS One. 2015;10(11):e0141534. [DOI] [PMC free article] [PubMed] [Google Scholar]
- 25. Foraker RE, Bush C, Greiner MA, Sims M, Henderson K, Smith S, Bidulescu A, Shoben AB, Hardy NC, O’Brien E. Distribution of cardiovascular health by individual‐ and neighborhood‐level socioeconomic status: findings from the Jackson Heart Study. Glob Heart. 2019;14:241–250. doi: 10.1016/j.gheart.2019.04.007 [DOI] [PubMed] [Google Scholar]
- 26. Joseph JJ, Glover A, Olayiwola JN, Rastetter M, Allen J, Knight K, Roberts M, Mazzola J, Gregory J, Kluwe B, et al. Mask up: academic‐community‐government partnerships to advance public health during COVID‐19. Popul Health Manag. 2021;24:430–432. doi: 10.1089/pop.2020.0305 [DOI] [PMC free article] [PubMed] [Google Scholar]
- 27. Joseph JJ, Bennett A, Echouffo Tcheugui JB, Effoe VS, Odei JB, Hidalgo B, Dulin A, Safford MM, Cummings DM, Cushman M, et al. Ideal cardiovascular health, glycaemic status and incident type 2 diabetes mellitus: the REasons for Geographic and Racial Differences in Stroke (REGARDS) study. Diabetologia. 2019;62:426–437. doi: 10.1007/s00125-018-4792-y [DOI] [PMC free article] [PubMed] [Google Scholar]
- 28. Spahillari A, Talegawkar S, Correa A, Carr JJ, Terry JG, Lima J, Freedman JE, Das S, Kociol R, de Ferranti S, et al. Ideal cardiovascular health, cardiovascular remodeling, and heart failure in blacks: the Jackson Heart Study. Circ Heart Fail. 2017;10:e003682. doi: 10.1161/CIRCHEARTFAILURE.116.003682 [DOI] [PMC free article] [PubMed] [Google Scholar]
- 29. Veromaa V, Kautiainen H, Juonala M, Rantanen A, Korhonen PE. Self‐rated health as an indicator of ideal cardiovascular health among working‐aged women. Scand J Prim Health Care. 2017;35:322–328. doi: 10.1080/02813432.2017.1397299 [DOI] [PMC free article] [PubMed] [Google Scholar]
- 30. Zimmerman E, Woolf SH. Understanding the relationship between education and health. NAM Perspect. 2014;4. Available at: https://nam.edu/perspectives-2014-understanding-the-relationship-between-education-and-health/. Accessed November 1, 2021. [Google Scholar]
- 31. Adler NE, Newman K. Socioeconomic disparities in health: pathways and policies. Health Aff. 2002;21:60–76. doi: 10.1377/hlthaff.21.2.60 [DOI] [PubMed] [Google Scholar]
- 32. Pampel FC, Krueger PM, Denney JT. Socioeconomic disparities in health behaviors. Annu Rev Sociol. 2010;36:349–370. doi: 10.1146/annurev.soc.012809.102529 [DOI] [PMC free article] [PubMed] [Google Scholar]
- 33. Chetty R, Stepner M, Abraham S, Lin S, Scuderi B, Turner N, Bergeron A, Cutler D. The association between income and life expectancy in the United States, 2001–2014. JAMA. 2016;315:1750. doi: 10.1001/jama.2016.4226 [DOI] [PMC free article] [PubMed] [Google Scholar]
- 34. Moss E, McIntosh K, Edelberg W, Broady K. The Black‐white wealth gap left Black households more vulnerable. Available at: https://www.brookings.edu/blog/up‐front/2020/12/08/the‐black‐white‐wealth‐gap‐left‐black‐households‐more‐vulnerable/. Accessed September 1, 2021.
- 35. Brooks EL, Preis SR, Hwang S‐J, Murabito JM, Benjamin EJ, Kelly‐Hayes M, Sorlie P, Levy D. Health insurance and cardiovascular disease risk factors. Am J Med. 2010;123:741–747. doi: 10.1016/j.amjmed.2010.02.013 [DOI] [PMC free article] [PubMed] [Google Scholar]
- 36. Gilbert KL, Ray R, Siddiqi A, Shetty S, Baker EA, Elder K, Griffith DM. Visible and invisible trends in black men’s health: pitfalls and promises for addressing racial, ethnic, and gender inequities in health. Annu Rev Public Health. 2016;37:295–311. doi: 10.1146/annurev-publhealth-032315-021556 [DOI] [PMC free article] [PubMed] [Google Scholar]
- 37. Assari S, Lee DB, Nicklett EJ, Moghani Lankarani M, Piette JD, Aikens JE. Racial discrimination in health care is associated with worse glycemic control among black men but not black women with type 2 diabetes. Front Public Health. 2017;5:235. doi: 10.3389/fpubh.2017.00235 [DOI] [PMC free article] [PubMed] [Google Scholar]
- 38. Gamble VN. Under the shadow of Tuskegee: African Americans and health care. Am J Public Health. 1997;87:1773–1778. doi: 10.2105/AJPH.87.11.1773 [DOI] [PMC free article] [PubMed] [Google Scholar]
- 39. Gray DM, Nolan TS, Bignall ONR, Gregory J, Joseph JJ. Reckoning with our trustworthiness, leveraging community engagement. Popul Health Manag. 2021. doi: 10.1089/pop.2021.0158 [DOI] [PubMed] [Google Scholar]
- 40. Arnett MJ, Thorpe RJ, Gaskin DJ, Bowie JV, LaVeist TA. Race, medical mistrust, and segregation in primary care as usual source of care: findings from the exploring health disparities in integrated communities study. J Urban Health. 2016;93:456–467. doi: 10.1007/s11524-016-0054-9 [DOI] [PMC free article] [PubMed] [Google Scholar]
- 41. Kaiser Family Foundation . Profile of medicare beneficiaries by race and ethnicity: a chartpack. Available at: https://www.kff.org/report‐section/profile‐of‐medicare‐beneficiaries‐by‐race‐and‐ethnicity‐chartpack/. Accessed February 14, 2021.
- 42. Zajacova A, Lawrence EM. The relationship between education and health: reducing disparities through a contextual approach. Annu Rev Public Health. 2018;39:273–289. doi: 10.1146/annurev-publhealth-031816-044628 [DOI] [PMC free article] [PubMed] [Google Scholar]
- 43. Hahn RA, Truman BI. Education improves public health and promotes health equity. Int J Health Serv. 2015;45:657–678. doi: 10.1177/0020731415585986 [DOI] [PMC free article] [PubMed] [Google Scholar]
- 44. Winkleby MA, Jatulis DE, Frank E, Fortmann SP. Socioeconomic status and health: how education, income, and occupation contribute to risk factors for cardiovascular disease. Am J Public Health. 1992;82:816–820. doi: 10.2105/AJPH.82.6.816 [DOI] [PMC free article] [PubMed] [Google Scholar]
- 45. Bostean G, Roberts CK, Crespi CM, Prelip M, Peters A, Belin TR, McCarthy WJ. Cardiovascular health: associations with race–ethnicity, nativity, and education in a diverse, population‐based sample of Californians. Ann Epidemiol. 2013;23:388–394. [DOI] [PMC free article] [PubMed] [Google Scholar]
- 46. Winkleby MA, Kraemer HC, Ahn DK, Varady AN. Ethnic and socioeconomic differences in cardiovascular disease risk factors: findings for women from the Third National Health and Nutrition Examination Survey, 1988–1994. JAMA. 1998;280:356–362. doi: 10.1001/jama.280.4.356 [DOI] [PubMed] [Google Scholar]
- 47. MacDonald LA, Bertke S, Hein M, Judd SE, Baron S, Merritt R, Howard V. Prevalence of cardiovascular health by occupation: a cross‐sectional analysis among U.S. workers aged ≥45 years. Am J Prev Med. 2017;53:152–161. [DOI] [PMC free article] [PubMed] [Google Scholar]
- 48. Parks‐Yancy R. Equal Work, Unequal Careers: African Americans in the Workforce. Boulder, Colorado: First Forum Press; 2010:1–153. [Google Scholar]
- 49. WHO Commission on Social Determinants of Health, World Health Organization , eds. Closing the Gap in a Generation: Health Equity Through Action on The Social Determinants of Health: Commission on Social Determinants of Health Final Report. Geneva, Switzerland: World Health Organization, Commission on Social Determinants of Health; 2008:1–246. [Google Scholar]
- 50. Hahn RA, Truman BI, Williams DR. Civil rights as determinants of public health and racial and ethnic health equity: health care, education, employment, and housing in the United States. SSM ‐ Popul Health. 2018;4:17–24. doi: 10.1016/j.ssmph.2017.10.006 [DOI] [PMC free article] [PubMed] [Google Scholar]
- 51. Artiga S, Hinton E. Beyond Health Care: The Role of Social Determinants in Promoting Health and Health Equity [Internet]. San Francisco, CA: Henry J. Kaiser Family Foundation; 2018 May 10 [cited 2020 Oct 10]. Available at: https://www.kff.org/disparities‐policy/issue‐brief/beyond‐health‐care‐the‐role‐of‐social‐determinants‐in‐promoting‐health‐and‐health‐equity/. Accessed October 10, 2021. [Google Scholar]
- 52. Thornton RLJ, Glover CM, Cené CW, Glik DC, Henderson JA, Williams DR. Evaluating strategies for reducing health disparities by addressing the social determinants of health. Health Aff. 2016;35:1416–1423. doi: 10.1377/hlthaff.2015.1357 [DOI] [PMC free article] [PubMed] [Google Scholar]
- 53. Frierson GM, Howard EN, DeFina LE, Powell‐Wiley TM, Willis BL. Effect of race and socioeconomic status on cardiovascular risk factor burden: the Cooper Center Longitudinal Study. Ethn Dis. 2013;23:35–42. [PMC free article] [PubMed] [Google Scholar]
- 54. Colen CG, Ramey DM, Cooksey EC, Williams DR. Racial disparities in health among nonpoor African Americans and Hispanics: the role of acute and chronic discrimination. Soc Sci Med. 2018;199:167–180. doi: 10.1016/j.socscimed.2017.04.051 [DOI] [PMC free article] [PubMed] [Google Scholar]
- 55. Carlson ED, Chamberlain RM. Allostatic load and health disparities: a theoretical orientation. Res Nurs Health. 2005;28:306–315. doi: 10.1002/nur.20084 [DOI] [PubMed] [Google Scholar]
- 56. Mair CA, Cutchin MP, Kristen PM. Allostatic load in an environmental riskscape: the role of stressors and gender. Health Place. 2011;17:978–987. doi: 10.1016/j.healthplace.2011.03.009 [DOI] [PMC free article] [PubMed] [Google Scholar]
- 57. McEwen BS, Wingfield JC. The concept of allostasis in biology and biomedicine. Horm Behav. 2003;43:2–15. doi: 10.1016/S0018-506X(02)00024-7 [DOI] [PubMed] [Google Scholar]
- 58. Szanton SL, Gill JM, Allen JK. Allostatic load: a mechanism of socioeconomic health disparities? Biol Res Nurs. 2005;7:7–15. doi: 10.1177/1099800405278216 [DOI] [PMC free article] [PubMed] [Google Scholar]
- 59. Hickson DA, Diez Roux AV, Gebreab SY, Wyatt SB, Dubbert PM, Sarpong DF, Sims M, Taylor HA. Social patterning of cumulative biological risk by education and income among African Americans. Am J Public Health. 2012;102:1362–1369. doi: 10.2105/AJPH.2011.300444 [DOI] [PMC free article] [PubMed] [Google Scholar]
- 60. Thomas J, Thomas DJ, Pearson T, Klag M, Mead L. Cardiovascular disease in African American and White physicians: the Meharry Cohort and Meharry‐Hopkins Cohort Studies. J Health Care Poor Underserved. 1997;8:270–283. doi: 10.1353/hpu.2010.0526 [DOI] [PubMed] [Google Scholar]
- 61. Elgazzar R, Nolan TS, Joseph JJ, Aboagye‐Mensah EB, Azap RA, Gray DM. Community‐engaged and community‐based participatory research to promote American Heart Association Life’s Simple 7 among African American adults: a systematic review. PLoS One. 2020;15:e0238374. doi: 10.1371/journal.pone.0238374 [DOI] [PMC free article] [PubMed] [Google Scholar]
- 62. Effoe VS, Carnethon MR, Echouffo‐Tcheugui JB, Chen H, Joseph JJ, Norwood AF, Bertoni AG. The American Heart Association ideal Cardiovascular Health and incident type 2 diabetes mellitus among blacks: the Jackson Heart Study. J Am Heart Assoc. 2017;6:e005008. doi: 10.1161/JAHA.116.005008 [DOI] [PMC free article] [PubMed] [Google Scholar]
- 63. Shay CM, Ning H, Allen NB, Carnethon MR, Chiuve SE, Greenlund KJ, Daviglus ML, Lloyd‐Jones DM. Status of cardiovascular health in US adults: prevalence estimates from the National Health and Nutrition Examination Surveys (NHANES) 2003–2008. Circulation. 2012;125:45–56. doi: 10.1161/CIRCULATIONAHA.111.035733 [DOI] [PMC free article] [PubMed] [Google Scholar]
- 64. Gray DM, Nolan TS, Gregory J, Joseph JJ. Diversity in clinical trials: an opportunity and imperative for community engagement. Lancet Gastroenterol Hepatol. 2021;6:605–607. doi: 10.1016/S2468-1253(21)00228-4 [DOI] [PubMed] [Google Scholar]
Associated Data
This section collects any data citations, data availability statements, or supplementary materials included in this article.
Supplementary Materials
Tables S1–S13