Abstract
Changes in climate and land use are major threats to pollinating insects, an essential functional group. Here, we unravel the largely unknown interactive effects of both threats on seven pollinator taxa using a multiscale space-for-time approach across large climate and land-use gradients in a temperate region. Pollinator community composition, regional gamma diversity, and community dissimilarity (beta diversity) of pollinator taxa were shaped by climate-land-use interactions, while local alpha diversity was solely explained by their additive effects. Pollinator diversity increased with reduced land-use intensity (forest < grassland < arable land < urban) and high flowering-plant diversity at different spatial scales, and higher temperatures homogenized pollinator communities across regions. Our study reveals declines in pollinator diversity with land-use intensity at multiple spatial scales and regional community homogenization in warmer and drier climates. Management options at several scales are highlighted to mitigate impacts of climate change on pollinators and their ecosystem services.
Negative effects of climate warming on pollinator diversity may be more severe in anthropogenic than in seminatural areas.
INTRODUCTION
Recent evidence of marked insect declines (1, 2) sparked global concerns due to the ecological and economic importance of insects for ecosystem functioning (3, 4). Pollination, for instance, is an ecosystem service required by about 75% of our food crops (5), with an annual estimated global value of US$235 to US$577 billion (6). Bees are known to be the most effective pollinators to wild plants and crops (7, 8), but there are many other important yet understudied flower-visiting insect groups in the orders Diptera, Lepidoptera, Hymenoptera, and Coleoptera that contribute to pollination services (8). Considering the large variety of life history traits of pollinating insects, which shape their response to anthropogenic disturbance, studies on pollinator communities require a multitaxa approach.
Land-use change, i.e., the transformation of natural or seminatural areas to agricultural and urban areas, has been identified as the main factor behind the declines in pollinator diversity (9). Human activities are responsible for habitat loss and degradation, landscape simplification by large monocultures, and habitat fragmentation by roads and other infrastructure. Therefore, numerous studies have tried to understand the impact of habitat diversity and quality, land-use intensity, or landscape composition and configuration on biodiversity (10). Although landscape heterogeneity and configuration, as well as the proximity of seminatural habitat and habitat corridors are assumed important, it is difficult to draw general conclusions from these studies, because the relative effect of land-use variables changes depending on the spatial scale considered (11), the diversity metrics used (12), the taxa analyzed [with different traits and from different trophic levels (11, 13)], the habitat types studied (14), and the land-use intensities covered (15). To disentangle how community structure and underlying processes change at different spatial scales, alpha diversity (local species richness), gamma diversity (regional species richness), and beta diversity (community heterogeneity or dissimilarity in species composition between local or regional species pools) measures need to be considered (11). Furthermore, it is still largely uncertain how other major drivers of biodiversity loss, such as climate change, can influence insect diversity in interaction with land-use transformation (10, 16, 17).
Climate plays a major role in shaping biotic communities, filtering species that are not adapted to certain abiotic conditions (18). Climate change is accelerating, with a rise in mean temperatures, regional shifts in mean precipitation, higher temporal variability in rainfall that causes droughts and flooding, and uncertain but likely detrimental consequences for insect communities (18). So far, few studies have addressed the combined effects of land use and climate change on biodiversity [e.g., (12, 15, 16)], and most of them have used modeling approaches (19–21). Land-use change is expected to reduce the resilience of species to climate change, while climate change can hamper the survival of species in anthropogenic landscapes (16). For instance, landscape structure can hinder species range shifts in response to climate warming (21) [but see (22)], climate change and related extreme climatic events reduce the resilience of populations in fragmented landscapes (23, 24), and interactions between climate and land-use change affect community structures (25). Interactive effects of climate and land use can also influence pollinator communities indirectly, as they determine the availability of flowering plants that pollinators depend on for food (26). However, the fact that climate and land-use changes occur simultaneously makes it difficult to disentangle interactive or additive effects of both factors (16), particularly as the results differ among spatiotemporal scales (27–30). Therefore, insights provided by historical time-series data should be complemented with space-for-time approaches built upon independent gradients of climate and land use (24, 26, 31). Hereby, the spatial scale considered is also important, because microclimatic conditions in anthropogenic habitats may only be weakly correlated with larger-scale regional climatic variation (32), as human-modified areas tend to be warmer and drier than natural or seminatural ecosystems (33, 34). Thus, microclimatic effects caused by land-use change could be confounded with climate change effects (35).
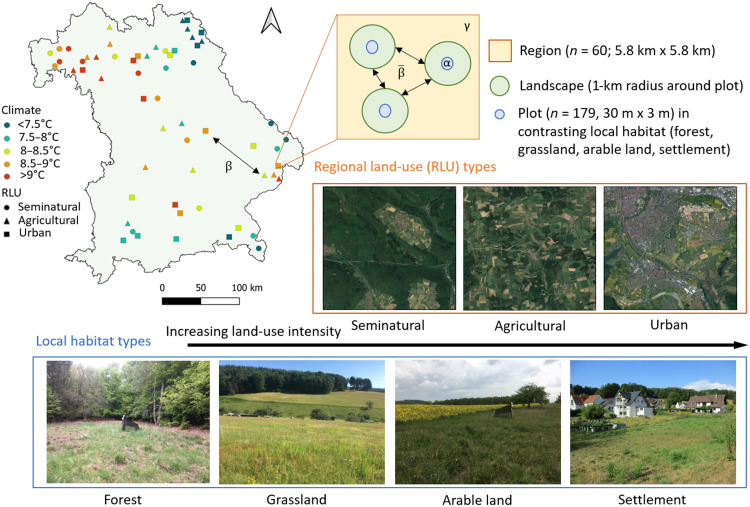
In this study, we aim to disentangle the interactive effects of climate and land use on pollinator communities across the most common habitat and landscape types within an anthropogenic temperate zone, using a multiscale space-for-time approach (Fig. 1). We hypothesized that (i) pollinator species composition and pollinator diversity are interactively determined by climate and land use; (ii) individual pollinator taxa respond differently to the interactive effects of climate and land use at different spatial scales; (iii) high-intensity land use (agricultural or urban regions), low diversity of flowering plants, and high temperatures reduce the heterogeneity of pollinator species within regions (intraregional beta diversity), while low-intensity land use (seminatural regions) and low temperatures increase community heterogeneity across regions (interregional beta diversity); and (iv) local alpha diversity is mainly determined by the habitat type, which offers specific microclimates and flowering-plant resources, and by landscape composition and configuration.
Fig. 1. Location and overview of the study sites and study design.
Symbols in the map (Bavaria, Germany) represent our 60 study regions selected along gradients of climate (multiannual mean air temperature 1981–2010) and land-use intensity [seminatural, agricultural, and urban regions—regional land use (RLU)]. Each region contains three plots in open herbaceous vegetation, located in three dominating out of four possible habitat types—forest, grassland, arable land, and settlement. We use the regional scale for analysis of the gamma (γ), intraregional () and interregional (β) beta diversity, and the local (plot) and landscape (1-km radius around plot) scales for analysis of the alpha (α) diversity. Aerial pictures of regional land-use types were obtained from Google Earth. Photo credit: Cristina Ganuza, Julius-Maximilians-University Würzburg.
RESULTS
We recorded 3218 flower-visiting insect species (“pollinators” henceforth) using molecular DNA metabarcoding of Malaise trap samples collected during seasonal peak activity of insects (May to July) on 179 study plots embedded in 60 study regions across Bavaria, southern Germany (see Fig. 1). The majority were non-syrphid Diptera (“Diptera,” 33%), followed by non-bee Hymenoptera (“Hymenoptera,” 27%), crepuscular and nocturnal moths (“moths,” 20%), beetles (8%), bees (6%), diurnal Lepidoptera (“butterflies,” 3%), and syrphids (3%). Table S1 contains the total number of species, genera, and families found from each pollinator taxon, which represented 28% of the Aculeata wasp species, 33% of the moth species, 38% of the bee species, 41% of the butterfly species, and 24% of the syrphid species known for Bavaria (36, 37).
In addition, we estimated the flowering-plant species pool (i.e., angiosperm species) in a 200-m buffer radius around the study plots, which comprised a total of 950 flowering-plant species. Rarefaction interpolation curves and sample completeness values supporting the effectiveness of our sampling methods in relation to our sampling effort are shown in fig. S1.
Effects of regional land use and temperature on plant and pollinator community composition and interregional community heterogeneity
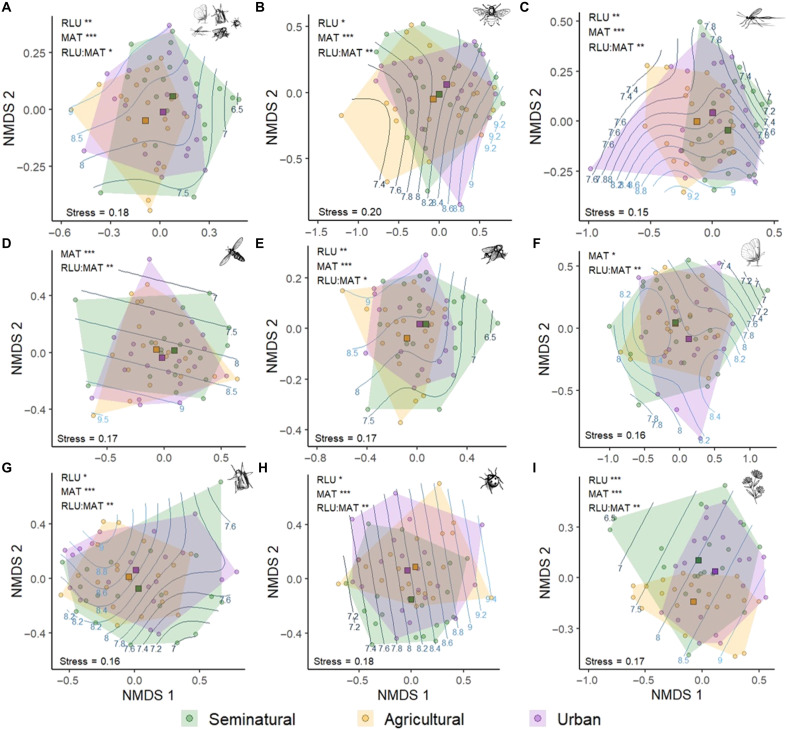
As a first step, we analyzed how the community composition of the different pollinator taxa and flowering plants varied at the largest scale, i.e., among regional land-use types (seminatural, agricultural, or urban) and across the climate gradient (multiannual mean temperature 1981–2010, “annual temperature” henceforth). Despite the large overlap found in ordination diagrams among the three regional land-use types (Fig. 2), permutational multivariate analysis of variance (adonis function, table S2) indicated that the community composition of most pollinator groups (Fig. 2, A to G) and flowering-plant species (Fig. 2I) changed significantly across land-use intensity and annual temperature gradients, and with the interaction between both gradients. Only syrphid and butterfly assemblages did not differ among regional land-use types, although they varied with the interaction between land use and annual temperature.
Fig. 2. Overlap in species composition among the three major regional land-use types (RLU) and their interaction with multiannual mean temperature (MAT).
Diagrams show ordinations based on NMDS of Jaccard’s dissimilarity matrices. The position of regions (dots, n = 60) in the NMDS space represents the similarity in pollinator community composition in relation to other regions: the closer the dots, the higher the proportion of species shared. Squares represent centroids of the three regional land-use types; polygons delimit the NMDS space occupied by regions with the same regional land-use type; and lines in the background represent contour lines of temperature. The different panels show (A) whole pollinator community, (B) bees, (C) non-bee Hymenoptera, (D) syrphids, (E) non-syrphid Diptera, (F) butterflies, (G) moths, (H) beetles, and (I) flowering plants. Significant effects of MAT, RLU, and their interaction based on permutational multivariate analysis of variance are shown in the top left corner of each panel (table S2). Significance levels: ***P < 0.001, **P < 0.01, and *P < 0.05.
In a parallel analysis, we assessed the dispersion of communities among the three regional land-use types and between warm and cool regions to get an indication of how regional characteristics affect the dissimilarity of plant and insect communities (interregional beta diversity). As reflected in Fig. 2, multivariate analyses for homogeneity of variances (betadisper function) confirmed that the dispersion of communities among the three regional land-use types was homogeneous, meaning that different regional land uses have similar compositional variance (table S3). Hence, communities were not more homogeneous with higher land-use intensity at the regional level. In contrast, the whole pollinator community and the communities of individual pollinator taxa—except bees and beetles (fig. S2, A to H)—were more homogeneous in warm regions (annual temperature 8.4° to 9.8°C) than in cool ones (annual temperature 5.6° to 8.4°C). The compositional variance of pollinator communities was independent of the interaction between annual temperature and land-use intensity (table S4).
Determinants of the regional species pool, local communities, and intraregional community dissimilarity
Climate and land use mostly had additive effects on nearly all pollinator taxa at both local and regional scales. While the direction of temperature and precipitation effects varied across taxa, higher land-use intensity and lower flowering-plant diversity were nearly consistently associated with a loss of pollinator species across taxa and spatial scales. Interactive effects of climate and land use were observed for gamma (regional richness) and beta diversity (dissimilarity in species composition) at the regional level but not for alpha diversity at the local (study plot) level (Table 1; find complete model summary outputs in tables S5 to S7). For clarity and simplicity, we did not consider the contribution of nestedness (species loss that causes poorer communities to be a subset of richer communities) and turnover (the substitution of species in one site without changes in species richness) to beta diversity (11).
Table 1. Standardized z or t values of best models explaining (A) gamma, (B) intraregional beta, and (C) alpha diversity of pollinators.
Only explanatory variables that were included in the final models are shown. (A) Full gamma and (B) beta diversity models included the multiannual mean temperature [MAT] and precipitation [MAP] at the regional scale (5.8 km × 5.8 km), the land-cover proportion of forest [For], grassland [Gra], agriculture [Agr], and urban [Urb] in the region, and the gamma or beta diversity of flowering-plant communities [Flower γ or β], as well as the interaction between MAT and MAP and MAT and regional land-use covers. (C) Full alpha diversity models included the seasonal mean temperature recorded in the plot [T] in interaction with the local habitat type as factor with four levels (forest, grassland, arable land, and settlement) [Hab], the proportion of forest [For], grassland [Gra], agriculture [Agr], and urban [Urb] in the landscape (1-km radius around plot), the Shannon index of landscape diversity [Shannon], edge density describing landscape configuration [EdgeD], and the alpha diversity of flowering-plant communities [Flower α]. Because some variables were correlated or caused multicollinearity issues, different full models had to be fitted and compared (see Materials and Methods and fig. S8). Z [from GLMs (gamma diversity) and GLMMs (alpha diversity)] and t [from LMs (beta diversity)] values were standardized to allow comparison among variables of the different gamma, beta, and alpha diversity models. ΔAICnull indicate the difference in AIC between the best model and the null model.
|
|
|

|
|
|
|

|
|||
| A | γ Diversity | Pollinators | Bees | Hymenoptera | Syrphids | Diptera | Butterflies | Moths | Beetles | |
| Climate (Cl) | MATRegion | 4.52 | −0.20 | 2.66 | ||||||
| MAPRegion | −0.30 | 3.78 | 3.98 | −1.93 | −4.14 | |||||
| MAP:MATR | −3.71 | −3.43 | ||||||||
| Land use (LU) | ForRegion | 2.37 | 2.36 | −0.14 | 3.25 | |||||
| Cl:LU | For:MATR | 4.24 | ||||||||
| Nagelkerke’s R2 | 0.132 | 0.611 | 0.131 | 0.299 | 0.322 | 0.395 | 0.340 | 0.307 | ||
| ΔAICnull | 3.3 | 25.5 | 3.2 | 11.7 | 12.0 | 7.8 | 13.0 | 9.2 | ||
| B | β Diversity | Pollinators | Bees | Hymenoptera | Syrphids | Diptera | Butterflies | Moths | Beetles | |
| Climate (Cl) | MATRegion | −1.79 | −1.83 | −3.57 | −1.34 | −2.85 | −2.42 | −0.76 | ||
| MAPRegion | 0.50 | 2.81 | 1.53 | 2.00 | ||||||
| MAP:MATR | 4.49 | 3.40 | 2.63 | |||||||
| Land use (LU) | ForRegion | 2.18 | 2.21 | 1.46 | ||||||
| AgrRegion | −2.72 | −2.16 | ||||||||
| UrbRegion | 0.70 | |||||||||
| Flower β | 4.12 | 2.29 | 2.52 | 4.14 | 2.00 | 3.69 | 3.62 | |||
| Cl:LU | For:MATR | 2.77 | ||||||||
| UrbMATR | −3.39 | |||||||||
| R2/adj. R2 | 0.418/0.364 | 0.297/0.259 | 0.243/0.216 | 0.205/0.178 | 0.376/0.319 | 0.289/0.251 | 0.467/0.417 | 0.299/0.248 | ||
| ΔAICnull | 22.5 | 15.1 | 12.7 | 9.8 | 18.3 | 14.5 | 27.7 | 13.3 | ||
| C | α Diversity | Pollinators | Bees | Hymenoptera | Syrphids | Diptera | Butterflies | Moths | Beetles | |
| Climate (CI) | TLocal | 3.21 | −2.33 | 2.31 | ||||||
| Land use (LU) | HabGraLocal | −6.07 | −3.77 | −6.61 | −3.40 | −4.28 | −2.29 | −4.64 | ||
| HabAgrLocal | −8.93 | −5.57 | −8.05 | −3.87 | −6.15 | −6.21 | −5.86 | |||
| HabUrbLocal | −4.55 | −1.95 | −4.53 | −2.75 | −2.58 | −4.01 | −0.3.76 | |||
| GraLandsc | −2.19 | |||||||||
| AgrLandsc | −2.34 | |||||||||
| UrbLandsc | 2.81 | |||||||||
| EdgeDLandsc | 2.27 | |||||||||
| Flower α | 3.67 | 3.12 | 3.12 | 3.78 | 3.26 | 2.11 | 2.81 | |||
| Marg./cond. R2 | 0.335/0.403 | 0.370/0.487 | 0.301/0.399 | 0.175/0.254 | 0.292/0.329 | 0.073/0.517 | 0.248/0.396 | 0.187/0.327 | ||
| ΔAICnull | 62.1 | 59.8 | 54.8 | 22.8 | 51.2 | 14.5 | 38.8 | 30.2 | ||
Butterflies were the taxon most affected by the regional scale. This is shown by the higher variance explained by regional variables in gamma and beta diversity models and by the high conditional R2 value of the alpha diversity model, which was determined by region as random term (Table 1). The diversity of all other pollinator groups was, in contrast, better explained by local and landscape variables, especially by the habitat type (Table 1C). In general, climate variables were stronger predictors of the regional richness (gamma diversity, Table 1A), while land-use variables were more important at the local scale (alpha diversity, Table 1C). On the other hand, the best intraregional beta diversity models (i.e., with higher R2 and higher difference in AIC (Akaike information criterion) between the best model and the null model, ΔAICnull) included both climate and land-use variables. This stresses the relevance of all considered environmental variables to determine the turnover and nestedness of pollinator communities (Table 1B).
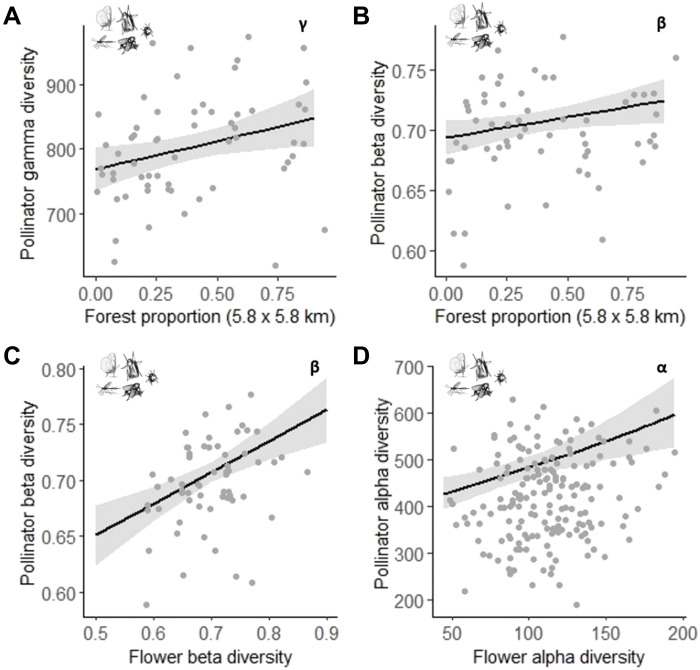
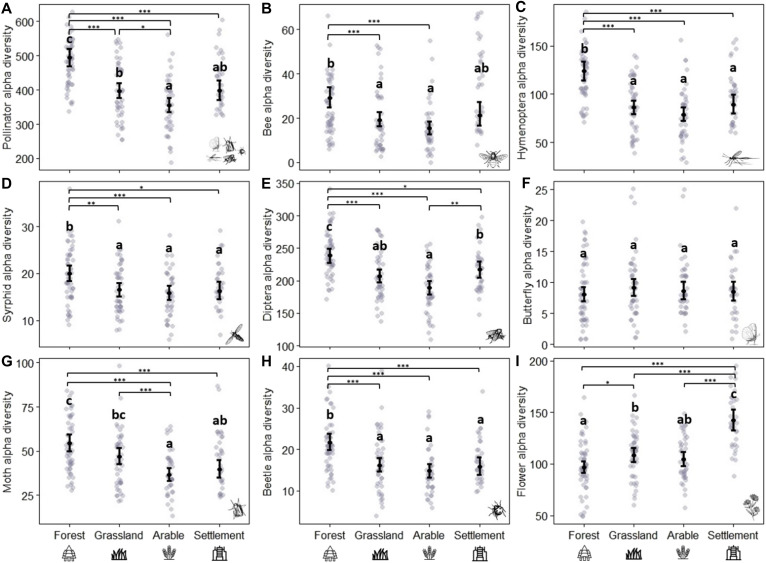
In the gradient of land-use intensity considered in our study, forests are the most natural habitats, followed by grassland, arable land, and settlements. Our results showed that the diversity of the different pollinator taxa responds to this gradient across spatial scales. First, the proportion of forest area at the regional level was selected in most models as a positive (although not strong) driver of both gamma and beta diversity (Table 1, A and B). A high proportion of forest increased the gamma diversity of the whole pollinator community, Hymenoptera, and beetles (Fig. 3A and fig. S3, A and B). In addition, the whole pollinator and Diptera communities were more heterogeneous within study regions (higher intraregional beta diversity) with higher proportions of forest area (Fig. 3B and fig. S3C). On the other hand, butterfly and moth communities were more homogeneous in regions with higher proportions of agricultural area (i.e., cropland) (fig. S3, D and E). At the local level, the habitat type was the most important factor (Table 1C), as the alpha diversity (local richness) of all pollinator groups—except for butterflies—was higher in plots directly surrounded by forests than by grassland, arable land, or settlements (Fig. 4). Nevertheless, the diversity of flowering-plant species was also an essential variable for the alpha and beta diversity of insects, because most pollinator taxa increased with higher flowering-plant diversity (Table 1, B and C; Fig. 3, C and D; and figs. S3F and S4, E and F).
Fig. 3. Response of the gamma, beta, and alpha diversity of the whole pollinator community to land-use variables.
Graphs show predictions of the relationships selected in the best models between (A) gamma and (B) beta diversity (n = 60) and the proportion of forest in the region, and between (C) beta (n = 60) and (D) alpha (n = 175) diversity and the beta and alpha diversity of flowering plants, respectively.
Fig. 4. Differences in alpha diversity of pollinator and flowering-plant communities in the four local habitat types.
Graphs show predictions from the best models (Table 1C), while butterfly alpha diversity and flowering-plant alpha diversity models include habitat as the only explanatory variable. Differences among habitats were calculated via Tukey post hoc tests [function glht from the multcomp package (80)]. Black points indicate means, and bars indicate 95% confidence intervals, while gray points show the raw data. The different panels show (A) whole pollinator community, (B) bees, (C) non-bee Hymenoptera, (D) syrphids, (E) non-syrphid Diptera, (F) butterflies, (G) moths, (H) beetles, and (I) flowering plants. Forest: n = 54, grassland: n = 46, arable land: n = 41, settlement: n = 34. Significance levels: ***P < 0.001, **P < 0.01, and *P < 0.05.
Although habitat type and flowering-plant diversity were the most important factors at the local scale (Table 1C), the proportion of certain land-use types at the landscape level (1-km radius around study plots) were also associated with the alpha diversity of some pollinator taxa. Higher proportions of urban area increased bee richness (fig. S4C), and higher proportions of grassland and agricultural area decreased moth and Diptera richness, respectively (fig. S4, A and B). Besides, landscape configuration, i.e., edge density, had a positive effect on butterfly alpha diversity (fig. S4D), while a Shannon diversity index based on six land-cover classes was not selected in any alpha diversity model.
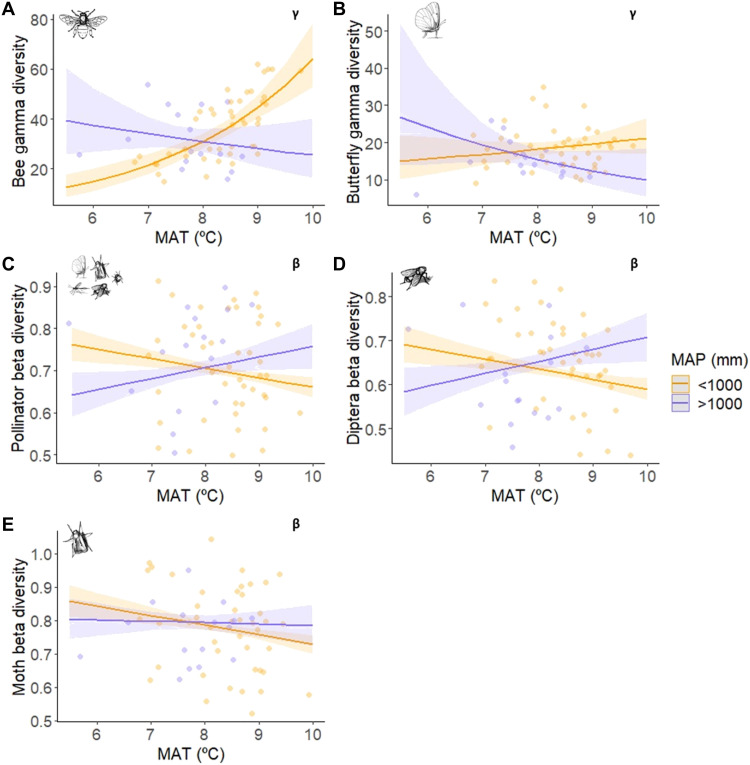
Climate variables influenced pollinator diversity at all spatial scales, being especially important at the regional level, with contrasting results for different pollinator communities (Table 1). The gamma diversity of beetles increased with higher annual temperature, while the gamma diversity of syrphids and other Diptera was strongly positively correlated with annual precipitation, and moth gamma diversity decreased steeply with higher annual precipitation (fig. S5, A to C). Besides, the interaction between annual temperature and precipitation was selected in the models of bees and butterflies. While temperature and precipitation had no effect on butterfly gamma diversity on their own, and the pattern found was not strong (Table 1A and Fig. 5B), temperature was positive for bee gamma diversity, and precipitation canceled this effect (Fig. 5A). Although bee gamma diversity was only explained by this interaction, this model had the most variance explained compared to the other gamma diversity models (Table 1A).
Fig. 5. Interaction effects between multiannual mean temperature (MAT) and precipitation (MAP).
Graphs show predictions of the interaction terms selected in the best gamma (A and B) and beta (C to E) diversity models (Table 1, A and B; n = 60). Shadows represent 95% confidence intervals, and points show the raw data.
Climate variables were also important predictors of the intraregional beta diversity of all pollinator taxa (Table 1B). Higher annual temperature was associated with more homogeneous butterfly, and especially Hymenoptera communities, and higher annual precipitation led to more heterogeneous syrphid communities (fig. S5, D to F). On the other hand, the interaction between annual temperature and precipitation influenced the beta diversity of the whole pollinator community, Diptera, and moths, although the effect was weak for the last. In all cases, communities were most homogeneous in regions with either high temperature and low precipitation or low temperature and high precipitation (Fig. 5, C to E).
Climate variables were less important than land-use variables at the local scale, but they still had an influence on bee, syrphid, and moth communities. The alpha diversity of both bees and moths was positively correlated with the local temperature (microclimate measured with thermologgers in the field), while syrphid alpha diversity tended to decrease with higher local temperature (fig. S5, G to I).
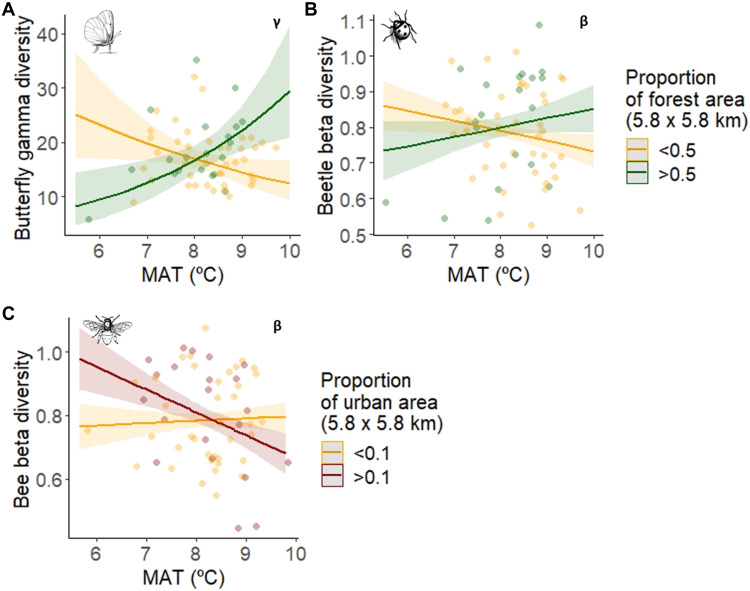
Interactive effects of climate and land use affected the gamma and beta diversity of some pollinator taxa to different extents. Butterfly gamma diversity decreased with higher annual temperature when the regional forest cover was low, but increased with higher annual temperature in regions with high forest cover (Fig. 6A). Beetle and bee gamma diversity were positively associated with high annual temperature at the regional level, but the beta diversity of beetles and bees increased in warmer climates only when land-use intensity was comparatively low: In warm regions, higher proportions of forest area weakly increased the heterogeneity of beetle communities (Fig. 6B), while higher proportions of urban area homogenized bee communities (Fig. 6C).
Fig. 6. Interaction effects between MAT and the proportion of regional forest or urban areas.
Graphs show predictions of the interaction terms selected in the best gamma (A) and beta (B and C) diversity models (Table 1, A and B; n = 60). Shadows represent 95% confidence intervals, and data points show the raw data.
Last, we aimed to understand whether the strong relationship of butterfly gamma diversity with the proportion of forest area was potentially driven by effects of forest edge density, because butterflies are known to prefer open habitats such as extensively managed grasslands (38). For this, we refitted the butterfly gamma diversity model including total edge density and forest edge density as additional variables. Total edge density was not selected in the best model, while forest edge density explained as much variation as the interaction between temperature and the proportion of forest cover (z = 3.75 and z = 3.65, respectively; R2 = 0.593). This confirms that, together with forest edge density, the interaction between annual temperature and the proportion of forest is important for butterfly gamma diversity, independently of regional landscape connectivity.
DISCUSSION
Future climate and land-use change scenarios (39) urge us to move forward in our understanding of the effects that these factors have on biodiversity, in particular, on pollinating insects that provide essential services to wild plants and crops (3, 4). In this study, both climate and land use affected the diversity of flower-visiting insects at multiple spatial scales, although climate seemed to be more important at the regional scale and land use at the local level, and their interaction was important at a regional scale, i.e., for community composition, gamma (i.e., regional richness), and intraregional beta diversity (i.e., dissimilarity in community composition among the three study sites of one region).
Although the species composition of all pollinator taxa varied among regions following interactive effects of climate (multiannual mean temperature) and land use (regional land-use type), only the gamma diversity of butterflies and the intraregional beta diversity of beetles and bees were influenced by climate-land-use interactions. Butterfly gamma diversity was lower in regions with high temperatures and low proportions of forest. Butterflies were the only pollinator group that was not species-richer in forest habitats compared to grasslands, arable land, or settlements, probably due to their specific habitat and food plant requirements (40). However, they were positively associated with forest edge density, which provides a specific habitat structure and shelter against wind (38), and regions with higher temperatures seemed to limit the presence of some butterfly species to the shady, moist, and more stable conditions of larger forest patches (41). Butterflies are thought to benefit from warm climates (42), and most species need open habitats such as extensively managed grasslands (38). Nevertheless, there is growing evidence that microclimatic conditions can be essential for plants and insects as refuge against warming climates (43), and butterfly richness has been shown to peak at intermediate landscape openness in the cooler boreal zone (38). Our finding therefore adds to previous research that found that the size and connectivity of woodland habitat patches play a role in the persistence of butterfly populations under drought events (24). Similarly, forest loss in warmer regions accelerates species’ movements to higher elevations (44). It is likely that in our study area in Bavaria, southern Germany, butterfly species that are well adapted to relatively warm and dry habitats can best recover from extreme climatic events (23) and persist in those regions with high temperatures and a low proportion of forest (45). Our results underpin the inference that regions dominated by larger proportions of forest can buffer the effects of climate warming to some extent.
The intraregional beta diversity of beetle and bee communities was also explained by climate-land-use interactions. These taxa were the only ones that did not show a higher interregional community homogeneity in warmer regions and that benefited from high temperatures at the regional level (i.e., their gamma diversity was higher in regions with higher temperatures). However, it is important to notice that in regions with high temperatures, lower proportions of forest tended to reduce the intraregional heterogeneity of beetle communities, which points again to the importance of forests as refuge against climate warming. On the other hand, urban areas have the potential to enhance the heterogeneity of bee communities under cool conditions (see also results on bee alpha diversity), while the opposite is the case in urban-dominated regions with warmer temperatures (46). This finding sheds light on the opposing conclusions from previous studies on the impact of cities (13, 14, 47). However, the interpretation of the interaction between temperature and the proportion of urban area is limited to warmer regions where highly urbanized areas were present (see fig. S6).
The intraregional beta diversity of most pollinator communities showed positive responses to low land-use intensity and especially to higher beta diversity of flowering plants, while individual taxa were differently affected by climate. For instance, the beta diversity of butterfly and moth communities was reduced with higher proportions of agricultural area at the regional level, in line with a previous study (25) that showed large areas of intensively managed land to prevent butterfly community reorganization in response to climate change. If climate and land-use change interact to favor the same species [with tolerance for higher temperatures and dry conditions (17)], we can expect further biotic homogenization of communities, which might have negative consequences for ecosystem functioning (48). Moreover, our space-for-time study may overlook further negative effects of climate and land use hidden by potential time lag effects of range-shifting species that could only be detected by long-term studies (30).
Regarding the effects of climate on intraregional beta diversity, spatial temperature and precipitation gradients were differently associated with individual pollinator taxa. In broad terms, regions with higher annual temperature seemed to harbor more homogeneous pollinator communities, while communities were more heterogeneous in regions with higher annual precipitation. Nevertheless, the whole pollinator community and non-syrphid Diptera communities were also highly homogeneous in (probably adverse) cool and rainy regions. It is likely that higher annual temperature allows insects to be more active and disperse across the region (49), making the pool of species more homogeneous. Higher annual precipitation, in contrast, makes pollinator communities more heterogeneous, which may happen because of two contrasting reasons: (i) More humid regions may offer more niches for syrphids and other Diptera (whose gamma diversity increases with annual precipitation), while (ii) they may hamper the dispersion of those groups that are negatively affected by annual precipitation, such as moths. Therefore, some of the most homogeneous pollinator communities occurred in regions with warm temperatures and low precipitation, a result that is further supported by the reduced interregional pollinator beta diversity found in warmer regions compared with cooler ones. Accordingly, climate warming might tend to homogenize pollinator communities in already warm and/or dry areas, and habitat loss or intensification can accelerate this process (17).
On the other hand, the gamma diversity of butterflies was higher in both cool and rainy regions and in warm and dry ones, suggesting that our study area contains butterfly communities well adapted to two contrasting climates. This can mean that ongoing changes in climate, with increasing temperatures and decreasing summer precipitation (50, 51), may mostly affect butterflies from cool and rainy climates, while butterflies from warm climates, which are dependent on the presence of forests (as discussed above), may mostly be threatened by land-use change (42).
The alpha diversity of all pollinator taxa was solely explained by additive effects of climate and land use, mostly at the local scale. The richness of all pollinator groups (except butterflies) was strongly determined by the habitat type, being higher in forest habitats independently of the local temperature. In Central Europe, forests are the most natural habitats, and forest clearings as the ones used in this study have already been identified as important habitats for many species (52). Forests may be more resilient than other habitat types to global change drivers (1), provide favorable microclimatic conditions (41), and are mostly free of pesticides and other agricultural inputs (53). Besides, forest edges provide specific resources for different flower-visiting insects, such as nesting, mating, and oviposition sites (38, 54). This could explain their importance for pollinator diversity at regional and local scales, and for community heterogeneity. Furthermore, the low bee richness found in grassland habitats compared to forest habitats may be explained by the fact that forest clearings offer additional resources not typically found in managed grassland habitats (see fig. S7 and table S8). It is also possible that the dry and warm summer 2019 had an influence on the higher insect diversity found in forest habitats. Such dry and warm conditions fit with future climate predictions (50), suggesting that forest clearings are important refuge habitats for open habitat pollinator species that could mitigate adverse effects of climate change.
Apart from habitat type, flowering-plant richness contributed to support a high local diversity of most pollinator taxa. Our study underpins that the loss of food resources caused by land-use change and intensification is among the drivers of insect decline (55), independently of other land-use and climatic factors.
Although local scale factors were most important for pollinator alpha diversity, the proportion of certain land-use types in the surrounding landscape also played a role (1): Non-syrphid Diptera and moth alpha diversity were negatively correlated with a high proportion of agricultural (i.e., cropland) and grassland area, respectively, while urban-dominated landscapes increased bee alpha diversity. Cropland is assumed to have a negative impact on insect communities (1), but land-use intensity in grasslands, which involves frequent fertilizer applications and mowing, is also known to affect sensitive insects, such as moths (56). On the other hand, the positive effect of urban landscapes on bee alpha diversity [also found by (13, 14) in contrast to (47)] may be explained by the varied nesting resources (14) and high (exotic) flowering-plant species richness provided by these habitats, which generalist flower visitors such as bees are able to exploit (14).
The proportion of different land-use types was more important than landscape diversity or configuration. Only butterfly alpha diversity, which was not affected by habitat type or the proportion of land-use types in the landscape, increased slightly with higher landscape connectivity (i.e., edge density) (57). It is possible that a higher spatial resolution would be needed to uncover landscape diversity or configuration effects, because due to the large area covered by our study, we only used six land-cover classes and their total edge density (see Materials and Methods). On the other hand, our study design comprised dominant habitat types, which excludes the highly specialist fauna in the 2.3% protected areas (58) that can be expected to suffer most from habitat isolation.
Last, although the local temperature (i.e., the microclimate measured in the plot) was less important than the habitat type for the local pollinator diversity, and its effect was weaker than that of the macroclimate for the regional pollinator diversity, it still had an effect on bees, moths, and syrphids. The alpha diversity of both bees and moths increased with higher microclimatic temperatures. Bees were also positively associated with temperature at the regional level in areas with low annual precipitation, being the taxa that benefited most from high temperatures (15) [but see discussion on intraregional beta diversity and (31)]. Moths, on the other hand, are nocturnal or crepuscular species that are less likely to face stress-inducing high temperatures (59), so it is less surprising that warmer spring and summer microclimates favor their diversity. In contrast, the richness of syrphid flies was negatively correlated with higher microclimatic temperatures, suggesting that syrphids may be more vulnerable to current climate warming than other pollinator taxa.
Limitations of the study
Empirical ecological studies dealing with large climate and land-use gradients are scarce due to their logistical complexity and high financial costs. Our study would have benefited from using an even larger area (i.e., the entire Germany or the entire Europe), containing large cities in cooler areas, and several sampling seasons. Nevertheless, summer 2019 was warm and dry in our region, being a good representation of future climatic predictions (50).
As in all insect diversity studies, potential limitations of the used sampling method must be considered. Malaise traps are a very effective, passive catching method, which is not biased by observers and can collect both diurnal and nocturnal insects. Although their effectiveness for capturing different insect taxa is still controversial (60), we collected a relatively high proportion of the different pollinator groups with Malaise traps (see Results). This is especially true when considering that many insect species listed for Bavaria are scarce, have very specific habitat requirements, and are restricted to protected areas [see, e.g., (39)], which were not covered by our study sites. Hence, our results underscore the effectiveness of this trapping method for standardized biodiversity assessments of pollinating insects (see Supplementary Text for additional information on the suitability of Malaise traps to capture different flower-visiting insects).
Identifying some insect groups morphologically rather than with DNA metabarcoding would possibly have yielded more accurate results, but metabarcoding is extremely suitable for large sample sizes and taxa like Diptera with limited taxonomic expertise (61). To reduce common metabarcoding issues such as species richness inflation and an unbalanced identification of different taxonomic groups, we used barcode index numbers (BINs) instead of operational taxonomic units (OTUs) as a surrogate of species richness (62).
In conclusion, our study disentangles the interactive effects of climate and land use on pollinator communities in different habitats and landscape types, at several spatial scales and for multiple flower-visiting taxa. At the regional level, climate-land-use interactions influenced pollinator community composition as well as the regional species richness (gamma diversity) and intraregional dissimilarity in species composition (beta diversity) of some pollinator taxa. At the local level, species richness (alpha diversity) was affected by their additive effects. These findings highlight the importance of considering land-use management options at the regional scale to lessen the impacts of climate change on flower-visiting insects. In our study region, this implies preserving forest areas to mitigate extreme climatic events (63), because our results support that regions with a high proportion of forest are underestimated in their potential to offer buffering microclimatic conditions for pollinating insects in the temperate zone (52). Together with forest habitats (or low-intensity land use), the diversity of flowering plants can increase the diversity of all pollinator taxa across spatial scales. Thus, measures to enhance the richness, abundance, and temporal continuity of flowering-plant resources in different habitat types are imperative to promote pollinators and thus to increase the adaptive capacity of ecosystems to a changing climate (61).
We also demonstrate that considering interactions between temperature and precipitation is important to understanding the richness and turnover of pollinator communities. Future climate in the temperate zone is expected to be increasingly warm and dry in summer as a consequence of climate and land-use change (50, 51), conditions that in our study contributed to the homogenization of pollinator communities.
Our findings reveal interactions among climate and land use that differ among pollinator taxa and underpin the positive role of forest habitats for mitigating impacts of future climate change on pollinator diversity and their essential ecosystem services.
MATERIALS AND METHODS
Study area and study design
The study was conducted in Bavaria (southern Germany) from May to July 2019. To understand how the interaction between climate and land use shapes pollinator communities at different spatial scales, we selected 60 regions of 5.8 km × 5.8 km across Bavaria along two independent gradients of climate (five climate zones: <7.5°C, 7.5° to 8.0°C, 8.0° to 8.5°C, 8.5° to 9.0°C, and <9.0°C) and land-use intensity (three land uses: seminatural, agricultural, and urban), resulting in 15 climate-land-use combinations with a total of four replicates (Fig. 1). The gradient of climate was defined based on the 30-year multiannual mean air temperature from 1981 to 2010 (51). The regional land use was classified based on Corine land-cover data from 2012, and the three land-use classes were defined according to the following criteria: Seminatural regions have >85% natural vegetation and at least 50% forest, agricultural regions have >40% arable fields, and urban regions have at least 14% of urban area. A more detailed explanation of the site selection process can be found in (64).
In each of the 60 regions, experimental plots were established in open herbaceous vegetation embedded in the three dominant habitat types of the region (out of four possible types: forest, grassland, arable land, or settlement). This resulted in 179 plots (one of the intended 180 plots could not be established because of logistical reasons). Selected local habitats had a minimum size of 0.5 ha. In each plot, we established a core area to set up the insect traps. The core area was a 30 m × 3 m strip of herbaceous vegetation in the center of the habitat (or next to it in the case of arable plots) that was left unmanaged for the duration of the experiment (see Fig. 1 and fig. S9 for plot pictures).
We established the traps at least 50 m away from other habitat types and main roads, whenever possible. In forest plots, we established the traps in forest clearings (with a minimum diameter of the surrounding trees’ height), at least 50 m away from the forest edge. The grasslands selected were mostly extensively managed meadows rather than intensively managed grasslands, and we established agricultural plots next to oilseed rape. When no oilseed rape was available in the landscape, we chose wheat or maize fields. Urban plots were established in urban meadows, parks, private gardens, and cemeteries but never within urban forest.
Climate and land-use variables, flowering-plant diversity, and plot microclimate (local temperature)
For analyses at the regional level, we used the multiannual mean temperature (4.5° to 10°C) and precipitation values (590 to 1987 mm) used for region selection, and we calculated the proportion of forest, grassland, agriculture (arable land), and urban area in the region. At the landscape scale, we quantified composition and configuration of the surrounding landscape in a 1-km radius buffer for each of the 179 plots. Landscape variables at this scale were calculated from a detailed land-cover map created by the combination of three different maps: ATKIS 2019 land cover (German Official Topographic Cartographic Information System), Invekos 2019 (Integrated Management and Control System), and Corine 2018. Land cover was categorized into six classes: natural, forest, grassland, agriculture, urban, and fresh water. For landscape composition, we calculated the proportion of forest, grassland, agriculture, and urban area in the 1-km radius buffer around plots and the Shannon diversity index based on the six land-cover classes. Landscape configuration was measured as the total edge density, i.e., total length of ecotones between land-cover classes in the buffer.
To assess resource availability for flower-visiting insects, we estimated the total number of angiosperm species in a 200-m buffer radius around the study plots. Map-based predefined transects were walked, and all species found were recorded. The effective sampling time per plot was 60 min, and the sampling time was distributed proportionally to the relative area cover (%) of present habitat types. Only habitat types or land uses with a cover of more than 10% were considered (i.e., equal to or more than 6 min).
In addition, we recorded temperature in the plots with ibutton thermologgers (type DS1923). Thermologgers were attached to a wooden pole at 1.1 m height, facing north and protected from the sun by a wooden panel. Temperature was recorded every hour during the whole sampling season.
Assessment of flower-visiting insects
We surveyed pollinator communities with Malaise traps (smaller version of Townes Malaise trap model with black roof; dimensions of capture area: height front of 0.90 m, height rear of 0.60 m, and length of 1.60 m), using ethanol (80%) to preserve the insect DNA. Malaise traps are a well-suited tool for studying flower-visiting insect communities, because they capture both diurnal and nocturnal flying insects. Traps were maintained regularly to ensure that the entrance was not blocked by vegetation. See fig. S9 and Supplementary Text for further information on the placement of Malaise traps within habitats and their suitability to capture different flower-visiting insects.
Traps were activated once a month, from May to July, and collected after a 2-week period. We collected a total of three samples per site (in the second half of May, June, and July) that were pooled together for analyses, because we were interested in the total richness per site and not in differences in phenology. Three of 537 samples, belonging to three different plots, were damaged. Thus, 534 samples were analyzed. Arthropods were collected with the per-mission and ethical approval of the nature conservation authorities of the governments Upper Franconia, Lower Franconia, Middle Franconia, Lower Bavaria, Upper Bavaria, Swabia, and Upper Palatinate, and we complied with all relevant ethical regulations for animal handling and research.
Processing of Malaise trap samples
Because of the large number of samples collected, species were identified through CO1-5P (mitochondrial cytochrome oxidase 1) DNA metabarcoding, following the methods described in (65). BINs were used as a measure of species richness, as they are more reliable than OTUs for obtaining a balanced identification of different taxonomic groups independently of existing classifications, and better to be used as a surrogate of species richness (62). We used the BOLD (Barcode of Life Data System) taxa assignment database, and all sequences with amplicon overlap lower than 97% (a value of species identity accuracy) were excluded to ensure the reliability of the results (66). For full protocols of the molecular work and bioinformatic procedures, see (67).
Selection of flower-visiting insect communities
We divided flower-visiting insects into seven groups: bees, other Hymenoptera, butterflies, moths, syrphid flies, other Diptera, and beetles. “Other Hymenoptera” includes all families of flower-visiting hunting and parasitoid wasps and sawflies. “Butterflies” includes all butterfly families plus the moth families in which all species are known to be diurnal (Choreutidae, Micropterigidae, Scythrydidae, Sesiidae, and Zygaenidae). We preferred this classification because we expected climate and land-use gradients to have a larger influence on lepidopteran insects depending on their behavior than on the morphological characteristics that differentiate butterflies and moths. To decide which families in these categories are flower visitors, we did online searches and looked for information in books and scientific literature. Besides, as (68) suggests, we checked whether it was common to find pictures of certain insect families in the process of feeding on pollen or nectar. Although we based our decisions at the family level for most groups, we could identify flower-visiting Coleoptera (beetles) to the genus level following expert advice.
Calculation of gamma, intraregional beta, and alpha diversity
We analyzed the effect of the interaction between climate and land-use variables on the gamma, intraregional beta, and alpha diversity of the seven flower-visitor communities (Fig. 1). Gamma diversity is the total species richness in a region, intraregional beta diversity was calculated as the dissimilarity in species composition among the three plots of a region, and alpha diversity is the total species richness per plot. The dissimilarity in species composition was estimated using the Jaccard’s dissimilarity index (69, 70)
where a is the number of species shared between two plots, b is the number of unique species in the first plot, and c is the number of unique species in the second plot. We calculated the pairwise dissimilarity values between plots before averaging them to get a regional dissimilarity value.
Statistical analysis
Statistical analyses were conducted using R version 4.0.2 (71). We first checked with the betadisper function [vegan package (72)] whether the interregional heterogeneity (interregional beta diversity) of the different pollinator taxa varied among regional land-use types, with higher temperature or with the interaction between both variables. For this, we first transformed the multiannual mean temperature, a continuous variable, into a factor with two levels separated by the median: cool regions, with a multiannual mean temperature between 5.60° and 8.36°C, and warm regions, with a multiannual mean temperature between 8.37° and 9.80°C. Then, we created a factor with six levels to represent the interaction between regional land use (three levels) and multiannual mean temperature (two levels). Subsequently, we assessed with permutational multivariate analysis of variance (PERMANOVA) tests [adonis function in the vegan package (72)], and using Jaccard distances, whether pollinator communities were shaped by the interaction between multiannual mean temperature and regional land use. To plot ordinations based on nonmetric multidimensional scaling (NMDS) of Jaccard’s dissimilarity matrices (Fig. 2), the metaMDS function in the vegan package was used.
All gamma diversity models (n = 60) were analyzed through generalized linear models (GLMs) with a Poisson or a negative binomial error distribution when Poisson models showed overdispersion. Intraregional beta diversity models (n = 60) were analyzed with linear models (LMs), and alpha diversity models (n = 175) were analyzed with generalized linear mixed models [GLMMs; glmmTMB function in the glmmTMB package (73)], with a Poisson or a negative binomial error distribution and the term “region” included as random effect. Alpha diversity models included 175 samples instead of 179 because four thermologgers failed to record temperature. We considered adding an offset with the trap exposure time in the gamma and alpha diversity models to account for the 3 (of 537) samples missing, but we decided to exclude it because (i) the fit of the models was significantly worse, (ii) there was no clear correlation between exposure time and species richness, and (iii) the missing samples were only 0.6% of the data.
Gamma and intraregional beta diversity models (Eq. 1) included the multiannual mean temperature [MAT] and precipitation [MAP] at the regional scale (5.8 km × 5.8 km), the proportion of forest [For], grassland [Gra], agriculture [Agr], and urban [Urb] area in the whole region, and the gamma or beta diversity (respectively) of flowering-plant communities [Flower γ or β]. We also included the interaction between temperature and precipitation, and temperature and regional land-use covers. Some of the regional variables included in the models were moderately correlated (maximum correlation between For and Agr: Pearson’s r = −0.55, fig. S8), and including the proportion of all different land-use covers caused multicollinearity issues [variance inflation factor (VIF) > 10 (74), calculated with the performance package (75)]. Therefore, we always fitted two separate models, one excluding the proportion of forest and one excluding the proportion of urban. None of the gamma, beta, or alpha diversity models had a VIF > 2.61, despite the presence of interactions that usually inflate VIF values
| (1) |
| (2) |
Alpha diversity models (Eq. 2) included the interaction between microclimatic temperature [T] and the local habitat type as factor with four levels (forest, grassland, arable land, and settlement) [Habitat], the Shannon diversity index on landscape composition [Shannon], the edge density reflecting landscape configuration [EdgeD], the proportion of forest [For], grassland [Gra], agriculture [Agr], and urban [Urb] area at the landscape scale [1-km radius (1, 76)], and the alpha diversity of flowering-plant communities [Flower α]. At the landscape level, we had the same multicollinearity issue than at the regional level when including the proportion of all different land-use covers. Besides, the Shannon diversity index was correlated with edge density (Pearson’s r = 0.88, fig. S8). Thus, we fitted separate models excluding the proportion of forest or the proportion of urban in the landscape, and including the Shannon diversity index or edge density. Therefore, we fitted four different models for each insect community.
Because of the unexpected importance of the proportion of forest area in interaction with annual temperature for butterfly gamma diversity, we aimed to understand whether this strong relationship was driven by effects of forest edge density. First, we looked for correlations between forest cover and forest edge density (Pearson’s r = −0.052), and then we refitted the butterfly gamma diversity model including total edge density and forest edge density as additional variables.
Before running the models, covariates were centered and scaled to allow for interpretation of main effects when interactions are present (77), and for comparison among variables of the different gamma, beta, and alpha diversity models (18). All possible models were compared via the dredge function [MuMIn package (78)], and we selected the simplest ones among those with a difference in AICc < 2. We then compared the best models among those containing different variables because of correlation problems. The fit of the models was checked with the DHARMa package (79).
Acknowledgments
We would like to thank all landowners for letting us use their fields and gardens. Special thanks to B. Krischke, S. Schiele, G. Grimmer, J. Weber, A. Puschmann, D. Petrovic, L. Krämer, K. Meßlinger, and S. Sebald for field and laboratory support and to F. Boetzl for providing expert advice on flower-visiting Coleoptera. We are grateful to O. Schweiger and an anonymous reviewer whose comments substantially improved the quality of the manuscript. Metabarcoding was conducted by AIM (Advanced Identification Methods GmbH).
Funding: This work was supported by the Bavarian Ministry of Science and Arts grant to Bavarian Climate Research Network (bayklif), project LandKlif (to I.S.-D.) (https://bayklif.de/; https://landklif.biozentrum.uni-wuerzburg.de/). This publication was supported by the Open Access Publication Fund of the University of Würzburg.
Author contributions: Conceptualization: I.S.-D., S.R., M.K.P., and C.G. Methodology: I.S.-D., S.R., J.Z., J.U., J.M., C.T., S.R.-B., J.Ew., and J.K. Data collection: C.S.B., J.En., U.F., C.G., M.H., S.R., R.R., S.R.-B., C.T., J.U., and L.U. Data analysis: C.G. Writing—original draft: C.G. Writing—review and editing: C.G., I.S.-D., S.R., M.K.P., C.S.B., J.En., U.F., M.H., R.R., S.R.-B., C.T., J.U., L.U., J.M., J.Ew., and J.K.
Competing interests: The authors declare that they have no competing interests.
Data and materials availability: The data that support the findings of this study are publicly available on Zenodo: https://doi.org/10.5281/zenodo.6375305. The R script for summary statistics and to generate the graphs is publicly available on Zenodo: https://doi.org/10.5281/zenodo.6376395.
Supplementary Materials
This PDF file includes:
Supplementary Text
Tables S1 to S8
Figs. S1 to S9
References
REFERENCES AND NOTES
- 1.Seibold S., Gossner M. M., Simons N. K., Blüthgen N., Müller J., Ambarlı D., Ammer C., Bauhus J., Fischer M., Habel J. C., Linsenmair K. E., Nauss T., Penone C., Prati D., Schall P., Schulze E.-D., Vogt J., Wöllauer S., Weisser W. W., Arthropod decline in grasslands and forests is associated with landscape-level drivers. Nature 574, 671–674 (2019). [DOI] [PubMed] [Google Scholar]
- 2.van Klink R., Bowler D. E., Gongalsky K. B., Swengel A. B., Gentile A., Chase J. M., Meta-analysis reveals declines in terrestrial but increases in freshwater insect abundances. Science 368, 417–420 (2020). [DOI] [PubMed] [Google Scholar]
- 3.Dainese M., Martin E. A., Aizen M. A., Albrecht M., Bartomeus I., Bommarco R., Carvalheiro L. G., Chaplin-Kramer R., Gagic V., Garibaldi L. A., Ghazoul J., Grab H., Jonsson M., Karp D. S., Kennedy C. M., Kleijn D., Kremen C., Landis D. A., Letourneau D. K., Marini L., Poveda K., Rader R., Smith H. G., Tscharntke T., Andersson G. K. S., Badenhausser I., Baensch S., Bezerra A. D. M., Caballero-Lopez B., Cavigliasso P., Classen A., Cusser S., Dudenhöffer J. H., Ekroos J., Fijen T., Franck P., Freitas B. M., Garratt M. P. D., Gratton C., Hipólito J., Holzschuh A., Hunt L., Iverson A. L., Jha S., Keasar T., Kim T. N., Kishinevsky M., Klatt B. K., Klein A.-M., Krewenka K. M., Krishnan S., Larsen A. E., Lavigne C., Liere H., Maas B., Mallinger R. E., Pachon E. M., Martínez-Salinas A., Meehan T. D., Mitchell M. G. E., Molina G. A. R., Nesper M., Nilsson L., O’Rourke M. E., Peters M. K., Ple M., De L. Ramos D., Rosenheim J. A., Rundlöf M., Rusch A., Sáez A., Scheper J., Schleuning M., Schmack J. M., Sciligo A. R., Seymour C., Stanley D. A., Stewart R., Stout J. C., Sutter L., Takada M. B., Taki H., Tamburini G., Tschumi M., Viana B. F., Westphal C., Willcox B. K., Wratten S. D., Yoshioka A., Zaragoza-Trello C., Zhang W., Zou Y., Steffan-Dewenter I., A global synthesis reveals biodiversity-mediated benefits for crop production. Sci. Adv. 5, eaax0121 (2019). [DOI] [PMC free article] [PubMed] [Google Scholar]
- 4.Ollerton J., Winfree R., Tarrant S., How many flowering plants are pollinated by animals? Oikos 120, 321–326 (2011). [Google Scholar]
- 5.Klein A.-M., Vaissière B. E., Cane J. H., Steffan-Dewenter I., Cunningham S. A., Kremen C., Tscharntke T., Importance of pollinators in changing landscapes for world crops. Proc. R. Soc. B 274, 303–313 (2007). [DOI] [PMC free article] [PubMed] [Google Scholar]
- 6.Potts S. G., Imperatriz-Fonseca V., Ngo H. T., Aizen M. A., Biesmeijer J. C., Breeze T. D., Dicks L. V., Garibaldi L. A., Hill R., Settele J., Vanbergen A. J., Safeguarding pollinators and their values to human well-being. Nature 540, 220–229 (2016). [DOI] [PubMed] [Google Scholar]
- 7.Jauker F., Bondarenko B., Becker H. C., Steffan-Dewenter I., Pollination efficiency of wild bees and hoverflies provided to oilseed rape. Agric. For. Entomol. 14, 81–87 (2012). [Google Scholar]
- 8.Rader R., Bartomeus I., Garibaldi L. A., Garratt M. P. D., Howlett B. G., Winfree R., Cunningham S. A., Mayfield M. M., Arthur A. D., Andersson G. K. S., Bommarco R., Brittain C., Carvalheiro L. G., Chacoff N. P., Entling M. H., Foully B., Freitas B. M., Gemmill-Herren B., Ghazoul J., Griffin S. R., Gross C. L., Herbertsson L., Herzog F., Hipólito J., Jaggar S., Jauker F., Klein A.-M., Kleijn D., Krishnan S., Lemos C. Q., Lindström S. A. M., Mandelik Y., Monteiro V. M., Nelson W., Nilsson L., Pattemore D. E., De O. Pereira N., Pisanty G., Potts S. G., Reemer M., Rundlöf M., Sheffield C. S., Scheper J., Schüepp C., Smith H. G., Stanley D. A., Stout J. C., Szentgyörgyi H., Taki H., Vergara C. H., Viana B. F., Woyciechowski M., Non-bee insects are important contributors to global crop pollination. Proc. Natl. Acad. Sci. U.S.A. 113, 146–151 (2016). [DOI] [PMC free article] [PubMed] [Google Scholar]
- 9.Sánchez-Bayo F., Wyckhuys K. A. G., Worldwide decline of the entomofauna: A review of its drivers. Biol. Conserv. 232, 8–27 (2019). [Google Scholar]
- 10.Senapathi D., Goddard M. A., Kunin W. E., Baldock K. C. R., Landscape impacts on pollinator communities in temperate systems: Evidence and knowledge gaps. Funct. Ecol. 31, 26–37 (2017). [Google Scholar]
- 11.Bae S., Heidrich L., Levick S. R., Gossner M. M., Seibold S., Weisser W. W., Magdon P., Serebryanyk A., Bässler C., Schäfer D., Schulze E., Doerfler I., Müller J., Jung K., Heurich M., Fischer M., Roth N., Schall P., Boch S., Wöllauer S., Renner S. C., Müller J., Dispersal ability, trophic position and body size mediate species turnover processes: Insights from a multi-taxa and multi-scale approach. Divers. Distrib. 27, 439–453 (2021). [Google Scholar]
- 12.Gossner M. M., Lewinsohn T. M., Kahl T., Grassein F., Boch S., Prati D., Birkhofer K., Renner S. C., Sikorski J., Wubet T., Arndt H., Baumgartner V., Blaser S., Blüthgen N., Börschig C., Buscot F., Diekötter T., Jorge L. R., Jung K., Keyel A. C., Klein A.-M., Klemmer S., Krauss J., Lange M., Müller J., Overmann J., Pašalić E., Penone C., Perović D. J., Purschke O., Schall P., Socher S. A., Sonnemann I., Tschapka M., Tscharntke T., Türke M., Venter P. C., Weiner C. N., Werner M., Wolters V., Wurst S., Westphal C., Fischer M., Weisser W. W., Allan E., Land-use intensification causes multitrophic homogenization of grassland communities. Nature 540, 266–269 (2016). [DOI] [PubMed] [Google Scholar]
- 13.Theodorou P., Radzevičiūtė R., Lentendu G., Kahnt B., Husemann M., Bleidorn C., Settele J., Schweiger O., Grosse I., Wubet T., Murray T. E., Paxton R. J., Urban areas as hotspots for bees and pollination but not a panacea for all insects. Nat. Commun. 11, 576 (2020). [DOI] [PMC free article] [PubMed] [Google Scholar]
- 14.Baldock K. C. R., Goddard M. A., Hicks D. M., Kunin W. E., Mitschunas N., Osgathorpe L. M., Potts S. G., Robertson K. M., Scott A. V., Stone G. N., Vaughan I. P., Memmott J., Where is the UK’s pollinator biodiversity? The importance of urban areas for flower-visiting insects. Proc. R. Soc. B 282, 20142849 (2015). [DOI] [PMC free article] [PubMed] [Google Scholar]
- 15.Kühsel S., Blüthgen N., High diversity stabilizes the thermal resilience of pollinator communities in intensively managed grasslands. Nat. Commun. 6, 7989 (2015). [DOI] [PMC free article] [PubMed] [Google Scholar]
- 16.Oliver T. H., Morecroft M. D., Interactions between climate change and land use change on biodiversity: Attribution problems, risks, and opportunities. WIREs Clim. Chang. 5, 317–335 (2014). [Google Scholar]
- 17.Williams J. J., Newbold T., Local climatic changes affect biodiversity responses to land use: A review. Divers. Distrib. 26, 76–92 (2020). [Google Scholar]
- 18.Halsch C. A., Shapiro A. M., Fordyce J. A., Nice C. C., Thorne J. H., Waetjen D. P., Forister M. L., Insects and recent climate change. Proc. Natl. Acad. Sci. U.S.A. 118, e2002543117 (2021). [DOI] [PMC free article] [PubMed] [Google Scholar]
- 19.Hannah L., Steele M., Fung E., Imbach P., Flint L., Flint A., Climate change influences on pollinator, forest, and farm interactions across a climate gradient. Clim. Change 141, 63–75 (2017). [Google Scholar]
- 20.Marshall L., Biesmeijer J. C., Rasmont P., Vereecken N. J., Dvorak L., Fitzpatrick U., Francis F., Neumayer J., Ødegaard F., Paukkunen J. P. T., Pawlikowski T., Reemer M., Roberts S. P. M., Straka J., Vray S., Dendoncker N., The interplay of climate and land use change affects the distribution of EU bumblebees. Glob. Chang. Biol. 24, 101–116 (2018). [DOI] [PubMed] [Google Scholar]
- 21.Revilla T. A., Encinas-Viso F., Loreau M., Robustness of mutualistic networks under phenological change and habitat destruction. Oikos 124, 22–32 (2015). [Google Scholar]
- 22.Hill J. K., Collingham Y. C., Thomas C. D., Blakeley D. S., Fox R., Moss D., Huntley B., Impacts of landscape structure on butterfly range expansion. Ecol. Lett. 4, 313–321 (2001). [Google Scholar]
- 23.Oliver T. H., Marshall H. H., Morecroft M. D., Brereton T., Prudhomme C., Huntingford C., Interacting effects of climate change and habitat fragmentation on drought-sensitive butterflies. Nat. Clim. Chang. 5, 941–945 (2015). [Google Scholar]
- 24.Oliver T. H., Brereton T., Roy D. B., Population resilience to an extreme drought is influenced by habitat area and fragmentation in the local landscape. Ecography 36, 579–586 (2013). [Google Scholar]
- 25.Oliver T. H., Gillings S., Pearce-Higgins J. W., Brereton T., Crick H. Q. P., Duffield S. J., Morecroft M. D., Roy D. B., Large extents of intensive land use limit community reorganization during climate warming. Glob. Chang. Biol. 23, 2272–2283 (2017). [DOI] [PMC free article] [PubMed] [Google Scholar]
- 26.Peters M. K., Hemp A., Appelhans T., Becker J. N., Behler C., Classen A., Detsch F., Ensslin A., Ferger S. W., Frederiksen S. B., Gebert F., Gerschlauer F., Gütlein A., Helbig-Bonitz M., Hemp C., Kindeketa W. J., Kühnel A., Mayr A. V., Mwangomo E., Ngereza C., Njovu H. K., Otte I., Pabst H., Renner M., Röder J., Rutten G., Schellenberger Costa D., Sierra-Cornejo N., Vollstädt M. G. R., Dulle H. I., Eardley C. D., Howell K. M., Keller A., Peters R. S., Ssymank A., Kakengi V., Zhang J., Bogner C., Böhning-Gaese K., Brandl R., Hertel D., Huwe B., Kiese R., Kleyer M., Kuzyakov Y., Nauss T., Schleuning M., Tschapka M., Fischer M., Steffan-Dewenter I., Climate–land-use interactions shape tropical mountain biodiversity and ecosystem functions. Nature 568, 88–92 (2019). [DOI] [PubMed] [Google Scholar]
- 27.Aguirre-Gutiérrez J., Kissling W. D., Biesmeijer J. C., WallisDeVries M. F., Reemer M., Carvalheiro L. G., Historical changes in the importance of climate and land use as determinants of Dutch pollinator distributions. J. Biogeogr. 44, 696–707 (2017). [Google Scholar]
- 28.Duchenne F., Thébault E., Michez D., Gérard M., Devaux C., Rasmont P., Vereecken N. J., Fontaine C., Long-term effects of global change on occupancy and flight period of wild bees in Belgium. Glob. Change Biol. 26, 6753–6766 (2020). [DOI] [PubMed] [Google Scholar]
- 29.Kammerer M., Goslee S. C., Douglas M. R., Tooker J. F., Grozinger C. M., Wild bees as winners and losers: Relative impacts of landscape composition, quality, and climate. Glob. Chang. Biol. 27, 1250–1265 (2021). [DOI] [PMC free article] [PubMed] [Google Scholar]
- 30.Kerr J. T., Pindar A., Galpern P., Packer L., Potts S. G., Roberts S. M., Rasmont P., Schweiger O., Colla S. R., Richardson L. L., Wagner D. L., Gall L. F., Sikes D. S., Pantoja A., Climate change impacts on bumblebees converge across continents. Science 349, 177–180 (2015). [DOI] [PubMed] [Google Scholar]
- 31.Papanikolaou A. D., Kühn I., Frenzel M., Schweiger O., Semi-natural habitats mitigate the effects of temperature rise on wild bees. J. Appl. Ecol. 54, 527–536 (2017). [Google Scholar]
- 32.Graae B. J., De Frenne P., Kolb A., Brunet J., Chabrerie O., Verheyen K., Pepin N., Heinken T., Zobel M., Shevtsova A., Nijs I., Milbau A., On the use of weather data in ecological studies along altitudinal and latitudinal gradients. Oikos 121, 3–19 (2012). [Google Scholar]
- 33.Frishkoff L. O., Karp D. S., Flanders J. R., Zook J., Hadly E. A., Daily G. C., M’Gonigle L. K., Climate change and habitat conversion favour the same species. Ecol. Lett. 19, 1081–1090 (2016). [DOI] [PubMed] [Google Scholar]
- 34.Williams A. P., Cook E. R., Smerdon J. E., Cook B. I., Abatzoglou J. T., Bolles K., Baek S. H., Badger A. M., Livneh B., Large contribution from anthropogenic warming to an emerging North American megadrought. Science 368, 314–318 (2020). [DOI] [PubMed] [Google Scholar]
- 35.Pyke C. R., Habitat loss confounds climate change impacts. Front. Ecol. Environ. 2, 178–182 (2004). [Google Scholar]
- 36.Zoologischen Staatssammlung München, Checklisten der Tierarten Bayerns, DNA-Barcoding an der Zoologischen Staatssammlung München (Zoologischen Staatssammlung München, 2022); www.barcoding-zsm.de/bayernfauna.
- 37.von der Dunk K., Syrphidae of Bavaria—An annotated checklist. Beiträge zur Bayerischen Entomofaunistik 7, 97–114 (2005). [Google Scholar]
- 38.Kuussaari M., Heliölä J., Luoto M., Pöyry J., Determinants of local species richness of diurnal Lepidoptera in boreal agricultural landscapes. Agric. Ecosyst. Environ. 122, 366–376 (2007). [Google Scholar]
- 39.G. Jia, E. Shevliakova, P. Artaxo, N. D. Noblet-Ducoudré, R. Houghton, J. House, K. Kitajima, C. Lennard, A. Popp, A. Sirin, R. Sukumar, L. Verchot, Land–climate interactions, in Climate Change and Land: an IPCC special report on climate change, desertification, land degradation, sustainable land management, food security, and greenhouse gas fluxes in terrestrial ecosystems, P. R. Shukla, J. Skea, E. Calvo Buendia, V. Masson-Delmotte, H.-O. Pörtner, D. C. Roberts, P. Zhai, R. Slade, S. Connors, R. van Diemen, M. Ferrat, E. Haughey, S. Luz, S. Neogi, M. Pathak, J. Petzold, J. Portugal Pereira, P. Vyas, E. Huntley, K. Kissick, M. Belkacemi, J. Malley, Eds. (IPCC, 2019), chap. 2; https://www.ipcc.ch/site/assets/uploads/2019/11/05_Chapter-2.pdf.
- 40.Nakadai R., Hashimoto K., Iwasaki T., Sato Y., Geographical co-occurrence of butterfly species: The importance of niche filtering by host plant species. Oecologia 186, 995–1005 (2018). [DOI] [PubMed] [Google Scholar]
- 41.De Frenne P., Zellweger F., Rodríguez-Sánchez F., Scheffers B. R., Hylander K., Luoto M., Vellend M., Verheyen K., Lenoir J., Global buffering of temperatures under forest canopies. Nat. Ecol. Evol. 3, 744–749 (2019). [DOI] [PubMed] [Google Scholar]
- 42.Stefanescu C., Torre I., Jubany J., Páramo F., Recent trends in butterfly populations from north-east Spain and Andorra in the light of habitat and climate change. J. Insect Conserv. 15, 83–93 (2011). [Google Scholar]
- 43.Suggitt A. J., Wilson R. J., Isaac N. J. B., Beale C. M., Auffret A. G., August T., Bennie J. J., Crick H. Q. P., Duffield S., Fox R., Hopkins J. J., Macgregor N. A., Morecroft M. D., Walker K. J., Maclean I. M. D., Extinction risk from climate change is reduced by microclimatic buffering. Nat. Clim. Chang. 8, 713–717 (2018). [Google Scholar]
- 44.Guo F., Lenoir J., Bonebrake T. C., Land-use change interacts with climate to determine elevational species redistribution. Nat. Commun. 9, 1315 (2018). [DOI] [PMC free article] [PubMed] [Google Scholar]
- 45.Fourcade Y., WallisDeVries M. F., Kuussaari M., Swaay C. A. M., Heliölä J., Öckinger E., Habitat amount and distribution modify community dynamics under climate change. Ecol. Lett. 24, 950–957 (2021). [DOI] [PubMed] [Google Scholar]
- 46.Hamblin A. L., Youngsteadt E., Frank S. D., Wild bee abundance declines with urban warming, regardless of floral density. Urban Ecosyst. 21, 419–428 (2018). [Google Scholar]
- 47.Deguines N., Julliard R., Flores M., Fontaine C., Functional homogenization of flower visitor communities with urbanization. Ecol. Evol. 6, 1967–1976 (2016). [DOI] [PMC free article] [PubMed] [Google Scholar]
- 48.García F. C., Bestion E., Warfield R., Yvon-Durocher G., Changes in temperature alter the relationship between biodiversity and ecosystem functioning. Proc. Natl. Acad. Sci. U.S.A. 115, 10989–10994 (2018). [DOI] [PMC free article] [PubMed] [Google Scholar]
- 49.Cormont A., Malinowska A. H., Kostenko O., Radchuk V., Hemerik L., WallisDeVries M. F., Verboom J., Effect of local weather on butterfly flight behaviour, movement, and colonization: Significance for dispersal under climate change. Biodivers. Conserv. 20, 483–503 (2011). [Google Scholar]
- 50.Leduc M., Mailhot A., Frigon A., Martel J.-L., Ludwig R., Brietzke G. B., Giguère M., Brissette F., Turcotte R., Braun M., Scinocca J., The ClimEx Project: A 50-member ensemble of climate change projections at 12-km resolution over Europe and Northeastern North America with the Canadian Regional Climate Model (CRCM5). J. Appl. Meteorol. Climatol. 58, 663–693 (2019). [Google Scholar]
- 51.Deutscher Wetterdienst, Multi-Year Temperature and Precipitation Data (Deutscher Wetterdienst, 2020); https://opendata.dwd.de.
- 52.Warren M. S., Maes D., van Swaay C. A. M., Goffart P., Van Dyck H., Bourn N. A. D., Wynhoff I., Hoare D., Ellis S., The decline of butterflies in Europe: Problems, significance, and possible solutions. Proc. Natl. Acad. Sci. U.S.A. 118, e2002551117 (2021). [DOI] [PMC free article] [PubMed] [Google Scholar]
- 53.European Commission, “Sustainable use of pesticides” (Overview Report, European Commission, European Union, 2017); https://ec.europa.eu/food/audits-analysis/overview_reports/act_getPDF.cfm?PDF_ID=1070.
- 54.Bailey S., Requier F., Nusillard B., Roberts S. P. M., Potts S. G., Bouget C., Distance from forest edge affects bee pollinators in oilseed rape fields. Ecol. Evol. 4, 370–380 (2014). [DOI] [PMC free article] [PubMed] [Google Scholar]
- 55.Kleijn D., Raemakers I., A retrospective analysis of pollen host plant use by stable and declining bumble bee species. Ecology 89, 1811–1823 (2008). [DOI] [PubMed] [Google Scholar]
- 56.Mangels J., Fiedler K., Schneider F. D., Blüthgen N., Diversity and trait composition of moths respond to land-use intensification in grasslands: Generalists replace specialists. Biodivers. Conserv. 26, 3385–3405 (2017). [Google Scholar]
- 57.Sjödin N. E., Bengtsson J., Ekbom B., The influence of grazing intensity and landscape composition on the diversity and abundance of flower-visiting insects. J. Appl. Ecol. 45, 763–772 (2008). [Google Scholar]
- 58.Federal Agency for Nature Conservation (BfN), Nature conservation areas in Germany (2019): www.bfn.de/en/service/facts-and-figures/nature-conservation/nature-conservation-areas/nature-conservation-areas-in-germany.html.
- 59.Daily G. C., Ehrlich P. R., Nocturnality and species survival. Proc. Natl. Acad. Sci. U.S.A. 93, 11709–11712 (1996). [DOI] [PMC free article] [PubMed] [Google Scholar]
- 60.Skvarla M. J., Larson J. L., Fisher J. R., Dowling A. P. G., A review of terrestrial and canopy Malaise traps. Ann. Entomol. Soc. Am. 114, 27–47 (2021). [Google Scholar]
- 61.Boetzl F. A., Krauss J., Heinze J., Hoffmann H., Juffa J., König S., Krimmer E., Prante M., Martin E. A., Holzschuh A., Steffan-Dewenter I., A multitaxa assessment of the effectiveness of agri-environmental schemes for biodiversity management. Proc. Natl. Acad. Sci. U.S.A. 118, e2016038118 (2021). [DOI] [PMC free article] [PubMed] [Google Scholar]
- 62.Hausmann A., Godfray H. C. J., Huemer P., Mutanen M., Rougerie R., van Nieukerken E. J., Ratnasingham S., Hebert P. D. N., Genetic patterns in European geometrid moths revealed by the barcode index number (BIN) system. PLOS ONE 8, e84518 (2013). [DOI] [PMC free article] [PubMed] [Google Scholar]
- 63.Bundesministerium für Ernährung und Landwirtschaft, Forest condition report (Ergebnisse der Waldzustandserhebung) (Bundesministerium für Ernährung und Landwirtschaft, 2020): www.bmel.de/SharedDocs/Downloads/DE/Broschueren/ergebnisse-waldzustandserhebung-2020.pdf?__blob=publicationFile&v=4.
- 64.Redlich S., Zhang J., Benjamin C., Dhillon M. S., Englmeier J., Ewald J., Fricke U., Ganuza C., Haensel M., Hovestadt T., Kollmann J., Koellner T., Kübert-Flock C., Kunstmann H., Menzel A., Moning C., Peters W., Riebl R., Rummler T., Rojas-Botero S., Tobisch C., Uhler J., Uphus L., Müller J., Steffan-Dewenter I., Disentangling effects of climate and land use on biodiversity and ecosystem services—A multi-scale experimental design. Methods Ecol. Evol. 13, 514–527 (2022). [Google Scholar]
- 65.Hausmann A., Segerer A. H., Greifenstein T., Knubben J., Morinière J., Bozicevic V., Doczkal D., Günter A., Ulrich W., Habel J. C., Toward a standardized quantitative and qualitative insect monitoring scheme. Ecol. Evol. 10, 4009–4020 (2020). [DOI] [PMC free article] [PubMed] [Google Scholar]
- 66.Leray M., Knowlton N., DNA barcoding and metabarcoding of standardized samples reveal patterns of marine benthic diversity. Proc. Natl. Acad. Sci. U.S.A. 112, 2076–2081 (2015). [DOI] [PMC free article] [PubMed] [Google Scholar]
- 67.Uhler J., Redlich S., Zhang J., Hothorn T., Tobisch C., Ewald J., Thorn S., Seibold S., Mitesser O., Morinière J., Bozicevic V., Benjamin C. S., Englmeier J., Fricke U., Ganuza C., Haensel M., Riebl R., Rojas-Botero S., Rummler T., Uphus L., Schmidt S., Steffan-Dewenter I., Müller J., Relationship of insect biomass and richness with land use along a climate gradient. Nat. Commun. 12, 5946 (2021). [DOI] [PMC free article] [PubMed] [Google Scholar]
- 68.Van Zandt P. A., Johnson D. D., Hartley C., LeCroy K. A., Shew H. W., Davis B. T., Lehnert M. S., Which moths might be pollinators? Approaches in the search for the flower-visiting needles in the Lepidopteran haystack. Ecol. Entomol. 45, 13–25 (2020). [Google Scholar]
- 69.Anderson M. J., Crist T. O., Chase J. M., Vellend M., Inouye B. D., Freestone A. L., Sanders N. J., Cornell H. V., Comita L. S., Davies K. F., Harrison S. P., Kraft N. J. B., Stegen J. C., Swenson N. G., Navigating the multiple meanings of β diversity: A roadmap for the practicing ecologist. Ecol. Lett. 14, 19–28 (2011). [DOI] [PubMed] [Google Scholar]
- 70.Chase J. M., Leibold M. A., Spatial scale dictates the productivity–biodiversity relationship. Nature 416, 427–430 (2002). [DOI] [PubMed] [Google Scholar]
- 71.R Core Team, R: A Language and Environment for Statistical Computing (R Foundation for Statistical Computing, 2020); www.R-project.org/.
- 72.J. Oksanen, F. G. Blanchet, M. Friendly, R. Kindt, P. Legendre, D. McGlinn, P. R. Minchin, R. B. O’Hara, G. L. Simpson, P. Solymos, M. H. H. Stevens, E. Szoecs, H. Wagner, vegan: Community Ecology Package. R package version 2.5-6 (2019); https://CRAN.R-project.org/package=vegan.
- 73.Brooks M. E., Kristensen K., van Benthem K. J., Magnusson A., Berg C. W., Nielsen A., Skaug H. J., Mächler M., Bolker B. M., glmmTMB balances speed and flexibility among packages for zero-inflated generalized linear mixed modeling. R J. 9, 378–400 (2017). [Google Scholar]
- 74.O’brien R. M., A caution regarding rules of thumb for variance inflation factors. Qual. Quant. 41, 673–690 (2007). [Google Scholar]
- 75.Lüdecke D., Ben-Shachar M. S., Waggoner P., Waggoner P., Makowski D., performance: An R package for assessment, comparison and testing of statistical models. J. Open Source Softw. 6, 3139 (2021). [Google Scholar]
- 76.Senapathi D., Carvalheiro L. G., Biesmeijer J. C., Dodson C.-A., Evans R. L., McKerchar M., Morton R. D., Moss E. D., Roberts S. P. M., Kunin W. E., Potts S. G., The impact of over 80 years of land cover changes on bee and wasp pollinator communities in England. Proc. R. Soc. B 282, 20150294 (2015). [DOI] [PMC free article] [PubMed] [Google Scholar]
- 77.Grueber C. E., Nakagawa S., Laws R. J., Jamieson I. G., Multimodel inference in ecology and evolution: Challenges and solutions. J. Evol. Biol. 24, 699–711 (2011). [DOI] [PubMed] [Google Scholar]
- 78.K. Barton, MuMIn: Multi-Model Inference. R package version 1.43.17 (2020); https://CRAN.R-project.org/package=MuMIn.
- 79.F. Hartig, Residual diagnostics for hierarchical (multi-level/mixed) regression models. R package version 0.3.3.0 (2020); https://CRAN.R-project.org/package=DHARMa.
- 80.Hothorn T., Bretz F., Westfall P., Simultaneous inference in general parametric models. Biom. J. 50, 346–363 (2008). [DOI] [PubMed] [Google Scholar]
- 81.Hoiss B., Krauss J., Steffan-Dewenter I., Interactive effects of elevation, species richness and extreme climatic events on plant-pollinator networks. Glob. Chang. Biol. 21, 4086–4097 (2015). [DOI] [PubMed] [Google Scholar]
- 82.Smith-Pardo A., Gonzalez V. H., Bee diversity (Hymenoptera: Apoidea) in a tropical rainforest succession. Acta Biol. Colomb. 12, 43–56 (2007). [Google Scholar]
- 83.Hsieh T. C., Ma K. H., Chao A., iNEXT: An R package for rarefaction and extrapolation of species diversity (Hill numbers). Methods Ecol. Evol. 7, 1451–1456 (2016). [Google Scholar]
- 84.T. Wei, V. Simko, R package “corrplot”: Visualization of a Correlation Matrix (2021); https://github.com/taiyun/corrplot.
- 85.van Achterberg K., Can Townes type Malaise traps be improved? Some recent developments. Entomol. Ber. 69, 129–135 (2009). [Google Scholar]
Associated Data
This section collects any data citations, data availability statements, or supplementary materials included in this article.
Supplementary Materials
Supplementary Text
Tables S1 to S8
Figs. S1 to S9
References


