Abstract
In this study, a jacobsite–biochar nanocomposite (MnFe2O4–BC) was fabricated and used to simultaneously remove Sb(iii) and Cd(ii) from water via adsorption. The MnFe2O4–BC nanocomposite was prepared via a co-precipitation method and analyzed using various techniques. The results confirm the successful decoration of the biochar surface with MnFe2O4 nanoparticles. The maximum Sb(iii) removal efficiency was found to be higher from bi-solute solutions containing Cd(ii) than from single-solute systems, suggesting that the presence of Cd(ii) enhances the removal of Sb(iii). The Langmuir isotherm model describes well Sb(iii) and Cd(ii) removal via adsorption onto the MnFe2O4–BC nanocomposite. The maximum adsorption capacities are 237.53 and 181.49 mg g−1 for Sb(iii) and Cd(ii), respectively, in a bi-solute system. Thus, the prepared MnFe2O4–BC nanocomposite is demonstrated to be a potential adsorbent for simultaneously removing Sb(iii) and Cd(ii) ions from aqueous solutions.
In this study, a jacobsite–biochar nanocomposite (MnFe2O4–BC) was fabricated and used to simultaneously remove Sb(iii) and Cd(ii) from water via adsorption.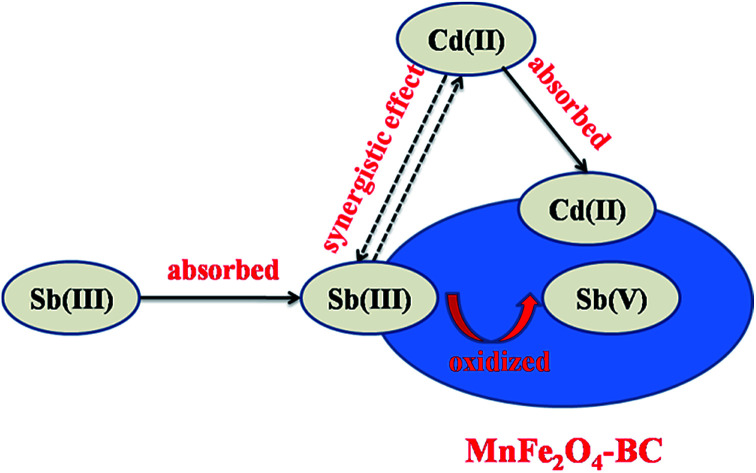
1. Introduction
The introduction of antimony (Sb) and cadmium (Cd) into the environment, mainly from anthropogenic activities like mining and industrial work, has created global concern.1,2 Sb, a hazardous substance, may lead to pneumoconiosis and have carcinogenic effects on human health.1,3 The maximum permissible Sb concentrations in drinking water are 5, 6 and 10 μg L−1, as established by China, the United States Environmental Protection Agency and the European Union, respectively.4 Moreover, there are two inorganic species (Sb(iii) and Sb(v)) of Sb in aquatic systems. Of these, Sb(iii) is more toxic than Sb(v) by a factor of ten.5 Cd is one of the most toxic heavy metals, and has received significant attention in recent years.6 Cd is ubiquitous, and over-exposure to Cd can cause bone and kidney damage.7 According to guidelines from the World Health Organization, the maximum contaminant level (MCL) of Cd(ii) in drinking water should be limited to 3 μg L−1.2 Alarmingly, Sb and Cd generally coexist in many sources, such as tailing heaps, water, and sediments.5,8 For instance, combined Sb and Cd pollution is frequently observed in Xikuangshan, because of the concomitant presence of Cd in Sb-containing ores.8 Moreover, Sb and Cd are the most abundant heavy metal contaminants threatening some cities in the Guangxi province of China.9 The coexistence of Sb and Cd might pose a higher risk to human health and ecological safety than their individual presence. In addition, the processes required for the simultaneous removal of Sb and Cd might also differ from those used for removal from systems containing only Sb or Cd. Despite this, investigations into the simultaneous removal of Sb(iii) and Cd(ii) are rare.
It is widely known that adsorption technologies are promising for the elimination of contaminants from aqueous solutions. Biochar is an inexpensive carbon-rich material that might widely be used in adsorbent systems, and is produced through the pyrolysis of biomass under oxygen-free or oxygen-limited conditions.10,11 Biochar has a large specific surface area and porous structure, as well as abundant surface functional groups and mineral components; thus, it is a potential adsorbent for pollutants. Because most biochar presents a predominantly net negatively charged surface,12,13 its ability to remove aqueous Sb, which is in anionic form, may be relatively weak. Therefore, several methods have been developed to modify biochar to enhance its anion adsorption capabilities. Biochar modified with iron oxide or manganese oxide has been reported to show strong ability in removing Sb from aqueous solutions.4 For instance, Xu et al. investigated the capabilities for and mechanisms involved in the removal of Sb(iii) using Fe–Mn binary oxides, ferric hydroxide, and manganese dioxide.4 Bai et al. investigated potential oxidation and adsorption pathways for Sb(iii and v) species in the presence of Mn(ii) and Mn-oxidizing bacteria, with or without Fe(ii), and found that in situ formed biogenic Mn oxide and Fe–Mn oxides could effectively remove Sb.14 Qi and Pichler studied the sequential and simultaneous adsorption of Sb(iii) and Sb(v) on ferrihydrite, and demonstrated that ferrihydrite is an effective adsorbent for Sb(iii) and Sb(v) in single and binary systems, with a higher efficiency toward Sb(iii) than Sb(v).15 However, despite the evident potential interference of Sb(iii) into the adsorption of Cd(ii) and the coexistence of Sb(iii) and Cd(ii) in water samples, the adsorption behavior of this important binary system on Fe and Mn modified biochar has not been reported to date.
In this study, a jacobsite–biochar nanocomposite (MnFe2O4–BC) was synthesized and used to evaluate the co-adsorption performance of Sb(iii) and Cd(ii). The effects of various experimental conditions, such as solution pH, contact time, initial concentration, and coexisting ions, on their adsorption were investigated. A possible mechanism for Sb(iii) and Cd(ii) adsorption on the MnFe2O4–BC nanocomposite is also proposed. Thus, our results may contribute to the development of decontamination technologies targeting Sb(iii)/Cd(ii) polluted water, while deepening our understanding of the adsorption of Sb(iii) and Cd(ii) on biochar materials.
2. Materials and methods
2.1. Materials
All chemical regents used in this study were of analytical reagent (AR) grade. Stock solutions of 1000 mg L−1 Sb(iii) (KSbC4H4O7) and Cd(ii) (Cd(NO3)2·4H2O) were prepared with deionized water. The required concentrations for working solutions were obtained through diluting the Sb(iii) and Cd(ii) stock solutions.
2.2. Preparation of MnFe2O4–BC
The biochar used in this study was obtained from tea branches through a typical slow pyrolysis process.16 Briefly, a tea branch was loaded into a programmable tube furnace and pyrolyzed under anaerobic conditions at 500 °C at a heating rate of 25 °C min−1 for 90 min. After carbonization, the biochar was cooled naturally to room temperature to obtain the pristine BC samples used in the experiments. The MnFe2O4–BC nanocomposite was prepared via a co-precipitation method. Briefly, 8.34 g (0.3 M) of FeSO4·7H2O was dissolved in 100 mL of deionized water, and 1 g of the prepared BC was added to obtain suspension A. Then, 1.58 g (0.1 M) of KMnO4 was dissolved in 100 mL of deionized water under vigorous stirring to obtain solution B. Finally, solution B was added to suspension A under continuous stirring. During the reaction, an appropriate amount of NaOH solution was added to maintain the pH of the solution at about 10. The resulting slurry was aged at room temperature for 3 h, then centrifuged and washed with deionized water to remove excess salt. After that, the product was vacuum dried overnight at 25 °C.
2.3. Characterization
pH Values were measured using a pH meter (Mettler Toledo FE28), supplied with a combined electrode. Field emission electron microscopy (FESEM) images of BC and MnFe2O4–BC were gained using a field emission electron microscope (Hitachi S-4800). Fourier transform infrared spectra (FT-IR) were recorded using a Nicolet 380 spectrometer. An X-ray diffractometer (Bruker D8 Advance) was used to collect X-ray diffraction (XRD) patterns of the samples. The specific surface area was measured using a Nova 2000e surface area analyzer (Quantachrome, USA). A Thermo Scientific K-Alpha spectrometer was used to obtain X-ray photoelectron spectra (XPS) of MnFe2O4–BC after adsorption.
2.4. Adsorption experiments
All adsorption experiments were carried out in triplicate at 298 K, and averaged values of the results are reported. The influence of the pH of the initial solution, adsorption kinetics, adsorption isotherms, ionic strength, and competing ions on Sb(iii) and Cd(ii) adsorption were analyzed. The influence of pH on the adsorption abilities of BC and MnFe2O4–BC was examined over the pH range of 3–7. Acidic pH was mainly selected because Cd(OH)2 has relatively low solubility in basic media. HCl and/or KOH were used to adjust the pH of solutions.
Kinetic experiments were carried out at room temperature. Mixed solutions consisting of 50 mL of Sb(iii) and Cd(ii) (50 mg L−1) were added to a 100 mL conical flask, and the pH of the resulting solution was adjusted to an optimum pH value using 0.1 mol L−1 HCl and/or KOH. Then, 50 mg of BC or MnFe2O4–BC was added to the solutions. The conical flasks were shaken using a thermostatically controlled shaker (ZWYR-2102C) at 120 rpm for different time intervals (10, 30, 60, 180, 300, 540, 720, and 1440 min).
Sb(iii) and Cd(ii) adsorption isotherms were obtained for Sb(iii) and Cd(ii) mixed solutions (50 mL) in 100 mL conical flasks via batch tests. The initial concentration of the mixture was varied from 25 to 500 mg L−1. 50 mg of BC or MnFe2O4–BC was added to the conical flask after the pH of the solution was adjusted to an optimum pH value. The pH of the solution was adjusted by adding 0.1 mol L−1 HCl and/or KOH. Then, the conical flasks were shaken using a thermostatically controlled shaker at 120 rpm at room temperature for 24 h.
The influence of ionic strength on the removal of Sb(iii) and Cd(ii) was also investigated by adjusting the ionic strength of solution to 0, 0.001, 0.005, 0.01, 0.05, 0.1 and 0.5 M, using KCl.
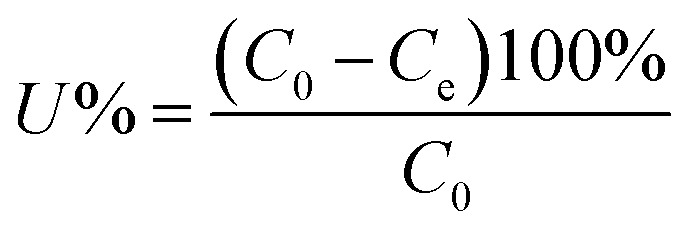
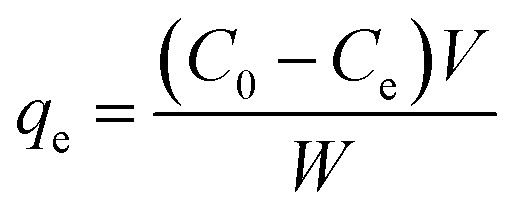
The effects of five common coexisting cations, K+, Ca2+, Mg2+, PO43−, and NO3−, were also investigated by adding 0.01 M KCl, CaCl2, MgCl2·6H2O, NH4H2PO4, and KNO3 to mixed solutions containing 50 mg L−1 Sb(iii) and Cd(ii) in separate conical flasks. After the adsorption experiments, all samples were filtered, and then the filtrates were analyzed using inductively coupled plasma-atomic emission spectroscopy (ICP-AES, Prodigy). The removal efficiencies (U, %) and equilibrium adsorption amounts of Sb(iii) and Cd(ii) (qe, mg g−1) were calculated using the following equations:
 |
1 |
 |
2 |
where C0 is the initial concentration of Sb(iii) or Cd(ii) (mg L−1), Ce is the equilibrium concentration of Sb(iii) or Cd(ii) (mg L−1), W is the weight of the biochar (mg), and V is the volume of the solution (mL).
2.5. Adsorbent reuse
To test the reusability of MnFe2O4–BC, five consecutive cycles were performed in triplicate. Each adsorption process was carried out as batch experiments for 24 h, and then MnFe2O4–BC was separated using centrifugation. Prior to the next cycle, the collected adsorbent was washed repeatedly to remove residual solution.
3. Results and discussion
3.1. Characterization of the MnFe2O4–BC nanocomposite
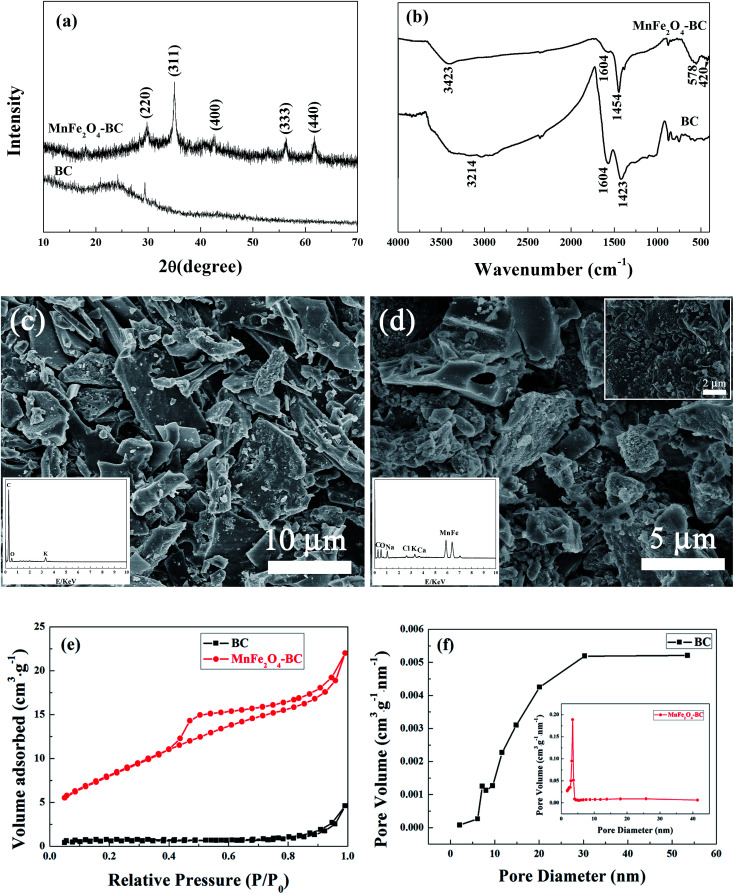
Fig. 1a depicts XRD patterns of BC and MnFe2O4–BC. The broad peak located at about 24° in the XRD pattern of BC represents a typical amorphous carbon diffraction pattern.17 In addition, the XRD pattern of BC has a peak at 29.5°, which is attributed to CaMg(CO3)2/dolomite.18 For MnFe2O4–BC, new diffraction peaks are observed at 29.76°, 35.05°, 42.59°, 56.26°, and 61.68°, corresponding to d values of 3.00 Å, 2.56 Å, 2.13 Å, 1.64 Å and 1.50 Å, respectively, which are indexed to MnFe2O4, with JCPDS card no. 742403. This result suggests that MnFe2O4 nanoparticles have been loaded on the surface of the biochar. The corresponding FT-IR spectra of BC and MnFe2O4–BC are exhibited in Fig. 1b. The band in the range of 3000–3445 cm−1 may be due to the stretching vibrations of the O–H groups of water.19,20 The peaks at about 1424 cm−1 for BC and at 1454 cm−1 for MnFe2O4–BC in the FT-IR spectra were assigned to –CH2– groups, while the peak at about 1604 cm−1 represents the aromatic C C and C O stretching vibrations.21 These organic functional groups may be attributed to the lignin structure of tea branches. Compared to the FT-IR spectrum of BC, new peaks at approximately 578 cm−1 and 420 cm−1 appear in the FT-IR spectrum of MnFe2O4–BC. These two peaks can be identified as the infrared absorption peaks of MnFe2O4.22 Bujoreanu et al. showed that the IR peaks between 600 and 400 cm−1 for MnFe2O4 mainly depend on the vibrations of the octahedral group.23 Therefore, the results from the FT-IR spectrum are consistent with the XRD results presented in Fig. 1a, and further confirm the successful loading of MnFe2O4 nanoparticles on BC.
Fig. 1. (a) XRD patterns and (b) FT-IR spectra of BC and MnFe2O4–BC; (c) FESEM image of BC (inset: EDX spectrum of BC); (d) FESEM image of MnFe2O4–BC (inset: EDX spectrum of MnFe2O4–BC); (e) nitrogen adsorption–desorption isotherms of BC and MnFe2O4–BC; and (f) pore size distributions of BC and MnFe2O4–BC.
The morphologies of BC and MnFe2O4–BC were characterized using FESEM, and representative images are shown in Fig. 1c and d. As shown in Fig. 1c, BC derived from tea branches is composed of irregular sheets, with some small granules attached to the sheet surface. The corresponding energy-dispersive X-ray (EDX) spectroscopic analysis (inset of Fig. 1c) suggests that the BC sample contains carbon, oxygen, and a small quantity of potassium. Moreover, FESEM/EDX analyses of MnFe2O4–BC suggest that MnFe2O4 particles are present on the biochar surface (Fig. 1d). The SEM image clearly shows that many small aggregates/particles are present on the surface of MnFe2O4–BC (Fig. 1d). The EDX analysis of MnFe2O4–BC indicates that these nanoparticles contain carbon, oxygen, iron, and manganese, as well as small amounts of sodium, chlorine, potassium, and calcium (Fig. 1d, inset). Carbon, sodium, chlorine, potassium, and calcium originate from biochar, whereas oxygen, iron, and manganese originate from MnFe2O4. Thus, the results of XRD, FT-IR, and FESEM characterization clearly demonstrate that MnFe2O4 particles are successfully loaded onto the surface of the pristine biochar.
N2 adsorption–desorption isotherms from BC and MnFe2O4–BC are shown in Fig. 1e. The isotherms are characteristic type IV isotherms with a H3 hysteresis loop. The Brunauer–Emmett–Teller (BET) surface areas of BC and MnFe2O4–BC were found to be 2.35 and 30.38 m2 g−1, respectively. The significant increase in BET surface area after modification is expected to enhance the heavy metal adsorption process. In addition, the pore size distributions and total volumes of BC and MnFe2O4–BC are also determined. The pore size distributions of BC and MnFe2O4–BC are shown in Fig. 1f. The peak is centered at 30.4 nm for BC, and 3.4 nm for MnFe2O4–BC. The pore diameter and total pore volume of BC are approximately 19.80 nm and 0.00675 cm3 g−1, respectively, whereas they are 4.15 nm and 0.033 cm3 g−1 for MnFe2O4–BC. These results demonstrate that the prepared BC and MnFe2O4–BC nanocomposite are mesoporous materials.
3.2. Effects of solution pH
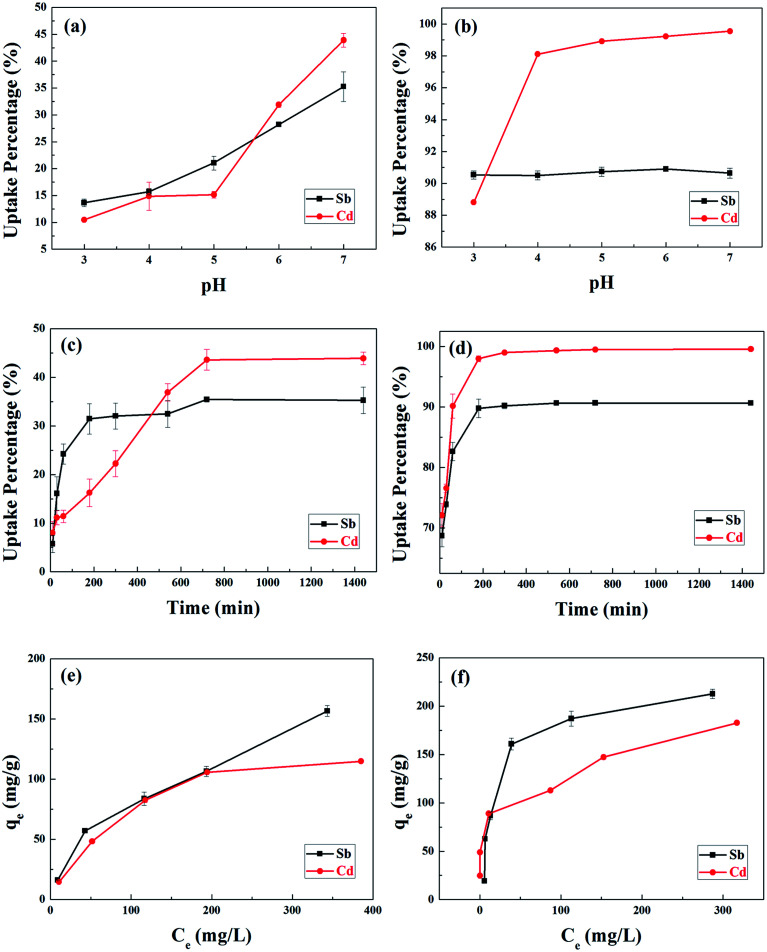
The surface charge of BC and MnFe2O4–BC, the degree of ionization, and the species ions, Sb(iii) and Cd(ii), can be affected by the pH of solution. Therefore, the effects of solution pH on the adsorption of Sb(iii) and Cd(ii) ions onto BC and MnFe2O4–BC were examined. Considering metal hydrolysis and precipitation, the experiments were carried out at pH values between 3 and 7. Obviously, the adsorption of Sb(iii) and Cd(ii) by BC was found to be sensitive to variations in solution pH, which generally improved with an increase in pH from 3.0 to 7.0 (Fig. 2a). This could be because biochar contains surface functional groups such as –COOH and –OH (Fig. 1b). The dissociation of these organic functional groups increases upon increasing the pH of the solution, and these functional groups may interact with Sb(iii) and Cd(ii) to form surface complexes. However, the influence of pH on the removal of Sb(iii) by MnFe2O4–BC was minimal, whereas the adsorption of Cd(ii) by MnFe2O4–BC increased with pH. This suggests that the mechanism of Sb(iii) adsorption onto MnFe2O4–BC is different from that using BC. Based on the uptake by BC and MnFe2O4–BC, pH 7.0 was chosen as the optimal pH value for Sb(iii) and Cd(ii) adsorption in subsequent experiments.
Fig. 2. The effects of pH on the removal of Sb(iii) and Cd(ii) from a binary system using (a) BC and (b) MnFe2O4–BC at room temperature for 24 h; the removal of Sb(iii) and Cd(ii) from a binary system at pH 7.0 using (c) BC and (d) MnFe2O4–BC at room temperature, after different contact times; and the effects of initial concentration on the removal of Sb(iii) and Cd(ii) from a binary system at pH 7.0 using (e) BC and (f) MnFe2O4–BC.
3.3. Adsorption kinetics of a bi-solute (Sb + Cd)
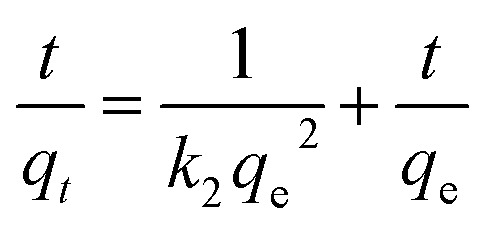
To study the kinetics of adsorption of Sb(iii) and Cd(ii) on BC and MnFe2O4–BC, the adsorption processes were investigated with respect to contact time. The experimental data were fitted using pseudo-first-order and pseudo-second-order kinetic models,24 which can be expressed as follows:
 |
3 |
 |
4 |
where qe and qt (mg g−1) represent the amount of target ions adsorbed at equilibrium and at time t, respectively. k1 (min−1) and k2 (g mg−1 min−1) are the adsorption rate constants of the pseudo-first-order and pseudo-second-order kinetic models, respectively.
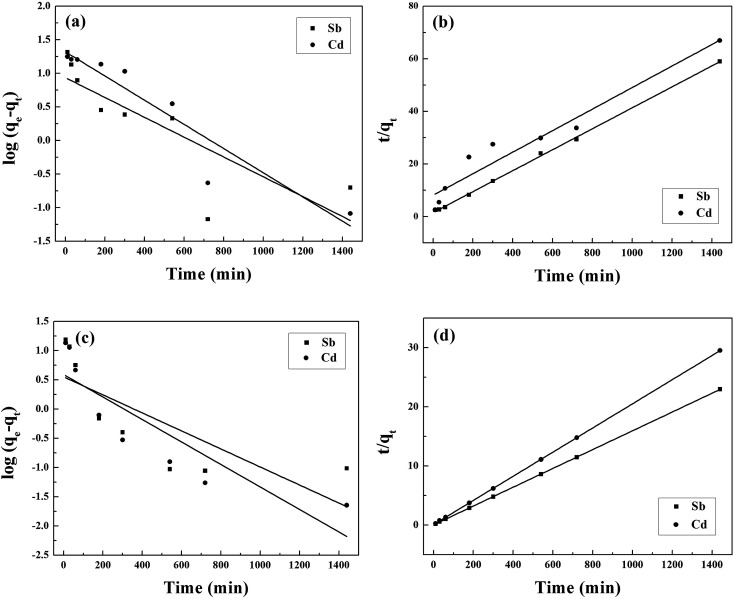
The kinetic curves are shown in Fig. 2c and d. For BC, the adsorption of Sb(iii) is rapid in the first 3 h, and then becomes slower and reaches equilibrium after 12 h (Fig. 2c). In contrast, the adsorption of Cd(ii) is slow and reaches equilibrium after 12 h (Fig. 2c). Moreover, the removal of Sb(iii) and Cd(ii) through adsorption onto pristine BC is poor. Fig. 2d shows that the removal of both Sb(iii) and Cd(ii) using MnFe2O4–BC is rapid in the first 1 h and then becomes slow. Adsorption equilibrium is gradually achieved within 5 h for both Sb(iii) and Cd(ii). This is because there are abundant available sites on the biochar surface during the initial rapid adsorption stage. As adsorption proceeds, Sb(iii) and Cd(ii) accumulate on the surface of the biochar, resulting in a decrease in the adsorption rate. Moreover, the removal of Sb(iii) and Cd(ii) using MnFe2O4–BC is nearly complete, and is much higher than that facilitated by pristine BC. The pseudo-first-order and pseudo-second-order kinetic models were used to fit the experimental data (Fig. 3). The corresponding parameters and correlation coefficients are listed in Table 1. It is clear that the correlation coefficient (R2) of the pseudo-second-order model is closer to 1 and is higher than that of the pseudo-first-order model. Moreover, the theoretical qe,cal values for both Sb(iii) and Cd(ii), calculated from the pseudo-second-order model, are closer to the experimental values (qe,exp). Therefore, the adsorption behavior of Sb(iii) and Cd(ii) in binary solution is well described using pseudo-second-order kinetics, which suggests that the adsorption mechanism involves chemisorption.25
Fig. 3. (a and c) Pseudo-first order and (b and d) pseudo-second order kinetics sorption data for the adsorption of Sb(iii) and Cd(ii) in a binary system using BC (a and b) and MnFe2O4–BC (c and d).
Pseudo-first-order and pseudo-second-order kinetic parameters for Sb(iii) and Cd(ii) adsorbed using BC and MnFe2O4–BC in a binary system.
| Sample | Ion | Experimental parameters | Pseudo-first order | Pseudo-second order | |||||
|---|---|---|---|---|---|---|---|---|---|
| pH | q e,exp (mg g−1) | k 1 (min−1) | q e,cal (mg g−1) | R 2 | k 2 (g mg−1 min−1) | q e,cal (mg g−1) | R 2 | ||
| BC | Sb(iii) | 7 | 24.60 | 0.0034 | 8.59 | 0.636 | 0.0010 | 25.11 | 0.999 |
| BC | Cd(ii) | 7 | 21.60 | 0.0041 | 20.85 | 0.885 | 2 × 10⁻⁶ | 21.52 | 0.934 |
| MnFe2O4–BC | Sb(iii) | 7 | 62.80 | 0.0035 | 3.55 | 0.551 | 0.0040 | 62.93 | 0.999 |
| MnFe2O4–BC | Cd(ii) | 7 | 48.80 | 0.0044 | 3.89 | 0.743 | 0.024 | 48.99 | 0.999 |
3.4. Bi-solute (Sb + Cd) adsorption isotherms
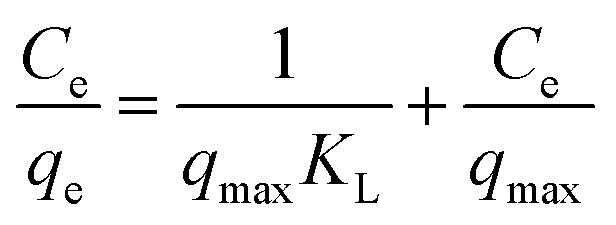
The results of experiments employing various initial concentrations of Sb(iii) and Cd(ii) ions at the optimized pH of 7 with a contact time of 24 h are shown in Fig. 2e and f, respectively. The adsorption capacities for both Sb(iii) and Cd(ii) increased significantly with an increase in the initial concentration of Sb(iii) and Cd(ii) from 100 to 500 mg L−1. The experimental data were fitted with Langmuir and Freundlich isotherm models.26,27 The linear forms of the Langmuir and Freundlich isotherms are given by eqn (5) and (6), respectively:
 |
5 |
 |
6 |
where Ce (mg L−1) is the equilibrium concentration of Sb(iii) or Cd(ii), and qe (mg g−1) represents the amount of adsorbed Sb(iii) or Cd(ii) per unit mass of biochar. qmax (mg g−1) indicates the adsorption capacity, whereas KL (L mg−1) is the Langmuir affinity constant. For the Freundlich isotherm, KF signifies the adsorption affinity, while n is an indicator related to the heterogeneity of the adsorbent surface.
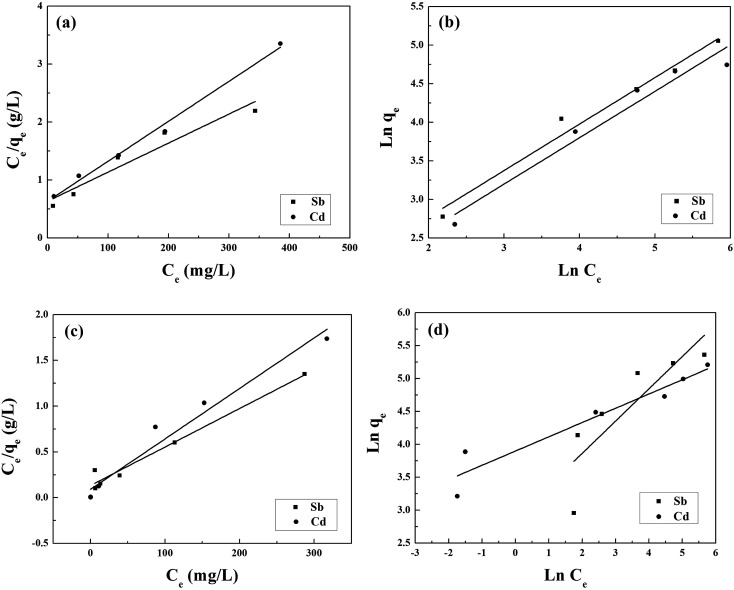
The fits to the Langmuir and Freundlich models are shown in Fig. 4, and the isotherm parameters are listed in Table 2. For the adsorption of Sb(iii) using BC, the Freundlich model provides a better fit for the experimental data than the Langmuir model (Fig. 5a), whereas the adsorption isotherms from Cd(ii) are better fitted using the Langmuir model (Fig. 5b). This suggests that Sb(iii) adsorption on pristine biochar is a multilayer adsorption process, whereas Cd(ii) follows a monolayer adsorption process. Moreover, the maximum adsorption capacities calculated from the Langmuir model for BC in the bi-solute system are 199.60 and 145.13 mg g−1 for Sb(iii) and Cd(ii) ions, respectively. Nevertheless, a different scenario is observed for MnFe2O4–BC. As shown in Fig. 4c and d and Table 2, the Langmuir isotherms correlate better than the Freundlich ones with the experimental data for both Sb(iii) and Cd(ii). This implies that Sb(iii) and Cd(ii) likely form monolayers on MnFe2O4–BC. In addition, the calculated maximum adsorption capacity, qmax, values from the Langmuir model are 237.53 mg g−1 for Sb(iii) and 181.49 mg g−1 for Cd(ii), which are higher than the values obtained for BC. The maximum adsorption capacities for Sb(iii) and Cd(ii) are compared with those reported in the literature (Table 3). The adsorption capacity of MnFe2O4–BC is also higher than that of pyrochar derived from swine manure,28 a mercapto-functionalized hybrid sorbent,29 hematite modified magnetic nanoparticles,30 graphene,31 biochar derived from Sida Hermaphrodita,32 titanate nanotubes,33 chitosan crosslinked with epichlorohydrin–triphosphate,34 and manganese dioxide.35 Therefore, the MnFe2O4–BC composite prepared in this study is a possible efficient adsorbent for the removal of Sb(iii) and Cd(ii).
Fig. 4. (a and c) Langmuir and (b and d) Freundlich isotherms for the adsorption of Sb(iii) and Cd(ii) onto BC (a and b) and MnFe2O4–BC (c and d) in a binary system.
Langmuir and Freundlich parameters for Sb(iii) and Cd(ii) adsorbed using BC and MnFe2O4–BC in a binary system.
| Sample | Ion | Langmuir constants | Freundlich constants | ||||
|---|---|---|---|---|---|---|---|
| K L (L mg−1) | q max (mg g−1) | R 2 | K F (mg g−1) (L mg−1)1/n | n | R 2 | ||
| BC | Sb(iii) | 0.00789 | 199.60 | 0.912 | 4.803 | 1.66 | 0.973 |
| BC | Cd(ii) | 0.0109 | 145.13 | 0.990 | 4.038 | 1.66 | 0.947 |
| MnFe2O4–BC | Sb(iii) | 0.0316 | 237.53 | 0.969 | 17.89 | 2.04 | 0.673 |
| MnFe2O4–BC | Cd(ii) | 0.00605 | 181.49 | 0.960 | 49.34 | 4.62 | 0.900 |
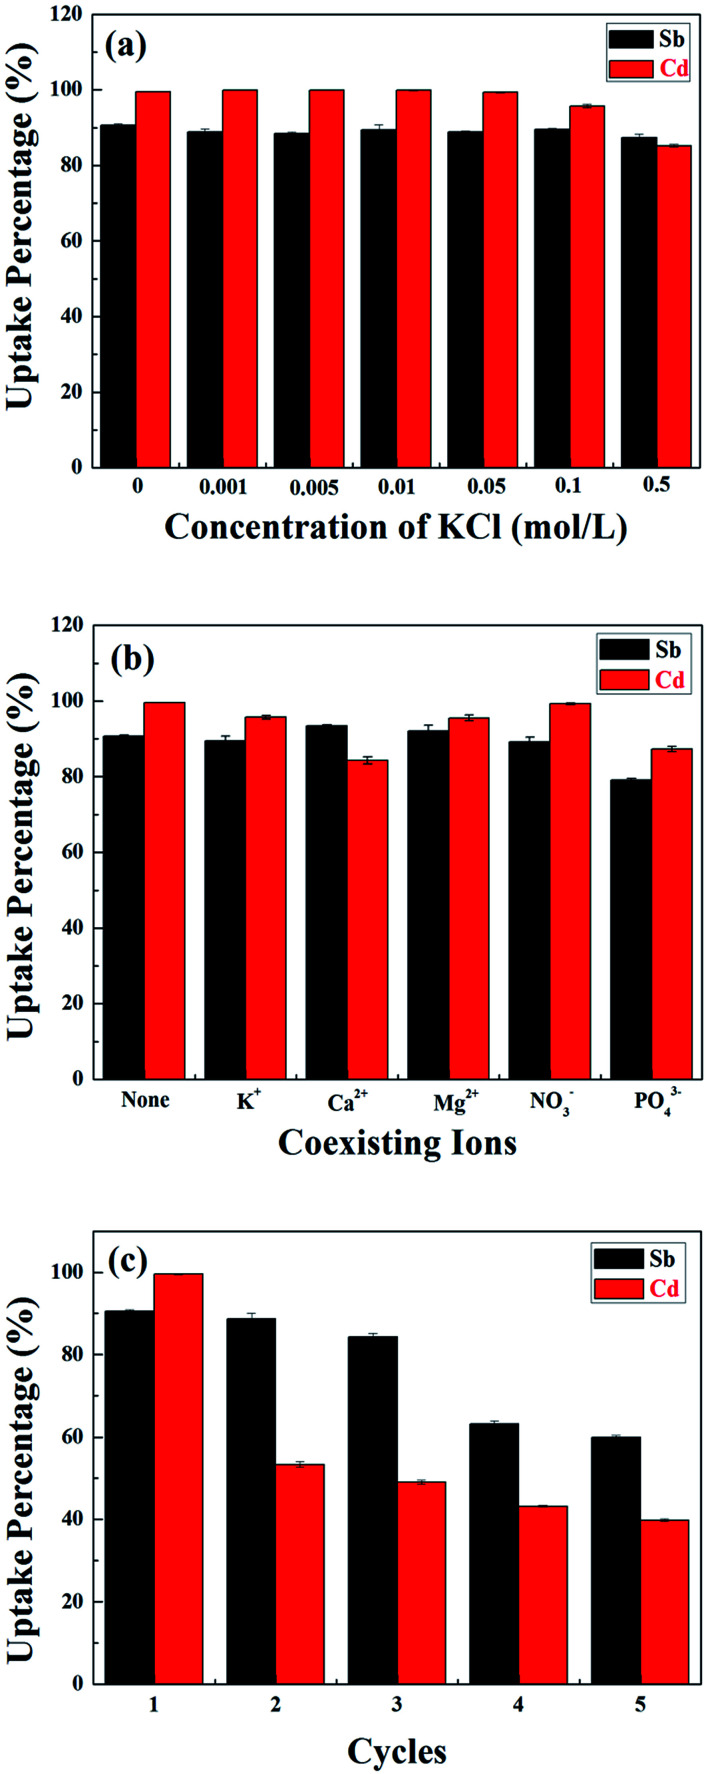
Fig. 5. (a) The effects of KCl concentration on the adsorption of Sb(iii) and Cd(ii) in binary system removal using MnFe2O4–BC; (b) the effect of competing ions on Sb(iii) and Cd(ii) adsorption onto MnFe2O4–BC in a binary system; and (c) the uptake percentages of Sb(iii) and Cd(ii) in a mixed solution using MnFe2O4–BC over five consecutive adsorption–desorption cycles.
A comparison of the adsorption capacities of MnFe2O4–BC for Sb(iii) and Cd(ii) with those of other reported adsorbents.
| Adsorbents | Concentration range (mg L−1) | pH | Adsorption capacity (mg g−1) | Ref. | |
|---|---|---|---|---|---|
| Sb(iii) | Cd(ii) | ||||
| Pyrochar from swine manure | 0.1–100/0.3–150 | 6 | 13.09 | 81.32 | 28 |
| Mercapto-functionalized hybrid sorbent | 100–800 | 5 | 108.8 | — | 29 |
| Hematite modified magnetic nanoparticles | 1–20 | 4.1 | 36.7 | — | 30 |
| Graphene | 1–10 | 11 | 8.506 | — | 31 |
| Biochar derived from Sida hermaphrodita | 5–500 | 6 | — | 35.71 | 32 |
| Titanate nanotubes | 25–300 | 57 | — | 65.97 | 33 |
| Chitosan crosslinked with epichlorohydrin–triphosphate | 100–400 | 5.6 | — | 83.75 | 34 |
| Manganese dioxide | 0.05–0.7 | — | — | 176 | 35 |
| Metal–organic frameworks (MOFs) | 10–250 | — | 225 | 37 | |
| MnFe2O4–BC | 25–500 | 7 | 237.53 | 181.49 | This work |
For comparison, the influence of ionic concentration on the removal of either Sb(iii) or Cd(ii) was investigated for single solute solutions. However, only 11.4% of Sb(iii) was absorbed by BC when the initial Sb(iii) concentration was 25 mg L−1. This is because the surface of pristine biochar (BC) has a predominantly net negative charge (as shown in Fig. 1b), and therefore the removal of Sb(iii) was limited. The Sb(iii) adsorption isotherms for BC are not shown. The effect of the initial Sb(iii) or Cd(ii) concentration on Sb(iii) or Cd(ii) removal was investigated over the range of 25–500 mg L−1. As shown in Fig. S1a and b,† the adsorption efficiency qe increased with the initial ionic concentration for both BC and MnFe2O4–BC, with the latter displaying relatively higher adsorption capacity for each ion. The corresponding adsorption isotherms and isotherm parameters for BC and MnFe2O4–BC are shown in Fig. S2 and Table S1,† respectively. For both BC and MnFe2O4–BC, the regression coefficients for the Langmuir adsorption isotherms were higher than those for the Freundlich adsorption isotherms. From the Langmuir adsorption isotherms, the calculated value of the adsorption capacity of BC for Cd(ii) is 99.40 mg g−1, whereas the adsorption capacities of MnFe2O4–BC for Sb(iii) and Cd(ii) are 159.48 and 122.10 mg g−1, respectively. Therefore, the removal of Sb(iii) and Cd(ii) using both BC and MnFe2O4–BC obeys the Langmuir adsorption isotherm, indicating a monolayer adsorption process. In addition, the maximum Sb(iii) adsorption capacity (qmax) of the system in the absence of Cd(ii) is lower than that observed in the presence of Cd(ii), for both BC and MnFe2O4–BC. This result indicates that Cd(ii) promotes the removal of Sb(iii) using both BC and MnFe2O4–BC. Meanwhile, the presence of Sb(iii) also promotes the removal of Cd(ii). Therefore, MnFe2O4–BC is highly promising for the simultaneous removal of Sb(iii) and Cd(ii), especially in a bi-solute system.
3.5. Effects of ionic strength
The influence of ionic strength on the removal of Sb(iii) and Cd(ii) using MnFe2O4–BC was evaluated, and the results are shown in Fig. 5a. KCl was selected to adjust the ionic strength of the solution to 0, 0.001, 0.005, 0.01, 0.05, 0.1, and 0.5 mol L−1. Apparently, the ionic strength did not have an obvious effect on the removal of Sb(iii) and Cd(ii) using MnFe2O4–BC. Only when the KCl concentration reached 0.5 mol L−1 did the removal of Sb(iii) and Cd(ii) using MnFe2O4–BC slightly decrease. This is because K+ and Cl− create steric hindrance for Sb(iii) and Cd(ii), and act as competitors for the surface adsorption sites on MnFe2O4–BC, leading to a reduction in the adsorption capacity. Therefore, the above results indicate that the fabricated MnFe2O4–BC could effectively remove Sb(iii) and Cd(ii) from water even at ionic strengths of 100 mM.
3.6. Effects of competing ions
Five common ions (K+, Ca2+, Mg2+, NO3−, and PO43−) were chosen to investigate the effects of competing ions on Sb(iii) and Cd(ii) adsorption using MnFe2O4–BC. As shown in Fig. 5b, none of these five ions have a remarkable effect on the uptake of Sb(iii) and Cd(ii) under the experimental conditions. Specifically, the presence of K+, Mg2+, and NO3− did not have any noticeable influence on the removal of Sb(iii) and Cd(ii). In fact, Ca2+ could promote the adsorption of Sb(iii), while the uptake of Cd(ii) was found to decrease in the presence of Ca2+ (Fig. 5b). In addition, PO43− slightly reduced the uptake of both Sb(iii) and Cd(ii) under the experimental conditions. These results confirm that Sb(iii) and Cd(ii) could be effectively removed using MnFe2O4–BC, despite the presence of competing ions.
3.7. Reusability studies
Reusability is a desirable trait for an effective absorbent. In our experiments, 0.1 mol L−1 HCl was chosen as the desorbent. To study the reusability of MnFe2O4–BC, adsorption–desorption cycles were repeated five times with the same MnFe2O4–BC sample. As shown in Fig. 5c, the removal percentages of both Sb(iii) and Cd(ii) decreased gradually. For the first three cycles, the removal percentage of Sb(iii) changed very little. From the third to the fourth cycle, however, there was a decrease of about 20% in the amount of adsorbed Sb(iii). Moreover, the removal of Sb(iii) ions still reached 60% after the fifth cycle. However, in the case of Cd(ii), the situation was different. From the first to the second cycle, the removal percentage of Cd(ii) dropped sharply to 53%, and then it declined gradually from the second to the fifth cycle. In the fifth cycle, the removal percentage of Cd(ii) ions was found to be ∼40%. Thus, the reusability is not satisfactory with regards to Cd(ii). This might be because Sb(iii) and Cd(ii) in solution compete for the adsorption sites on the surface of the MnFe2O4–biochar nanocomposite. Further, the adsorption capacity of the MnFe2O4–biochar nanocomposite for Sb(iii) is better than for Cd(ii). Therefore, the reusability is not good for Cd(ii) compared to Sb(iii).
3.8. Adsorption mechanism
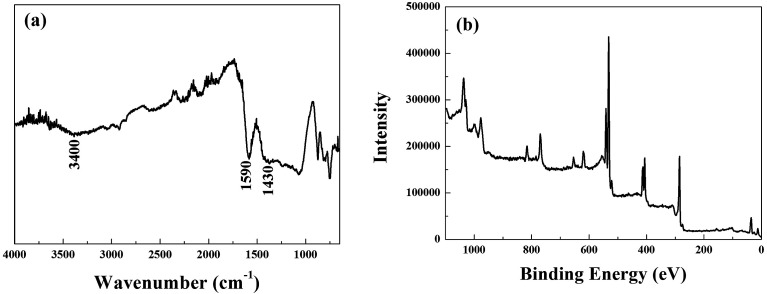
The surface states of MnFe2O4–BC after the adsorption of Sb(iii) and Cd(ii) were studied using FT-IR and XPS to ascertain the mechanism of Sb(iii)/Cd(ii) adsorption on MnFe2O4–BC. FT-IR and full-range XPS spectra of MnFe2O4–BC after adsorption are shown in Fig. 6a and b, respectively. Compared to the IR spectrum of the original MnFe2O4–BC sample (Fig. 1b), a less intense band at ∼3400 cm−1 is observed in the spectrum of MnFe2O4–BC after the adsorption of Sb(iii) and Cd(ii). This may be attributed to the deprotonation of hydroxyl groups associated with Fe on the MnFe2O4–BC surface upon the adsorption of Sb(iii) and Cd(ii). The vibration peaks at 1604 cm−1 and 1454 cm−1, which are ascribed to the vibrations of C C/C O and –CH2–, shifted to 1590 cm−1 and 1430 cm−1 after Sb(iii) and Cd(ii) adsorption, suggesting that Sb(iii) and Cd(ii) may interact with the C C/C O and –CH2– groups in the MnFe2O4–BC samples. Moreover, the chemical composition of MnFe2O4–BC after Sb(iii) and Cd(ii) co-adsorption was studied by XPS. Peaks corresponding to O 1s, Cd 3d, N 1s and Sb 3d are clearly identified in the survey scan spectrum (Fig. 6b). The presence of Sb(iii) and Cd(ii) in the resultant product further verifies the co-adsorption of Sb(iii) and Cd(ii) onto MnFe2O4–BC. In addition, the binding energies (BE) of Sb 3d3/2 in Sb2O3, Sb2O4, and Sb2O5 have been reported to be 539.6, 539.8, and 540.2 eV, respectively.4,36 Our XPS spectra of Sb(iii)-adsorbed MnFe2O4–BC showed an indicative Sb(iii) binding energy for Sb 3d3/2 at 540.2 eV, indicating the presence of Sb(v) on the MnFe2O4–BC surface after adsorption. This indeed demonstrates that Sb(iii) is chemically adsorbed on the MnFe2O4–BC surface. The oxidation mechanism may very well explain the higher Sb(iii) adsorption on MnFe2O4–BC than on pristine BC.
Fig. 6. (a) FT-IR spectrum and (b) XPS spectrum of MnFe2O4–BC after Sb(iii) and Cd(ii) co-adsorption.
4. Conclusions
In this study, a jacobsite–biochar nanocomposite (MnFe2O4–BC) was successfully fabricated and its adsorption performance for the removal of Sb(iii) and Cd(ii) was evaluated. The MnFe2O4–BC samples exhibited excellent adsorption capabilities and could simultaneously remove Sb(iii) and Cd(ii) from water. The ionic strength of the solution and coexisting ions did not have an obvious influence on the removal of Sb(iii) and Cd(ii) using MnFe2O4–BC, under the examined conditions. Moreover, MnFe2O4–BC could be used repeatedly. Therefore, the MnFe2O4–BC fabricated in our study is a promising adsorbent for the simultaneous removal of Sb(iii) and Cd(ii) from water.
Conflicts of interest
There are no conflicts to declare.
Supplementary Material
Acknowledgments
This work was supported by the Natural Science Foundation of Zhejiang (LQ17D020002, LY16D010004), the Key Research and Development Projects in Zhejiang Province (2015C03020), and the Zhejiang Provincial Collaborative Innovation Center of Agricultural Biological Resources Biochemical Manufacturing/Zhejiang Provincial Key Lab for Chem & Bio Processing Technology of Farm Products open fund (2016KF0116).
Electronic supplementary information (ESI) available. See DOI: 10.1039/c7ra13151h
References
- Wu Z. He M. Guo X. Zhou R. Sep. Purif. Technol. 2010;76:184–190. doi: 10.1016/j.seppur.2010.10.006. [DOI] [Google Scholar]
- Guo S. Jiao P. Dan Z. Duan N. Chen G. Zhang J. Chem. Eng. J. 2017;317:999–1011. doi: 10.1016/j.cej.2017.02.136. [DOI] [Google Scholar]
- Krachler M. Emons H. Zheng J. Trends Anal. Chem. 2001;20:79–90. doi: 10.1016/S0165-9936(00)00065-0. [DOI] [Google Scholar]
- Xu W. Wang H. Liu R. Zhao X. Qu J. J. Colloid Interface Sci. 2011;363:320–326. doi: 10.1016/j.jcis.2011.07.026. [DOI] [PubMed] [Google Scholar]
- Guo X. Wang K. He M. Liu Z. Yang H. Li S. J. Environ. Sci. 2014;26:1549–1556. doi: 10.1016/j.jes.2014.05.022. [DOI] [PubMed] [Google Scholar]
- Belhalfaoui B. Aziz A. Elandaloussi E. H. Ouali M. S. De Ménorval L. C. J. Hazard. Mater. 2009;169:831–837. doi: 10.1016/j.jhazmat.2009.04.021. [DOI] [PubMed] [Google Scholar]
- Sud D. Mahajan G. Kaur M. P. Bioresour. Technol. 2008;99:6017–6027. doi: 10.1016/j.biortech.2007.11.064. [DOI] [PubMed] [Google Scholar]
- He M. Environ. Geochem. Health. 2007;29:209–219. doi: 10.1007/s10653-006-9066-9. [DOI] [PubMed] [Google Scholar]
- Fu S. Wei C. Y. J. Soils Sediments. 2013;13:106–116. doi: 10.1007/s11368-012-0587-9. [DOI] [Google Scholar]
- Lehmann J. Gaunt J. Rondon M. Mitig. Adapt. Strat. GL. 2006;11:395–419. [Google Scholar]
- Sun Y. Gao B. Yao Y. Fang J. Zhang M. Zhou Y. Chen H. Yang L. Chem. Eng. J. 2014;240:574–578. doi: 10.1016/j.cej.2013.10.081. [DOI] [Google Scholar]
- Mukherjee A. Zimmerman A. R. Harris W. Geoderma. 2011;163:247–255. doi: 10.1016/j.geoderma.2011.04.021. [DOI] [Google Scholar]
- Yao Y. Gao B. Zhang M. Inyang M. Zimmerman A. R. Chemosphere. 2012;89:1467–1471. doi: 10.1016/j.chemosphere.2012.06.002. [DOI] [PubMed] [Google Scholar]
- Bai Y. Jefferson W. A. Liang J. Yang T. Qu J. J. Environ. Sci. 2017;54:126–134. doi: 10.1016/j.jes.2016.05.026. [DOI] [PubMed] [Google Scholar]
- Qi P. Pichler T. Chemosphere. 2016;145:55–60. doi: 10.1016/j.chemosphere.2015.11.057. [DOI] [PubMed] [Google Scholar]
- Wang Y. Y. Lu H. H. Liu Y. X. Yang S. M. RSC Adv. 2016;6:83534–83546. doi: 10.1039/C6RA15532D. [DOI] [Google Scholar]
- Xiao X. Chen B. L. Zhu L. Z. Environ. Sci. Technol. 2014;48:3411–3419. doi: 10.1021/es405676h. [DOI] [PubMed] [Google Scholar]
- Azargohar R. Nanda S. Kozinski J. A. Dalai A. K. Sutarto R. Fuel. 2014;125:90–100. doi: 10.1016/j.fuel.2014.01.083. [DOI] [Google Scholar]
- Wang Y. Y. Lu H. H. Liu Y. X. Yang S. M. Colloids Surf., A. 2016;509:550–563. doi: 10.1016/j.colsurfa.2016.09.060. [DOI] [Google Scholar]
- Droussi Z. D'orazio V. Provenzano M. R. Hafidi M. Ouatmane A. J. Hazard. Mater. 2009;164:1281–1285. doi: 10.1016/j.jhazmat.2008.09.081. [DOI] [PubMed] [Google Scholar]
- Chen B. Chen Z. Lv S. Bioresour. Technol. 2011;102:716–723. doi: 10.1016/j.biortech.2010.08.067. [DOI] [PubMed] [Google Scholar]
- Han A. Liao J. Ye M. Li Y. Peng X. Chin. J. Chem. Eng. 2011;19:1047–1051. doi: 10.1016/S1004-9541(11)60090-6. [DOI] [Google Scholar]
- Bujoreanu V. M. Segal E. Brezeanu M. Salmon R. Videau J. J. Gheorghies C. Thermochim. Acta. 1996;288:221–237. doi: 10.1016/S0040-6031(96)03034-1. [DOI] [Google Scholar]
- Ho Y. S. McKay G. Water Res. 2000;34:735–742. doi: 10.1016/S0043-1354(99)00232-8. [DOI] [Google Scholar]
- Liu H. Wang C. Liu J. Wang B. Sun H. J. Environ. Manage. 2013;128:727–734. doi: 10.1016/j.jenvman.2013.06.024. [DOI] [PubMed] [Google Scholar]
- Langmuir I. J. Am. Chem. Soc. 1918;40:1361–1403. doi: 10.1021/ja02242a004. [DOI] [Google Scholar]
- Freundlich H. M. F. Z. Phys. Chem. 1906;57:385–470. [Google Scholar]
- Han L. Sun H. Ro K. S. Sun K. Libra J. A. Xing B. Bioresour. Technol. 2017;234:77–85. doi: 10.1016/j.biortech.2017.02.130. [DOI] [PubMed] [Google Scholar]
- Fan H. T. Sun W. Jiang B. Wang Q. J. Li D. W. Huang C. C. Wang K. J. Zhang Z. G. Li W. X. Chem. Eng. J. 2016;286:128–138. doi: 10.1016/j.cej.2015.10.048. [DOI] [Google Scholar]
- Shan C. Ma Z. Tong M. J. Hazard. Mater. 2014;268:229–236. doi: 10.1016/j.jhazmat.2014.01.020. [DOI] [PubMed] [Google Scholar]
- Leng Y. Q. Guo W. L. Su S. N. Yi C. L. Xing L. T. Chem. Eng. J. 2012;211:406–411. doi: 10.1016/j.cej.2012.09.078. [DOI] [Google Scholar]
- Bogusz A. Oleszczuk P. Dobrowolski R. Bioresour. Technol. 2015;196:540–549. doi: 10.1016/j.biortech.2015.08.006. [DOI] [PubMed] [Google Scholar]
- Wang T. Liu W. Xiong L. Xu N. Ni J. Chem. Eng. J. 2013;215:366–374. doi: 10.1016/j.cej.2012.11.029. [DOI] [Google Scholar]
- Laus R. de Fávere V. T. Bioresour. Technol. 2011;102:8769–8776. doi: 10.1016/j.biortech.2011.07.057. [DOI] [PubMed] [Google Scholar]
- Qin Q. D. Wang Q. Q. Fu D. F. Ma J. Chem. Eng. J. 2011;172:68–74. doi: 10.1016/j.cej.2011.05.066. [DOI] [Google Scholar]
- Delobel R. Baussart H. Leroy J. M. Grimblot J. Gengembre L. J. Chem. Soc., Faraday Trans. 1. 1983;79:879–891. doi: 10.1039/F19837900879. [DOI] [Google Scholar]
- Xue H. Chen Q. H. Jiang F. L. Yuan D. Q. Lv G. X. Liang L. F. Lia L. Y. Hong M. C. Chem. Sci. 2016;7:5983–5988. doi: 10.1039/C6SC00972G. [DOI] [PMC free article] [PubMed] [Google Scholar]
Associated Data
This section collects any data citations, data availability statements, or supplementary materials included in this article.


