Abstract
Although abnormal metabolism in metabolic syndrome and tumours has been well described, the relationship between oxoglutarate dehydrogenase (OGDH) and obesity-related diseases is still largely unknown. This study aimed to investigate whether it was possible to use transcription activator-like effector nuclease (TALEN) technology to establish OGDH−/− rats and then study the effect of a high-fat diet (HFD) on these rats. However, after OGDH+/−rats were generated, we were unable to identify any OGDH−/− rats by performing mating experiments with the OGDH+/− rats for almost one year. During the past three years, only OGDH+/− rats were stably established, and correspondingly reduced OGDH expression in the tissues of the OGDH+/− rats was verified. No significant abnormal behaviour was observed in the OGDH+/− rats compared to the wild-type (WT) control rats. However, the OGDH+/− rats were revealed to have higher body weight, and the difference was even significantly greater under the HFD condition. Furthermore, blood biochemical and tissue histological examinations uncovered no abnormalities with normal diets, but a HFD resulted in liver dysfunction with pathological alterations in the OGDH+/− rats. Our results strongly indicate that OGDH homologous knockout is lethal in rats but heterologous OGDH knockout results in vulnerable liver lesions with a HFD. Therefore, the current study may provide a useful OGDH+/− rat model for further investigations of metabolic syndrome and obesity-related hepatic carcinogenesis.
Although abnormal metabolism in metabolic syndrome and tumours has been well described, the relationship between oxoglutarate dehydrogenase (OGDH) and obesity-related diseases is still largely unknown.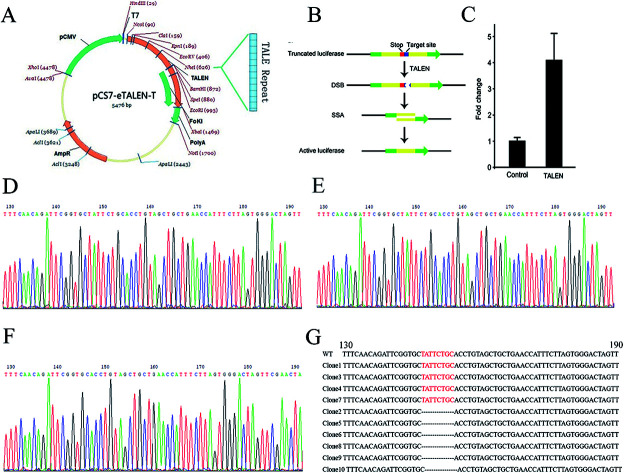
Introduction
Obesity has recently gained attention as a factor that dramatically increases the risk of multiple diseases. More than two-thirds of adults are considered clinically overweight or obese in the United States, and the number of obese people in Western countries is increasing year by year.1 Clinical investigations have shown that obesity is closely related to diabetes,2,3 cardiovascular disease,4,5 metabolic syndrome6 and cancer.7–9 Currently, cancer cells are widely known to increase their glycolysis with impaired mitochondrial function and abnormal oxidative phosphorylation, which is known as the Warburg effect.10 This is reflected by the fact that tumour cells consume large amounts of glucose and produce greater amounts of lactate and steady-state levels of ROS through the glycolytic pathway, known to be beneficial to maintaining their own survival microenvironment and cell growth.11 The tricarboxylic acid cycle (TCA cycle) is a central hub for energy metabolism, macromolecule synthesis and redox balance. The cycle is responsible for oxidation of glucose, which is the beginning of glucose processing to generate energy and carbon dioxide (CO2) in cells.12 Studies have demonstrated that abnormalities in the TCA cycle are associated with different types of cancers.13–15 The enzyme 2-oxoglutarate dehydrogenase (OGDH) is a key regulator in the TCA cycle and plays an important role in mitochondrial metabolism. So far, there is no animal model of OGDH knockout. Therefore, this report describes an attempt to establish an OGDH knockout rat model in order to explore the relationship between OGDH, metabolic syndrome and later carcinogenesis.
OGDH, as one of the key regulators in the TCA cycle, catalyses an important reaction of TCA, and the reaction is irreversible.16 The OGDH gene localizes to 7p13-p11.2 in humans and encodes one subunit of the 2-oxoglutarate dehydrogenase complex, which catalyses the overall conversion of 2-oxoglutarate to succinyl-CoA and CO2 during the TCA cycle.17 The OGDH protein localizes to the mitochondrial matrix and uses thiamine pyrophosphate as a cofactor for its enzyme activity. A congenital deficiency in 2-oxoglutarate dehydrogenase activity is believed to lead to hypotonia, metabolic acidosis, and hyperlactatemia.18 It has been found that OGDH activity is deficient in the brains of patients with Alzheimer's disease,19 diabetes20 and cervical cancer.16
In this study, we explored the possibility of using transcription activator-like effector nucleases (TALENs) to generate OGDH knockout (OGDH−/−) rats. TALENs are customizable DNA-binding nucleases that can be targeted to bind almost any sequence in the genome. We used the TALEN technique to cut the first exon DNA of the target gene in order to achieve OGDH−/− rats by creating a DNA frameshift mutation and gene knockout. The purposes of our current study were to establish an OGDH−/− rat model and to explore whether there were any metabolic alterations in the genetically manipulated rats.
Materials and methods
Animals
All the rats were kept in a temperature (approximately 25 °C)-and humidity (60%)-controlled animal facility with free access to food and water; the light–dark cycle at the Animal Center Laboratory of Henan Province is a 12 : 12 h cycle. The animal study was approved by the Institutional Animal Care and Use Committee of the China Medical Association (permit number: SCXK2011–0001). Forty-eight rats (6 weeks old) were randomly divided into two groups, the control group and the experiment group, and each group included wild-type (6 males and 6 females) and KO rats (6 males and 6 females). The control group was fed a normal diet, and the experimental group had access to a 60% high-fat diet (D12492, RESEARCH DIETS, INC.). After 12 weeks of feeding, the rats were fasted overnight and euthanized.
Generation of knockout rats and mating experiment
The target sites and recognition sequences targeting the OGDH gene were designed, and the TALEN plasmids were constructed according to the kit instructions (Viewsolid Biotech Company, Beijing, China). The most effective plasmid pairs were screened by luciferase. TALEN plasmid pairs were transcribed into mRNA by the kit from Viewsolid Biotech Company in vitro and stored at −80 °C until used for embryo injection. Fertilized one-cell embryos were transferred to the medium for microinjection, and mRNA concentrations of 20 ng μL−1 of the most effective TALEN plasmids were mixed and injected into the cytoplasm. Embryos that survived the injection procedure were surgically transferred to the oviduct of Sprague Dawley (SD) female rats. A male and a female heterozygous rat of reproductive age were put in one cage for mating. The male rat was transferred to another cage after the female was pregnant. The rats that were born were used for follow-up experiments.
Mutation analysis (genomic DNA extraction, PCR and sequencing)
The tail snips (approximately 1 cm) from 2 week-old offspring rats were cut, and the DNA was extracted with a Tissue DNA Kit (OMEGA, D3396-02, USA) following the manufacturer's instructions. The extracted DNA was amplified by PCR: 2x Taq Master Mix (CW Biotech, Beijing, China) 12.5 μL, forward primer 1 μL, reverse primer 1 μL, DNA 500 ng, and RNase-free water was adjusted to a volume of 25 μL. The primers are shown in Table 1. The conditions for PCR analyses were as follows: 98 °C 3 min; 98 °C 10 s, 60 °C 20 s, 72 °C 20 s, 35 cycles; 72 °C 2 min and 4 °C preservation. The PCR products were cloned into pMD19 T vector (D102A, TaKaRa, China) and sent to Sangon Biotech (China) for sequencing.
Primers for sequencing.
| Gene name | Sequence (5′ to 3′) | |
|---|---|---|
| OGDH | Forward primer | CAGGTATTTGTGGAAGGCTTCAG |
| Reverse primer | CCACTGAGGCCACCCGGAGTCTG |
Real-time quantitative polymerase chain reaction (RT-qPCR) analysis
Total RNA from tissue samples of rats was extracted using TRIzol reagent (TaKaRa, Japan). The concentration and purity of all total RNA samples were verified using a NanoDrop 2000 (Thermo Scientific). A Revert Aid First Strand cDNA Synthesis Kit (TaKaRa, Japan) was used for cDNA synthesis. The forward and reverse primer sequences are shown in Table 2. Quantitative real-time PCR using SYBR Green PCR Master Mix (Qiagen, Germany) was performed with an Agilent Mx3005P QPCR system. Samples were amplified using the following conditions: 95 °C for 5 min and then 40 cycles of 95 °C for 10 s and 60 °C for 30 s. Relative gene expression was determined by normalizing the expression of each target gene to GAPDH. The data were analysed by using 2−ΔΔCt.
Primers for qRT-PCR.
| Gene name | Sequence (5′ to 3′) | |
|---|---|---|
| OGDH | Forward primer | CAAACCAGCAGCAATTAGGACG |
| Reverse primer | TGGGATTCTCCAACCAGGCA |
Western blotting
The tissues were lysed with mixed RIPA buffer containing 50 mM Tris–HCl (pH 7.5), 150 mM NaCl, 1% NP-40, 0.5% sodium deoxycholate, 0.1% SDS and 1% PMSF (100×) (Cwbio, Beijing, China) on ice for approximately 30 min and then centrifuged at 1500 × g for five min at 4 °C. A total of 30 μg of proteins was loaded on 12% SDS-PAGE and then transferred to PVDF (Millipore, Bedford, MA) membrane. The membrane was blocked in TBST buffer containing 5% non-fat milk at room temperature (22 °C) for 1 h and then probed with OGDH antibody (1 : 1000, Proteintech Group, 15212-1-AP) at 4 °C overnight, followed by incubation with horseradish peroxidase-conjugated secondary antibody (1 : 1000, Servicebio, GB23303) for 1 h at room temperature. Then, the membrane was exposed to chemiluminescent reagent (ECL) for approximately 5–10 min. The membranes were then exposed to X-ray photographic films in a darkroom, and the band densities were later quantified with ImageJ Software (NIH, USA).
OGDH enzymatic activity assay
The OGDH enzymatic activity was detected according to the manufacturer's instructions (α-Ketoglutarate Dehydrogenase Activity Colorimetric Assay Kit, Biovision, K678-100). Tissues (10 mg) in 100 μl of ice-cold OGDH Assay Buffer were rapidly homogenized and centrifuged at 10 000 × g for 10 min before insoluble materials were removed. Then, 50 μl sample supernatant and 50 μl master reaction mix were added to the wells in a 96-well plate for each sample. OD values at 450 nm were measured after a 30 min incubation at 37 °C. The sample OGDH enzymatic activity was determined by OD values based on the standard curve.
Biochemical analysis
After the rats were euthanized, blood samples were obtained by cardiac puncture, and the serum was separated by centrifugation (3000 rpm, 10 min, 4 °C) and stored at −80 °C for later assays. Blood tests were performed with a Synchron CX5 clinical system (Beckman Coulter, USA) for the following measurements: glucose (GLU), alanine aminotransferase (ALT), aspartate aminotransferase (AST), total protein (TP), albumin (ALB), globulin (GLO), ALB/GLO, total cholesterol (CH) and triglycerides (TG).
Haematoxylin and eosin (HE) staining
Tissues were fixed with 10% formaldehyde, embedded in paraffin, cut into 4 μm sections and stained with haematoxylin and eosin (HE). Steps for HE staining were as follows: the sections were baked at 60 °C for 1 h, dewaxed, hydrated in ethanol at different concentrations (75%, 85%, 95% and anhydrous ethanol), stained with haematoxylin for 3 min, rinsed under running tap water, stained with eosin for 3 min, dehydrated with anhydrous ethanol, transparentized with xylene I and xylene II, and finally mounted in neutral gum. The tissue sections were observed under a microscope.
Oil Red O staining
Eight-μm frozen slices were stained first, fixed in formalin, washed with tap water and then rinsed with 60% isopropanol. The slices were then stained with freshly prepared Oil Red O (Servicebio, G1016) for 15 min (dark) before rinsing with 60% isopropanol again. The slices were stained with aluminium haematoxylin for 3–8 min, rinsed with water, mounted in glycerine gelatine and evaluated under a microscope.
IHC detection
All the tissues from each animal were fixed with 10% formaldehyde and embedded in paraffin blocks. Paraffin-embedded specimens were cut into 4 μm thick sections for immunohistochemical examination. The sections were deparaffinized in xylene and then microwaved in 10 mM citrate buffer (pH 6.0) in order to unmask the epitopes. Endogenous peroxidase activity was blocked with 3% peroxidase blocking solution for 20 min. Sections were incubated with p53 antibody (1 : 100, Abcam, ab131442) at 4 °C overnight, followed by secondary antibody linker incubation for 30 min. After gently rinsing three times with PBS, HRP was added and incubated for 30 min at room temperature. Slides were then stained for 2 min with 3,3′-diaminobenzidine tetrahydrochloride (DAB) for 10 min, counter-stained with haematoxylin, dehydrated and mounted.
Statistical analyses
Repeated measures (at least three times) were analysed by one-way ANOVA and Student's t test using GraphPad prism 5.0 software. All experimental data were shown as the mean ± SD. The results were considered statistically significant at p < 0.05.
Results
TALEN design and OGDH−/− rat establishment
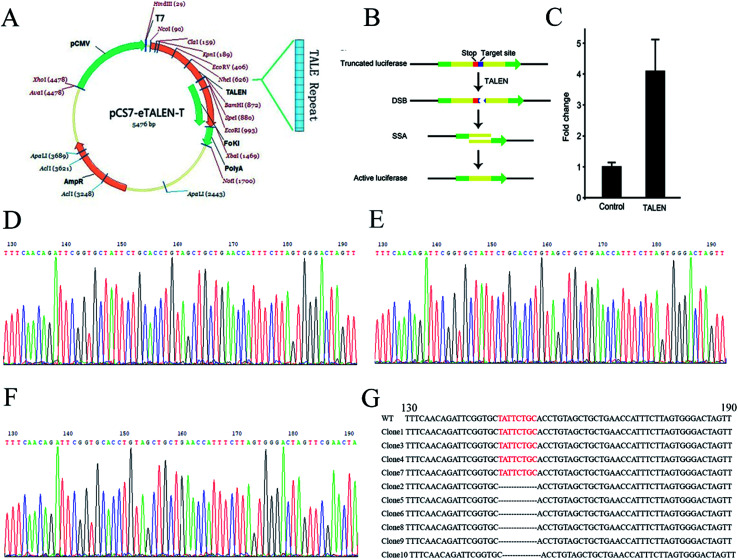
To knock out the OGDH gene by TALEN, TALEN plasmids targeting the OGDH gene were constructed by using the Golden Gate method as illustrated graphically in Fig. 1A. Fig. 1B demonstrates the principle of TALEN activity detection by Luciferase SSA. The tested TALEN activity levels are shown in Fig. 1C. The most effective plasmid was screened by the luciferase activity method. To obtain OGDH−/− rats, the most effective plasmid pairs were transcribed into mRNA in vitro. The mRNA was injected into the cytoplasm of SD rat embryos, and then, the embryos were transferred to pseudo pregnant rat recipients. In total, 18 live-born targeted-mutation offspring were produced from 80 injected zygotes, and the success rate was 22.5%. Two weeks after birth, the tails of the new born SD rats were cut for DNA isolation before sequencing. Only OGDH+/− rats were identified, and no OGDH−/− rats were discovered from the 18 mutated offspring. The heterologous mutation identified by TA clone sequencing was an 8-base deletion in one allele in exon 1 (OGDH-KO-8) (Fig. 1D–G). To further explore the possibility of creating OGDH−/− rats, mating experiments with 30 pairs of OGDH+/− rats were performed for a period of 10 months. Surprisingly, no OGDH−/− rats were obtained at all. To understand the efficiency of OGDH gene knockout, three pairs of OGDH+/− rats born at 2 weeks were randomly selected for further mating experiments. The birth rates of the heterozygous rats were 71.4%, 83.3% and 66.7%, respectively, giving an average rate of 73.8% and confirming a high birth rate in heterozygous rats (Table 3). The results of this part of the experiments were partly published in Chinese earlier.21
Fig. 1. TALEN design and OGDH−/− rat establishment. (A) Shows the assembly of TALEN. (B) Shows the detection principle of TALEN activity. The red mark represents a terminator, and the blue marker represents a TALEN target position sequence. The target location produces DSB under the action of TALEN. Then, cells repair DNA by homologous recombination and form an active luciferase. (C) Shows the activity level of TALEN by the change of reference ratio. (D) Shows the OGDH gene sequencing result of WT rats. (E) and (F) show two different situations of the OGDH sequencing result of the OGDH+/− rats. The red bases in (G) show the TALEN targets in WT rats, and these bases are missing in the OGDH+/− rats.
The birth rate of heterozygotes of OGDH knockout rats.
| Mother rats name | The number of heterozygotes | Total number | The birth rate of heterozygotes |
|---|---|---|---|
| OGDH-F1-1 | 5 | 7 | 71.4% |
| OGDH-F1-2 | 5 | 6 | 83.3% |
| OGDH-F1-3 | 6 | 9 | 66.7% |
Reduced OGDH expression was present in tissues in the OGDH+/− rat
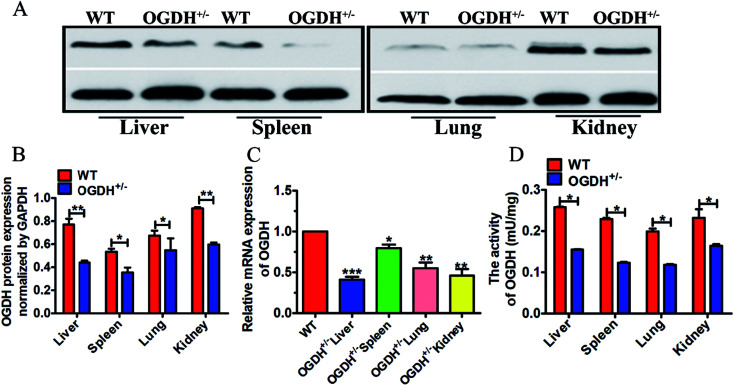
To further verify the OGDH+/− status in the rats verified by PCR product sequencing, gene and protein expression levels of OGDH were analysed by qRT-PCR and Western blotting, respectively. In addition, the OGDH enzymatic activity in the liver, spleen, lung and kidney was examined with a commercially available OGDH enzymatic activity kit. Western blot analysis of tissue lysates demonstrated reduced OGDH protein expression in the liver, spleen, lung and kidney in the OGDH+/− rats as shown in Fig. 2A and B. In line with these findings, the OGDH mRNA expression was correspondingly reduced in the OGDH+/− rats compared to the controls and verified in all the tissues by qRT-PCR as shown in Fig. 2C. Fig. 2D shows the OGDH enzymatic activity in the tissues, and the activity was also decreased in the liver, spleen, lung and kidney in the OGDH+/− rats (P < 0.05).
Fig. 2. OGDH mRNA, protein expression and enzymatic activity examination. (A) Shows protein expression examined with Western blot in the liver, spleen, lung and kidney of WT and OGDH+/− rats. (B) Correspondingly quantified densitometry of the Western blotting results as shown in (A). (C) Shows the results of the OGDH mRNA detected by RT-qPCR in the liver, spleen, lung and kidney of WT and OGDH+/− rats. (D) Shows the OGDH enzymatic activity in the liver, spleen, lung and kidney of WT and OGDH+/− rats. Values are presented as the mean ± SD (n = 3. *P < 0.05, and **P < 0.01, ***P < 0.001).
Clinical observations of the OGDH+/− rats
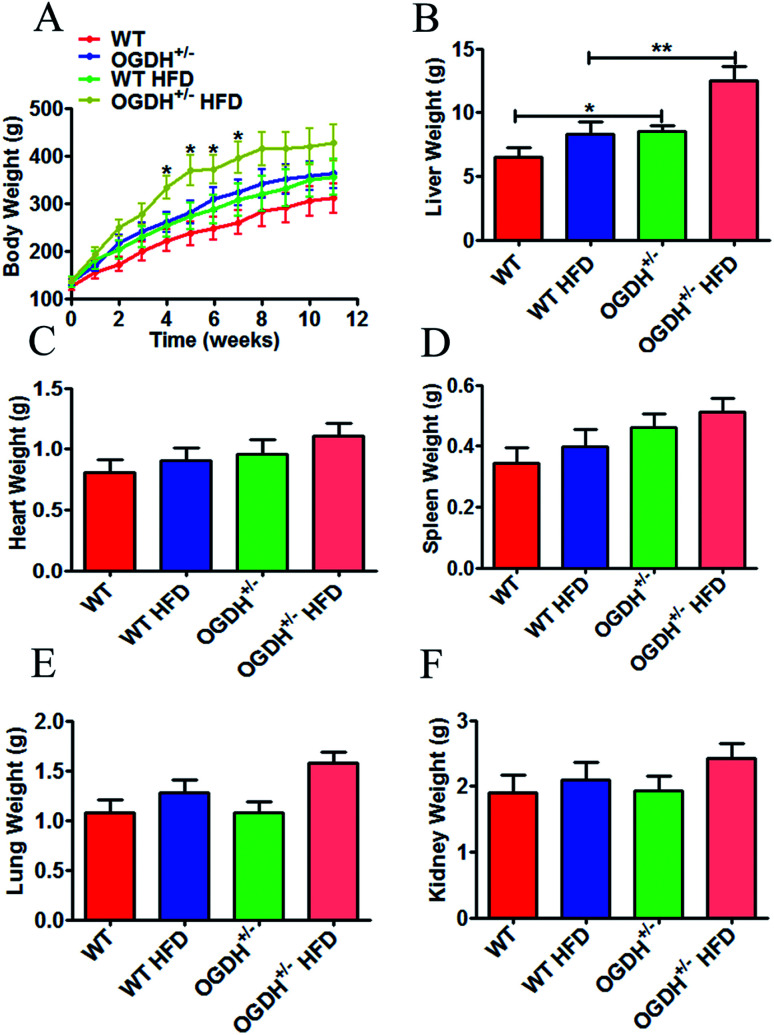
In clinical observations of the OGDH+/− rats, we did not observe any significant changes in fur colour and daily behaviour compared to the control rats, except the significant body weight difference (Fig. 3A). Because metabolic disorder can be triggered by HFD, we conducted a high-fat experiment in the rats later in order to evaluate whether HFD could aggravate the difference between the OGDH+/− and WT rats. Body weight and sex were controlled in grouping. The rats were weighed once a week, and the body influence result is shown in Fig. 3A. The starting average bodyweights for the groups of WT, OGDH+/−, WT HFD and OGDH+/− HFD were 125.333 g, 135.5 g, 135.333 g and 138.667 g, respectively. However, significantly higher body weight was observed in the OGDH HFD group at 4th to 7th weeks, as indicated in the Fig. 3A, where OGDH HFD group showed average bodyweight 333.5 g, 376.725 g, 372.9 g and 397.225 g, but WT HFD group showed only 253.7 g, 274.533 g, 288.367 g and 308.444 g. The OGDH+/− rats showed significantly increased body weight (p = 0.05) relative to the WT rats under the normal diet condition, and the body weight difference at week 8 reached a difference of approximately 24%. Compared with the controls, the body weight in the HFD rats showed an even greater difference (p = 0.04). In the HFD rats, the body weight of the OGDH+/− rats showed a 35.04% gain at week 7 compared to that of the control rats. The organ weight examination showed that only the livers were significantly heavier in the OGDH+/− rats relative to WT rats (p = 0.3, 0.05, 0.09, 0.9 and 0.9 in the heart, liver, spleen, lung and kidney, respectively), and treatment with a HFD resulted in an even larger difference in these organs (Fig. 3B–3F). These findings suggest an association between OGDH gene dysfunction, body weight gain, and most likely obesity as well. Based on this indication, we chose rat liver tissues for further biochemical and histological studies.
Fig. 3. Effects of heterozygous OGDH KO and a HFD on body weight and liver weight. (A) Shows quantitative display of the body weight of OGDH+/− rats compared with WT rats fed normal diets and a HFD. Quantitative display of the liver, heart, spleen, lung, and kidney of OGDH+/− rats compared with WT rats on normal diets and HFD are shown in (B)–(F). Values are presented as the mean ± SD (n = 12 separate animals, *P < 0.05, and **P < 0.01).
Clinical haematological and biochemical examinations
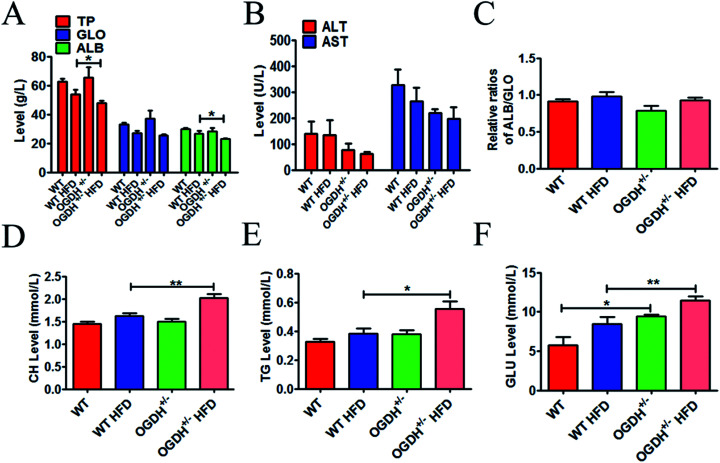
To explore whether OGDH+/− could influence the liver function, a series of related blood samples were examined. The results are shown in Fig. 4. As shown in Fig. 4A–E, there are no differences in TP, GLO, ALB, AST, ALT, ALB/GLO, CH and TG in the different groups of rats under the normal food condition. However, there is a significant difference in the rats fed a HFD. The HFD resulted in significantly higher values of CH and TG in the OGDH+/− rats, with 24.5% (p = 0.004) and 45% (p = 0.02) higher values than those in the WT rats (Fig. 4D and E). In addition, it was found that GLU in the OGDH+/− rats was increased by 64.8% (p = 0.03) and 35.8% (p = 0.009) compared to the control rats fed normal diets and a HFD (Fig. 4F), respectively. These findings suggest that liver function in the OGDH+/− rats is vulnerable to a HFD compared to control rats.
Fig. 4. Results of haematology and biochemistry assays. The blood tests were performed with a Synchron CX5 clinical system. The level of total protein (TP), globulin (GLO), albumin (ALB), alanine aminotransferase (ALT), aspartate aminotransferase (AST), and ratio of ALB/GLO are shown in (A)–(C). (D) and (E) show the results of total cholesterol (CH) and triglycerides (TG); the CH and TG values are significantly higher in the OGDH+/− rats fed a HFD than in the WT rats fed a HFD. (F) Shows higher values of blood glucose (GLU) in the OGDH+/− rats than in the WT rats, and the difference is even greater on a HFD. (n = 12 separate animals, *P < 0.05, and **P < 0.01).
Histological and immunohistochemical evaluations
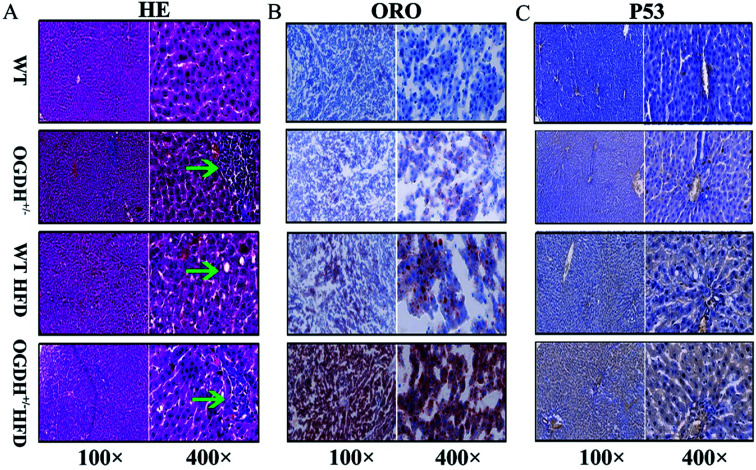
Based on the findings in the biochemical examinations of liver function, histological analysis of livers was conducted by evaluating the haematoxylin–eosin (HE) slides. Small foci of degenerative alterations were observed in the livers of OGDH+/− rats fed normal diets compared to the control rats. Under the HFD condition, the livers of the WT rats had steatosis and mild oedematous alterations. However, even more obvious lesions were seen in the livers of the OGDH+/− rats (Fig. 5A). To determine whether there was abnormal hepatic lipid metabolism, frozen sections of the livers of the rats were stained with Oil Red O. No lipid droplets in hepatocytes were observed in the livers of WT rats, but those of OGDH+/− rats revealed lipid droplets in the hepatic epithelial cells. Under a HFD, an increasing amount of lipid droplets in the hepatic epithelial cells of OGDH+/− rats was observed compared to the that in WT control rats (Fig. 5B).
Fig. 5. Histological and immunohistochemical evaluations. (A) Shows the HE slides of the effects of a normal diet and HFD on WT and OGDH+/− rat livers. The green arrow indicates a focus of degenerative liver alteration. (B) Shows the result of Oil Red O staining. The red indicates fat droplets, and the blue represents the cell nucleus. (C) Shows the results of p53 immunohistochemistry. The yellow indicates positive.
In the rats fed normal diets, p53 immunostaining of the livers of the WT rats were largely negative, while the livers of the OGDH+/− rats were positive. In the rats fed a HFD, the livers of the WT rats were largely negative or weakly positive for p53 expression, while the livers in the OGDH+/− rats were strongly positive for p53 (Fig. 5C). These findings suggest alterations of p53 in the liver of OGDH+/− rats and that such alterations can be aggravated by a HFD.
Discussion
Obesity and associated metabolic syndrome have been global problems in recent decades and have now reached epidemic proportions, but the underlying pathological mechanisms remain unclear. Among the known risk factors for metabolic syndrome, obesity is considered a central and causal risk factor.22,23 Mitochondrial dysfunction is considered one of the major underlying defects linking obesity to metabolic syndrome through insulin resistance and β-cell dysfunction.24 Proper control of metabolic homeostasis is crucial to the maintenance of human physiology and health. The TCA cycle is a ubiquitous metabolic pathway in aerobic organisms, which is the contact hub and final metabolic pathway of sugars, lipids and amino acid metabolism.
OGDH, a molecule in the OGDHC (2-oxoglutaratedehydrogenase complex), takes part in TCA metabolism, lysine degradation and tryptophan metabolism.25 The reactions that OGDH catalysed are irreversible and a rate limiting step in the TCA. A study has shown that OGDH nitrification in diabetic mice is significantly higher than that in healthy mice, suggesting that OGDH activity in diabetic mice may be blocked.20 Some previous studies indicate that obesity has an inseparable relationship with the development of diabetes,26,27 metabolic syndrome6 and tumours.8,9 OGDH-induced neuronal cell death has been reported,28,29 while its role in the process of cancer development remains unknown. It was reported that OGDH contributes to fumarate accumulation and optimal growth of FH-deficient cells and may play a role in a broader array of cancer cell lines.30
The liver as a central organ in metabolism is strongly affected by metabolic syndrome and plays an important role in metabolic homeostasis by coordinating the breakdown, synthesis, storage and redistribution of nutrients.31 It is widely known that the liver plays a key role in lipogenesis, gluconeogenesis and cholesterol metabolism. The associated metabolic pathways are closely regulated by insulin or adipocytokines.32 Adipocytes are an active player in the tumour microenvironment. Studies have shown that adipocytes and cancer cells are close neighbours, and adipocytes secrete adipokines promoting tumour growth. In addition, adipocytes are often in close contact with cancer cells in many tumours. Obesity, associated with an increase in adipose mass and an alteration in adipose tissue, has been established as a risk factor for cancer incidence and cancer-related mortality.33 Compared to cancer patients of healthy body weight, obesity has been clearly associated with higher mortality in obese cancer patients.34 The weight gain of OGDH+/− rats may provide new research clues for the study of metabolic syndrome and tumour development and then interference studies of OGDH salvaging strategies in metabolic syndrome and tumour prevention. It should be pointed out that a limitation in this study is that we did not study the fat tissue. However, the liver samples studied with the Oil Red O staining were revealed to have lipid droplet accumulation in the OGDH+/− rats, and such a pathological alteration was stronger in the OGDH+/− rats under HFD, indicating abnormal lipid metabolism in the OGDH+/− rats.
p53 has been considered one of the classical type tumour suppressors that regulates many important cellular pathways, including cell survival, DNA repair, apoptosis, and senescence.35 More than 50% of human cancers carry loss-of-function mutations in the p53 gene. In normal cells, p53 is expressed in a functionally latent form at an extremely low level, which is caused by proteasomal degradation mediated largely by RING-finger type E3 ubiquitin protein ligase MDM2.36 The high expression of p53 is often associated with p53 mutation, which is widely observed in tumours.37 The altered p53 protein expression in the OGDH+/− rats may indicate a role of the dysfunctional OGDH gene in carcinogenesis.
As a convenient and efficient gene-editing technology, TALEN has been used in all fields of biological sciences and has been a major technological breakthrough in the field of gene research.38–42 In this study, the OGDH+/− rats were successfully established using TALENs. Through a long-term mating experiment, no OGDH−/− rat was identified, indicating strongly the lethality of the OGDH KO in rats. However, rats may survive the OGDH+/− lesion as shown in this study, and OGDH expression is correspondingly reduced in the tissues of the OGDH+/− offspring.
The OGDH+/− rats manifested higher body weight than the WT rats, and the difference was even significantly greater with a HFD. Comparatively, the blood biochemical values of CH, TG and GLU in the OGDH+/− rats were significantly increased in the rats with a HFD, indicating a liver function abnormality in the rats. Histological and immunohistochemical evaluations showed corresponding pathological and molecular alterations in the HFD OGDH+/− rats as well, revealing a connection between dysfunction of OGDH and obesity and between obesity and liver function abnormality.
OGDH is an enzyme of the TCA cycle, and abnormal OGDH enzyme activity may lead to a break in the TCA cycle, resulting in abnormal metabolism. This may explain the increasing body weight observed in the OGDH+/− rats, although the molecular mechanism behind this is still a matter of study. Our clinical haematology and biochemistry analysis showed liver dysfunction in the OGDH+/− rats, and histological and immunohistochemical evaluations also indicated liver dysfunction and lesions in the HFD OGDH+/− rats, suggesting a dysmetabolism of fat in the OGDH+/− rats.
Conclusion
This study provides evidence that OGDH−/− is lethal in rats and heterozygous OGDH KO reduces gene and protein expression of OGDH in the tissues. The OGDH+/− rats show increased body and liver weights and hepatocytic droplet accumulation. In addition, such alterations are aggravated with a HFD showing both liver dysfunction and histological and molecular abnormalities. These findings highlight a potential role of OGDH in obesity and obesity-related health problems, such as diabetes, metabolic syndrome and cancer. The liver weight increased and related morphological and molecular abnormalities in the OGDH+/− rats may provide a useful model for further obesity-related hepatic carcinogenesis investigations.
Conflicts of interest
The authors declare no potential conflicts of interest.
Supplementary Material
Acknowledgments
This study was supported by the National Natural Science Foundation of China (81272824).
References
- Sturm R. Hattori A. Soc. Sci. Med. 2015;133:205–211. doi: 10.1016/j.socscimed.2015.03.004. [DOI] [PMC free article] [PubMed] [Google Scholar]
- Szadkowska A. Madej A. Ziolkowska K. Szymanska M. Jeziorny K. Mianowska B. Pietrzak I. Ann. Agric. Environ. Med. 2015;22:124–128. doi: 10.5604/12321966.1141381. [DOI] [PubMed] [Google Scholar]
- Tyrovolas S. Koyanagi A. Garin N. Olaya B. Ayuso-Mateos J. L. Miret M. Chatterji S. Tobiasz-Adamczyk B. Koskinen S. Leonardi M. Haro J. M. Exp. Gerontol. 2015;64:70–77. doi: 10.1016/j.exger.2015.02.010. [DOI] [PubMed] [Google Scholar]
- Du T. Sun X. Yin P. Yuan G. Zhang M. Zhou X. Yu X. BMC Public Health. 2014;14:961. doi: 10.1186/1471-2458-14-961. [DOI] [PMC free article] [PubMed] [Google Scholar]
- Dong J. Guo X. L. Lu Z. L. Cai X. N. Wang H. C. Zhang J. Y. Yan L. X. Xu A. Q. BMC Public Health. 2014;14:1080. doi: 10.1186/1471-2458-14-1080. [DOI] [PMC free article] [PubMed] [Google Scholar]
- Vicennati V. Garelli S. Rinaldi E. Rosetti S. Zavatta G. Pagotto U. Pasquali R. Horm. Mol. Biol. Clin. Invest. 2015;21:75–87. doi: 10.1515/hmbci-2015-0002. [DOI] [PubMed] [Google Scholar]
- Booth A. Magnuson A. Fouts J. Foster M. Horm. Mol. Biol. Clin. Invest. 2015;21:57–74. doi: 10.1515/hmbci-2014-0037. [DOI] [PubMed] [Google Scholar]
- Daley-Brown D. Oprea-Ilies G. M. Lee R. Pattillo R. Gonzalez-Perez R. R. Horm. Mol. Biol. Clin. Invest. 2015;21:89–106. doi: 10.1515/hmbci-2014-0049. [DOI] [PMC free article] [PubMed] [Google Scholar]
- Agalliu I. Williams S. Adler B. Androga L. Siev M. Lin J. Xue X. Huang G. Strickler H. D. Ghavamian R. Cancer Causes Control. 2015;26:821–830. doi: 10.1007/s10552-015-0554-z. [DOI] [PMC free article] [PubMed] [Google Scholar]
- Fosslien E. Ann. Clin. Lab. Sci. 2008;38:307–329. [PubMed] [Google Scholar]
- Jiang P. Du W. Wang X. Mancuso A. Gao X. Wu M. Yang X. Nat. Cell Biol. 2011;13:310–316. doi: 10.1038/ncb2172. [DOI] [PMC free article] [PubMed] [Google Scholar]
- Anderson N. M. Mucka P. Kern J. G. Feng H. Protein Cell. 2018;9:216–237. doi: 10.1007/s13238-017-0451-1. [DOI] [PMC free article] [PubMed] [Google Scholar]
- Yuan C. Clish C. B. Wu C. Mayers J. R. Kraft P. Townsend M. K. Zhang M. Tworoger S. S. Bao Y. Qian Z. R. Rubinson D. A. Ng K. Giovannucci E. L. Ogino S. Stampfer M. J. Gaziano J. M. Ma J. Sesso H. D. Anderson G. L. Cochrane B. B. Manson J. E. Torrence M. E. Kimmelman A. C. Amundadottir L. T. Vander Heiden M. G. Fuchs C. S. Wolpin B. M. J. Natl. Cancer Inst. 2016;108:djv409. doi: 10.1093/jnci/djv409. [DOI] [PMC free article] [PubMed] [Google Scholar]
- Pavlova N. N. Thompson C. B. Cell Metab. 2016;23:27–47. doi: 10.1016/j.cmet.2015.12.006. [DOI] [PMC free article] [PubMed] [Google Scholar]
- Montal E. D. Dewi R. Bhalla K. Ou L. Hwang B. J. Ropell A. E. Gordon C. Liu W. J. DeBerardinis R. J. Sudderth J. Twaddel W. Boros L. G. Shroyer K. R. Duraisamy S. Drapkin R. Powers R. S. Rohde J. M. Boxer M. B. Wong K. K. Girnun G. D. Mol. Cell. 2015;60:571–583. doi: 10.1016/j.molcel.2015.09.025. [DOI] [PMC free article] [PubMed] [Google Scholar]
- Sen T. Sen N. Noordhuis M. G. Ravi R. Wu T. C. Ha P. K. Sidransky D. Hoque M. O. PLoS One. 2012;7:e48770. doi: 10.1371/journal.pone.0048770. [DOI] [PMC free article] [PubMed] [Google Scholar]
- Szabo P. Cai X. Ali G. Blass J. P. Genomics. 1994;20:324–326. doi: 10.1006/geno.1994.1178. [DOI] [PubMed] [Google Scholar]
- Bonnefont J. P. Chretien D. Rustin P. Robinson B. Vassault A. Aupetit J. Charpentier C. Rabier D. Saudubray J. M. Munnich A. J. Pediatr. 1992;121:255–258. doi: 10.1016/S0022-3476(05)81199-0. [DOI] [PubMed] [Google Scholar]
- Sadakata T. Furuichi T. Neurosci. Lett. 2006;405:217–222. doi: 10.1016/j.neulet.2006.07.008. [DOI] [PubMed] [Google Scholar]
- Yu Q. Liu B. Ruan D. Niu C. Shen J. Ni M. Cong W. Lu X. Jin L. Proteomics. 2014;14:2417–2426. doi: 10.1002/pmic.201400274. [DOI] [PubMed] [Google Scholar]
- Yu D. Li Y. Li X. Cao J. Ji Z. Zhang M. Suo Z. Journal of Basic and Clinical Medicine. 2016;36:1068–1073. [Google Scholar]
- Spiegelman B. M. Flier J. S. Cell. 2001;104:531–543. doi: 10.1016/S0092-8674(01)00240-9. [DOI] [PubMed] [Google Scholar]
- Polsky S. Ellis S. L. Curr. Opin. Endocrinol. Diabetes Obes. 2015;22:277–282. doi: 10.1097/MED.0000000000000170. [DOI] [PubMed] [Google Scholar]
- Guo Y. Darshi M. Ma Y. Perkins G. A. Shen Z. Haushalter K. J. Saito R. Chen A. Lee Y. S. Patel H. H. Briggs S. P. Ellisman M. H. Olefsky J. M. Taylor S. S. Mol. Cell. Proteomics. 2013;12:3744–3758. doi: 10.1074/mcp.M113.027441. [DOI] [PMC free article] [PubMed] [Google Scholar]
- Burr S. P. Costa A. S. Grice G. L. Timms R. T. Lobb I. T. Freisinger P. Dodd R. B. Dougan G. Lehner P. J. Frezza C. Nathan J. A. Cell Metab. 2016;24:740–752. doi: 10.1016/j.cmet.2016.09.015. [DOI] [PMC free article] [PubMed] [Google Scholar]
- Chaput J. P. Saunders T. J. Tremblay M. S. Katzmarzyk P. T. Tremblay A. Bouchard C. BMC Public Health. 2015;15:111. doi: 10.1186/s12889-015-1353-x. [DOI] [PMC free article] [PubMed] [Google Scholar]
- Stagi S. Lapi E. Seminara S. Pelosi P. Del Greco P. Capirchio L. Strano M. Giglio S. Chiarelli F. de Martino M. Ital. J. Pediatr. 2015;41:10. doi: 10.1186/s13052-015-0109-7. [DOI] [PMC free article] [PubMed] [Google Scholar]
- Starkov A. A. Fiskum G. Chinopoulos C. Lorenzo B. J. Browne S. E. Patel M. S. Beal M. F. J. Neurosci. 2004;24:7779–7788. doi: 10.1523/JNEUROSCI.1899-04.2004. [DOI] [PMC free article] [PubMed] [Google Scholar]
- Ko L. W. Sheu K. F. Thaler H. T. Markesbery W. R. Blass J. P. J. Mol. Neurosci. 2001;17:361–369. doi: 10.1385/JMN:17:3:361. [DOI] [PubMed] [Google Scholar]
- Sullivan L. B. Martinez-Garcia E. Nguyen H. Mullen A. R. Dufour E. Sudarshan S. Licht J. D. Deberardinis R. J. Chandel N. S. Mol. Cell. 2013;51:236–248. doi: 10.1016/j.molcel.2013.05.003. [DOI] [PMC free article] [PubMed] [Google Scholar]
- Oosterveer M. H. Schoonjans K. Cell. Mol. Life Sci. 2014;71:1453–1467. doi: 10.1007/s00018-013-1505-z. [DOI] [PMC free article] [PubMed] [Google Scholar]
- Bechmann L. P. Hannivoort R. A. Gerken G. Hotamisligil G. S. Trauner M. Canbay A. J. Hepatol. 2012;56:952–964. doi: 10.1016/j.jhep.2011.08.025. [DOI] [PubMed] [Google Scholar]
- Duong M. N. Geneste A. Fallone F. Li X. Dumontet C. Muller C. Oncotarget. 2017;8:57622–57641. doi: 10.18632/oncotarget.18038. [DOI] [PMC free article] [PubMed] [Google Scholar]
- Park J. Euhus D. M. Scherer P. E. Endocr. Rev. 2011;32:550–570. doi: 10.1210/er.2010-0030. [DOI] [PMC free article] [PubMed] [Google Scholar]
- Zhu J. Sammons M. A. Donahue G. Dou Z. Vedadi M. Getlik M. Barsyte-Lovejoy D. Al-awar R. Katona B. W. Shilatifard A. Huang J. Hua X. Arrowsmith C. H. Berger S. L. Nature. 2015;525:206–211. doi: 10.1038/nature15251. [DOI] [PMC free article] [PubMed] [Google Scholar]
- Kaur P. Kumar M. Singh A. P. Kaur S. Biomed. Pharmacother. 2017;88:1080–1089. doi: 10.1016/j.biopha.2017.01.111. [DOI] [PubMed] [Google Scholar]
- Yu D. Zhong Y. Li X. Li Y. Li X. Cao J. Fan Z. Fan H. Yuan L. Xu B. Yuan Y. Zhang H. Ji Z. Wen J. G. Zhang M. Nesland J. M. Suo Z. Oncotarget. 2016;7:61656–61669. doi: 10.18632/oncotarget.11429. [DOI] [PMC free article] [PubMed] [Google Scholar]
- Martinez R. A. Stein J. L. Krostag A. R. Nelson A. M. Marken J. S. Menon V. May R. C. Yao Z. Kaykas A. Geschwind D. H. Grimley J. S. Nucleic Acids Res. 2015;43:e65. doi: 10.1093/nar/gkv164. [DOI] [PMC free article] [PubMed] [Google Scholar]
- Matsubara Y. Kato T. Kashimada K. Tanaka H. Zhi Z. Ichinose S. Mizutani S. Morio T. Chiba T. Ito Y. Saga Y. Takada S. Asahara H. Stem Cells Dev. 2015;24:1164–1170. doi: 10.1089/scd.2014.0466. [DOI] [PMC free article] [PubMed] [Google Scholar]
- Arazoe T. Ogawa T. Miyoshi K. Yamato T. Ohsato S. Sakuma T. Yamamoto T. Arie T. Kuwata S. Biotechnol. Bioeng. 2015;112:1335–1342. doi: 10.1002/bit.25559. [DOI] [PubMed] [Google Scholar]
- Shan Q. Zhang Y. Chen K. Zhang K. Gao C. Plant Biotechnol. J. 2015;13:791–800. doi: 10.1111/pbi.12312. [DOI] [PubMed] [Google Scholar]
- Naitou A. Kato Y. Nakanishi T. Matsuura T. Watanabe H. Biol. Open. 2015;4:364–369. doi: 10.1242/bio.20149738. [DOI] [PMC free article] [PubMed] [Google Scholar]


