

Abstract
PEGylation is routinely used to extend the systemic circulation of various protein therapeutics and nanomedicines. Nonetheless, mounting evidence is emerging that individuals exposed to select PEGylated therapeutics can develop antibodies specific to PEG, i.e., anti-PEG antibodies (APA). In turn, APA increase both the risk of hypersensitivity to the drug as well as potential loss of efficacy due to accelerated blood clearance of the drug. Despite the broad implications of APA, the timescales and systemic specificity by which APA can alter the pharmacokinetics and biodistribution of PEGylated drugs remain not well understood. Here, we developed a physiologically based pharmacokinetic (PBPK) model designed to resolve APA’s impact on both early- and late-phase pharmacokinetics and biodistribution of intravenously administered PEGylated drugs. Our model accurately recapitulates PK and biodistribution data obtained from PET/CT imaging of radiolabeled PEG-liposomes and PEG-uricase in mice with and without APA, as well as serum levels of PEG-uricase in humans. Our work provides another illustration of the power of high-resolution PBPK models for understanding the pharmacokinetic impacts of anti-drug antibodies and the dynamics with which antibodies can mediate clearance of foreign species.
Keywords: PBPK model, polyethylene glycol, PEGylated liposomes, accelerated blood clearance, anti-PEG antibodies
Graphical Abstract

Introduction
Polyethylene glycol (PEG) is an uncharged, hydrophilic polymer routinely used to increase the circulation time and decrease the immunogenicity of therapeutic drugs, especially highly immunogenic drugs that are susceptible to induction of anti-drug antibodies (ADA) [1]. The hydrophilicity of PEG increases the aqueous solubility of hydrophobic drugs, thereby improving stability and reducing aggregation [2–6]. In addition, the highly flexible nature of PEG sterically hinders the adsorption of opsonic proteins and other blood components, diminishes interactions with the immune system, increases hydrodynamic diameter, and reduces enzymatic degradation [3, 7]. The resulting ‘stealth’ effect greatly prolongs the systemic pharmacokinetic (PK) profiles of PEGylated therapeutics, sparing millions of patients from daily or weekly injections.
Unfortunately, over the past 15 years, it is increasingly shown that some individuals produce high titers of antibodies specific to PEG [8], a phenomenon likely enhanced by the immunogenicity of the underlying drug [9, 10]. We previously found detectible levels of anti-PEG antibodies (APA) in nearly 70% of blood samples from the general population [11], with the vast majority of subjects possessing an IgG isotype that implies the presence of immune memory and the possibility of rapid induction of APA. This is consistent with clinical observations that showed a sizable fraction of individuals could develop APA when exposed to select PEGylated drugs. For instance, roughly one-third of pediatric acute lymphoblastic leukemia (ALL) patients developed APA that quickly eliminated Oncospar (PEG-asparaginase) from the circulation [12]. The incidence rate increases to nearly half of the patients treated with Krystexxa (PEG-uricase) [13–15], and can be even higher (approaching 100%) in patients treated with Palynziq (PEGylated phenylalanine ammonia lyase, or PEG-PAL) [16]. At sufficient titers, APA can mediate accelerated blood clearance (ABC) of PEGylated drugs [17–23], likely by uptake of APA immune complexes by Kupffer cells and liver sinusoidal endothelial cells (LSEC) [20, 24]. APA also increase the frequency of hypersensitivity to PEGylated therapeutics [25, 26], as reflected by a range of allergic reactions, including anaphylactic shock, to pegloticase [27, 28], pegnivacogin [29], and PEG-containing products such as osmotic laxatives and cosmetic products [30]. More recently, APA are implicated in an allergic response to the Pfizer/BioNTec mRNA vaccines for SARS-CoV-2, due to the inclusion of PEG-lipids in its formulation [31, 32]. Despite the important implications of APA, the relationship between the circulating APA titers and the resulting impact on PK and biodistribution has not been established with high temporal resolution in the context of PK modeling.
Physiologically based pharmacokinetic (PBPK) modeling is a powerful tool enabling a deeper understanding of the fate of drugs and drug carriers in complex biological systems [33–36]. PBPK models can inform preclinical in vivo testing and serve as an impactful tool to guide clinical evaluations as well as potential dosing regimens in special populations [37, 38]. Not surprisingly, PBPK models are routinely used to predict and interpret drug tissue distribution and clearance in various therapeutic areas, clinical scenarios, and patient populations [39, 40]. They are also valuable for risk assessment [41, 42]. Many PBPK models that recapitulate antibodies as biotherapeutics have been developed [43, 44]; however, few models exist that capture how endogenous APA can alter the PK and biodistribution of the drugs, particularly nanomedicines such as PEG-liposomes. Previously, we developed a 2-compartment minimal PBPK model that captures APA-mediated accelerated blood clearance of PEG-liposomes (PL) [45, 46]. While useful in predicting the PK of PEGylated drugs over long timescales, that model was unable to reveal the impact of APA on either biodistribution to different organs, or early phase clearance of PEGylated drugs. In this work, we thus sought to utilize a more comprehensive PBPK model that captures potential APA-mediated clearance of PEGylated liposomal and protein drugs to all major organs of distribution (Figure 1). Leveraging high-resolution PET/CT scans of radiolabeled PEG-liposomes and PEG-uricase performed immediately following dosing to PEG-sensitized vs. naïve animals, we were able to verify that our PBPK model can accurately recapitulate the systemic PK and biodistribution of PEG-liposomes and PEG-uricase to liver, spleen, lung, kidney, and muscle in naïve and APA+ mice with high temporal resolution.
Figure 1.
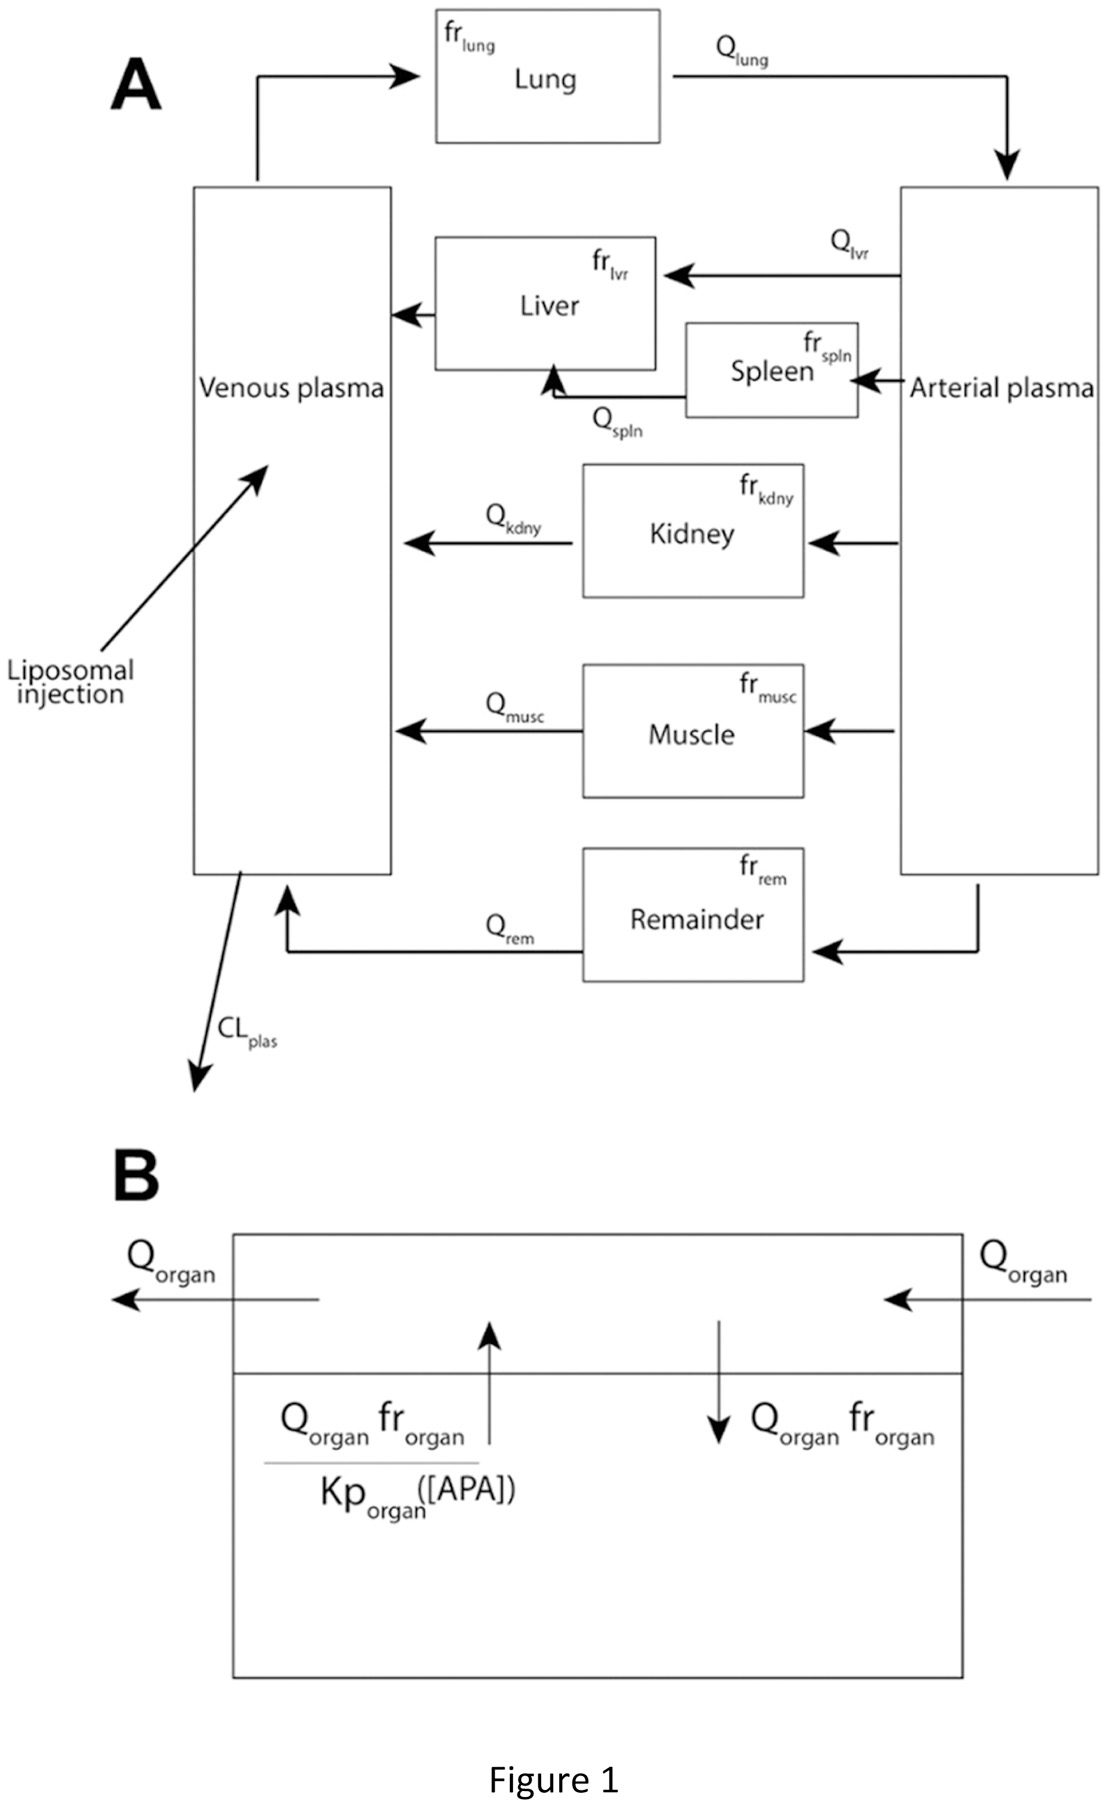
(A) Schematic diagram of the PBPK model. (B) Illustration of PK within each organ compartment.
Materials & Methods
Production of empty PEG-liposomes (PL) for APA-induction.
The PL used for induction were composed of phosphatidylcholine, cholesterol, and methoxy-PEG 2000 DSPE at a molar ratio of 39:56:5 [47]. The lipids were dissolved in a 2:1 chloroform: methanol solution in a glass vial and evaporated with nitrogen gas to form a thin film. This film was desiccated overnight. The following day, PBS heated to 50 °C was added to the vial, which was sonicated at 15 30-second intervals. The liposomes in PBS solution were then extruded 9 times each at a controlled temperature of 50 °C through 400 nm and 100 nm filters. The liposomes were characterized with a Malvern Zetasizer Nano ZS (Malvern Instruments, Malvern, UK) via intensity PSD and confirmed to be 130 nm in diameter with PDI < 0.2.
Induction of APA in immunocompetent BALB/c mice.
Female and male BALB/c mice (Charles River Labs) aged 4–5 weeks were used in this study. Animal procedures used in this study were approved by the University of North Carolina at Chapel Hill Institutional Animal Care and Use Committee. All mice were housed in non-sterile cages with constant access to food and water. To induce APA, mice were intravenously dosed with 150 µL (0.1 µmol lipids/kg bodyweight at 6 mL/kg) of PL in sterile PBS on Day 0, or 7 days prior to PET/CT imaging studies; APA-naïve mice (negative control) received PBS alone. On Day 6, a mandibular bleed was performed on each mouse. 200uL whole blood was transferred in EDTA tubes on ice. The blood was centrifuged at 2000 rcf for 15 minutes to separate the plasma. Samples were stored at 4 °C prior to ELISA assay and moved to −80 °C for long-term storage. IgG and IgM APA in the plasma were quantified via competition ELISA, following the methods described previously [46] (Table S.1).
Quantitation of APA titers.
We determined the concentration of IgG and IgM APA via competition ELISA, run in duplicate for reproducibility. 96-well plates (Corning Costar 3695) were coated with DSPE-PEG5000 and stored overnight at 4 °C. They were then blocked for 1 hour at room temperature with 5% milk in 1x PBS. Plasma samples were diluted 50-fold and 400-fold in 1% milk, and tested in duplicate wells. Competition wells consisted of plasma at 50- or 400- fold dilution in 1% milk with 8 kDa PEG. The standard curve consisted of serial dilutions of mouse anti-PEG IgG (Silver Lake, CH2076) and IgM (Academia Sinica, AGP4 (AGP4-PABM-A)). After overnight incubation at 4 °C, goat anti-mouse IgG (Invitrogen, A28177, lot TG2596484) or IgM (ThermoFisher Life Technologies, 626820, lot QB215229) conjugated to HRP was added to the wells. The plates were incubated for 1 hour at room temperature. The color change was initiated by TMB and stopped with 1N HCl, and absorbance was measured at 450 and 570nm. IgG and IgM concentrations were calculated based on 5-parameter logistic regression on the standard curve rows. The ELISA assays sensitively detected APA levels in excess of 0.6 µg/mL IgG and 0.2 µg/mL IgM. IgG and IgM APA below this level did not lead to appreciable accelerated blood clearance of PEG-liposomes [46].
Preparation of radio-labeled PL for PET/CT imaging.
PL, with ~4% of lipids containing methoxy-PEG and 1% mol of the lipid containing amine-terminated PEG (PEG-NH2) groups that allow for chelator conjugation needed for radiolabeling, were obtained from Encapsula NanoSciences. The composition of this commercial PL included lipids in the following ratio: Hydrogenated Soy Phosphatidylcholine: cholesterol: DSPE-PEG(2000): DSPE-PEG(2000)-Amine at a molar ratio of 57:38:4:1 (lots IMS2007–08272019, IMS2007–04162019, and IMS2007–07212020). The liposomes were radiolabeled with 64Cu chelated with DOTA or 89Zr chelated with Df (p-SCN-Bn-deferoxamine lot B70510004–150407) by conjugating the chelators to amine groups at a 20-fold molar excess to ensure complete reaction of the amines [48]. Purification and stability studies for the first scan group, using DOTA as a chelator, were conducted using a 30 kDa spin filter, and produced 36% yield. The signal of the product was still sufficient through 48h, far longer than the initial phase of interest for this study, and the stability of the recovered Cu-DOTA-liposome was confirmed ~90% through at least the first 4h. Purification for the second scan group was conducted using a PD-10 column and the 24h stability of the radiolabeled sample remained approximately 90%. Purification for the third scan group, using Df as a chelator and Zr as the label, resulted in approximately 67% yield with 4-hour labeling stability once again close to 90% and 24-hour labeling stability of 66%. All stability tests were conducted after incubating radiolabeled sample in saline at 37°C. The zeta potential of the liposomes conjugated with Df indicated that they were approximately neutral (−4.9mV +/− 0.7 mV), suggesting most of the amines were indeed conjugated with Df, and that cationic charge from amine groups is not expected to impact their biodistribution patterns. No signal was detected in the bone of the mouse for the duration of study, indicating that the radiolabel remained attached to the PL, since free label typically accumulates in the bone [49, 50].
PET/CT Imaging.
On day 7, mice underwent PET/CT imaging with radiolabeled PL. Naïve and APA+ mice (n=6 for each cohort) were imaged. The mice were scanned in three groups of four mice each, with n=2 from each cohort in each scan group (Table S.2). Imaging was performed using a small animal PET/CT scanner (SuperArgus_4R, Sedecal, Inc. Spain). Mice were anesthetized with inhalation of 1.5%−2.5% isoflurane-oxygen gas mixture. Radiolabeled PL (5~7 MBq, estimated ~2.1 µmol of PL) was administrated through tail vein catheter, followed immediately by a 60 min dynamic PET scan. CT was conducted for anatomical reference and attenuation correction. Repeated PET/CT imaging (~20 min of PET acquisition) was conducted at 3, 24, and 48 hours post injection of radiolabeled PL. After the final imaging, major organs were collected and weighed, and radioactivity was further measured using a gamma counter to verify PET/CT results.
PET images were reconstructed using the 3D-OSEM algorithms with scatter, attenuation, and decay correction. Standardized uptake value (SUV) was calculated voxel-wise by normalizing the signal to the injection dose and animal body weight. Image analysis was conducted using PMOD software (version 3.9). Regions of interest (ROI) were delineated based on fused PET/CT images, and the uptake level of each ROI was reported in mean %ID/g.
PBPK Model.
A system of Ordinary Differential Equations (ODEs) (Figure 1, Eqns 1–8) was developed for the present focus to replicate the high-resolution PET/CT scan data. Each organ was treated as a well-stirred compartment, and drug transfer from blood to tissue was assumed to follow Fick’s law of diffusion. A remainder compartment was considered to maintain the mass balance of drugs in the system. We assumed tissue distribution rate to be primarily restricted by liposomes’ vascular permeability due to their approximately 100 nm (80–130 nm) size. The average concentration vs. time profiles in each compartment were reported. We assumed that the radioactivity signal primarily originated from the vascular and interstitial sub-compartments, as 100 nm liposomes are likely too large to permeate the deep tissue cellular layers. Transfer between compartments was driven by blood flow. The amount of drug reaching and being retained by each organ was adjusted by perfusion and permeability coefficients.
| (1) |
| (2) |
| (3) |
| (4) |
| (5) |
| (6) |
| (7) |
| (8) |
All physiological parameters, including blood flows and tissue volumes, were taken from the literature (Table 1) [44, 51–53]. The interstitial tissue volume (Vorgan) values were obtained by subtracting the respective vascular plasma contribution from the total organ volume (Table 1). For example,. The initial values of the partitioning coefficients (Kptissue) were determined by taking the ratio of area under the curve (AUC) between tissue and plasma, which were then optimized (Table S.2) [54]. The apparent permeability coefficients of liposomes across vascular membrane were also optimized, accounting for the intrinsic permeability and the impact of other variables at in vivo conditions (shear stress, osmotic pressure, etc.) (Table S.2). Initial conditions were determined from the peaking time of tissue profiles in the data. The model was initialized at the point at which the total PET signal stabilized in the mouse, at approximately 1 min post-injection. The system was solved numerically using MATLAB’s ode15s function (MATLAB R2019a). The PET data for each organ included total signal from both the tissue and residual blood plasma. Therefore, when comparing the model output to the data, we computed a weighted average of PL contained in each organ’s tissue and plasma. Parameters were optimized to obtain individual fits for each mouse using Latin Hypercube Sampling (LHS) (Table S.2) [55]. We furthermore used Partial Rank Correlation Coefficients (PRCC) to determine output sensitivity versus model parameters [56, 57]. Brief descriptions of LHS and PRCC are provided in the Supplemental information. The high temporal resolution of the continuous scan alleviates many concerns of implementing a model in which several parameters are optimized.
Table 1.
Physiological parameters in the PBPK model in 20 g mice.
| Parameter | Interpretation | Value | Ref |
|---|---|---|---|
| Qt lvr | Plasma flow through liver (mL/min) | 1.1 | [44] |
| Qt kdny | Plasma flow through kidney (mL/min) | 0.8 | [44] |
| Qt spln | Plasma flow through spleen (mL/min) | 0.05 | [44] |
| Qt musc | Plasma flow through muscle (mL/min) | 0.8 | [44] |
| Qt lung | Plasma flow through lung (mL/min) | 4.38 | [44] |
| Volume of liver (g) | 1.75 | [51, 52] | |
| Volume of kidney (g) | 0.32 | [51, 52] | |
| Volume of spleen (g) | 0.1 | [51, 52] | |
| Volume of muscle (g) | 7.6 | [51, 52] | |
| Volume of lung (g) | 0.12 | [51, 52] | |
| V plas | Volume of venous blood plasma (mL) | 0.67 | [53] |
| V art | Volume of arterial blood plasma (mL) | 0.67 | [53] |
| PlasFracV lvr | Fraction of volume of murine liver comprised of plasma | 0.155 | [51, 53] |
| PlasFracV kdny | Fraction of volume of murine kidney comprised of plasma | 0.120 | [51, 53] |
| PlasFracV splm | Fraction of volume of murine spleen comprised of plasma | 0.085 | [51, 53] |
| PlasFracV musc | Fraction of volume of murine muscle comprised of plasma | 0.020 | [51, 53] |
| PlasFracV lung | Fraction of volume of murine lung comprised of plasma | 0.250 | [51, 53] |
Results
PET/CT imaging reveals APA quickly eliminates PEG-liposomes from the circulation
In our previous study that relied on quantifying doxorubicin levels in the blood and different organs collected from sacrificed animals, we were unable to gain insights into the PK and biodistribution of Doxil® between 5 mins and 3 hours post-infusion. In contrast, PET/CT imaging, by tracking the PK and biodistribution of radiolabeled entities in the same mouse in nearly continuous time, can accurately reveal the physiological fate of drugs and drug carriers with unparalleled temporal resolution even with just a small number of animals (Figure 2A). To investigate the temporal dynamics with which APA can mediate clearance of PEGylated drug carriers, we thus performed PET/CT imaging in naïve and PEG-sensitized mice infused with radiolabeled PEG-liposomes.
Figure 2.

(A) PET/CT imaging for a representative APA+ and naïve mouse. Note the substantial liver uptake within the first hour of study, particularly in the APA+ mouse. (B) Quantity of PL in the blood and different organs in APA-sensitized (n=6, yellow filled circle) vs. naïve (n=6, blue filled triangle) mice: (i) Blood, (ii) Liver, (iii) Kidney, (iv) Spleen, (v) Muscle, and (vi) Lung. (1 = 100 %ID). (C) Comparison of 1 h AUC of percent injected dose in each organ for APA-sensitized vs. naïve mice. Error bars represent standard deviation.
All mice exhibited a rapid initial re-distribution of PL signals within the first minute of infusion. Naïve mice then exhibited very little change in plasma PL over the first hour, retaining ~50% of the total signal (i.e., injected dose) (Figure 2B). Of the remaining 50% of the PL radioactivity, ~30% was found in the liver, with a steady level observed throughout the first hour of the scan. Muscle mass comprised ~10–20% of the total signal, but was generally very noisy and reflected low, diffuse concentrations. Roughly 1% of the signal was present in the spleen, ~2.5% in the lung, and ~3–4% in the kidney at 1 h after dosing. The trends in change in radioactivity signal over time for the lung and kidney mirrored those in the blood, whereas the trends in the spleen mirrored those in the liver, with much of the increase found within the first 10 minutes post-infusion. These results are consistent with PL distribution primarily to the plasma sub-compartments for each tissue immediately following intravenous dosing, followed by gradual extravasation to the organ interstitium. The difference in the trend of radioactivity accumulation over time likely relates to different rates of extravasation and immune cell uptake in the different organs.
In contrast, PL-sensitized mice with substantial APA titers exhibited rapid and extensive clearance of PL from the systemic circulation within the first hour post-infusion, retaining only ~20% of the injected dose in the circulation at the end of the first hour, less than half of the signal measured in the naïve mice. Much of the clearance from the systemic circulation appeared to occur within the first 10–15 minutes. We found a corresponding increase in PL radioactivity in the liver over the same time frame, accounting for nearly 75% of the injected dose. The dominant hepatic accumulation is consistent with APA-mediated clearance by Kupffer cells and LSECs. In contrast, the spleen, the lung, and the kidney retained only ~2%, ~1%, and ~2.5% of the PL-associated radioactivity at the end of the first hour. The difference in the measured radioactivity by the end of the first hour translates to statistically significant differences in the AUC in the plasma and liver between naïve and PL-sensitized, APA+ mice even within such short duration (p < 0.001, Welch’s t-test) (Figure 2C).
Unfortunately, by 24 hrs post-infusion, we were unable to detect appreciable radioactivity in the plasma from PET/CT imaging (data not shown), which is far shorter than the half-life of PL such as Doxil® established from earlier studies [46]. We believe this is unlikely attributed entirely to the natural decay in radioactivity of 64Cu, as we were also unable to detect a signal from PL labeled with 89Zr. Instead, the most likely explanation is that the amine-functionalized PL preparations purchased commercially and used for tracing were not as stable as clinical formulations of PL, such as Doxil®. We thus only utilized PET/CT data from the first hour post-infusion in validating our PBPK model.
PBPK model accurately captures early phase APA-mediated clearance of PL
We first sought to confirm that our PBPK model can accurately reproduce the PK and biodistribution of PL in the absence of APA over the first hour, using parameter values that are reflective of the mouse anatomy and physiology. We systematically selected and tested combinations of the unknown parameters, while fixing the physiologically known parameters. When calibrating our model, we used a threshold of no more than 10% error between the data and model prediction for each organ (normalized to total signal in the mouse) to stop the optimization process; for most of the data, the error associated with the optimal parameter combination was less than 5%. With minimal optimization, our PBPK model accurately reproduced not only the correct concentration of PL in both plasma and the major organs of interest, but also the change in concentrations over time (Figure 3A, Supp Figure S1–S2). We noticed appreciably greater variations in the data from model predictions in the initial few minutes post-infusion (Supp Figure S3), which is likely attributed to fluctuations in the initial PET signal immediately following infusion. We also noticed generally greater relative error between model prediction and PET/CT measurements of the muscle compartment, which is likely attributed to the low intensity of the signal in this organ resulting in a high signal-to-noise ratio (Supp Figure S3).
Figure 3.

Comparison of PBPK model predictions vs. in vivo PET/CT imaging data for (A) a representative naïve mouse and (B) a representative APA+ mouse (37 µg/mL IgG), reported as %ID/g (1 = 100 %ID/g). Black closed circles represent measurements from PET/CT imaging, whereas turquoise line represents predictions from PBPK model.
We next assessed the ability of our PBPK model to recapitulate APA-mediated clearance of PL from the blood to the liver and spleen. In our previous work on developing a minimal PBPK model for APA-mediated clearance of PL [46], we had already developed the algorithms to tally the rates of APA accumulation on PL over time as a function of APA titers. Thus, for the current more comprehensive PBPK model, once we validated our ability to model the fate of PL over time in the absence of APA, we simply needed to account for the affinity between APA/PL complexes and the accumulation potentials on key organs (captured in the Kp value for each organ). With these additions, our model was able to capture the initial transient dynamics of PL circulation and accumulation in different organs in mice with substantial APA titers (Figure 3B, Supp Figure S1–S3). Not surprisingly, AUC predictions from the model closely matched experimental measurements (Figure 4, Supp Figure S2).
Figure 4.

AUC at 1h time point for n=6 individual mice, predicted by the PBPK model (blue filled square) vs. PET/CT data (black filled circle), for (A) naïve and (B) APA+ mice. AUC values were computed from %ID/g in each organ as a numerical integral in MATLAB.
PBPK models can make predictions that are often difficult to directly test in vivo. For instance, PET/CT imaging does not offer the resolution needed to differentiate the fraction of drug found in the blood vasculature within an organ vs. in the cells/tissue interstitium. Utilizing parameters that are largely consistent with other PBPK models (and thus reflective of the mouse physiology), our PBPK model predicts that a substantial fraction of PL begins to distribute to the liver within the first 5 minutes post infusion, initially within the blood vasculature. It is at this point that the time series curves tracking PL in plasma of naïve and APA+ mice began to diverge. In naïve mice, residual blood (in the liver) continued to account for most of the predicted signal in the liver. In contrast, in APA+ mice, the model predicts that within 15 minutes, a substantial fraction of PL can begin to extravasate from local blood vasculature into the cells and tissues, with the amount of PL in the cells and tissues in the liver dominant over the amount in the local plasma sub-compartment. Such preferential distribution of PL was necessary for the model to faithfully reproduce the observed plasma PK and biodistribution data in both naïve and PL-sensitized, APA+ mice. Indeed, while all of the APA+ mice had a distinct extravasation point in the liver compartment, none of the naïve mice exhibited this behavior. Consistent with physiological trends in the data, the rate of change in drug distribution to the lung and kidney compartments tended to mirror those in the plasma (which indicates no appreciable distribution to cells and tissues within those organs, as the data and model both suggest that much of the signal was attributed to the plasma present in those organs). In contrast, the concentrations in the spleen tended to mirror those in the liver, consistent with the abundance of cells with Fc receptors that can intercept and retain APA-immune complexes.
PBPK model also recapitulates APA-mediated clearance of PL over long timescales
Finally, our goal was to develop a comprehensive PBPK model that can recapitulate not only the early fate of PEGylated drug carriers but also their PK and biodistribution over longer timescales. To assess the predictive power of our model over the course of days, we tested our model against our prior data set, capturing the fate of Doxil® (PEGylated liposomal doxorubicin) in mice with and without APA [46]. The APA+ mice in this data set possessed anti-PEG IgG levels of ~0.3 µg/mL, enough to induce ABC of PL, but lower than the APA levels in PL-sensitized mice from our PET/CT studies. We had to fine-tune model parameters to account for the fact that Doxil® has a longer systemic persistence than the PL used in our PET/CT studies. Our model accurately recapitulated the PK and biodistribution of the drug in the liver, lung, and spleen over a 96-hour period (Figure 5), underscoring the model’s ability to capture the fate of PL at both short and long timescales. It should be noted that minimal tuning of the other model parameters was necessary, and the only notable difference was lower splenic uptake of Doxil® at later time points. This suggests that the model accurately captures the physiology of APA-mediated accelerated clearance, and that it is generally adaptable to predicting PK of other drugs and assessment through alternate experimental designs.
Figure 5.

PBPK model recapitulates Doxil® pharmacokinetics and distribution in (A) naïve mice and (B) APA+ mice over 96h, reported in %ID/g (1 = 100 %ID/g). Black closed circles represent Doxil® levels measured by HPLC from Ref [46], whereas red line represents predictions from the current PBPK model. This data reflects the average Doxil® level from 3 mice sacrificed at each time point (5min, 3h, 6h, 24h, 48h, 96h). Error bars represent standard deviation.
PBPK model captures the behavior of PEGylated protein in mice and humans
To test the generalizability of our model to PEG-protein drugs, we next tested our model output to a recently published PET/CT imaging data set measuring the PK and biodistribution of PEG-uricase in naïve and APA+ mice [58]. Notably, PEG-uricase can readily induce APA that leads to accelerated blood clearance of the drug and loss of efficacy [13, 14]. In this data set, APA were induced in mice by injection of PEG-uricase approximately two weeks prior to the imaging study, and APA titers were measured and confirmed to be above the threshold for ABC [58]. After accounting for differences in size and tissue permeability between PEG-uricase and PEG-liposomes, our PBPK model was able to accurately recapitulate the behavior of the PEG-uricase in both naïve (n=4) and APA+ (n=6) mice, as quantified by the concentration estimated and measured in the plasma, liver, kidney, muscle, and lung (Figure 6). The extent of variations between model predictions and experimental measurements was small and comparable to the PL data. The optimal parameter sets for capturing PEG-uricase clearance were very similar to those utilized for modeling PL, with the exception that permeability of the drug was slightly increased due to the smaller size of uricase compared to PEG-liposomes.
Figure 6.

PBPK model recapitulates PEGylated uricase pharmacokinetics and distribution in (A) naïve mice and (B) APA+ mice over 96h, reported in %ID/g (1 = 100 %ID/g). Black closed circles represent PEG-uricase levels measured by PET/CT from Ref [58], whereas red line represents predictions from the current PBPK model. This data reflects the average PEG-uricase level from 4 (naïve) and 6 (APA+) mice scanned at each time point (1h, 4h, 24h, 48h, 72h, 96h). Error bars represent standard deviation.
To demonstrate the potential clinical utility of our PBPK model, we next evaluated our model’s ability to recapitulate the circulation of PEG-uricase in humans [13]. Given the clinical sampling nature, only plasma uricase activity was reported; from the activity, we could approximate PEG-uricase concentration in the plasma and normalize to the full injected dose. The model was adapted to simulate an average 71kg male, utilizing previously determined physiological parameters for organ volume and blood flow available in the literature [59]. We again found very good agreement between our PBPK model predictions and the reported PEG-uricase activity in both patients with accelerated and non-accelerated clearance of the PEG-uricase (Figure 7). This serves as a compelling proof of concept for the clinical utility of our model in future work guiding the dosing of PEG-uricase, and possibly other PEGylated therapies.
Figure 7.

PBPK model recapitulates PEGylated uricase pharmacokinetics and distribution in (A) PEG-uricase responders with typical clearance of the drug, and (B) PEG-uricase non-responders who exhibit accelerated clearance of PEG-uricase, reported in %ID/kg (1 = 100 %ID/kg). Black closed circles represent PEG-uricase levels approximated by uricase activity measurements from Ref [13], whereas red line represents predictions from the current PBPK model. This data reflects the average PEG-uricase level in plasma sampled from 17 (standard clearance; responder) or 13 (accelerated clearance; transient or non-responder) patients at each time point (2h, 48h, 7d, 14d, 21d). Error bars represent standard deviation. It should be noted that the equipment tolerance from Ref [13] allowed a minimum value equivalent to about 0.02 %ID/kg.
Discussion
Numerous clinical trials have shown that the human immune system can secrete APA – effectively a form of ADA – that in turn can directly reduce efficacy and/or trigger hypersensitivity reactions to at least select PEGylated therapeutics. A distinguishing feature of APA vs. classical ADA is that APA can be present prior to initial dosing of therapeutics and can also be elicited by other therapies containing PEG or PEG-conjugates. Furthermore, while clinical studies to date indicate only a small number of PEGylated drugs are impacted by APA, those clinical studies effectively reflect only the immunogenicity profiles of the PEGylated drugs being investigated, as the primary and secondary endpoints generally focus on the safety and efficacy of the drug following repeated dosing. Due to the nature of the study design, these clinical studies typically do not reflect the efficacy and safety of the PEGylated drugs when dosed into patients with high APA titers elicited by other means, for instance by other more immunogenic PEGylated drugs. Given the increasing number of PEGylated drugs that are FDA-approved or in clinical development, including the unprecedented scale with which mRNA vaccines stabilized with PEG-lipid conjugates are deployed because of the COVID pandemic, we are likely entering a new era where the polypharmacy risks associated with APA are greater than ever before. In turn, this likely necessitates a new series of tools and approaches for addressing the APA polypharmacy issues.
PBPK models offer a powerful tool to understand, interpret and possibly intervene in risks presented by APA to patients, even in the absence of data from controlled clinical trials. Although a number of mathematical models have been published [60, 61], quantitative insights into the interactions between ADA and their therapeutic targets remain very limited. Indeed, it is difficult to experimentally tease apart complex binding interactions in living systems. The likely demand for more powerful predictive tools for APA motivated us to expand on our minimal PBPK model to develop a comprehensive PBPK model that can accurately recapitulate the circulation profiles of PEGylated protein drugs and liposomes in the presence of APA. While PBPK modeling is largely mechanistic, the combination of mechanistic and data-driven approaches in such models improves their accuracy and predictive ability [62–64]. Here, we validated our PBPK model against both PK and biodistribution data from PET/CT imaging as well as classical assessment of drug concentrations. Our PBPK model was able to accurately recapitulate the in vivo fate of PL and PEG-uricase at both short and long timescales. We believe our model not only can guide animal studies of PEG-immunogenicity, but also serves as a promising platform for interpreting the impact of APA in PEG-sensitized patients in clinical settings.
From both experimental studies and model predictions, it is abundantly clear that PL are rapidly cleared from the systemic circulation in APA+ mice, with liver representing the dominant organ of distribution. In contrast, naïve mice exhibited substantially slower clearance, with PL levels in the spleen comparable to or above those in the liver. Assuming the vasculature and general tissue permeability that governs extravasation of PL should be the same between naïve and APA+ mice, our PBPK model indicates that the distinct PK and biodistribution of PL driven by APA must be attributed to interactions between cells possessing Fc receptors that can bind extravasated APA/PL immune complexes. In other words, the primary driver of APA-mediated clearance of PL from the circulation is unlikely due to preferential distribution of PL from the circulation into a local plasma compartment, but rather enhanced retention of PL that has already been distributed to the liver. Not surprisingly, due to the abundance of cells possessing FcR in the liver, the liver is the dominant organ of APA clearance.
Some disparity between the predicted and observed blood plasma concentrations and clearance can be attributed to the use of PET data from the heart as a proxy for plasma. This data collection process may have captured a low level of additional heart tissue signal, which could not be determined at a high enough resolution to separate. The initial peaks of signal post-injection may not have been fully captured during PET imaging due to image resolution, saturation, and binning limitations. It is also acknowledged that minimal free 64Cu or 89Zr isotope accumulation by the intracellular compartments could have contributed to some of the observed PET signals. There is also the possibility of minimal signal in organs not specifically accounted for, such as the brain, though this has been absorbed into the “remainder” compartment. However, Cu labeling is a common and accepted method for tracking biodistribution with consistent signals [65, 66].
In conclusion, we have demonstrated the ability to track the fate of PEGylated liposomal drug carriers and PEG-uricase while capturing certain complexities of physiology that may significantly impact the dynamics of APA-mediated clearance with high temporal resolution. This multi-compartment PBPK model holds promise for answering questions about the dynamics of APA in systemic circulation. More broadly, we expect future iterations of the model to provide important mechanistic insights into APA-mediated clearance of other PEGylated drugs with diverse physicochemical properties, monoclonal antibody-mediated clearance of pathogens, and other ADA-mediated processes. With this PBPK model, we can explicitly track the binding dynamics of various species in the system, as a multiscale process, rather than as an average phenomenon related to how their effects are propagated. The model lays a framework for testing possible interventions to mitigate APA-mediated accelerated blood clearance. For example, we have previously shown that pre-injection with a high molecular weight free PEG (unbound to drug carriers) can increase the circulation time of PEGylated therapeutics even in the presence of APA [45]. When free PEG is injected into the bloodstream, the APA form complexes with and clear the PEG rather than the drug [45]. Future modeling efforts aim to incorporate the dynamics of free PEG interactions with APA and PEG-liposomes, with the goal of preventing APA-mediated clearance and thus enabling the safe and efficacious use of PEGylated therapeutics in individuals with APA.
Supplementary Material
Highlights.
Anti-PEG antibodies (APA) accelerate the clearance of PEGylated therapeutics
We developed an 8-compartment PBPK model of APA-mediated clearance
The PBPK model was validated against in vivo PK data from mice with/without APA
The PBPK model accurately predicted APA-mediated clearance and distribution in mice
Acknowledgments.
Animal studies were performed within the UNC Lineberger Animal Studies Core at the University of North Carolina at Chapel Hill which is supported in part by an NCI Center Core Support Grant (CA16086) to the UNC Lineberger Comprehensive Cancer Center. The authors would like to thank BRIC Small Animal Imaging core facility for providing the PET/CT imaging service. The imaging core is supported in part by an NCI Grant P30-CA016086. The PET/CT system is supported by NIH instrumentation grant, S10-OD023611.
Funding.
This work was supported by The David and Lucile Packard Foundation (2013–39274, SKL), National Institutes of Health (T32-HL069768 for AMT; R01HL141934 for SKL; R35GM119661 for YC), P.E.O. International (AMT), and Eshelman Institute of Innovation (SKL). MGF and TW were supported in part from the National Science Foundation (NSF) grants DMS-1664645, DMS-2028758, CISE-1931516.
Footnotes
Publisher's Disclaimer: This is a PDF file of an unedited manuscript that has been accepted for publication. As a service to our customers we are providing this early version of the manuscript. The manuscript will undergo copyediting, typesetting, and review of the resulting proof before it is published in its final form. Please note that during the production process errors may be discovered which could affect the content, and all legal disclaimers that apply to the journal pertain.
Code availability. The code for implementing our ODE system is available at: https://github.com/DrWessler/Experimental-data-and-PBPK-modeling-quantify-antibody-interference-in-PEGylated-drug-carrier-deliver
Conflicts of Interest. The authors have no conflict of interest to disclose.
References
- [1].Knop K, Hoogenboom R, Fischer D, Schubert US, Poly(ethylene glycol) in Drug Delivery: Pros and Cons as Well as Potential Alternatives, Angewandte Chemie International Edition, 49 (2010) 6288–6308. [DOI] [PubMed] [Google Scholar]
- [2].Ivens IA, Achanzar W, Baumann A, Brändli-Baiocco A, Cavagnaro J, Dempster M, Depelchin BO, Irizarry Rovira AR, Dill-Morton L, Lane JH, Reipert BM, Salcedo T, Schweighardt B, Tsuruda LS, Turecek PL, Sims J, PEGylated Biopharmaceuticals: Current Experience and Considerations for Nonclinical Development, Toxicologic pathology, 43 (2015) 959–983. [DOI] [PubMed] [Google Scholar]
- [3].Swierczewska M, Lee KC, Lee S, What is the future of PEGylated therapies?, Expert Opinion on Emerging Drugs, 20 (2015) 531–536. [DOI] [PMC free article] [PubMed] [Google Scholar]
- [4].Gefen T, Vaya J, Khatib S, Harkevich N, Artoul F, Heller ED, Pitcovski J, Aizenshtein E, The impact of PEGylation on protein immunogenicity, International Immunopharmacology, 15 (2013) 254–259. [DOI] [PubMed] [Google Scholar]
- [5].Veronese FM, Mero A, The Impact of PEGylation on Biological Therapies, BioDrugs, 22 (2008) 315–329. [DOI] [PubMed] [Google Scholar]
- [6].Veronese FM, Pasut G, PEGylation, successful approach to drug delivery, Drug discovery today, 10 (2005) 1451–1458. [DOI] [PubMed] [Google Scholar]
- [7].Jevševar S, Kunstelj M, Porekar VG, PEGylation of therapeutic proteins, Biotechnology Journal, 5 (2010) 113–128. [DOI] [PubMed] [Google Scholar]
- [8].Yang Q, Lai SK, Anti-PEG immunity: emergence, characteristics, and unaddressed questions, Wiley interdisciplinary reviews. Nanomedicine and nanobiotechnology, 7 (2015) 655–677. [DOI] [PMC free article] [PubMed] [Google Scholar]
- [9].Wan X, Zhang J, Yu W, Shen L, Ji S, Hu T, Effect of protein immunogenicity and PEG size and branching on the anti-PEG immune response to PEGylated proteins, Process Biochemistry, 52 (2017) 183–191. [Google Scholar]
- [10].Li B, Yuan Z, Hung H-C, Ma J, Jain P, Tsao C, Xie J, Zhang P, Lin X, Wu K, Jiang S, Revealing the Immunogenic Risk of Polymers, Angewandte Chemie International Edition, 57 (2018) 13873–13876. [DOI] [PubMed] [Google Scholar]
- [11].Yang Q, Jacobs TM, McCallen JD, Moore DT, Huckaby JT, Edelstein JN, Lai SK, Analysis of Pre-existing IgG and IgM Antibodies against Polyethylene Glycol (PEG) in the General Population, Analytical Chemistry, 88 (2016) 11804–11812. [DOI] [PMC free article] [PubMed] [Google Scholar]
- [12].Armstrong JK, Hempel G, Koling S, Chan LS, Fisher T, Meiselman HJ, Garratty G, Antibody against poly(ethylene glycol) adversely affects PEG-asparaginase therapy in acute lymphoblastic leukemia patients, Cancer, 110 (2007) 103–111. [DOI] [PubMed] [Google Scholar]
- [13].Hershfield MS, Ganson NJ, Kelly SJ, Scarlett EL, Jaggers DA, Sundy JS, Induced and pre-existing anti-polyethylene glycol antibody in a trial of every 3-week dosing of pegloticase for refractory gout, including in organ transplant recipients, Arthritis Research & Therapy, 16 (2014) R63. [DOI] [PMC free article] [PubMed] [Google Scholar]
- [14].Lipsky PE, Calabrese LH, Kavanaugh A, Sundy JS, Wright D, Wolfson M, Becker MA, Pegloticase immunogenicity: the relationship between efficacy and antibody development in patients treated for refractory chronic gout, Arthritis Research & Therapy, 16 (2014) R60. [DOI] [PMC free article] [PubMed] [Google Scholar]
- [15].Sundy JS, Ganson NJ, Kelly SJ, Scarlett EL, Rehrig CD, Huang W, Hershfield MS, Pharmacokinetics and pharmacodynamics of intravenous PEGylated recombinant mammalian urate oxidase in patients with refractory gout, Arthritis & Rheumatism, 56 (2007) 1021–1028. [DOI] [PubMed] [Google Scholar]
- [16].Longo N, Harding CO, Burton BK, Grange DK, Vockley J, Wasserstein M, Rice GM, Dorenbaum A, Neuenburg JK, Musson DG, Gu Z, Sile S, Single-dose, subcutaneous recombinant phenylalanine ammonia lyase conjugated with polyethylene glycol in adult patients with phenylketonuria: an open-label, multicentre, phase 1 dose-escalation trial, Lancet (London, England), 384 (2014) 37–44. [DOI] [PMC free article] [PubMed] [Google Scholar]
- [17].Abu Lila AS, Kiwada H, Ishida T, The accelerated blood clearance (ABC) phenomenon: Clinical challenge and approaches to manage, Journal of Controlled Release, 172 (2013) 38–47. [DOI] [PubMed] [Google Scholar]
- [18].Fix SM, Nyankima AG, McSweeney MD, Tsuruta JK, Lai SK, Dayton PA, Accelerated Clearance of Ultrasound Contrast Agents Containing Polyethylene Glycol is Associated with the Generation of Anti-Polyethylene Glycol Antibodies, Ultrasound in Medicine & Biology, 44 (2018) 1266–1280. [DOI] [PMC free article] [PubMed] [Google Scholar]
- [19].Ichihara M, Shimizu T, Imoto A, Hashiguchi Y, Uehara Y, Ishida T, Kiwada H, Anti-PEG IgM Response against PEGylated Liposomes in Mice and Rats, Pharmaceutics, 3 (2010) 1–11. [DOI] [PMC free article] [PubMed] [Google Scholar]
- [20].Ishida T, Harada M, Wang XY, Ichihara M, Irimura K, Kiwada H, Accelerated blood clearance of PEGylated liposomes following preceding liposome injection: Effects of lipid dose and PEG surface-density and chain length of the first-dose liposomes, Journal of Controlled Release, 105 (2005) 305–317. [DOI] [PubMed] [Google Scholar]
- [21].Ishida T, Wang X, Shimizu T, Nawata K, Kiwada H, PEGylated liposomes elicit an anti-PEG IgM response in a T cell-independent manner, Journal of Controlled Release, 122 (2007) 349–355. [DOI] [PubMed] [Google Scholar]
- [22].Mohamed M, Abu Lila AS, Shimizu T, Alaaeldin E, Hussein A, Sarhan HA, Szebeni J, Ishida T, PEGylated liposomes: immunological responses, Science and Technology of Advanced Materials, 20 (2019) 710–724. [DOI] [PMC free article] [PubMed] [Google Scholar]
- [23].Chang TC, Chen BM, Lin WW, Yu PH, Chiu YW, Chen YT, Wu JY, Cheng TL, Hwang DY, Roffler AS, Both IgM and IgG Antibodies Against Polyethylene Glycol Can Alter the Biological Activity of Methoxy Polyethylene Glycol-Epoetin Beta in Mice, Pharmaceutics, 12 (2019). [DOI] [PMC free article] [PubMed] [Google Scholar]
- [24].Ganesan LP, Kim J, Wu Y, Mohanty S, Phillips GS, Birmingham DJ, Robinson JM, Anderson CL, FcγRIIb on liver sinusoidal endothelium clears small immune complexes, J Immunol, 189 (2012) 4981–4988. [DOI] [PMC free article] [PubMed] [Google Scholar]
- [25].Kozma GT, Shimizu T, Ishida T, Szebeni J, Anti-PEG antibodies: Properties, formation, testing and role in adverse immune reactions to PEGylated nano-biopharmaceuticals, Advanced Drug Delivery Reviews, (2020). [DOI] [PubMed] [Google Scholar]
- [26].Kozma GT, Mészáros T, Vashegyi I, Fülöp T, Örfi E, Dézsi L, Rosivall L, Bavli Y, Urbanics R, Mollnes TE, Barenholz Y, Szebeni J, Pseudo-anaphylaxis to Polyethylene Glycol (PEG)-Coated Liposomes: Roles of Anti-PEG IgM and Complement Activation in a Porcine Model of Human Infusion Reactions, ACS Nano, 13 (2019) 9315–9324. [DOI] [PubMed] [Google Scholar]
- [27].Calabrese LH, Kavanaugh A, Yeo AE, Lipsky PE, Frequency, distribution and immunologic nature of infusion reactions in subjects receiving pegloticase for chronic refractory gout, Arthritis Research & Therapy, 19 (2017) 191. [DOI] [PMC free article] [PubMed] [Google Scholar]
- [28].Sundy JS, Baraf HSB, Yood RA, Edwards NL, Gutierrez-Urena SR, Treadwell EL, Vázquez-Mellado J, White WB, Lipsky PE, Horowitz Z, Huang W, Maroli AN, Waltrip RW II, Hamburger SA, Becker MA, Efficacy and Tolerability of Pegloticase for the Treatment of Chronic Gout in Patients Refractory to Conventional Treatment: Two Randomized Controlled Trials, JAMA, 306 (2011) 711–720. [DOI] [PubMed] [Google Scholar]
- [29].Povsic TJ, Lawrence MG, Lincoff AM, Mehran R, Rusconi CP, Zelenkofske SL, Huang Z, Sailstad J, Armstrong PW, Steg PG, Bode C, Becker RC, Alexander JH, Adkinson NF, Levinson AI, Pre-existing anti-PEG antibodies are associated with severe immediate allergic reactions to pegnivacogin, a PEGylated aptamer, Journal of Allergy and Clinical Immunology, 138 (2016) 1712–1715. [DOI] [PubMed] [Google Scholar]
- [30].Cox F, Khalib K, Conlon N, PEG That Reaction: A Case Series of Allergy to Polyethylene Glycol, The Journal of Clinical Pharmacology, n/a (2021). [DOI] [PMC free article] [PubMed] [Google Scholar]
- [31].Kleine-Tebbe J, Klimek L, Hamelmann E, Pfaar O, Taube C, Wagenmann M, Werfel T, Worm M, Severe allergic reactions to the COVID-19 vaccine - statement and practical consequences, Allergol Select, 5 (2021) 26–28. [DOI] [PMC free article] [PubMed] [Google Scholar]
- [32].Worm M, Bauer A, Wedi B, Treudler R, Pfuetzner W, Brockow K, Buhl T, Zuberbier T, Fluhr J, Wurpts G, Klimek L, Jacob T, Merk HF, Mülleneisen N, Roeseler S, Dickel H, Raap U, Kleine-Tebbe J, Practical recommendations for the allergological risk assessment of the COVID-19 vaccination - a harmonized statement of allergy centers in Germany, Allergol Select, 5 (2021) 72–76. [DOI] [PMC free article] [PubMed] [Google Scholar]
- [33].He H, Yuan D, Wu Y, Cao Y, Pharmacokinetics and Pharmacodynamics Modeling and Simulation Systems to Support the Development and Regulation of Liposomal Drugs, Pharmaceutics, 11 (2019). [DOI] [PMC free article] [PubMed] [Google Scholar]
- [34].Li D, Emond C, Johanson G, Jolliet O, Using a PBPK model to study the influence of different characteristics of nanoparticles on their biodistribution, Journal of Physics: Conference Series, 429 (2013) 012019. [Google Scholar]
- [35].Li M, Al-Jamal KT, Kostarelos K, Reineke J, Physiologically Based Pharmacokinetic Modeling of Nanoparticles, ACS Nano, 4 (2010) 6303–6317. [DOI] [PubMed] [Google Scholar]
- [36].Li M, Zou P, Tyner K, Lee S, Physiologically Based Pharmacokinetic (PBPK) Modeling of Pharmaceutical Nanoparticles, The AAPS journal, 19 (2017) 26–42. [DOI] [PubMed] [Google Scholar]
- [37].Walsh C, Bonner JJ, Johnson TN, Neuhoff S, Ghazaly EA, Gribben JG, Boddy AV, Veal GJ, Development of a physiologically based pharmacokinetic model of actinomycin D in children with cancer, British journal of clinical pharmacology, 81 (2016) 989–998. [DOI] [PMC free article] [PubMed] [Google Scholar]
- [38].Rouits E, Guichard S, Canal P, Chatelut E, Non-linear pharmacokinetics of irinotecan in mice, Anti-Cancer Drugs, 13 (2002) 631–635. [DOI] [PubMed] [Google Scholar]
- [39].Zhou W, Johnson TN, Xu H, Cheung S, Bui KH, Li J, Al-Huniti N, Zhou D, Predictive Performance of Physiologically Based Pharmacokinetic and Population Pharmacokinetic Modeling of Renally Cleared Drugs in Children, CPT: pharmacometrics & systems pharmacology, 5 (2016) 475–483. [DOI] [PMC free article] [PubMed] [Google Scholar]
- [40].Thai H-T, Mazuir F, Cartot-Cotton S, Veyrat-Follet C, Optimizing pharmacokinetic bridging studies in paediatric oncology using physiologically-based pharmacokinetic modelling: application to docetaxel, British journal of clinical pharmacology, 80 (2015) 534–547. [DOI] [PMC free article] [PubMed] [Google Scholar]
- [41].Bachler G, von Goetz N, Hungerbuhler K, Using physiologically based pharmacokinetic (PBPK) modeling for dietary risk assessment of titanium dioxide (TiO2) nanoparticles, Nanotoxicology, 9 (2015) 373–380. [DOI] [PubMed] [Google Scholar]
- [42].Bachler G, von Goetz N, Hungerbühler K, A physiologically based pharmacokinetic model for ionic silver and silver nanoparticles, Int J Nanomedicine, 8 (2013) 3365–3382. [DOI] [PMC free article] [PubMed] [Google Scholar]
- [43].Eigenmann MJ, Karlsen TV, Krippendorff B-F, Tenstad O, Fronton L, Otteneder MB, Wiig H, Interstitial IgG antibody pharmacokinetics assessed by combined in vivo- and physiologically-based pharmacokinetic modelling approaches, J Physiol, 595 (2017) 7311–7330. [DOI] [PMC free article] [PubMed] [Google Scholar]
- [44].Garg A, Balthasar JP, Physiologically-based pharmacokinetic (PBPK) model to predict IgG tissue kinetics in wild-type and FcRn-knockout mice, Journal of Pharmacokinetics and Pharmacodynamics, 34 (2007) 687–709. [DOI] [PubMed] [Google Scholar]
- [45].McSweeney MD, Price LSL, Wessler T, Ciociola EC, Herity LB, Piscitelli JA, DeWalle AC, Harris TN, Chan AKP, Saw RS, Hu P, Jennette JC, Forest MG, Cao Y, Montgomery SA, Zamboni WC, Lai SK, Overcoming anti-PEG antibody mediated accelerated blood clearance of PEGylated liposomes by pre-infusion with high molecular weight free PEG, Journal of Controlled Release, 311–312 (2019) 138–146. [DOI] [PMC free article] [PubMed] [Google Scholar]
- [46].McSweeney MD, Wessler T, Price LSL, Ciociola EC, Herity LB, Piscitelli JA, Zamboni WC, Forest MG, Cao Y, Lai SK, A minimal physiologically based pharmacokinetic model that predicts anti-PEG IgG-mediated clearance of PEGylated drugs in human and mouse, Journal of Controlled Release, 284 (2018) 171–178. [DOI] [PMC free article] [PubMed] [Google Scholar]
- [47].McSweeney MD, Shen L, DeWalle AC, Joiner JB, Ciociola EC, Raghuwanshi D, Macauley MS, Lai SK, Pre-treatment with high molecular weight free PEG effectively suppresses anti-PEG antibody induction by PEG-liposomes in mice, Journal of Controlled Release, (2020). [DOI] [PMC free article] [PubMed] [Google Scholar]
- [48].Vosjan MJWD, Perk LR, Visser GWM, Budde M, Jurek P, Kiefer GE, van Dongen GAMS, Conjugation and radiolabeling of monoclonal antibodies with zirconium-89 for PET imaging using the bifunctional chelate p-isothiocyanatobenzyl-desferrioxamine, Nature Protocols, 5 (2010) 739–743. [DOI] [PubMed] [Google Scholar]
- [49].Severin GW, Jørgensen JT, Wiehr S, Rolle A-M, Hansen AE, Maurer A, Hasenberg M, Pichler B, Kjær A, Jensen AI, The impact of weakly bound 89Zr on preclinical studies: Non-specific accumulation in solid tumors and aspergillus infection, Nuclear Medicine and Biology, 42 (2015) 360–368. [DOI] [PubMed] [Google Scholar]
- [50].Vugts DJ, Klaver C, Sewing C, Poot AJ, Adamzek K, Huegli S, Mari C, Visser GWM, Valverde IE, Gasser G, Mindt TL, van Dongen GAMS, Comparison of the octadentate bifunctional chelator DFO*-pPhe-NCS and the clinically used hexadentate bifunctional chelator DFO-pPhe-NCS for (89)Zr-immuno-PET, Eur J Nucl Med Mol Imaging, 44 (2017) 286–295. [DOI] [PMC free article] [PubMed] [Google Scholar]
- [51].Davies B, Morris T, Physiological Parameters in Laboratory Animals and Humans, Pharmaceutical Research, 10 (1993) 1093–1095. [DOI] [PubMed] [Google Scholar]
- [52].Brown RP, Delp MD, Lindstedt SL, Rhomberg LR, Beliles RP, Physiological parameter values for physiologically based pharmacokinetic models, Toxicology and industrial health, 13 (1997) 407–484. [DOI] [PubMed] [Google Scholar]
- [53].Kaliss N, Pressman D, Plasma and blood volumes of mouse organs, as determined with radioactive iodoproteins, Proceedings of the Society for Experimental Biology and Medicine. Society for Experimental Biology and Medicine (New York, N.Y.), 75 (1950) 16–20. [DOI] [PubMed] [Google Scholar]
- [54].Jones HM, Rowland-Yeo K, Basic Concepts in Physiologically Based Pharmacokinetic Modeling in Drug Discovery and Development, CPT: Pharmacometrics & Systems Pharmacology, 2 (2013) 63. [DOI] [PMC free article] [PubMed] [Google Scholar]
- [55].Talkington AM, Wessler T, Lai SK, Cao Y, Forest MG, Experimental Data and PBPK Modeling Quantify Antibody Interference in PEGylated Drug Carrier Delivery, Bull Math Biol, 83 (2021) 123. [DOI] [PMC free article] [PubMed] [Google Scholar]
- [56].Marino S, Hogue IB, Ray CJ, Kirschner DE, A methodology for performing global uncertainty and sensitivity analysis in systems biology, Journal of Theoretical Biology, 254 (2008) 178–196. [DOI] [PMC free article] [PubMed] [Google Scholar]
- [57].Hora SC, Iman RL, Expert Opinion in Risk Analysis: The NUREG-1150 Methodology, Nuclear Science and Engineering, 102 (1989) 323–331. [Google Scholar]
- [58].Talkington AM, McSweeney MD, Zhang T, Li Z, Nyborg AC, LaMoreaux B, Livingston EW, Frank JE, Yuan H, Lai SK, High MW polyethylene glycol prolongs circulation of pegloticase in mice with anti-PEG antibodies, Journal of Controlled Release, 338 (2021) 804–812. [DOI] [PMC free article] [PubMed] [Google Scholar]
- [59].Shah DK, Betts AM, Towards a platform PBPK model to characterize the plasma and tissue disposition of monoclonal antibodies in preclinical species and human, J Pharmacokinet Pharmacodyn, 39 (2012) 67–86. [DOI] [PubMed] [Google Scholar]
- [60].Chen X, Hickling T, Kraynov E, Kuang B, Parng C, Vicini P, A mathematical model of the effect of immunogenicity on therapeutic protein pharmacokinetics, The AAPS journal, 15 (2013) 1141–1154. [DOI] [PMC free article] [PubMed] [Google Scholar]
- [61].Gómez-Mantilla JD, Trocóniz IF, Parra-Guillén Z, Garrido MJ, Review on modeling anti-antibody responses to monoclonal antibodies, Journal of Pharmacokinetics and Pharmacodynamics, 41 (2014) 523–536. [DOI] [PubMed] [Google Scholar]
- [62].Edginton AN, Zimmerman EI, Vasilyeva A, Baker SD, Panetta JC, Sorafenib metabolism, transport, and enterohepatic recycling: physiologically based modeling and simulation in mice, Cancer Chemotherapy and Pharmacology, 77 (2016) 1039–1052. [DOI] [PMC free article] [PubMed] [Google Scholar]
- [63].Krauss M, Burghaus R, Lippert J, Niemi M, Neuvonen P, Schuppert A, Willmann S, Kuepfer L, Görlitz L, Using Bayesian-PBPK modeling for assessment of inter-individual variability and subgroup stratification, In Silico Pharmacol, 1 (2013) 6–6. [DOI] [PMC free article] [PubMed] [Google Scholar]
- [64].Tsamandouras N, Rostami-Hodjegan A, Aarons L, Combining the ‘bottom up’ and ‘top down’ approaches in pharmacokinetic modelling: fitting PBPK models to observed clinical data, British Journal of Clinical Pharmacology, 79 (2015) 48–55. [DOI] [PMC free article] [PubMed] [Google Scholar]
- [65].Cooper M, Paul R, Shaw K, Blower P, Which bifunctional chelator for immunoPET with Cu-64?, Journal of Nuclear Medicine, 52 (2011) 407. [Google Scholar]
- [66].Cui C, Wang F, Zhang M-R, Hanyu M, Hatori A, Yui J, Shao G, Yiding Z, Wang Z, Synthesis, Biodistribution and Metabolic Analysis of Cu-64 Labeled PSMA-targeted Ligand, Journal of Nuclear Medicine, 57 (2016) 1385. [Google Scholar]
Associated Data
This section collects any data citations, data availability statements, or supplementary materials included in this article.