Abstract
This work reports on the synthesis and characterization of a new porphyrins complex:[Zn(TEBOP)(4,4′-bpy)](4,4′-bipyridine)(5,10,15,20-(tetraethyl-4(4-butyryl)oxyphenyl)porphyrinato)zinc(ii) (3). Single crystal X-ray diffraction, photophysical and electrochemical characteristics were studied. The prepared complex, penta-coordinated zinc(ii) porphyrin derivatives shows moderate ruffling distortion and the zinc atom is nearly planar with the porphyrin core. Tolyl and ethyl-4(4-butyryl)oxyphenyl) moieties at the meso positions present a bathochromic shift of the absorption bands, and a notable increase in the absorption coefficient of the Q(0,0) and Q(0,1) bands was observed with a higher fluorescence quantum yield and lifetime compared with the free base porphyrin. The electrochemical investigation shows a reversible reduction of the synthesized complexes. The catalytic power and the adsorption properties of the prepared complexes were studied for Calmagite degradation, an azoic organic dye. The results reveal that the studied compounds could be used as catalysts for the decolourisation of dyes in the presence of H2O2.
This work reports on the synthesis and characterization of a new porphyrins complex:[Zn(TEBOP)(4,4′-bpy)](4,4′-bipyridine)(5,10,15,20-(tetraethyl-4(4-butyryl)oxyphenyl)porphyrinato)zinc(ii)(3).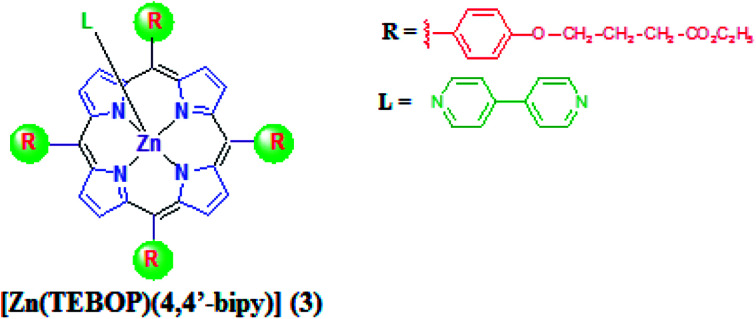
1. Introduction
Owing to their interesting photochemical and photophysical properties, zinc porphyrin complexes have attracted increasing attention.1–3 Indeed, their advantages make them useful for various applications such as Organic Light Emitting Diodes (OLEDs),4 materials, photodynamic therapy, photodynamic destruction of viruses,5–8 chemical sensors,9 photovoltaic,10–12etc. In particular, zinc metalloporphyrins remain to be used as models to understand the electronic properties, the fluorescence spectra and the redox properties of hemoproteins and bacterial photosynthesis. To avoid complications introduced by partially filled d orbital metal ions such as Fe2+ and Co3+ and ambiguities in the coordination numbers, spin states and oxidation states, Zn2+ synthetic porphyrin complexes are used as models to examine the effect of the axial ligation on the properties of the metalloporphyrins. In this framework, several investigations on five coordinated zinc porphyrin types [Zn(Porph)(L)] where Porph is a meso-porphyrin and L is a monodentate neutral or anionic axial ligand, have been reported in the literature.13–15 The association constants of zinc porphyrins with imidazole and pyridine axial ligands are known to be around 104.16 It is noteworthy that even though the Zn2+ ion in the porphyrin center has a marked preference for five-coordinate square-pyramidal geometry, few examples of six-coordinated zinc porphyrin complexes are known in solution.17,18
Several investigations involving zinc porphyrins with aza ligands have been reported.19–23 These studies concern bis(zinc-porphyrin) tweezers and were aimed to design and study the photoactive multicomponent systems which lead to the understanding of the bacterial photosynthesis.24,25 Zinc porphyrins studies with 4,4-bipyridine (4,4′-bpy) axial ligand are very limited and are specifically concerned with dimers and trimmers.18 This bidentate ligand is known to be involved in the building blocks of supramolecular structures.18,26,27 However, a survey of the literature reveals that no reported photophysical studies concerning zinc metalloporphyrins with the of 4,4′-bpy ligand and a very few reported works on the tetrakis(ethyl-4(4-butyryl)oxyphenyl)porphyrin (H2TEBOP) are known.28,29 Herein, in the present work, we describe the synthesis of the starting materials H2TEBOP porphyrin (1), the two new complexes: [5,10,15,20-(tetraethyl-4(4-butyryl)oxyphenylporphyrinato)]zinc(ii) [Zn(TEBOP)] (2) and (4,4′-bipyridine)[(5,10,15,20-(tetraethyl-4(4-butyryl)oxyphenyl)porphyrinato)]zinc(ii) [Zn(TEBOP)(4,4′-bpy)] (3). The H2TEBOP (1) is a meso-porphyrin presenting four ethyl-4(4-butyryl)oxyphenyl groups (arms) at the meso-positions. The molecular structure, along with the spectroscopic and electrochemical studies were reported. The effect of the axial ligand and the groups at the meso-position on the electronic properties of the metalloporphyrin were assessed. Their sorption capacities and catalytic degradation were studied using Calmagite dye.
2. Experimental
2.1. Reagents
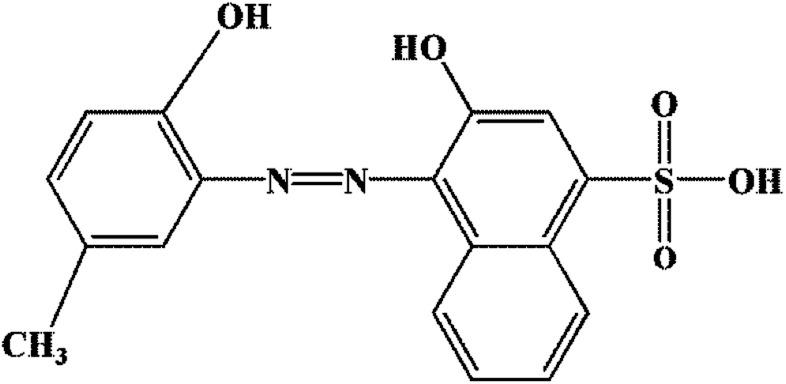
The used reagents (K2CO3, NH4Cl, etc.) and solvents (dichloromethane, chloroform, N,N-dimethylformamide, etc.) were obtained from Sigma Aldrich and were used as received without further purification. The chemical structure of Calmagite dye (molecular weight = 358.37 g mol−1, wavelength = 526 nm) is given in Fig. 1.
Fig. 1. Chemical structure of Calmagite.
2.2. Synthesis
2.2.1. Synthesis of ethyl-4(4-butyryl)oxyphenyl
Under an inert atmosphere of 4-hydroxybenzaldehyde (6.0 g, 49.1 mmol) and 13.6 g of K2CO3 (13.6 g, 98.2 mmol) were dissolved in 40 mL of N,N-dimethylformamide (DMF). Then, 7 mL of ethyl 4-bromobutyrate (9.6 g, 49.1 mmol) was added to the solution. The reaction mixture is heated at 80 °C under argon overnight and the reaction was checked using CCM plates. After filtration of the K2CO3, the DMF was evaporated. The crude obtained was taken up in dichloromethane (CH2Cl2) and then washed with a saturated NH4Cl solution. This was followed by washing with distilled water three times. Finally, the crude was purified. (11.13 g, 91.18 mmol) of aldehyde was obtained in 96% yield; light yellow liquid:1H-NMR (CDCl3, 300 MHz): δ (ppm) = 9,89 (s, 1H, Hald); 7,82 (d, 2H, Ho,o′); 6.99 (d, 2H, Hm,m′); 4,17 (t, 2H, Ha); 4,12 (q, 2H, Hd); 2,55 (t, 2H, Hc); 2,17 (qi, Hb); 1,29 (t, 3H, He) (Fig. S1–S3†).
2.2.2. Synthesis of [Zn(TEBOP)(4,4′-bipy)] (3)
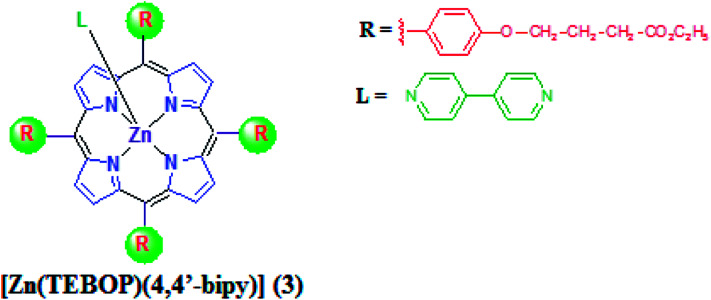
The meso-porphyrin H2TEBOP (1) was prepared according to the Adler and Longo method.30 The incorporation of the zinc into this meso-porphyrin was achieved as described in the literature,31 leading to the formation of the [Zn(TEBOP)] complex (2). [Zn(TEBOP)] (2) (20 mg, 0.020 mmol) and 4,4′-bipyridine (80 mg, 0.5 mmol) were dissolved in 5 mL of dichloromethane then the solution was stirred overnight leading to the penta-coordinated complex [Zn(TEBOP)(4,4′-bipy)] (3). Dark purple crystals 3 (Fig. 2) was obtained by slow diffusion of n-hexane into the dichloromethane solution (in 85% yield). The obtained compound was characterized by NMR spectroscopy, mass spectrometry and elemental analysis. Anal. calc. for 3 C78H76N6O12Zn (1354.87 g mol−1) C, 69.14; H, 5.65; N, 6.20%. Found: C, 69.62; H, 5.48; N, 6.38%. UV/Vis [CH2Cl2, λmax in nm (log ε)]: 430 (5.33), 563 (4.00), 604 (3.59). IR (cm−1): 3037: ν[CH(bpy)]; 1580: ν[(CN)bpy]; 1727: ν(C O); 1606: ν(C–O); 993: δ[CCH(TEBOP)]. MS (ESI+, dichloromethane): m/z = 1354.8 [Zn(TEBOP)(4,4′-bpy)]+. 1H NMR (300 MHz, CDCl3) δ (ppm) = 8.85 (s, 8H, Hβ-pyrro); 8.45 (d, 8H, Ho,o′); 7.19 (d, 8H, Hm,m′); 6.22 (s, 4H, H2); 5.60 (d, 4H, H1); 4,29 (q, 8H, Ha); 4,22 (t, 8H, Hd); 2,68 (t, 8H, Hc); 2,30 (qi, 8H, Hb); 1,35 (t, 15H, He).
Fig. 2. Molecular structure of zinc meso-porphyrin complex 3.
2.3. Characterization
1H NMR spectra were recorded on a Bruker 300 Ultrashield spectrometer. UV/vis measurements and titration were performed on a WinASPECT PLUS (validation for SPECORD PLUS version 4.2) scanning spectrophotometer. Solutions of porphyrins were prepared in spectrophotometric grade dichloromethane (Sigma-Aldrich). Mass spectra were recorded with a MicrOTOF Q Bruker instrument (ESI, positive mode).
2.3.1. Absorption and emission properties
Electronic absorption spectra were recorded on a Cary 300 UV-visible spectrophotometer (Agilent Technologies, Santa Clara, CA). Emission spectra were recorded in dichloromethane at room temperature on a Horiba Scientific Fluoromax-4 spectrofluorometer. Samples were placed in 1 cm path length quartz cuvettes. Luminescence lifetime measurements were performed after irradiation at λ = 400 nm obtained by the second harmonic of a titanium: Sapphire laser (picosecond Tsunami laser spectra physics 3950-M1BB + 39868-03 pulse picker doubler) at an 800 kHz rate of repetition. For the decay acquisition, Fluotime 200 (AMS technologies) was utilized consisting of a GaAsmicro channel plate photomultiplier tube (Hamamatsu model R3809U-50) followed by a time-correlated single photon counting system from Picoquant (PicoHarp300). The ultimate time resolution of the system is close to 30 ps. Luminescence decays were analyzed with FLUOFIT software available from Picoquant. Emission quantum yields were determined at room temperature in dichloromethane solutions using the optically dilute method.32. [Zn(TPP)] in air-equilibrated dichloromethane solution was used as quantum yield standard (Φ = 0.031). The instrumental uncertainties are as follows: absorption maxima 2 nm; molar absorption, 20%; emission maxima, 5 nm; emission lifetimes, 10%; emission quantum yields, 20%.
2.3.2. Cyclic voltammetry
Cyclic voltammetry (CV) experiments were carried out using a CH-660B potentiostat (CH-instrument). The analytical experiments were conducted at room temperature under an argon atmosphere (argon stream) in a standard one-compartment, three-electrode electrochemical cell. Tetra-n-butyl ammonium perchlorate (TBAP) was used as a supporting electrolyte (0.2 M) in dichloromethane previously distilled over calcium hydride under argon. An automatic ohmic drop compensation procedure was systematically implemented prior to recording the CV data in electrolytic solutions containing the studied compound at a concentration ∼ 10−3 M. CH-instrument vitreous carbon (Φ = 3 mm) working electrodes were polished with 1 μm diamond paste before each recording. The Ag/Ag+ (10−2 M + TBAP 0.2 M in CH2Cl2) redox couple was used as a reference electrode. The potential of the ferrocene/ferrocenium redox couple used as an internal reference is of 86 mV vs. Ag|Ag+(10−2 M) under our experimental conditions. For comparison with previously published data, all potentials given in the text were converted to SCE using E vs. SCE = E vs. Ag/Ag+ (10−2 M) + 298 mV.
2.3.3. X-ray diffractometry
Data collection for 3 measurements was done using a Brucker-AXS Enraf-Nonius Kappa CCD. This diffractometer was equipped with graphite-monochromated MoKα radiation (λ = 0.71073 Å) and intensity data for 3 was collected by the narrow frame method at room temperature. Unit cell parameters were calculated and refined from the full data set. The measurements of the data were done at 200 K for 3. Reflexions were scaled and collected for absorption effects using SADABS programs (Bruker AXS 2004,33), the structure of 3 was solved bya direct method using SIR-2004 (ref. 34) and refined by full-matrix least-squares on F2 using the SHELXL-97 program.35 The SIMU/DELU/SADI restraint36 commands in the SHELXL-97 software were used. For complex 3, one fragment in meso position of the TEBOP porphyrin, made by an ethyl-4-phenoxybutanoate group, is disordered over two orientations with refined occupancy coefficients converged to 0.559(5) and 0.441(5) respectively. The ADP values of this fragment are quite high. Thus, DFIX, DELU/SIMU, SIMU/ISOR and FLAT restraints35 and the EADP constraint commands in the SHELXL-97 software were used which explains an important number of restraints (Table S1†). The H-atoms in 3 were included at estimated positions using a riding model. The non hydrogen atoms of 3 were refined with anisotropic thermal parameters.
2.4. Oxidative degradation and adsorption experiments of Calmagite
The catalytic experiments were conducted using 12 mg, of the studied catalyst with 20 mL of Calmagite solution in the presence of a calculated dose of H2O2 (4 mL L−1). Experiments were performed in a batch system and were uniformly agitated at a speed of 150 rpm till the equilibrium is reached. At the end of each contact time, the solutions were filtered using a Whatman No. 41 filter paper. The concentration of dye in each filtrate was determined at the maximum wavelength (526 nm). The adsorption experiments were carried out under the same conditions without the addition of the oxidizing agent.
3. Results and discussion
3.1. X-ray crystallography of complex 3
Single crystals of complex 3 were obtained by slow diffusion of n-hexane into their dichloromethane solution. The structure of complex 3 was solved by X-ray crystallographic analyses. Complex 3 crystallizes in the monoclinic system (C2/c) space group. The crystal parameters are given in Table S1† and selected bond lengths and angles are given in Table S2.† The ORTEP drawing of this complex is shown in Fig. 3.
Fig. 3. The coordination environment of Zn(ii) and structure conformation of [Zn(TEBOP)(4,4′bpy)]. Ellipsoids are drawn at 30% probability. Symmetry codes are (i) = −x + 1, y, −z + 3/2.
The asymmetric unit of 3 is made by a one half [Zn(TEBOP)(4,4′-bpy)] complex. The zinc(ii) center metal is chelated by four pyrrole N atoms of the porphyrinato anion and, additionally coordinated by a nitrogen atom of the 4,4′-bipyridine axial ligand in a distorted square-pyramidal geometry. As depicted in Table S2,† the Zn_N(4,4′-bpy) bond length is 2.151(2) Å which is in the range [2.144–2.490 Å] of the related 4,4′-bpyporphyrinic and non-porphyrinic zinc(ii) species (Table S3†).
The average equatorial distance between the zinc cation and the nitrogen atoms of the porphyrin macrocycle(Zn-Np) is 2.0675(3) which is in the range [2.030–2.081 Å] of other reported Zn(ii)-(4,4′-bpy) porphyrins (Table S3†).
Fig. S2a and b† show the α and β dihedral angles of 3 while Fig. S2† illustrates the coordination geometry of the zinc atom of this derivative. α is the dihedral angle between the “Np-M-NL” plan (Np is the closest pyrrole nitrogen atom) and the first pyridyl moiety of the 4,4′-bipyridine axial ligand. β represents the dihedral angles between the two pyridyl rings of the 4,4′-bipyridine. The values of α and β of 3 are 36° and 37°, respectively, which are close to those of other reported 4,4′-bpyporphyrinic and non-porphyrinic zinc complexes recorded in (Table S3†).
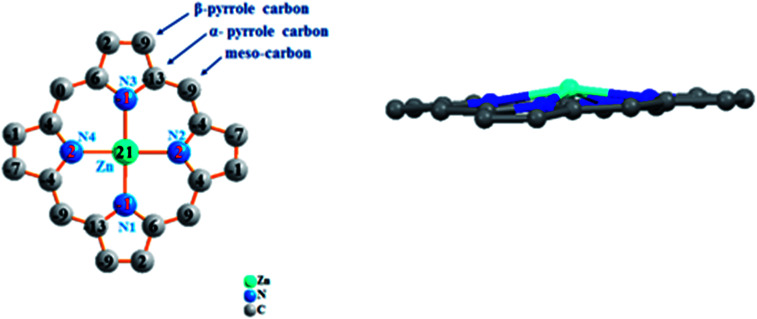
Fig. 4 represents the formal diagram of the porphyrinato core of 3. This diagram reveals that for our synthetic compound, the zinc atom is displaced by 0.29 Å, toward the axial ligand. This species presents a moderate ruffling distortion, as indicated by the displacement of the meso carbons above and below the porphyrin core.37 This distortion reflects the interaction between the TEBOPporphyrinato and the 4,4′-bpy ligands, as well as the orientation of the two pyridyl groups of the axial ligand.
Fig. 4. Formal diagram of the porphyrinato core of complex 3 illustrating the displacements of each atom from the 24-atoms core plane in units of 0.01 Å.
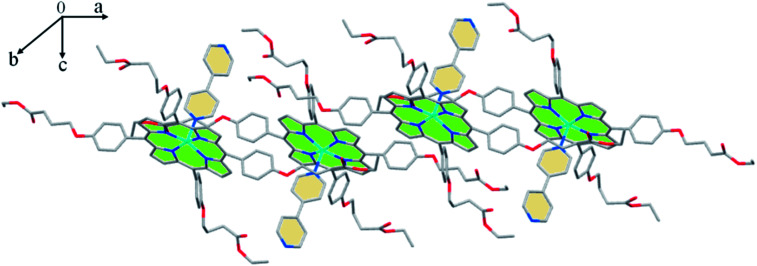
The crystal packing of 3 is made by 2D chains, in the (a,c) plane, where the nearby [Zn(TEBOP)(4,4′-bpy)] complexes are in up-side-down positions. These planes are sustained by weak C–H⋯Cg π intermolecular interactions involving Cg pyrrole, phenyl and pyridyl centroid rings (Fig. 5, Table S4†).
Fig. 5. Drawing showing part of the lattice packing of the [Zn(TEBOP)(4,4′-bpy)] complex.
3.2. 1H NMR spectroscopy
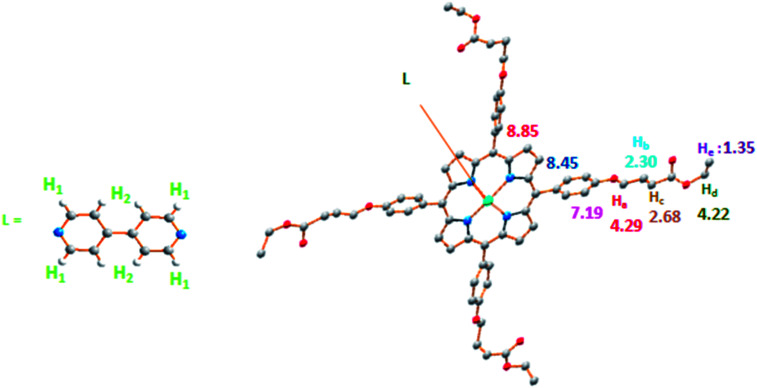
The 1H NMR spectrum of 3 is given in (Fig. S4†) and selected chemical shift values of this coordination complex along with a schematic representation of our synthetic species are depicted in Fig. 6. The β-pyrrolic protons (Hβ) of the TEBOP moiety are downfield shifted (δ ∼ 8.85 ppm). The ortho and meta protons (Ho,o′/Hm,m′) present chemical shift values at 8.12/7.24 ppm. The protons H1 and H2 of the 4,4′-bpy resonate between 5 ppm and 7 ppm which is the case of the related species [Zn(TClPP)(4,4′-bpy)] (TClPP = tetrakis(4-chlorophenyl)porphyrinato)38 where the H1 and H2 protons appears in the same domain. This is not the case of the [Zn(Porph)2(4,4-bpy)] dimer (Porph = TClPP and TPP)38 where the H1 and H2 proton are upfield shifted compared to complex 3. The 13C DEPT NMR spectrum of 3 is given in (Fig. S5†). It is noteworthy that the 4,4′-bpy protons of compound 3 feature a significant upfield shift mainly due to the anisotropic ring current effect of an adjacent phenyl group of the terminal ligand, δH1 = 5.60 and δH2 = 6.22 (Fig. S1†).
Fig. 6. Selected 1H NMR data (δ in ppm) of complex 3.
3.3. UV-visible investigation
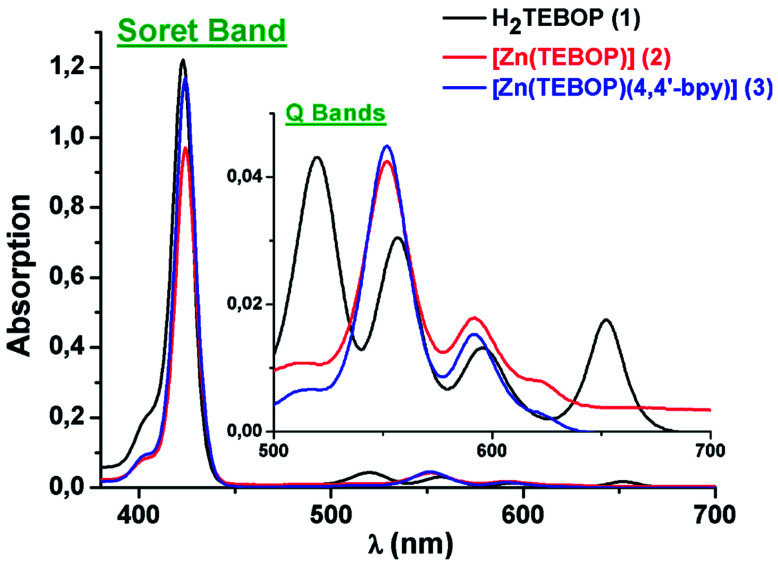
Porphyrins and metalloporphyrins display two types of absorption bands, i.e. the intense band in the range [417–424 nm] known as the Soret band, and four weaker bands in the range [500–700] for free base porphyrins and two weaker bands [O(0,0) and (O(1,0)] residing between 500 and 650 nm for metalloporphyrins. The UV-visible spectra of 1–3 are illustrated in Fig. 7. The redshift of the Soret and Q absorption bands is related mainly to the non-planar distortion of the porphyrin macrocycle.39 The values of the Soret and the Q bands of H2TEBOP, [Zn(TEBOP)] and [Zn(TEBOP)(4,4′-bpy)], along with those of other porphyrin derivatives, are summarized in Table 1.
Fig. 7. UV/Vis absorption spectra of H2TEBOP (1), [Zn(TEBOP)] (2) and [Zn(TEBOP)(4,4′-bpy)] (3). In dichloromethane solutions at concentrations of ca. 10−5 M.
UV/Vis dataa of H2TEBOP (1), [Zn(TEBOP)] (2), [Zn(TEBOP)(4,4′-bpy)] (3) and several related porphyrins and zinc metalloporphyrins.
| Compound | Soret band λ (nm) (log ε) | Q bands λ (nm) (log ε) | Eg-op | Ref. |
|---|---|---|---|---|
| H2TEBOPa (1) | 422(5.47) | 517(3.97), 554(3.90), 593(3.67), 651(3.82) | 1.847 | Current work |
| H2TPPa | — | — | 1.83 | 42 |
| H2TPPa | 416 (6.10) | 513 (5.70) 550 (4.36) 590 (4.24) 646 (4.19) | — | 43 |
| [Zn(TEBOP)]a (2) | 424(5.34) | 552(4.03), 594(3.70) | 2.034 | Current work |
| [Zn(TTP)]a | 421 | 550, 586 | — | 44 |
| [Zn(TEBOP)(4,4′-bpy)]a (3) | 430(5.33) | 563(4.00), 604(3.59) | 2.023 | Current work |
| [Zn(TPP)(py)]b | 428 | 562 602 | — | 13 |
| [Zn(TPP)(Him)]b | 428 | 562, 604 | — | 45 |
In dichloromethane.
In toluene, Him: 1-methyl-imidazole, Py: pyridine.
3.3.1. Optical gap
We used the Tauc plot method40,41 to determine the optical gap energy (Eg-op). Fig. 8 illustrates the variation of (αE)2versus the photon energy. The values of Eg-op are 1.847, 2.034 and 2.023 eV for 1–3, respectively indicating that the gap energy of the metallized species 2–3 are significantly higher than those of the free base porphyrin (Table 1).
Fig. 8. Plots of (αE)2versus photon energy E of H2TEBOP (1), [Zn(TEBOP)] (2) and [Zn(TEBOP)(4,4′-bpy)] (3). α is the absorption coefficient.
3.3.2. UV-vis titration
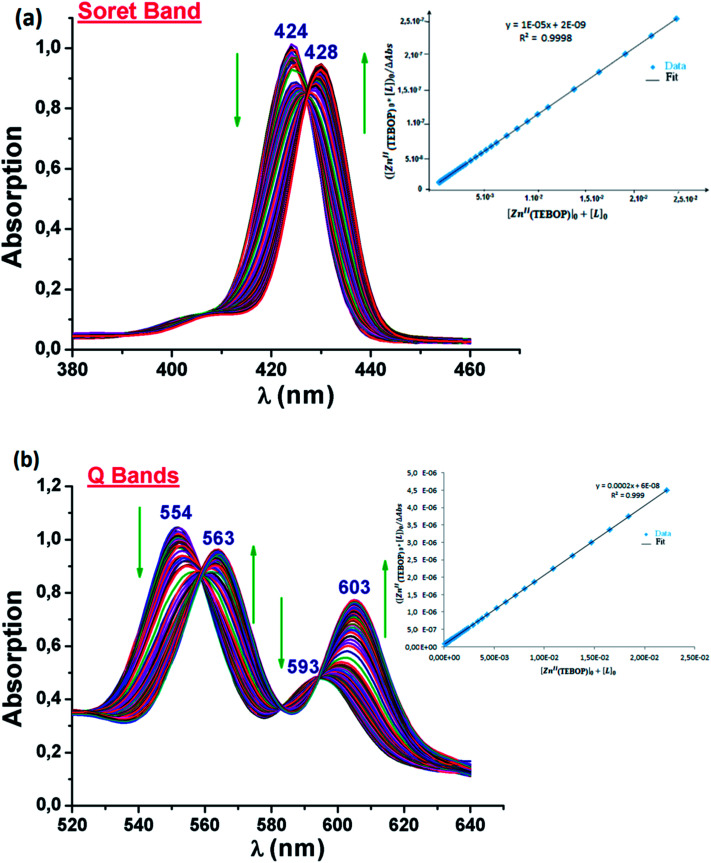
To study the behavior of the [Zn(TEBOP)] starting material upon addition of 4,4′-bpy to estimate the value of the association constant(Kas) of the [Zn(TEBOP)(4,4′-bpy)] complex, the investigation by UV/vis spectroscopy was carried out in dichloromethane with concentrations of about 10−6 M for the Soret region and 10−5 M for the Q bands region. The titration spectra are presented in Fig. 9a and b for the Soret and the Q bands regions, respectively. The accumulated data are shown in Table 2.
Fig. 9. Changes in the absorption spectra (a) (Soret band spectral region) of [Zn(TEBOP)] (∼10−6 M) and recorded in dichloromethane, upon addition of 4,4′-bpy. Inset: the changes at 428 nm with a 1 : 1 fit (0–5000 equiv.) and (b) UV/vis titration (Q region) of [Zn(TEBOP)] (∼10−5 M) recorded in dichloromethane, upon addition of 4,4′-bipy (0–400 equiv). Inset: the changes at 563 nm for [Zn(TEBOP)] with a 1 : 1 Zn-porph/ligand fit.
UV/Vis data of complex 3 and selected meso-porphyrins and zinc meso-porphyrins.
| Compound | Soret band λ (nm) (log ε) | Q bands λ (nm) (log ε) | log Kas | Ref. |
|---|---|---|---|---|
| H2TTP | 416(6.10) | 513(5.70), 550(4.36), 590(4.24), 646(4.19) | — | 15 |
| H2TEBOPa (1) | 422(5.47) | 517(3.97), 554(3.90), 593(3.67), 651(3.82) | — | Current work |
| [Zn(TPP)] | 419 | 547, 585 | — | 14 |
| [Zn(TMP)] | 420 | 550, 586 | — | 14 |
| [Zn(TEBOP)]a (2) | 424(5.34) | 552(4.03), 594(3.70) | — | Current work |
| [Zn(TDCPP)]b | 420 | 550, 584 | — | 14 |
| [Zn(TEBOP)(4,4′-bpy)]a (3) | 430(5.33) | 563(4.00), 604(3.59) | 3.59 ± 0.2 | Current work |
| [Zn(TPP)(py)]c | 428 | 562c, 602c | 4.33d | 13 |
| [Zn(TPP)(Him)]c | 428 | 562, 604 | 4.8 ± 0.2 | 45 |
| [Zn(TPP)(1-MeIm)]d | 428 | 564, 604 | 5.3 ± 0.2 | 45 |
| [Zn(TPP)(2-MeIm)]d | 428 | 564, 604 | 5.4 ± 0.2 | 45 |
| [Zn(TPP)(Him)] | 429 | 564, 605 | 4.71 | 14 |
| [Zn(TMP)(Him)] | 431 | 567, 606 | 4.28 | 14 |
| [Zn(TDCPP)(Him)]b | 431 | 567, 603 | 5.71 | 14 |
In dichloromethane.
TDCPP: is the dianion of the tetra(2,6-dichlorophenyl) porphyrin.
In toluene.
In cyclohexane.
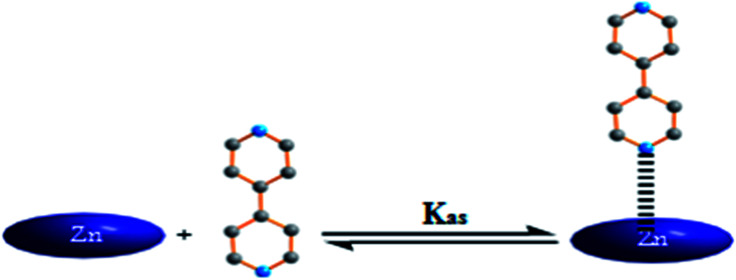
Incremental amounts of 4,4′-bpy to the solution of [Zn(TEBOP)] resulted in a Soret band shift of Δλ = 8 nm with one distinct isobestic point at 426 nm. In the Q bands region, the titration of [Zn(TEBOP)] with the 4,4′-bpy shows a bathochromic shift of about 12 nm between the starting material [Zn(TEBOP)] and the [Zn(TEBOP)(4,4-bpy)] product with isobestic points at 559 : 582 : 594 nm for the TEBOP derivatives. These results clearly indicate equilibrium between 4,4′-bpy and Zn(ii) in [Zn(TEBOP)] complex (Fig. 10).
Fig. 10. Schematic representation of the equilibrium reaction between the 4,4′-bpy ligand and the [Zn(TEBOP)] complex.
The results related to the coordination of an N-donor ligand such as pyridine or imidazole to zinc(ii)porphyrin (Table 2) agree with those previous studies.46,47 Five-coordinated zinc(ii) meso-porphyrins with neutral N-donor axial ligand complexes present Soret and Q bands red shifted vis-à-vis the starting material [Zn(Porph)] (Porph = meso-porphyrin) species were explained by Chia-ling Lin and coworkers.14 These researchers attribute this phenomenon to a destabilization of the HOMO a2u molecular orbital of the porphyrin arising from a flow of charge from the axial ligand to the porphyrin ring through Zn2+. The titration data were fitted using the non-linear regression analysis program GWBASIC. The determined values of Kas for complex 3 are listed in Table 2 along with those of some other five-coordinated zinc(ii) porphyrins with N-donor axial ligands. This type of plot suggests a simple binding process with the formation of a 1 : 1 (ZnPorph : L) complex.48 The complex 3 showed the smallest value of the association constant. This trend could be explained by the stronger electron-donating ability due, mainly, to the presence of alkoxy chains in para-position of the phenyl rings of the TEBOPporphyrinato ligand compared to the related zinc(ii) N-donor meso-porphyrins, such as meso-tetratolylphenylporphyrin (TTP)13 and the meso-tetrakis(2,4,6-trimethylphenylporphyrinato TMP)14 presenting a CH3 group in para position of the porphyrin phenyl rings.
For our zinc(ii)-4,4′-bpy TEBOP derivative, the alkoxy chains increased the electronic density of the zinc(ii) metal ion leading to the decrease of the coordination character of Zn(ii) vis-a-vis the 4,4′-bpy. Our results agree well with those found by Lin et al.,14 where the calculated association constants decrease in the order TDCPP > TPP > TMP for [Zn(Porph)(L)] complexes (Porph = TPP, TMP and TDCPP (tetra(2,6-dichlorophenyl)porphyrinato) and L = imidazole or 2-methylimidazole). The enhanced binding constant for the TDCPP derivative (log Kas ∼ 5.11) is interpreted in terms of the electrophilicity induced by the electron-withdrawing chlorine substituents in the porphyrin core.14
3.4. Fluorescence investigation
Porphyrins are considered to be the most interesting compound from the aspects of photophysical properties, owing to their rigidity and aromatic electronic system. Indeed, they are characterized by two types of fluorescence: (i) the relatively weak Soret or B bands assigned to the S2 → S0 transitions, observed in the [380–440 nm] regions. (ii) The strong Q bands assigned to the S1 → S0 transitions. The vibronic origins and overtones (mainly the skeleton vibration) superpose on the electronic excitation.
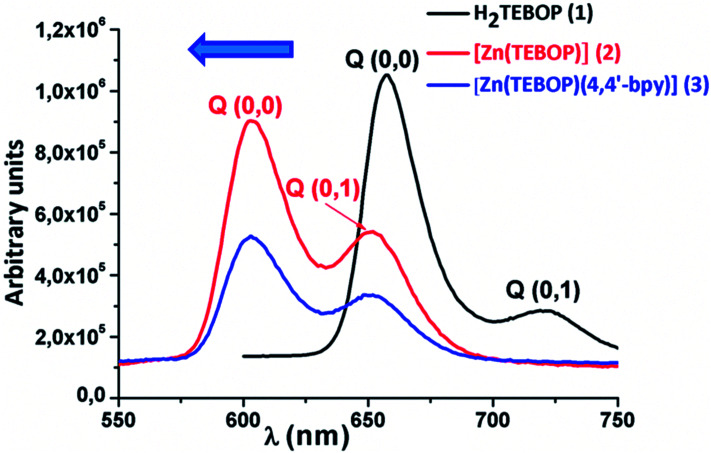
The fluorescence spectra of the Zn(ii) complexes and the free base porphyrin, recorded at 25 °C, are shown in Fig. 11. They consist of two bands assigned as the Q(0,0) and Q(0,1) transitions, in the range of [550 750 nm]. The values of the fluorescence of the Q(0,0) and Q(0,1) bands, the fluorescence quantum yields (φf) and the fluorescence lifetimes (τf) of the species are gathered in Table 2 mentioned above. In addition, the major difference between the free base H2TEBOP compared to those zinc complexes 2–3 is that the two fluorescence bands are blue-shifted (Δλ ≈ 55 nm for Q(1,0) and Δλ ≈ 70 nm for Q(0,0)). This remarkable blue shift is due to the metal coordination.49 This hypsochromic effect is in contrast with the red-shift in the absorption. For the 2 and 3 complexes, the values of λmax of the Q(0,0) and the Q(0,1) bands are practically the same, showing that the axial ligand has no effect on this shift. The values of the Q(0,0) and Q(0,1) bands of 1–3 are close to those of the related zinc porphyrin derivatives (Table 3).
Fig. 11. The fluorescence spectra of H2TEBOP, [Zn(TEBOP)] and [Zn(TEBOP)(4,4′-bpy)] species. Spectra were recorded in CH2Cl2 with a concentration ∼ 10−6 M.
Emission data of several meso-porphyrin and a selection of zinc meso-metalloporphyrins.
| Compound | Q(0,0), Q(0,1) (nm) | ϕ f | τ f (ns) | Solvent | Ref. |
|---|---|---|---|---|---|
| meso-Porphyrins | |||||
| H2TPP | 656, 717 | 0.09 | — | CH2Cl2 | 50 |
| H2TEBOP | 657, 720 | 0.035 | 8.0 | CH2Cl2 | Current work |
| meso-Porphyrin zinc( ii ) complexes | |||||
| [Zn(TPP)] | 597, 647 | 0.037 | 1.9 | CH2Cl2 | 50 |
| [Zn(TEBOP)] | 603, 651 | 0.030 | 1.2 | CH2Cl2 | Current work |
| [Zn(TEBOP)(4,4′-bpy)] (3) | 603, 651 | 0.028 | 1.2 | CH2Cl2 | Current work |
| [Zn(TTP)(mbpy∼py)]a | 611, 652 | 0.021 | — | CH2Cl2 | 45 |
| [Zn(TPP)(IQNO)]b | 602, 656 | — | 1.9 | Ethyl acetate | 31 |
| [Zn(TPP)(1,4-dioxane)2] | 604, 655 | — | 1.8 | Dioxane | 17 |
mbpy∼py = 4′-Methyl-4-(2-(4-pyridyl)ethenyl)-2,2′-bipyridine.
IQNO = isoquinonine N-oxide.
The Stokes shifts for compounds 1–3. This is typical of a fluorescence emission having no significant conformation variation between the fundamental and the excited states.
In brief, the τf value of the free base porphyrin (8 ns) is, as expected, much higher than those of the [Zn(TEBOP)] and [Zn(TEBOP)(4,4′-bpy)] complexes which are ∼1.2 ns.
The presence and the nature of the axial ligand have no effect on the value of τf. Indeed, for [Zn(TPP)] and the related species [Zn(TPP)(IQNO)](IQNO = isoquinoline N-oxide) and [Zn(TPP)(1,4-dioxane)2], the τf values are ∼1.9 ns.17,31 This is the case for our prepared derivative where the τf values of [Zn(TEBOP)] and [Zn(TEBOP)(4,4′-bpy)] (3) τf are the same (1.2 ns). For the free base H2TEBOP, the fluorescence quantum yields are higher than those of the 2–3 which are within the range [2–4%] of other related zinc-metalloporphyrins.15,24 This indicates that for the zinc(ii) meso-porphyrins, τf values are generally independent of the nature of the meso-porphyrin and the axial ligand. Since the 4,4′-bpy ligand has practically no effect on the photophysical properties of complex 3, one wonders if the para substitution of the phenyl ring of the meso-porphyrin on this derivative of this species has any effect on the fluorescence quantum yields and the fluorescence lifetimes values. These two photophysical parameters depend usually on the flexibility of the molecule. Indeed, the radiation less deactivation increases with the flexibility of the molecule, which leads to the loss of the “motion energy”. This has a direct consequence on the decrease of the values of Φf and τf. In our case, the TEBOP porphyrinato has an ethyl-4-phenoxybutanoate group in the para position of the porphyrin phenyl rings, which is responsible for the important flexibility of this porphyrin. Indeed, for the [Zn(TPP)(1,4-dioxane)2] complex, the τf value is 1.8 which is much higher than the value for our TEBOP derivative (3) (1.2 ns).17
3.5. Electrochemistry
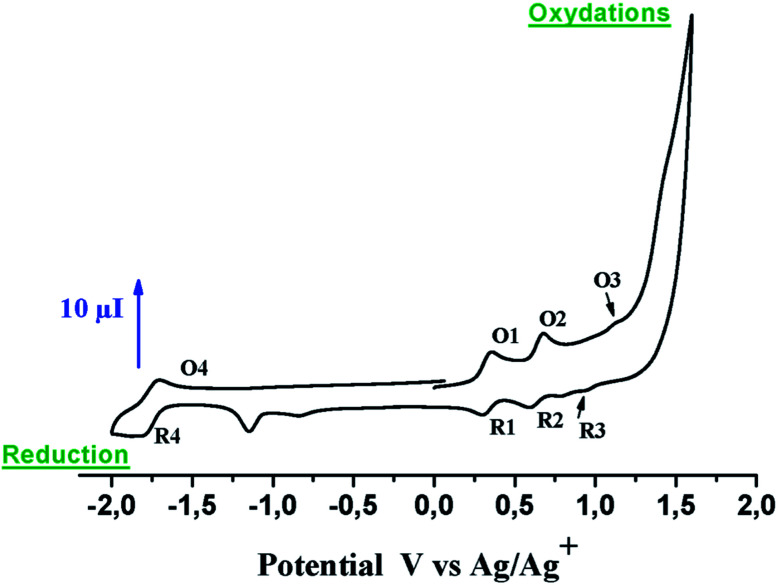
The cyclic voltammetry (CV) curve of complex 3 (∼10−3 M) was recorded using 0.2 M CH2Cl2 solution of a tetra-n-butyl ammonium perchlorate (TBAP) as a supporting electrolyte (Fig. 12). The electrochemical data for the free base H2TEBOP and zinc complexes are summarized in Table S5†. The E1/2 values of the H2TEBOP corresponding to one electron reversible reduction and oxidation are very close and are in the range of those of the meso-tetraphenyl porphyrin (H2TPP)].51 Metallation of this porphyrin in [Zn(TEBOP)] leads to a shift to more negative values for the reduction and oxidation characteristic potentials.14,52 As expected, the E1/2 values of the [Zn(TEBOP)] derivatives are influenced by the electronic properties of the substituents of phenyl groups; the substitution with electron-donating groups leads to a negative shift of the characteristic potentials. Accordingly, the E1/2 values of the tetra-coordinated zinc-porphyrins are in the order [Zn(TEBOP)] < [Zn(TTP)], [Zn(TEBOP)] being the easiest to be oxidized in this series. The opposite shift (Table S5†) was observed with electron-withdrawing substituents such as in the Zn complexes with the tetrapentafluoro phenyl porphyrin (H2TPFPP) and the tetra(2,6-dichlorophenyl)porphyrin (H2TDCPP).14 The coordination of the 4,4′-bpy leading to complex 3 does not affect the oxidation and the reduction potentials compared with the starting materials [Zn(TEBOP)] (Table S5†). This is also the case for other zinc-porphyrin derivatives [Zn(Porph)(L)] (Porph = TPP, TMP and L = imidazole and 2-methylimidazole). Therefore, it seems that an additional coordination of the tetra-coordinated zinc porphyrins does not influence the oxidation and reduction potential of the porphyrin ring. However, the CV curve for complex 3 exhibits a third anodic wave at ca. 1.43 V, which is close to that previously reported [Zn(TPP)X]–ion complexes (X = N3−, NCO−, NCS− and CN−).15 The zinc–porphyrin HOMO–LUMO gap can be expressed as the potential difference of the first oxidation and the first reduction.53 The estimated values of the energy gap are of 2.12 eV for 3. This value is close to the usual value of 2.25 ± 0.15 eV for metalloporphyrins.54 Notably, the value of the electrochemical gap Eg-el (2.12 eV) is considerably higher than the optical gap Eg-op (1.97 eV).
Fig. 12. CV curves of [Zn(TEBOP)(4,4′-bpy)]. The solvent is CH2Cl2 and the concentration is ∼10−3 M in 0.2 M TBAP, 50 mV s−1, WE VC (Φ = 3 mm).
3.6. Catalytic degradation of Calmagite
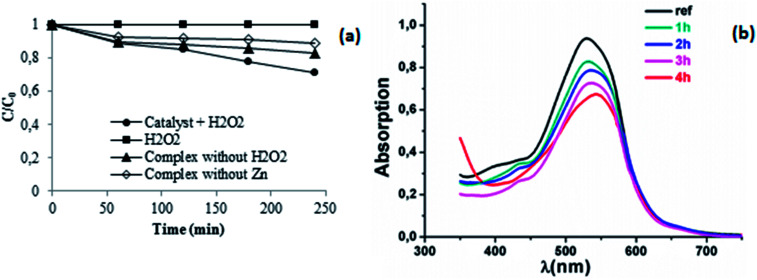
In this section, the adsorption and the catalytic degradation properties of the synthesized complexes were studied using Calmagite as a model of an organic dye, both in the presence of and without H2O2. Fig. 13a depicts the change in the Ct/C0 value of Calmagite using different combinations. Fig. 13b shows an example of the absorption spectrum of Calmagite with respect to the time for the complex 3 combined with H2O2.
Fig. 13. (a) Change in Ct/C0versus time using a different combination of products: complex 1–Calmagite, complex 3–Calmagite, H2O2–Calmagite and complex 3–H2O2–Calmagite (b) change in the maximum absorption of Calmagite at 526 nm versus time using the system complex 3–H2O2.
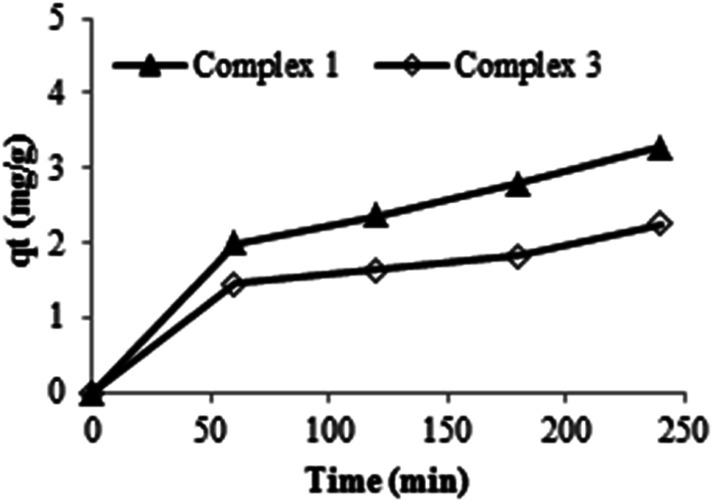
The dye solution is stable in the presence of H2O2 alone without the addition of any product. The trends were also observed in our previous works when studying the degradation of textile dyes using chitosan-supported [bis(2-methylallyl)(1,5-cyclooctadienne)ruthenium(ii)],55 chitosan-H3PMo12O40,56 using helically chiral metallated complexes57,58 and when using oxazoline complexes.59 The addition of the synthesized compounds in the dye solution leads to the decrease of the optical absorption. These results confirm that the prepared complexes could be used as either an adsorbent or a catalyst. Indeed, it was seen that the complex 1 alone, could interact with Calmagite dye via the adsorption process and that the adsorbed amount increases with the evolution of time. For a dye concentration of 30 mg L−1, pH = 6 and after 240 min of reaction, the yield value of decolourisation is about 17%. This interaction occurs through the presence of both nitrogen and oxygen atoms and hydroxyl groups present on the surface of the porphyrin and the organic dye molecule, respectively. This yield of decolourisation is about 13% when the complex 3 is added to the dye solution without the use of the oxidant agent (H2O2). Under these experimental conditions, the adsorption capacities for the two studied complexes are determined to be 3.27 mg g−1 and 2.25 mg g−1 for complex 1 and complex 3, respectively (Fig. 14).
Fig. 14. Evolution of the qt as a function of time using complex 1 and 3 (m = 3 mg, pH = 6, C0 = 30 mg L−1).
This slight difference in the capacity of dye adsorption means that the nitrogen active sites of the complex were engaged with the zinc metal in the second case, according to the proposed Fig. 15.
Fig. 15. A sort of interaction between (a): complex 1 and Calmagite (b): complex 3 and Calmagite.
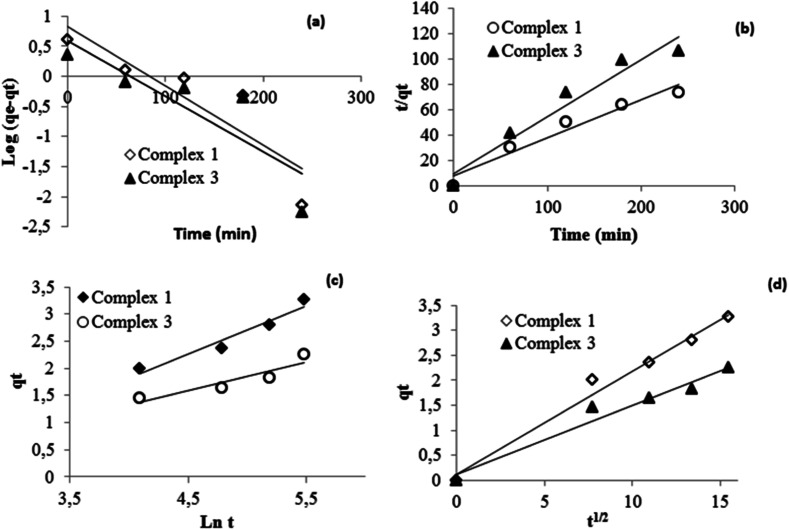
To understand the adsorption process of Calmagite using compounds 1 and 3, data are correlated to theoretical kinetic equations; pseudo first order (Fig. 16a), pseudo second order (Fig. 16b), Elovich (Fig. 16c) and intra-particular diffusion (Fig. 16d). Their linear forms were detailed in our previous work.60–63
Fig. 16. Kinetic data linearized through (a) pseudo first order, (b) pseudo second order (c) Elovich and (d) intra-particular diffusion equations.
Results gleaned from the modeling data for Calmagite were tabulated in Table 4. The assessment of the kinetic models is checked by the extent of the regression coefficient R2 values. As generally known, the adsorption process remains complex and there is a combination of adsorption both on the surface and inside the pores. Indeed, the pseudo-first-order equation is generally applicable to the initial stage of the adsorption processes (Fig. 16a) and it does not fit well with the range of contact time in the adsorption experiments.64 The intra-particle diffusion model is, also, used to identify the mechanism involved in the adsorption process. This model assumes that intra-particle diffusion is the rate-controlling step, which is generally the case for well-mixed solutions.65 The applicability of this model requires that the plot of qt versus t1/2 should be linear; if it passes through intra-particle diffusion as the only rate controlling step.66,67 Herein, the straight lines of kinetic data for the intra-particular-diffusion equation pass from the origin (Fig. 16d). This suggests that the diffusion step is significant in this case. Referred to as the R2 values of this equation, this model is more suitable to describe the experimental data than the other equations.
Kinetic parameters for the adsorption of Calmagite using complex 1 and 3 as adsorbents (C0 = 30 mg L−1, pH = 6, m = 3 mg).
| Equations | Pseudo first-order | Pseudo second-order | Elovich | Intra-particular diffusion | |||||||
|---|---|---|---|---|---|---|---|---|---|---|---|
| Parameters | K 1 | q e | R 2 | K 2 | q e | R 2 | α | β | R 2 | K 1 | R 2 |
| Complex 1 | 0.009 | 6.66 | 0.79 | 0.012 | 3.33 | 0.95 | 6.10 | 1.13 | 0.93 | 0.206 | 0.98 |
| Complex 3 | 0.009 | 3.85 | 0.73 | 0.02 | 2.22 | 0.94 | 2.24 | 1.92 | 0.83 | 0.138 | 0.96 |
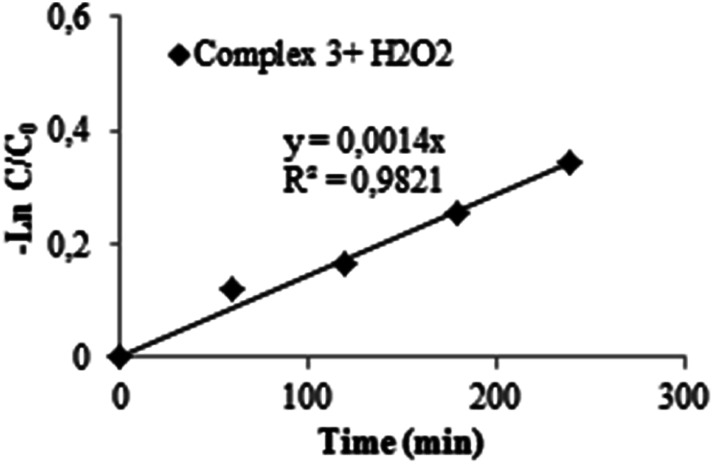
More importantly, as the time increases the maximum absorption at 526 nm decreases gradually. In fact, the addition of H2O2 to the Zn particles provides more active sites for the Calmagite improving degradation phenomenon. Under the studied experimental conditions mentioned above, results reveal that about 31% of the Calmagite was degraded after this time for the reaction in the presence of complex 3–H2O2. To understand the reaction kinetics of the dye degradation, the pseudo-first-order rate constant k was determined using the equation:
| ln Ct/C0 = −k0t | 1 |
where t is the time taken during the degradation, k is the first-order rate constant of the reaction, and Ct and C0 are the concentrations of Calmagite dye at times t and 0, respectively. The curve fitting of the pseudo-kinetic equation is shown in Fig. 17 according to the Langmuir Hinshelwood kinetic equation. It was, therefore, easy to deduce the rate constant of the degradation (K0) and it was found to be equal to 0.001 min−1.67–69
Fig. 17. Linearized data for the system complex 3/H2O2 for the degradation of Calmagite.
4. Conclusion
Meso-porphyrin-meso-tetrakis(ethyl-4(4-butyryl)oxyphenyl)porphyrin (H2TEBOP) (1) the tetra-coordinated metallatedporphyrin[Zn(TEBOP)] (2) and the penta-coordinated 4,4′-bpy complex [Zn(TEBOP(4,4′-bpy)] (3) were synthesized. The 1H NMR data reveal that the complex 3 exists as five-coordinated Zn-porphyrin species. The binding behaviour of the metallated porphyrin [Zn(TEBOP)] with 4,4-bpy was monitored using the absorption spectra which revealed a 1 : 1 binding stoichiometry. The association constants (Kas) value of the zinc bpy-TEBOP derivative is the smallest compared to the related zinc(ii) meso-porphyrin with a neutral N-bond neutral axial ligand which could be explained by their important donor character. The photophysical experiments show that, (i) the values of λmax of the Q(0,0) and the Q(0,1) bands of the [Zn(TEBOP)] and complex 3, as well as the reported [Zn(Porph)(L)]m± (Porph = meso-porphyrin and L = neutral or anionic monodentate ligand) are practically the same, (ii) the UV/Vis and fluorescence spectrum of 3 is not affected by the nature of the 4,4′-bipyridin axial ligand, while the fluorescence quantum yield value depends on the nature of the grafted group at the meso position of the porphyrinic ring and (iii) the singlet excited state lifetime τf is short, which could be explained by the relatively important flexibility of the ethyl butanoate group in para position of the phenyls of the TEBOP porphyrinato. The cyclic voltammogram of our 4,4′-bipyridin-zinc(ii) derivative presents two reversible oxidation and reduction waves with each one attributed to a one-electron transfer involving the porphyrin monocycle. One third oxidation wave was also observed. The values of the optical and electrochemical gap are close to 2.00 eV. This could suggest the use of the prepared compound as a semi-conductor. In the solid state, Zn atom is penta-coordinated with the 4,4′-bpy as an axial ligand. The porphyrin core of 3 presents a moderate ruffling distortion. The crystal packing of 3 is stabilized by weak C–H⋯π intermolecular interactions involving the pyridyl, phenyl and pyrrole centroid rings. The prepared catalyst shows a high efficiency toward the catalytic degradation of Calmagite in the presence of an ecological oxidant (H2O2) under the conditions: 3 mg of catalyst, H2O2 = 4 mL L−1, pH = 6, C0 = 30 mg L−1 and time = 240 min).
Conflicts of interest
There are no conflicts to declare.
Supplementary Material
Acknowledgments
The present work was partially supported by Labex Arcane, France (ANR-11-LABX-0003-01). The chemistry platform NanoBio campus in Grenoble is acknowledged for luminescence lifetime measurement facilities. T. A. Saleh would like to acknowledge King Fahd University of Petroleum & Minerals (KFUPM), Project No. IN161011 under the Deanship of Research.
Electronic supplementary information (ESI) available: CCDC 1060414. See DOI: 10.1039/c8ra01134f
References
- Paul-Roth C. O. Williams G. Letessier J. Simonneaux G. Tetrahedron Lett. 2007;48:4317. doi: 10.1016/j.tetlet.2007.04.110. [DOI] [Google Scholar]
- Paul-Roth C. O. Simonneaux G. Tetrahedron Lett. 2006;47:3275. doi: 10.1016/j.tetlet.2006.03.031. [DOI] [Google Scholar]
- Paul-Roth C. O. Simonneaux G. C. R. Chim. 2006;9:1277. doi: 10.1016/j.crci.2006.04.003. [DOI] [Google Scholar]
- Drouet S. Paul-Roth C. O. Fattori V. Cocchi M. Williams J. Gareth A. New J. Chem. 2011;35:438. doi: 10.1039/C0NJ00561D. [DOI] [Google Scholar]
- The Porphyrin Handbook, ed. K. M. Kadish, K. M. Smith and R. Guilard, Academic Press, San Diego, 2000 [Google Scholar]
- Weinkauf J.-R. Cooper S. W. Schweiger A. Wamser C. C. J. Phys. Chem. A. 2003;107:3486. doi: 10.1021/jp022046f. [DOI] [Google Scholar]
- Rywkin S. Ben-Hur E. Malik Z. Prince A. M. Li Y.-S. Kenney M. E. Oleinik N. L. Horowitz B. Photochem. Photobiol. 1994;60:165. doi: 10.1111/j.1751-1097.1994.tb05085.x. [DOI] [PubMed] [Google Scholar]
- Pineiro M. Carvalho A. L. Pereira M. M. Gonsalves A. M. Arnaut L. G. Formosinho S. J. Chem.–Eur. J. 1998;4:2299. doi: 10.1002/(SICI)1521-3765(19981102)4:11<2299::AID-CHEM2299>3.0.CO;2-H. [DOI] [Google Scholar]
- Kalyana sundaram K., Photochemistry of Polypyridine and Porphyrin Complexes, Academic Press, San Diego, 1992 [Google Scholar]
- Nevin A. W. Chamberlain G. A. J. Appl. Phys. 1991;69:4324. doi: 10.1063/1.348407. [DOI] [Google Scholar]
- Kobayashi N. Janda P. Lever A. B. P. Inorg. Chem. 1992;31:5172. doi: 10.1021/ic00051a006. [DOI] [Google Scholar]
- Norwood R. A. Sounik J. R. Appl. Phys. Lett. 1992;60:295. doi: 10.1063/1.106690. [DOI] [Google Scholar]
- Nappa M. Valentine J. S. J. Am. Chem. Soc. 1978;100:5075–5080. doi: 10.1021/ja00484a027. [DOI] [Google Scholar]
- Lin C. I. Fang M. Y. Cheng S. H. J. Electroanal. Chem. 2002;531:155–162. doi: 10.1016/S0022-0728(02)01056-2. [DOI] [Google Scholar]
- Denden Z. Ezzayani K. Saint-Aman E. Loiseau F. Najmudin S. Bonifácio C. Daran J.-C. Nasri H. Eur. J. Inorg. Chem. 2015:2596–2610. doi: 10.1002/ejic.201403214. [DOI] [Google Scholar]
- Flamigni L. Talarico A. M. Ventura B. Rein R. Solladie N. Chem.–Eur. J. 2006;12:701–712. doi: 10.1002/chem.200500789. [DOI] [PubMed] [Google Scholar]
- Oberda K. Deperasińska I. Nizhnik Y. P. Szemik-Hojniak A. Polyhedron. 2013;51:61–69. doi: 10.1016/j.poly.2012.12.014. [DOI] [Google Scholar]
- Shukla A. D. Dave P. C. Suresh E. Das A. Dastidar P. Dalton Trans. 2000:4459–4463. doi: 10.1039/B004211K. [DOI] [Google Scholar]
- Finnigan E. M. Rein R. Solladié N. Dahms K. Götz D. C. G. Bringmann G. Senge M. O. Tetrahedron. 2011;67:1126–1134. doi: 10.1016/j.tet.2010.12.025. [DOI] [Google Scholar]
- Ballester P. Costa A. Castilla A. M. Deyà P. M. Frontera A. Gomila R. M. Hunter C. A. Chem.–Eur. J. 2005;11:2196–2206. doi: 10.1002/chem.200400772. [DOI] [PubMed] [Google Scholar]
- Nasri S. Zahou I. Turowska-Tyrk I. Roisnel T. Loiseau F. Saint-Amant E. Nasri H. Eur. J. Inorg. Chem. 2016;31:5004–5019. doi: 10.1002/ejic.201600575. [DOI] [Google Scholar]
- Rein R. Gross M. Solladié N. Chem. Commun. 2004:1992–1993. doi: 10.1039/B406680D. [DOI] [PubMed] [Google Scholar]
- Brettar J. Gisselbrecht J. P. Gross M. Solladié N. Chem. Commun. 2001:733–734. doi: 10.1039/B100423I. [DOI] [PubMed] [Google Scholar]
- Hayashi T. Ogoshi H. Chem. Soc. Rev. 1997;26:355–364. doi: 10.1039/CS9972600355. [DOI] [Google Scholar]
- Shoji O. Okada S. Satake A. Kobuke Y. J. Am. Chem. Soc. 2005;127:2201–2210. doi: 10.1021/ja0445746. [DOI] [PubMed] [Google Scholar]
- Marketaki M. Touloupakis E. Charalambidis G. Chalbot M. Ghanotakis D. F. J. Porphyrins Phthalocyanines. 2012;16(9):997–1005. doi: 10.1142/S1088424612501088. [DOI] [Google Scholar]
- Kostas I. D. Coutsolelos A. G. Charalambidis G. Skondra A. Tetrahedron Lett. 2007;48(38):6688–6691. doi: 10.1016/j.tetlet.2007.07.141. [DOI] [Google Scholar]
- Stangel C. Charalambidis G. Varda V. Coutsolelos A. G. Kostas I. D. Eur. J. Inorg. Chem. 2011:4709–4716. doi: 10.1002/ejic.201100668. [DOI] [Google Scholar]
- Christina S. Dimitra D. Theodore L. Marija D. Urša K. O. Athanassios G. C. Polyhedron. 2013;52:1016–1023. doi: 10.1016/j.poly.2012.06.080. [DOI] [Google Scholar]
- Adler A. D. Longo F. R. Finarelli J. D. Goldmacher J. Assour J. Korsakoff L. J. Org. Chem. 1967;32:476. doi: 10.1021/jo01288a053. [DOI] [Google Scholar]
- Hoard J. L. and Smith K. M., Porphyrins and Metalloporphyrins, Elsevier, Amsterdam, 1975 [Google Scholar]
- Yang S. I. Seth J. Strachan J. P. Gentemann S. Dewey Holten D. K. Lindsey J. S. Bocian D. F. J. Porphyrins Phthalocyanines. 1999;3:117–147. doi: 10.1002/(SICI)1099-1409(199902)3:2<117::AID-JPP110>3.0.CO;2-X. [DOI] [Google Scholar]
- Bruker (2004), SMART, SAINT-Plus and SADABS, Bruker AXS Inc., Madison, Wisconsin, USA [Google Scholar]
- Altomare A. Casacarano G. Giacovazzo C. Guagliardi A. Burla M. C. Polidori G. Camalli M. J. Appl. Crystallogr. 1994;27:435–436. [Google Scholar]
- Scheldrick G. M. Acta Crystallogr., Sect. A: Found. Crystallogr. 2008;64:112–122. doi: 10.1107/S0108767307043930. [DOI] [PubMed] [Google Scholar]
- Ardle P. M. J. Appl. Crystallogr. 1995;28:65–66. [Google Scholar]
- Scheidt W. R. Lee Y. J. Struct. Bonding. 1987;64:1–70. doi: 10.1007/BFb0036788. [DOI] [Google Scholar]
- Adilov S., Ph.D. thesis, Polytechnic Institute, Massachusetts State, USA, 2008 [Google Scholar]
- Ezzayani K. Bonifácio C. Denden D. Saint-Aman E. Najmudin N. Loiseau F. Nasri H. Eur. J. Inorg. Chem. 2014:5348. doi: 10.1002/ejic.201402546. [DOI] [Google Scholar]
- Tauc J. Grigorovici R. Vancu A. Phys. Status Solidi. 1966;15:627. doi: 10.1002/pssb.19660150224. [DOI] [Google Scholar]
- Eunah K. Jiang Z. T. Kwangsoo N. O. Jpn. J. Appl. Phys. 2000;39:4820–4825. doi: 10.1143/JJAP.39.4820. [DOI] [Google Scholar]
- Lyons D. M. Kesters J. Maes W. Christopher W. Bielawski J. Sessler L. Synth. Met. 2013;178:56. doi: 10.1016/j.synthmet.2013.06.013. [DOI] [Google Scholar]
- Jiang L. Zaenglein R. A. Engle J. T. Mittal C. M. Hartley C. S. Ziegler C. J. Wang H. Chem. Commun. 2012;48:6927. doi: 10.1039/C2CC31057K. [DOI] [PubMed] [Google Scholar]
- Nifiatis F. Athas J. C. Gunaratne K. D. D. Gurung Y. Monette K. M. Shivokevich P. J. Open Spectrosc. J. 2011;5:1–12. doi: 10.2174/1874383801105010001. [DOI] [Google Scholar]
- Paul D. Melin F. Hirtz C. Wytko J. Ochsenbein P. Bonin M. Schenk K. Maltesse P. Weiss J. Inorg. Chem. 2003;42:3779–3787. doi: 10.1021/ic0341643. [DOI] [PubMed] [Google Scholar]
- Hunter A. C. NafeesMeah M. Jeremy K. Sanders M. J. Am. Chem. Soc. 1990;112:5773–5780. doi: 10.1021/ja00171a016. [DOI] [Google Scholar]
- Mak C. C. Bampos N. Sanders J. K. M. Angew. Chem. 1998;37:3020–3023. doi: 10.1002/(SICI)1521-3773(19981116)37:21<3020::AID-ANIE3020>3.0.CO;2-S. [DOI] [PubMed] [Google Scholar]
- Benesi H. Hildebrand J. J. Am. Chem. Soc. 1949;71:2703–2707. doi: 10.1021/ja01176a030. [DOI] [Google Scholar]
- Kim D. Shin E. J. Bull. Korean Chem. Soc. 2003;24:1490–1494. doi: 10.5012/bkcs.2003.24.10.1490. [DOI] [Google Scholar]
- Shin E. J. Kim D. J. Photochem. Photobiol., A. 2002;152:25–31. doi: 10.1016/S1010-6030(02)00189-2. [DOI] [Google Scholar]
- Kadish K. M. Morrison M. M. J. Am. Chem. Soc. 1976;98:3326–3328. doi: 10.1021/ja00427a046. [DOI] [PubMed] [Google Scholar]
- Quimby D. J. Longo F. R. J. Am. Chem. Soc. 1975;97:5111–5116. doi: 10.1021/ja00851a015. [DOI] [Google Scholar]
- Fuhrhop J. H. Kadish K. M. Davis D. G. J. Am. Chem. Soc. 1973;95:5140–5147. doi: 10.1021/ja00797a008. [DOI] [PubMed] [Google Scholar]
- Devillers C. H. Lucas D. Dime A. K. D. Rousselin Y. Mugnier Y. Dalton Trans. 2010;39:2404–2411. doi: 10.1039/B914916C. [DOI] [PubMed] [Google Scholar]
- Jabli M. Touati R. Kacem Y. Hassine B. B. J. Text. Inst. 2012;103:434–450. doi: 10.1080/00405000.2011.581797. [DOI] [Google Scholar]
- Jabli M. Baccouch W. Hamdaoui M. Aloui F. J. Text. Inst. 2018;109:232–240. doi: 10.1080/00405000.2017.1337295. [DOI] [Google Scholar]
- Aloui F. Jabli M. Hassine B. B. Synth. Commun. 2012;42:3620–3631. doi: 10.1080/00397911.2011.587629. [DOI] [Google Scholar]
- Aloui F. Jabli M. Hassine B. B. Synth. Commun. 2013;43:277–291. doi: 10.1080/00397911.2011.598254. [DOI] [Google Scholar]
- Hassani R. Jabli M. Kacem Y. Marrot J. Prim D. Hassine B. B. Beilstein J. Org. Chem. 2015;1:1175–1186. doi: 10.3762/bjoc.11.132. [DOI] [PMC free article] [PubMed] [Google Scholar]
- Jabli M. Baouab M. H. V. Roudesli M. S. Bartegi A. J. Eng. Fibers Fabr. 2011;6:1–12. [Google Scholar]
- Jabli M. Baouab M. H. V. Sintes-Zydowicz N. Hassine B. B. J. Appl. Polym. Sci. 2012;123:3412–3424. doi: 10.1002/app.34519. [DOI] [Google Scholar]
- Jabli M. Aloui F. Hassine B. B. J. Eng. Fibers Fabr. 2013;8:19–34. [Google Scholar]
- Jabli M. Mohamed H. Aymen J. Yassine G. Hassine B. B. J. Text. Inst. 2014;105:661–675. doi: 10.1080/00405000.2013.843851. [DOI] [Google Scholar]
- Mazengarb S. Roberts G. A. F. Prog. Chem. Appl. Chitin Its Deriv. 2009;14:25–32. [Google Scholar]
- Weber W. J. Morris J. C. J. Sanit. Eng. Div. 1963;89:31–60. [Google Scholar]
- Ho Y. S. McKay G. Can. J. Chem. Eng. 1998;76:822–827. doi: 10.1002/cjce.5450760419. [DOI] [Google Scholar]
- Sani H. A. Ahmad M. B. Saleh T. A. RSC Adv. 2016;6(110):108819. doi: 10.1039/C6RA24615J. [DOI] [Google Scholar]
- Al-Shalalfeh M. M. Saleh T. A. Al-Saadi A. A. RSC Adv. 2016;6(79):75282–75292. doi: 10.1039/C6RA14832H. [DOI] [Google Scholar]
- Alansi A. M. Alkayali W. Z. Al-qunaibit M. H. Qahtan T. F. Saleh T. A. RSC Adv. 2015;5(87):71441–71448. doi: 10.1039/C5RA10545E. [DOI] [Google Scholar]
Associated Data
This section collects any data citations, data availability statements, or supplementary materials included in this article.


