Abstract
It remains unclear how immune cells from skull bone marrow niches are recruited to the meninges. Here, we report that cerebrospinal fluid (CSF) accesses skull bone marrow via dura-skull channels, and CSF proteins signal onto diverse cell types within the niches. Following spinal cord injury, CSF-borne cues promote myelopoiesis and egress of myeloid cells into meninges. This reveals a mechanism of CNS- and CSF-to-bone-marrow communication that regulates CNS immune responses.
CNS borders, including meninges and choroid plexus, harbor a rich repertoire of immune cells with important roles in brain function1–7. Importantly, myeloid populations, including monocytes and neutrophils, residing in the meninges arise predominantly from local bone marrow niches housed in the skull and vertebrae, rather than from blood8. The factors influencing the cellular makeup of these compartments, and the origin of cues calling immune cells into meningeal tissue, however, remain largely unknown.
We hypothesized that local CNS cues, contained in cerebrospinal fluid (CSF), could instruct myeloid cell recruitment to the meninges. Efflux of molecules from the brain is achieved via the blood-brain barrier9–10 and via CSF perfusion through the brain in a process termed “glymphatic clearance” 11. Through a glymphatic mechanism, brain-derived molecules are continuously cleared via CSF, efflux to the parasagittal dura mater, and subsequently drain through meningeal lymphatic vessels, enabling immune surveillance of the CNS from distant sites4,12. Recent studies demonstrated that skull bone marrow also connects directly to the underlying dura through ossified vascular channels13–15. While these channels have been previously described to allow myeloid and lymphoid cell migration from the skull bone marrow to the dura, we speculated that these pathways may be bi-directional, allowing bone marrow direct access to the CSF. Here, we show that CSF accesses skull bone marrow niches, where it regulates myelopoiesis and egress to meninges in physiology and pathology.
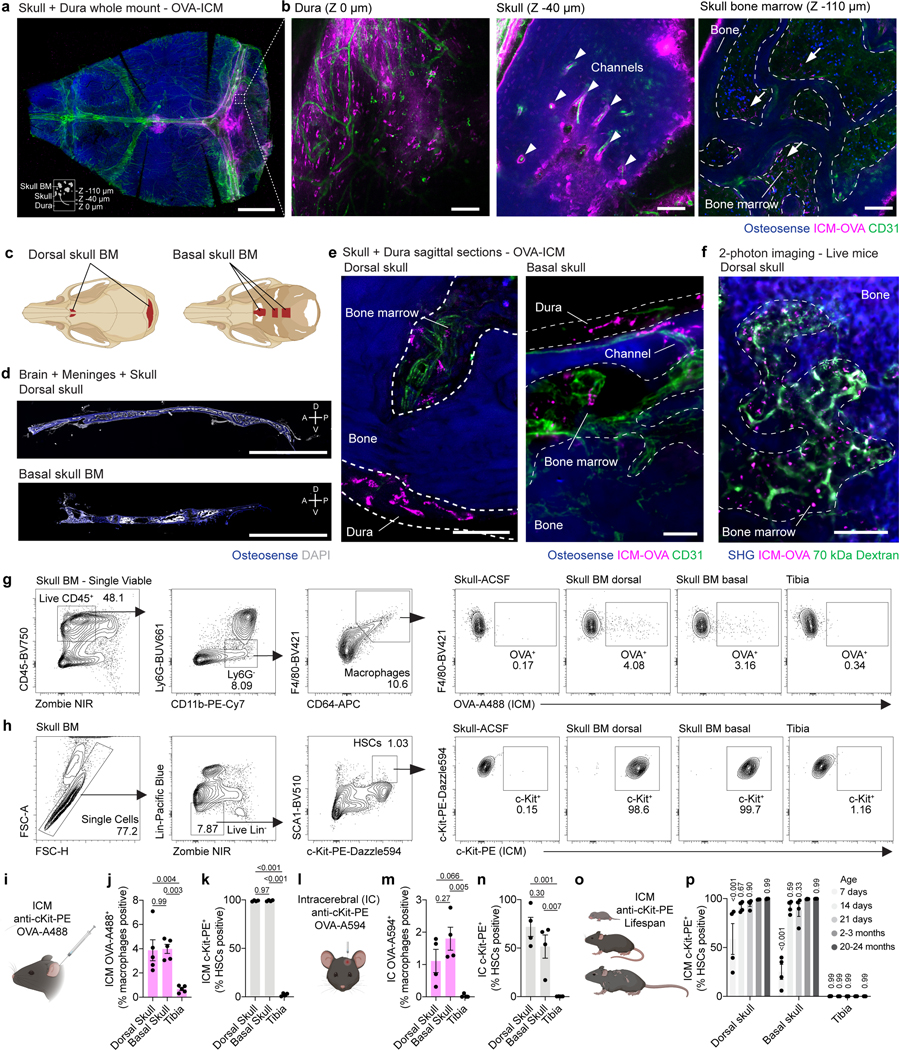
To test the possibility that CSF interfaces with CNS bone marrow niches, we injected fluorescent ovalbumin (OVA, ~45 kDa) into CSF via the cisterna magna (intra-cisterna-magna; i.c.m.) and examined its efflux to skull bone marrow after one hour. Whole-mounted decalcified and cleared skullcaps with underlying dura revealed uptake of tracer along dural sinuses (Fig. 1a,b), as previously described4. Three-dimensional reconstructions of skull bone marrow regions also showed tracer along perivascular conduits within ossified channels and within the bone marrow niche (Fig. 1a,b and Supplementary Video 1).
Fig. 1. CSF accesses skull bone marrow niches.
a, Representative maximum intensity projection of a decalcified and cleared skull cap-dura whole mount 1 hour after an intra-cisterna magna (i.c.m.) injection of OVA-A594. Scale bar: 2 mm. b, Z-sections through the dura, cortical skull bone, and trabecular bone marrow in a region of interest from the skull cap-dura whole mount. Arrowheads highlight perivascular OVA accumulation. Arrows denote OVA-positive cells within the bone marrow cavity. Scale bar: 100 μm. c, Anatomy of skull bone marrow niches in the dorsal and basal skull. d, Sagittal sections through the dorsal and basal skull. Scale bar: 3 mm. e, High-magnification images of tracer accumulation in the dorsal (left) and basal (right) bone marrow of the skull 1 hour after an i.c.m. injection of OVA-A594. Scale bars: 50 μm. f, Representative two-photon image of skull bone marrow in a live mouse 30 min following administration of 70 kDa FITC-dextran (i.v.) and OVA-594 (i.c.m.). Scale bar: 100 μm. g, Gating strategy and representative plots of i.c.m. OVA-A488 labelling in bone marrow macrophages. h, Gating strategy and representative plots of i.c.m. c-Kit-PE labelling in bone marrow HSCs. i-k, Experimental design, percentage of HSCs positive for i.c.m. c-Kit-PE, and percentage of macrophages positive for i.c.m. OVA-A488 1 hour post injection. n = 4 or 5 mice. Data are means ± SEM, p values represent a one-way ANOVA with Tukey’s post-hoc test. l-n, Experimental design, percentage of HSCs positive for i.c. c-Kit-PE, and percentage of macrophages positive for i.c. OVA-A594 1 hour post injection. n = 4 mice. Data are means ± SEM, p values represent a one-way ANOVA with Tukey’s post-hoc test. o, p, Experimental design and percentage of bone marrow HSCs positive for c-Kit-PE 1 hour after i.c.m. injection in postnatal day 7, 14, 21, adult (2–3 months old), and aged (20–24 months old) mice. n = 4 mice. Data are means ± SEM, p values represent a two-way ANOVA with Dunnett’s post-hoc test versus 2–3 months.
While the dorsal aspect of the skull bone marrow contains ossified channels14–15 that provide myeloid and lymphoid populations directly to the underlying dura8,13,16, whether similar anatomical structures are present in the skull base is unclear. Examination of the skull base revealed enriched pockets of marrow (Fig. 1c,d) with an equivalent array of stem, progenitor, myeloid and lymphoid populations (Extended Data Fig. 1a-c). Assessment of skull base bone marrow niches demonstrated the conserved presence of channels and similar perivascular conduits of CSF tracer efflux as those observed in dorsal skull (Fig. 1e). To exclude any potential contribution of post-mortem artefact, we employed intravital 2-photon microscopy and observed the CSF tracer in the dorsal skull bone marrow niche 30 min following i.c.m. injection (Fig. 1f).
To confirm that CSF interfaces with cells in the skull bone marrow, we assessed accumulation of OVA signal in macrophages and observed uptake in both dorsal and basal skull niches following i.c.m. injection (Fig. 1g,i,j). To demonstrate that CSF interacts with other cells within the bone marrow niche, we assessed labelling of hematopoietic stem cells (Lin–Sca1+c-Kit+) by flow cytometry of young adult mice following i.c.m. injection of an anti-c-Kit antibody. One hour following i.c.m. delivery, 99 % of LSK cells in skull bone marrow were labeled with the antibody (Fig. 1h,i,k). Intracerebral (i.c.) injection of OVA and anti-c-Kit antibody also labeled macrophages and hematopoietic stem cells (HSCs), respectively, suggesting that parenchymal solutes traffic into the CSF, as previously described4,11,17, and subsequently access skull bone marrow (Fig. 1l-n). Importantly, 1 hour following either i.c.m. or i.c. injection, neither c-Kit- nor OVA-labeled cells were found in peripheral tibial bone marrow, confirming that this CSF access reflects direct CSF-to-skull bone marrow communication, rather than peripheral blood recirculation (Fig. 1i-n).
Paravascular glymphatic fluid flow and meningeal lymphatic drainage of CSF change throughout the lifespan17–19. We therefore wondered whether CSF access to skull bone marrow similarly changes throughout postnatal development and aging because of altered CSF dynamics. Surprisingly, no major changes in CSF-skull bone marrow accessibility were observed beyond the second postnatal week (Fig. 1o,p), suggesting that CSF-derived factors have the potential to shape skull bone marrow niches throughout the entire lifespan.
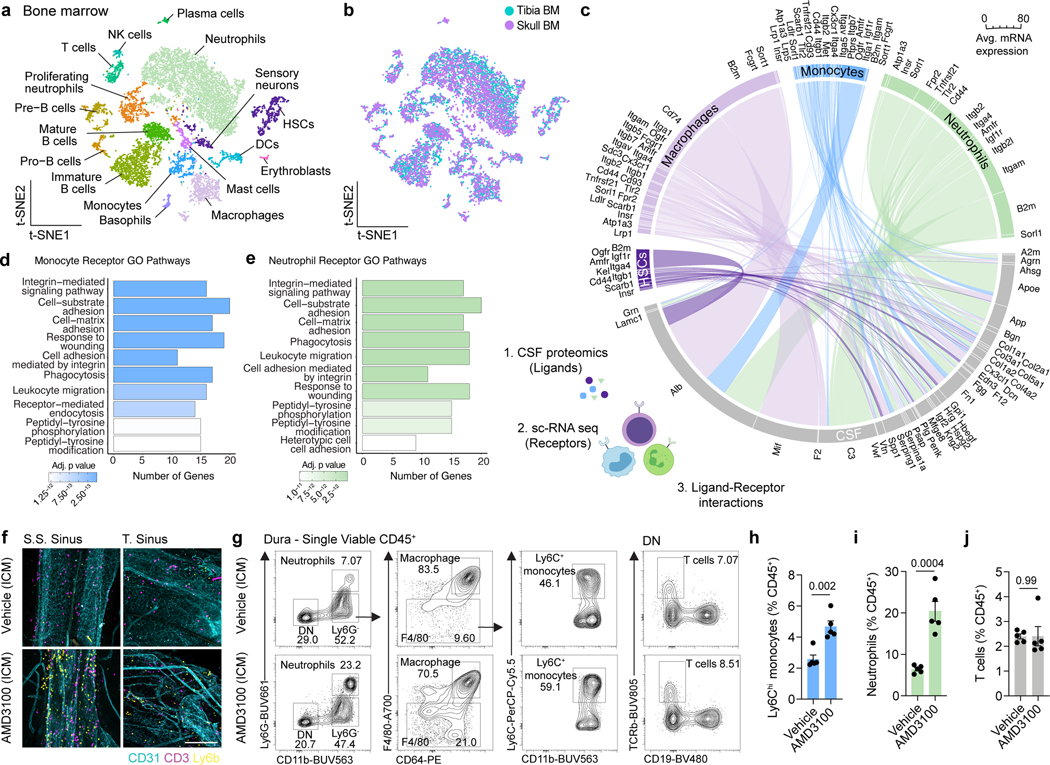
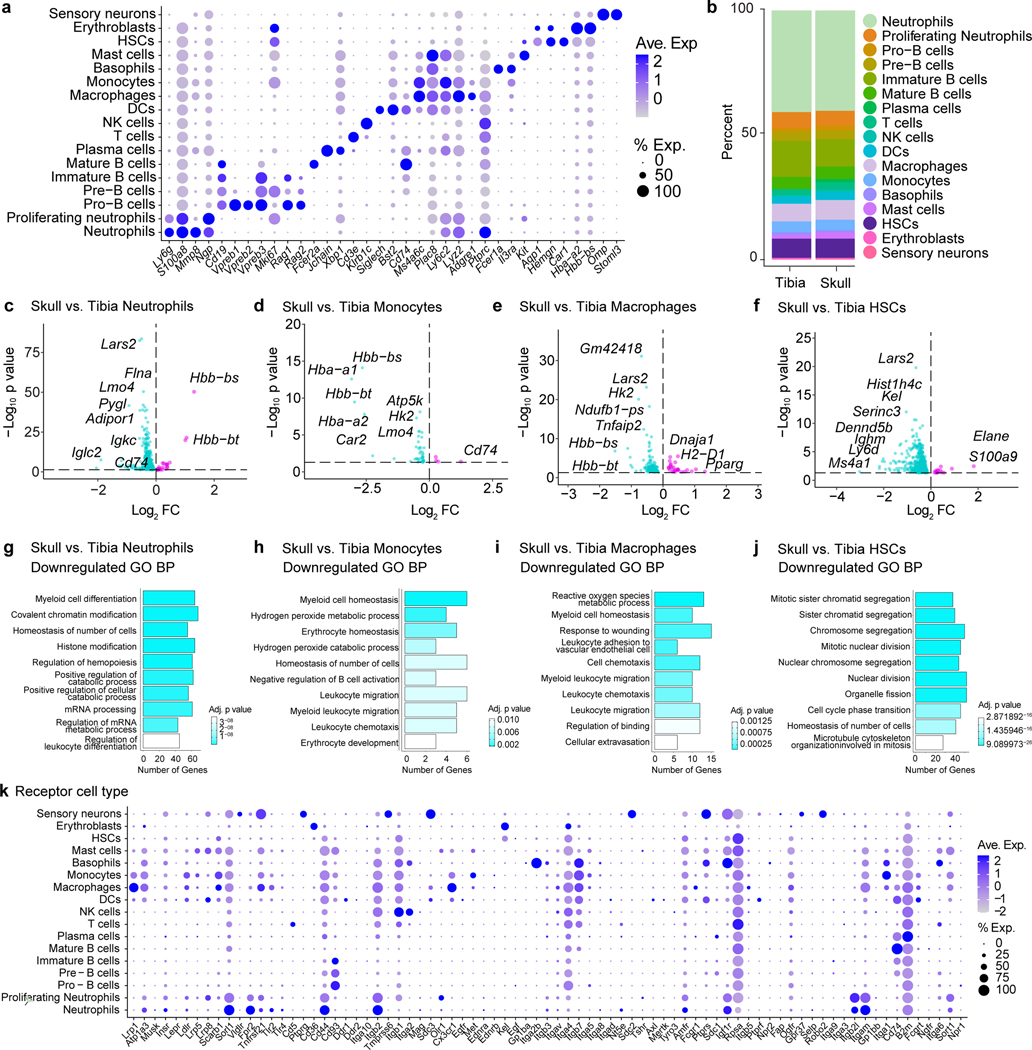
CSF composition shapes neurogenic niches during CNS development through direct ligand-receptor signaling20. Given that CSF directly accesses skull bone marrow, we asked whether exposure to CSF affords the skull marrow niche a unique phenotype. To this end, we performed single-cell RNA-seq (scRNAseq) of dorsal skull and tibial bone marrow from young-adult mice. Phenotypic analysis revealed expected bone marrow populations21, including HSCs, monocytes, neutrophils, basophils, mast cells, erythroblasts, sensory neurons, DCs, NK cells, T cells, and B cell developmental trajectories (Fig. 2a,b and Extended Data Fig. 2a). While there were no major differences in the cellular composition of skull versus tibia bone marrow niche, differences were observed within neutrophil, monocyte, macrophage, and HSC populations including downregulation of genes involved in proliferation in HSCs, reactive oxygen species production in monocytes and macrophages, and myeloid cell differentiation in neutrophils (Extended Data Fig. 2b-j). We, therefore, wanted to further explore the nature of steady state signaling between CSF and skull bone marrow to determine if CSF factors may modify bone marrow physiology. We performed a proteomic analysis of CSF from young adult mice, and, leveraging our scRNAseq dataset, uncovered a set of potential ligand-receptor interactions between CSF proteins and diverse cells in the skull bone marrow (Fig. 2c, Extended Data Fig. 2k, and Supplementary Table 1).
Fig. 2. Functional interactions between CSF and the skull bone marrow niche.
a, b, t-distributed stochastic neighbor embedding (tSNE) visualizations of single-cell RNAseq from dorsal skull and tibial bone marrow from 2 month old mice colored by cell type a, or sample b. c, Chord plot detailing between CSF ligands identified by unlabeled liquid chromatography-mass spectrometry (LC-MS) and receptors on skull bone marrow hematopoietic stem cells (HSCs), macrophages, monocytes, and neutrophils identified by sc-RNA-seq. d, e, Gene ontology pathway analysis on receptor genes with at least one CSF ligand in monocytes and neutrophils. f, Representative immunohistochemistry of CD3+ and Ly6b+ cells at the superior sagittal sinus (S.S. Sinus) and transverse sinus (T. Sinus) of the dura mater, 24 hours after an intra-cisterna magna (i.c.m.) injection of 10 μg AMD3100 or artificial cerebrospinal fluid (aCSF). Scale bar: 200 μm. g-j, Flow cytometry gating strategy and frequency of Ly6Chi monocytes, neutrophils, and T cells proportions following an i.c.m. injection of 10 μg AMD3100 or aCSF. n = 5 mice per group. Data are means ± SEM, p values represent a two-sided Student’s t-test.
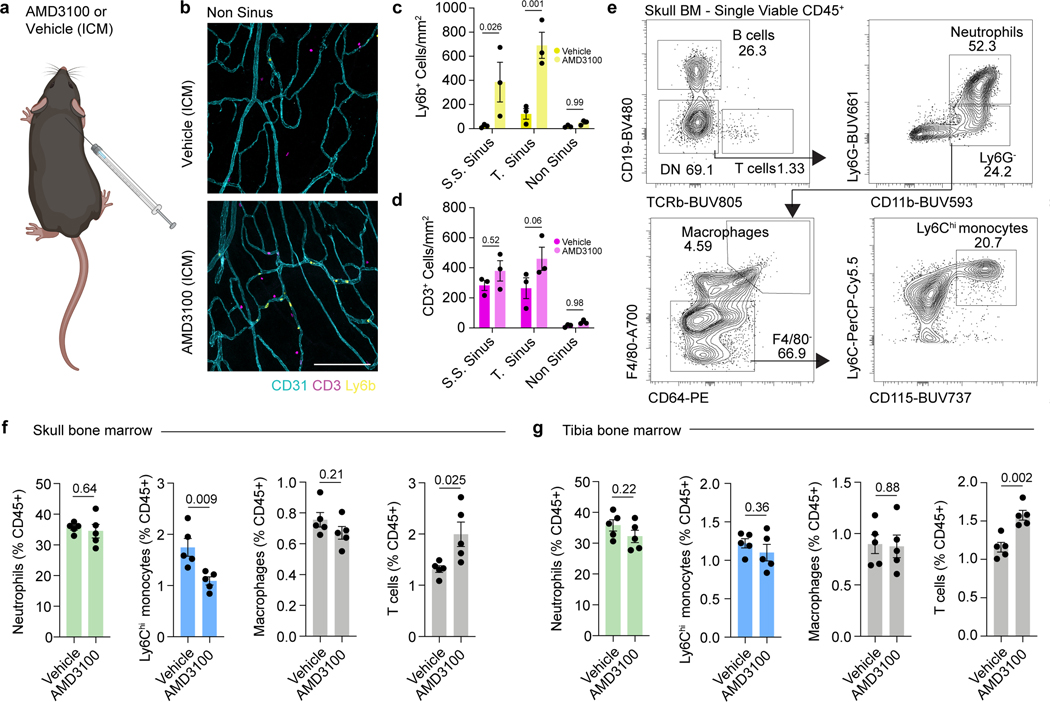
Examining gene ontology pathways of these ligand-receptor interactions in monocytes and neutrophils revealed signaling mechanisms enriched for leukocyte migration, cell adhesion, and phagocytosis (Fig. 2d,e). These enriched pathways suggested that CSF-derived factors could instruct the mobilization and recruitment of myeloid cells from the skull bone marrow. To test this, we injected AMD3100, a CXCR4 antagonist, into the CSF and assessed monocyte and neutrophil egress from skull bone marrow to the dura. By immunostaining we found that Ly6b+ monocytes and neutrophils in the dura were significantly enriched after AMD3100 administration and preferentially clustered at nearby sinuses underlying skull bone marrow niches (Fig. 2f and Extended Data Fig. 3a-d). Using flow cytometry, we confirmed a significant increase in Ly6Chi monocytes and neutrophils in the dura, along with a concomitant decrease in overlying skull bone marrow, suggesting local bone marrow egress rather than dural proliferation (Fig. 2g-i and Extended Data Fig. 3e,f). Importantly, we did not detect a change in dural T cells (Fig. 2j) or any changes in tibial monocytes or neutrophils (Extended Data Fig. 3g), consistent with the notion of T cell trafficking through blood vasculature22,23, while myeloid cells migrate directly from skull bone marrow niches8. These results confirmed that myeloid cells can egress from the skull bone marrow in response to CSF-derived cues, suggesting an ability to dynamically respond to altered brain states.
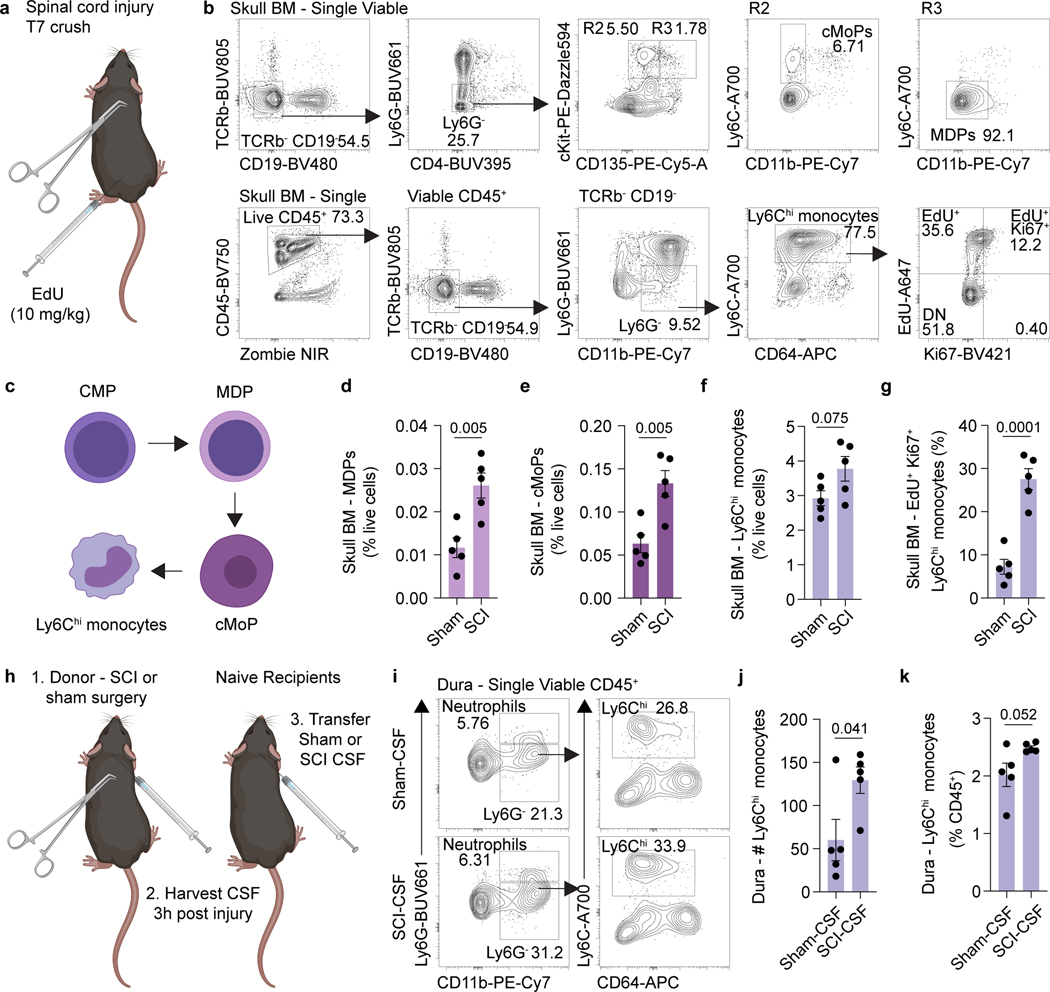
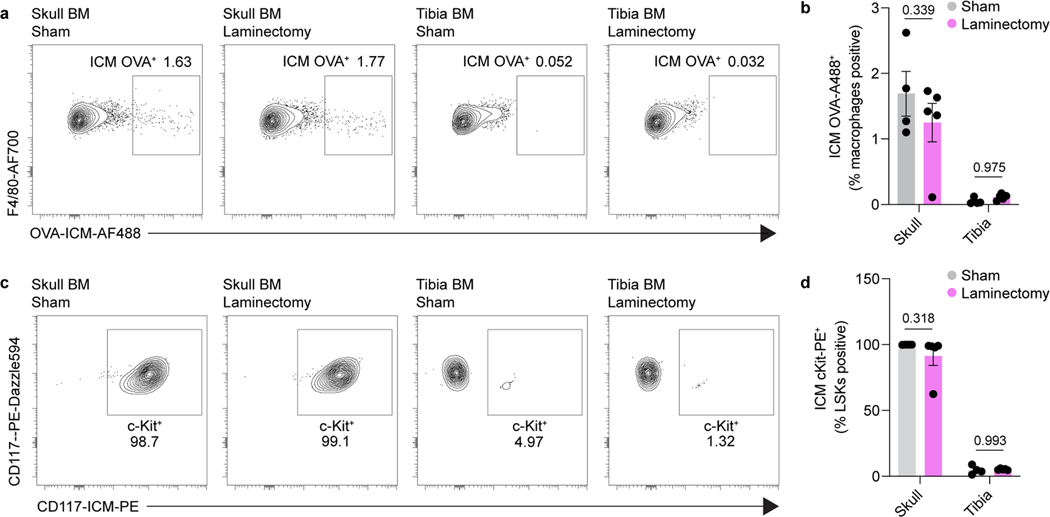
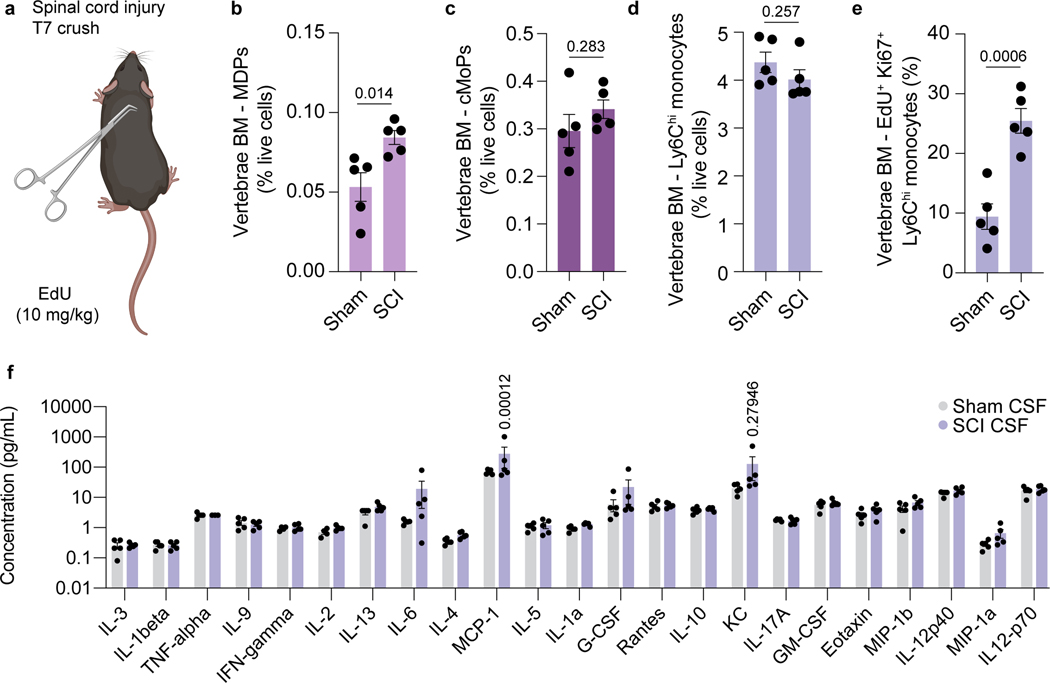
We next asked whether physiological changes in CSF composition, for example following CNS injury, could instruct skull bone marrow mobilization. To test this, we performed a spinal cord crush injury—during which a laminectomy is performed and the spinal cord meninges are left intact, thus preventing CSF leakage—in young adult mice, and asked whether a distant CNS injury could be sensed by the skull bone marrow. Importantly, laminectomy did not impair CSF access to the skull bone marrow niche (Extended Data Fig. 4a-d). Three hours following spinal cord injury, vertebrae and skull bone marrow were harvested and myeloid progenitors assessed. As expected, vertebrae bone marrow was highly activated after the injury, characterized by elevated numbers of proliferating monocytes (Extended Data Fig. 5a-e). Interestingly, remote skull bone marrow niches also demonstrated a substantial increase in the percent of monocyte-dendritic cell progenitors (MDPs), common monocyte progenitors (cMoPs), and proliferating monocytes, compared to sham controls (Fig. 3a-g). Additionally, assessment of CSF composition following spinal cord injury revealed elevated levels of the monocyte chemoattractant CCL2 (MCP-1) (Extended Data Fig. 5f). These results suggest that CSF carries cues to neighboring bone marrow niches to induce myelopoiesis and provide myeloid cells to underlying dura or brain tissue following CNS insults.
Fig. 3. CSF-contained cues mobilize the skull bone marrow in response to CNS injury.
a, Experimental design for spinal cord injury experiments. Spinal cord injury was performed in 2 month old mice at T7 following laminectomy (sham group included laminectomy). EdU (10 mg/kg) was injected one hour prior to harvest. Three hours later, skull bone marrow was processed for flow cytometry. b, Gating strategy for monocyte dendritic precursors (MDP), common monocyte progenitors (cMoP), and actively proliferating Ki67+ EdU+ Ly6Chi monocytes. c, Schematic detailing differentiation of the monocyte lineage from common myeloid progenitors (CMPs). d-g, Frequency of MDPs, cMoPs, Ly6Chi monocytes, and actively proliferating Ki67+ EdU+ Ly6Chi monocytes in the skull bone marrow of sham and spinal cord injury animals. n = 5 mice per group. Data are means ± SEM, p values represent a two-sided Student’s t-test. h, Experimental design for CSF transfer experiments post spinal cord injury. CSF was harvested from the cisterna magna of sham or spinal cord injury mice 3 hours post injury, and 10 μL was transferred to naive mice via intra-cisterna magna (i.c.m.) injection. After 6 hours, dural meninges from mice with CSF transferred were harvested. i, Flow cytometry gating strategy for dural Ly6Chi monocytes following transfer of sham or spinal cord injury CSF. j, k, Absolute numbers and frequency of monocytes in the dura following transfer of CSF from sham and spinal cord injury mice. n = 5 mice per group. Data are means ± SEM, p values represent a two-sided Student’s t-test.
To determine whether the skull bone marrow response following spinal cord injury is indeed mediated by CSF-contained signals and to confirm that this is sufficient to promote myeloid cell trafficking, we performed CSF transfer experiments. Sham (that included laminectomy) or spinal cord injury were performed on young adult mice and three hours later their CSF was harvested and transferred into naïve mice (Fig. 3h). Six hours after CSF transfer, we observed a significant increase in the number of monocytes in the dura of mice receiving CSF from injured mice, compared to CSF obtained from sham donors (Fig. 3i-k). As CSF can be drained via meningeal lymphatics and into peripheral blood24, we cannot entirely exclude the possibility that some of the observed response was systemically driven. However, neither a sham surgery nor a laminectomy resulted in redistribution of CSF to a distant peripheral bone marrow niche in the tibia (Extended Data Fig. 4a-d), suggesting the phenotype observed was through direct CSF to skull bone marrow signaling.
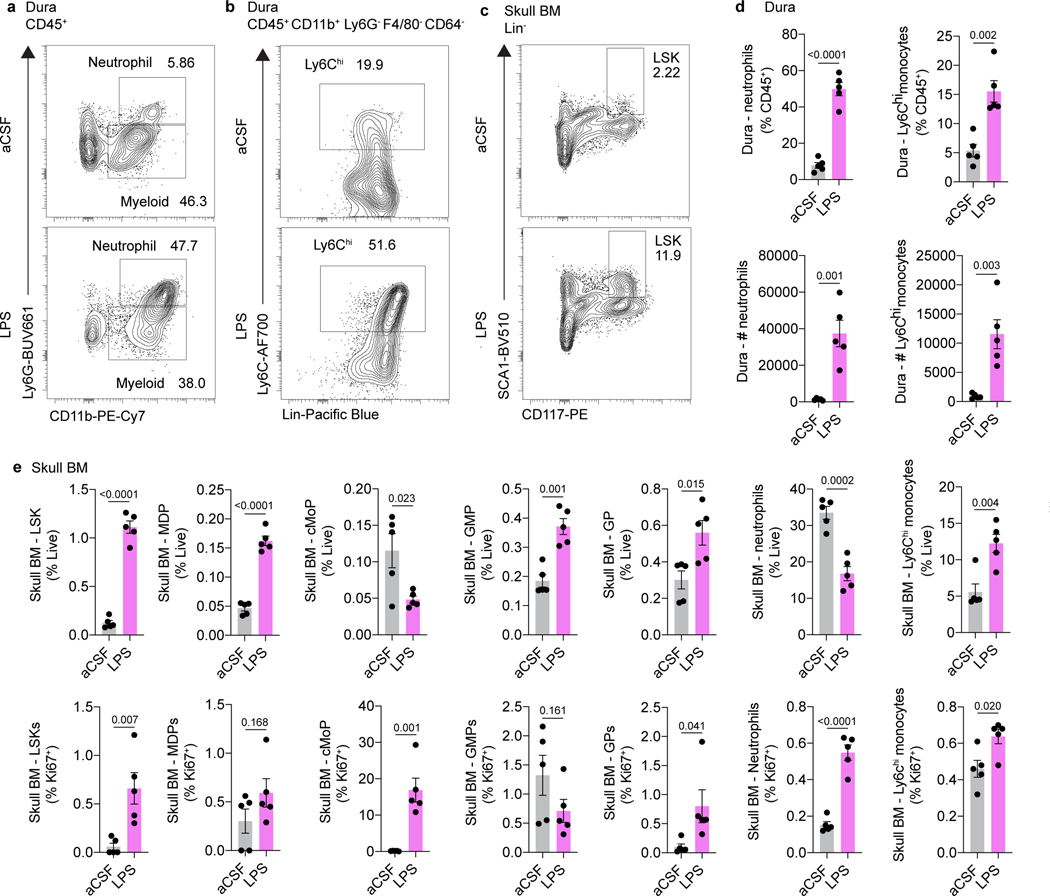
Beyond CNS injury, we hypothesized that direct CSF access to skull bone marrow could play an important role in CNS pathogen sensing. Indeed, injection of lipopolysaccharide (LPS), an outer cell membrane component of Gram-negative bacteria, into the CSF of mice resulted in expansion of skull bone marrow HSCs and myeloid progenitors and a concomitant increase in dural monocytes and neutrophils (Extended Data Fig. 6a-e).
Our understanding of the mechanisms regulating meningeal immune supply is evolving. In this study, we describe a previously unrecognized form of neuroimmune communication between the CNS and its surrounding immune reservoirs. We show that CSF accesses skull bone marrow niches and mobilizes HSCs and myeloid cells following CNS injury or infection (Extended Data Fig. 7). Additionally, we show that skull bone marrow populations have a unique transcriptional identity compared to non-CNS-associated bone marrow, suggesting that CSF-derived factors may instruct the phenotype of skull bone marrow populations.
Understanding how changes in CSF composition impact local immune supply from bone marrow niches will shed light on pathogenic mechanisms contributing to neurodevelopmental disorders, neurodegeneration, and CNS cancers.
Methods
Mice.
Mice were housed under pathogen-free, temperature and humidity controlled conditions with a 12-hour light cycle. Mice were housed no more than 5 animals to a cage with rodent chow and water provided ad libitum. In all experiments male mice were used. Adult mice (8–12 weeks old) used in this study were C57BL/6J purchased from Jackson Laboratory (WT; JAX000664). Mice at different developmental stages (postnatal day 7 (P7), P14, and P21) were obtained from colonies established in-house. Aged mice (20–24 months) were obtained from the National Institutes of Aging. All experiments were performed under the approval of the Institutional Animal Care and Use Committee at Washington University in St. Louis (#200–043)
Tracer injection and CSF collection.
Mice were anesthetized via intraperitoneal injection of ketamine (100 mg/kg)/xylazine (10 mg/kg) in saline and placed on a stereotactic frame. The fur over the incision site is clipped and the skin is disinfected with three alternating washes of alcohol and betadine. For intracerebral injections, a midline incision was made along the scalp, exposing the dorsal skull. A burr hole was carefully made using a dental drill. A 1:1 ratio of ovalbumin-594 and anti-c-Kit-PE (1 μL) was injected using a glass capillary attached to a microinjector (World Precision Instruments) over 2 min at the following coordinates: +1.5 A/P, −1.5 M/L, −2.5 D/V. The glass capillary was left in place for another 2 min to prevent backflow. For intra-cisterna magna injections, the posterior scalp and neck was shaved and prepared with iodine antiseptic. The head was placed in a stereotactic frame with the neck flexed. A midline incision was made and the posterior nuchal musculature divided, exposing the inferior, dorsal aspect of the occipital bone and the posterior dura overlying the cisterna magna. A glass capillary attached to a microinjector (World Precision Instruments) was used. Volumes of 1, 2, and 3 μL were infused in P7, P14, and P21 pups, respectively, while 5 μL were infused in adult and aged mice. Injection rates were adjusted to achieve a 5 min injection, followed by a 5 minute wait period to prevent backflow. For CSF collection, a glass capillary was inserted through the dorsal dura mater into the superficial cisterna magna and approximately 15 μL of cerebrospinal fluid (CSF) were drawn by capillary action. For CSF transfer experiments, 10 μL of CSF was transferred. For AMD3100 experiments, mice received a 10 μg injection in 5 μL of artificial (aCSF). For Lipopolysaccharide (LPS) injections, mice received 1.25 μg of LPS from Escherichia coli O111:B4 (Sigma-Aldrich) dissolved in aCSF via an intra cisterna magna injection. Mice were allowed to recover on a heating pad. For animals undergoing survival surgery, the skin was sutured and ketoprofen (2–5 mg/kg) was subcutaneously injected for post-operative analgesia.
Tissue processing and immunohistochemistry.
Tissues were drop-fixed in paraformaldehyde (4 % w/v in PBS). Skulls, duras, and skull-dura whole-mounts were fixed for 1 h at 4 °C. Bones were decalcified in Osteosoft (Merck, NJ, USA) for 3 days at 37 °C with agitation, and brains were cryopreserved in sucrose (30 % w/v in PBS) until they sank. Tissues destined for sectioning were snap frozen in optimal cutting temperature medium (ThermoFisher), and 20 μm sagittal sections cut on a cryostat (Leica, Germany) and mounted onto Superfrost Plus slides (ThermoFisher). Sections were blocked and permeabilized for 30 min in immunobuffer (PBS with 0.2 % Triton X-100 and 1 % goat serum) and primary antibodies (Supplementary Table 2), diluted in immunobuffer were added overnight at 4 °C. Samples were washed three times in PBS with 0.2 % Triton X-100 (PBS-T) and secondary antibodies (Supplementary Table 2) were added for 2 hours at room temperature. Sections were washed in PBS-T, counterstained with 4′,6-diamidino-2-phenylindole (DAPI, 0.5 μg/mL; ThermoFisher) for 10 min, and washed a final time in PBS-T. Sections were coverslipped with ProLong Gold Antifade Mountant (ThermoFisher) and glass coverslips. Before imaging, skull-dura whole mounts were cleared in RapiClear 1.52 (SUNjin Lab, Taiwan) for 30 min.
Confocal and wide-field microscopy.
Slides were stored at 4 °C until images were acquired using confocal microscopy (Leica, TCS SP8 or Leica, Stellaris) with 5× (0.15 NA) or 10× (0.4 NA), 20× (0.75 NA), and 40× (1.3 NA) objectives (Leica) and widefield microscopy (Olympus Slideview VS200) with a 10× (0.4 NA) objective (Olympus) and a Hamamatsu ORCA Flash4.0 V3 digital camera. Quantitative analysis of Ly6b+ and CD3+ cell numbers was performed using the Fiji package for ImageJ (v1.53c). Four to five representative images were acquired per site, per sample, and the results were averaged to generate the value used for a single mouse.
Two-photon microscopy of skull bone marrow.
Mice were anesthetized via i.p. administration of ketamine/xylazine and placed on a stereotactic frame. Following intra-cisterna magna ovalbumin-594 tracer (1 mg/mL) injection, calvarial bone overlying marrow was exposed via midline skin incision. To visualize the vasculature, 100 μL of 70 kDa FITC-dextran (5 mg/mL; Sigma-Aldrich) in saline was infused retro-orbitally immediately prior to imaging. Images of tracer in bone marrow niches of the intact skull were acquired in Nikon Elements 5.20 software using a Nikon A1RHD/MP system equipped with a 16× water immersion objective (0.8 NA), resonant scanner, and non-descanned detectors. Excitation was achieved using a Coherent Chameleon Ultra II tuned to 820 nm. Fluorescence emission was detected using the following filters: 492 SP for second harmonic generation (SHG), 525/50 for intravascular FITC-Dextran, and 575/25 for i.c.m. ovalbumin 594 (ThermoFisher).
Single-cell isolations.
Mice were humanely euthanized with a lethal dose of Euthasol (10 % v/v; i.p.), followed by transcardiac perfusion of phosphate-buffered saline (PBS) supplemented with heparin (5 U/mL). Skulls were cut from the foramen magnum at the back along the parietal ridge to the olfactory bulbs at the front, and divided into dorsal and basal portions. A single tibia was taken from each mouse. All bones were cleaned by removal of attached soft tissues and the dura was peeled from the skulls. Bone marrow suspensions were obtained as described previously8, with the skull undergoing mechanical dissociation by chopping with scissors and crushing with a pestle in PBS and tibial bone marrow was obtained by flushing. All bone marrow cells were passed through a 70 μM cell strainer prior to centrifugation. Strained marrow samples were pelleted (450 x g for 5 min) and resuspended in ACK lysis buffer (Quality Biological) for 5 min. Samples were pelleted (450 x g for 5 min) and resuspended in fluorescence activated cell sorting (FACS) buffer (2 % bovine serum albumin (BSA); company, 1 mM ethylenediamine tetraacetic acid (EDTA). Dural meninges were peeled from the inner aspect of the skullcap and enzymatically dissociated in pre-warmed buffer containing RPMI (Gibco) with collagenase VIII (1 mg/ml; Sigma-Aldrich, MO, USA), of DNase I (0.5 mg/mL; Sigma-Aldrich), and FBS (2 % v/v; Gibco). Meningeal samples were incubated at 37 °C for 20 min, with five triturations with a P1000 pipette at 10 min. Samples were then resuspended and passed through a 70 μM cell strainer. The digestion process was neutralized by addition of an equal volume of DMEM with 10 % FBS (v/v). Dural suspensions were pelleted (450 x g, 5 min) and resuspended in FACS buffer before staining.
Flow cytometry.
Cell suspensions were prepared as described above and transferred into a V-bottom plate. Viability staining was performed using Zombie NIR (1:500 in PBS, 10 min, room temperature; Biolegend, CA, USA). Suspensions were then pelleted (450 x g for 5 min), and resuspended in anti-CD16/32 antibody (1:100; Biolegend) diluted in FACS buffer to block Fc-receptor binding. Antibodies against cell surface epitopes were then added for 10 min at room temperature. For a full list of antibodies, see table in S2. Flow cytometry was performed using an Aurora spectral flow cytometer (Cytek Biosciences, CA, USA) and data were analyzed with FlowJo (v10; BD Biosciences, NJ, USA).
EdU and Ki-67 staining for proliferation analysis.
EdU staining was performed on selected flow cytometry samples with the Click-iT™ Plus EdU Alexa Fluor™ 647 Flow Cytometry Assay Kit (ThermoFisher). Mice received intraperitoneal injection of 10 mg/kg of EdU 4 or 7 hours prior to sacrifice. Following single-cell isolations described above, cell surface antibody staining, fixation, and permeabilization, EdU staining was performed according to the manufacturer’s instructions. Ki-67 staining was performed following EdU staining.
CSF harvesting and proteomics.
Mouse CSF (4 μL) was added to 16 μL of digestion buffer (100 mM Tris-HCl, pH 8 containing 8 M urea). The samples were reduced with 5 mM DTT and incubation at 37 °C for one hour. The reduced protein were alkylated with 10 mM iodoacetamide for 30 min at room temperature in the dark. The urea concentration was diluted to 2 M urea by the addition of 50 mM Tris, pH 8. The proteins were digested with LysC (1 μAU) for 2 h at room temperature, followed by digestion with trypsin (1 μg) overnight. The filter units were then centrifuged at 14,000 x g for 15 min to collect the peptides in the flow through. The filters were washed with 50 μL of 100 mM ammonium bicarbonate buffer and the wash was collected with the peptides. The peptides were acidified with TFA (1 % final concentration) and were desalted using two micro-tips (porous graphite carbon, BIOMETNT3CAR) (Glygen) on a Beckman robot (Biomek NX) (Chen PMID 22338125). The peptides were eluted with 60 % MeCN in 0.1 % TFA and dried in a Speed-Vac (Thermo Scientific, Model No. Savant DNA 120 concentrator), after adding TFA to 5 %. The peptides were dissolved in 20 μL of 1 % MeCN in water. An aliquot (10 %) was removed for quantification using the Pierce Quantitative Fluorometric Peptide Assay kit (Thermo Scientific, Cat. No. 23290). The remaining peptides were transferred to autosampler vials (Sun-Sri, Cat. No. 200046), dried and stored at −80 °C for LC-MS analysis. LC-MS analysis and identification and quantification of proteins was performed as described previously4.
Bone marrow FACS and single-cell RNA-sequencing.
Tibias and skulls were harvested from 5 wild-type 8 week old male C57BL/6J mice and the surrounding flesh was removed. For skulls the dura was peeled and removed with fine forceps. Both the tibia and skull were then cut into small pieces using sterile scissors and mechanically dissociated in FACS buffer with a pestle, followed by a filtration step through a 70 μm cell strainer. Samples were centrifuged for 5 min at 420 x g, and red blood cell lysis performed with ACK lysis buffer. Samples were washed in FACS buffer, stained with DAPI (0.2 μg/mL), and Viable (DAPI-) single cells were sorted on a BD FACSAria II (BD Biosciences) into 1 % BSA-coated 1.5 mL Eppendorf tubes with 500 μL of DMEM. Cells were then centrifuged at 420 x g for 5 min, resuspended in 0.04 % non-acetylated BSA in PBS, and viability was determined via trypan blue exclusion. Sample loading and library construction were performed using the 10X Genomics Chromium platform and Chromium Single Cell 3′ Library and Gel Bead Kit v3 as previously described4. Data preprocessing, dimensionality reduction and clustering, differential expression analysis, and pathway enrichment were performed as previously described4.
CSF collection and multiplex analyte analysis.
Mice were anesthetized via i.p. administration of ketamine/xylazine and placed on a stereotactic frame. Cerebrospinal fluid was collected from the cisterna magna under a dissection microscope using a glass capillary (Sutter Instrument, B100–50–10, pulled with a Sutter Instrument P-30 micropipette puller to a size of 0.5 mm in diameter). CSF (12.5 μl ) was obtained from each mouse and analyte quantification performed using Luminex magnetic beads with the Bio-Plex Pro Mouse Cytokine Panel 23-plex instruction (Bio-Rad). Data were acquired with the Luminex Flexmap 3D and analyzed with xPONENT Software V4.2 (both from Luminex Corp., Austin, TX).
Ligand-receptor interaction network analysis.
The list of proteins identified in the CSF MS/MS (table S1) was converted to coding genes with the use of BiomaRt using the Uniprot ID and Ensembl gene name as conversion factors. This list was then filtered to include only genes contained in the list of ligands in the annotated reference provided by RNAMagnet21 with the function getLigandsReceptors with the cellularCompartment parameter set to ‘secreted’, ‘ECM’, or ‘both’ and the version set to 3.0.0. The receptors matching those ligands were mined from the reference and their expression was plotted for cell types of interest as average normalized mRNA transcripts per population with the circlize25 package in R.
Spinal cord injury.
Mice were anesthetized using ketamine (100 mg/kg)/xylazine (10 mg/kg). The skin over the upper thoracic area was shaved and cleaned with alternating Betadyne solution and alcohol swabs. A midline incision was made and the paraspinal musculature divided, exposing the dorsal aspect of the spinal column. Hemostasis was achieved. A laminectomy was performed at T7 using a high speed drill (Friedman-Pearson Rongeur; FST; Cat No 16221–14). At this juncture control mice underwent closure of the muscles and skin in layers. Spinal cord injury cohort mice underwent spinal cord crush with fine forceps, and then muscle and skin closure. Ketoprofen (2–5 mg/kg) was subcutaneously injected for post-operative analgesia, and mice were euthanized after 3 hours.
Statistics and reproducibility.
Statistical methods were not used to recalculate or predetermine study sizes but were based on similar experiments previously published4,8,17. Experiments were blinded, where possible, for at least one of the independent experiments. No data were excluded for analysis. For all experiments, animals from different cages were randomly assigned to different experimental groups. All experiments were replicated in at least two independent experiments of at least 5 mice per group, and all replication was successful. For all representative images shown, images are representative of at least 3 independent experiments. Statistical tests for each experiment are provided in the respective figure legends. Data distribution was assumed to be normal but this was not formally tested. In all cases measurements were taken from distinct samples. Statistical analysis was performed using Prism (v8.0; GraphPad Software, Inc.).
Data availability
scRNA-seq data are available from Gene Expression Omnibus under accession number GSE184766. All data are available in the main text or the supplementary information files.
Code availability
Custom code used to analyze the RNA-seq data is freely available at: https://zenodo.org/record/5883972#.Yel3P73MJsA and the DOI for citation purposes is 10.5281/zenodo.5883972.
Extended Data
Extended Data Fig. 1. Characterization of stem and immune cell populations in the basal skull marrow.
a, Flow cytometry gating strategy for major immune populations in the skull bone marrow. b, Absolute numbers of CD45+ cells in the dorsal and basal skull marrow. n = 3 mice. Mean ± SEM. c, Relative frequencies of immune populations in the dorsal skull, basal skull, and tibial bone marrow. n = 3 mice. Mean ± SEM.
Extended Data Fig. 2. Characterization of differences between the skull and tibial marrow populations.
a, Dot plot demonstrating scaled gene expression and percentage of cells expressing genes for cluster phenotyping markers for bone marrow cell types from scRNA-seq analysis. b, Analysis of cluster proportions in skull and tibial bone marrow. c-f, Volcano plots of differentially expressed genes in neutrophils, monocytes, macrophages, and HSCs. Magenta dots represent upregulated transcripts, while cyan dots represent downregulated transcripts in skull populations compared to the tibia. y-axes represent adjusted log2 p value for cluster changes between skull and tibia. Dotted line represents an adjusted p value of 0.05 (general linear mixed model with Benjamini-Hochberg correction). g-j, Top 10 downregulated gene ontology pathways in skull vs. tibia for differentially expressed genes in neutrophils, monocytes, macrophages, and HSCs. k, Dot plot of receptor expression in skull bone marrow cells, scaled by gene expression and percentage of cells expressing the gene, showing expression of receptors for which there is a cognate CSF ligand.
Extended Data Fig. 3. Effects of AMD3100 on immune cell composition of the dura and bone marrow.
a, Experimental design for injections for skull bone marrow egress experiments. AMD3100 (10 μg) or artificial cerebrospinal fluid (aCSF) was injected intra-cisterna magna (i.c.m.), and mice were left for 24 hours. The following day, tissues were processed for immunolabeling or flow cytometry. b, Representative images of Ly6b+ cells and CD3+ cells in non-sinus regions of the dura. Scale bar: 200 μm. c, d, Regional analysis of Ly6b+ myeloid and CD3+ cells in the dura following AMD3100 administration. n = 3 mice per group. Data are means ± SEM, p values represent two-way ANOVA with Sidak’s post hoc test. e, Flow cytometry gating strategy for neutrophils, Ly6Chi monocytes, macrophages, and T cells in the bone marrow following AMD3100 administration. f, g, Relative numbers of neutrophils, Ly6Chi monocytes, macrophages, and T cells in the skull and tibial bone marrow 24 hours following i.c.m. AMD3100 administration. n = 5 mice per group. Data are means ± SEM, p values represent a two-sided Student’s t test.
Extended Data Fig. 4. Laminectomy does not affect CSF efflux to skull bone marrow.
a, Laminectomy, or sham surgery, was performed on mice and 3 hours later OVA-488 was injected into the cisterna magna. Tissues were harvested 1 hour later for flow cytometry. Representative flow plots of macrophages in skull and tibia bone marrow with either sham surgery or laminectomy. b, Quantification of i.c.m. injected OVA uptake in macrophages following sham surgery or laminectomy. n = 5 mice per group. Data are means ± SEM, p values represent a two-way ANOVA. c, Representative flow plots of i.c.m. anti-c-Kit-PE staining in LSKs in skull and tibia bone marrow with either sham surgery or laminectomy. d, Quantification of i.c.m. injected cKit-PE uptake in LSKs following sham surgery or laminectomy. n = 5 mice per group. Data are means ± SEM, p values represent a two-way ANOVA with Sidak’s post hoc test.
Extended Data Fig. 5. Effects of spinal cord injury on vertebral bone marrow.
a, Experimental paradigm for spinal cord injury experiments. Spinal cord injury (SCI) or laminectomy (sham) was performed, and at 3 hours post-injury vertebra adjacent to the site of injury were processed for flow cytometry. b-e, Relative numbers of monocyte dendritic precursors (MDPs), common monocyte progenitors (cMoPs), Ly6Chi monocytes, and actively proliferating (Ki-67+, EdU+) monocytes in vertebral bone marrow. n = 5 mice per group. p values represent a two-sided Student’s t test. f, Multiplexed measurement of cytokines and chemokines in the CSF of sham and SCI mice using Luminex. n = 5. p values represent two-sided t tests with Holm-Sidak’s multiplicity adjustment. Data are means ± SEM.
Extended Data Fig. 6. Intracisternal injection of LPS enhances hematopoiesis in skull bone marrow and triggers myeloid egress to the dura.
a, LPS (1.25 μg, 4 μL) was injected into the skull bone marrow. After 24 hours, skullcaps and dura were processed for flow cytometry. Representative flow plots of neutrophils in the dura in aCSF and LPS-treated mice. b, Representative flow plots of Ly6Chi monocytes in the dura in aCSF and LPS-treated mice. c, Representative flow plots of LSKs in the skull BM of aCSF and LPS-treated mice. d, Quantification of the proportion of CD45+ immune cells and absolute number of neutrophils and Ly6Chi monocytes in the dura of aCSF and LPS-treated mice. n = 5 mice per group. Mean ± SEM. p values represent a two-sided Student’s t test. e, Quantification of the proportion of live cells and the proportion of actively proliferating Ki67+ stem/progenitor (LSK, MDP, cMoP, GMP, GP) and myeloid (neutrophils, Ly6Chi monocytes) cells in the skull bone marrow of aCSF and LPS-treated mice. n = 5 mice per group. Mean ± SEM. p values represent a two-sided Student’s t test.
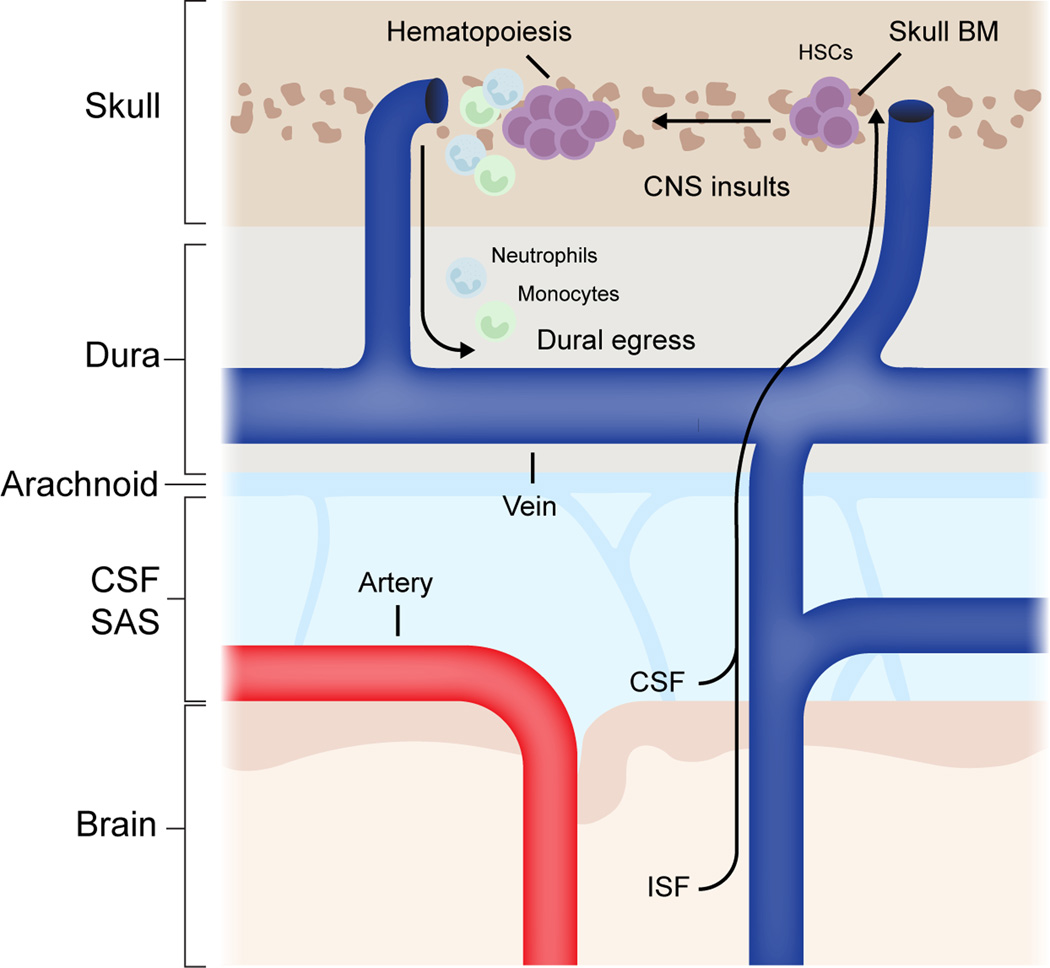
Extended Data Fig. 7. Summary schematic for proposed mechanism.
Brain interstitial fluid and cerebrospinal fluid can efflux to skull bone marrow during healthy conditions. During CNS insults—for example pathogenic infections or spinal cord injury—CSF-derived cues can promote skull bone marrow hematopoiesis and egress of myeloid cells to underlying dura. HSC; hematopoietic stem cell, CSF; cerebrospinal fluid, ISF; interstitial fluid, SAS; subarachnoid space, BM; bone marrow, CNS, central nervous system.
Supplementary Material
Acknowledgments
We thank all the members of the Kipnis laboratory for their valuable comments during numerous discussions of this work. We thank Peter Bayguinov for assistance with two-photon microscopy. We thank Reid R Townsend, Qiang Zhang, and Petra Erdmann-Gilmore for assistance with LC-MS experiments and analysis. We would also like to thank McDonnell Genome Institute for processing single-cell RNA sequencing and the Flow Cytometry Core of the Department of Pathology and Immunology, School of Medicine, Washington University in St. Louis, for assistance with cell sorting. We would also like to acknowledge Diane Bender and the Bursky Center for Human Immunology & Immunotherapy Programs (CHiiPs) for assistance with the Luminex analysis. This work was funded by Institutes of Health grants AT010416 and NS096967, a Cure Alzheimer’s Fund (Berg brain entry-exit consortium grant), and a BJC Health Care, Investigators Program, all to J.K. The funders had no role in study design, data collection and analysis, decision to publish or preparation of the manuscript.
Footnotes
Competing interests statement
J.K. is a scientific advisor, holds shares of, and has a licensing agreement with PureTech. The remaining authors declare no competing interests.
References
- 1.Mrdjen D. et al. High-Dimensional Single-Cell Mapping of Central Nervous System Immune Cells Reveals Distinct Myeloid Subsets in Health, Aging, and Disease. Immunity 48, 380–395.e6 (2018). [DOI] [PubMed] [Google Scholar]
- 2.Hove HV et al. A single-cell atlas of mouse brain macrophages reveals unique transcriptional identities shaped by ontogeny and tissue environment. Nat Neurosci 22, 1021–1035 (2019). [DOI] [PubMed] [Google Scholar]
- 3.Dani N. et al. A cellular and spatial map of the choroid plexus across brain ventricles and ages. Cell 184, 3056–3074.e21 (2021). [DOI] [PMC free article] [PubMed] [Google Scholar]
- 4.Rustenhoven J. et al. Functional characterization of the dural sinuses as a neuroimmune interface. Cell (2021) doi: 10.1016/j.cell.2020.12.040. [DOI] [PMC free article] [PubMed]
- 5.Fitzpatrick Z. et al. Gut-educated IgA plasma cells defend the meningeal venous sinuses. Nature 587, 472–476 (2020). [DOI] [PMC free article] [PubMed] [Google Scholar]
- 6.Croese T, Castellani G. & Schwartz M. Immune cell compartmentalization for brain surveillance and protection. Nat Immunol 1–10 (2021) doi: 10.1038/s41590-021-00994-2. [DOI] [PubMed]
- 7.Lima K. A. de, Rustenhoven J. & Kipnis J. Meningeal Immunity and Its Function in Maintenance of the Central Nervous System in Health and Disease. Annu Rev Immunol 38, 597–620 (2020). [DOI] [PubMed] [Google Scholar]
- 8.Cugurra A. et al. Skull and vertebral bone marrow are myeloid cell reservoirs for the meninges and CNS parenchyma. Science eabf 7844 (2021) doi: 10.1126/science.abf7844. [DOI] [PMC free article] [PubMed] [Google Scholar]
- 9.Sweeney MD, Sagare AP & Zlokovic BV Blood–brain barrier breakdown in Alzheimer disease and other neurodegenerative disorders. Nat Rev Neurol 14, 133–150 (2018). [DOI] [PMC free article] [PubMed] [Google Scholar]
- 10.Shibata M. et al. Clearance of Alzheimer’s amyloid-β1–40 peptide from brain by LDL receptor–related protein-1 at the blood-brain barrier. J Clin Invest 106, 1489–1499 (2000). [DOI] [PMC free article] [PubMed] [Google Scholar]
- 11.Iliff JJ et al. A Paravascular Pathway Facilitates CSF Flow Through the Brain Parenchyma and the Clearance of Interstitial Solutes, Including Amyloid β. Sci Transl Med 4, 147ra111–147ra111 (2012). [DOI] [PMC free article] [PubMed] [Google Scholar]
- 12.Ringstad G. & Eide PK Cerebrospinal fluid tracer efflux to parasagittal dura in humans. Nat Commun 11, 354 (2020). [DOI] [PMC free article] [PubMed] [Google Scholar]
- 13.Herisson F. et al. Direct vascular channels connect skull bone marrow and the brain surface enabling myeloid cell migration. Nature Neuroscience 21, 1209–1217 (2018). [DOI] [PMC free article] [PubMed] [Google Scholar]
- 14.Cai R. et al. Panoptic imaging of transparent mice reveals whole-body neuronal projections and skull–meninges connections. Nat Neurosci 1–11 (2018) doi: 10.1038/s41593-018-0301-3. [DOI] [PMC free article] [PubMed]
- 15.Yao H. et al. Leukaemia hijacks a neural mechanism to invade the central nervous system. Nature 560, 55–60 (2018). [DOI] [PMC free article] [PubMed] [Google Scholar]
- 16.Brioschi S. et al. Heterogeneity of meningeal B cells reveals a lymphopoietic niche at the CNS borders. Science 373, eabf9277 (2021). [DOI] [PMC free article] [PubMed] [Google Scholar]
- 17.Mesquita SD et al. Functional aspects of meningeal lymphatics in ageing and Alzheimer’s disease. Nature 560, 1–7 (2018). [DOI] [PMC free article] [PubMed] [Google Scholar]
- 18.Munk AS et al. PDGF-B Is Required for Development of the Glymphatic System. Cell Reports 26, 2955–2969.e3 (2019). [DOI] [PMC free article] [PubMed] [Google Scholar]
- 19.Kress BT et al. Impairment of paravascular clearance pathways in the aging brain. Ann Neurol 76, 845–861 (2014). [DOI] [PMC free article] [PubMed] [Google Scholar]
- 20.Lehtinen MK et al. The Cerebrospinal Fluid Provides a Proliferative Niche for Neural Progenitor Cells. Neuron 69, 893–905 (2011). [DOI] [PMC free article] [PubMed] [Google Scholar]
- 21.Baccin C. et al. Combined single-cell and spatial transcriptomics reveal the molecular, cellular and spatial bone marrow niche organization. Nat Cell Biol 22, 38–48 (2020). [DOI] [PMC free article] [PubMed] [Google Scholar]
- 22.Steinman L. Blocking adhesion molecules as therapy for multiple sclerosis: natalizumab. Nat Rev Drug Discov 4, 510–518 (2005). [DOI] [PubMed] [Google Scholar]
- 23.Vajkoczy P, Laschinger M. & Engelhardt B. α4-integrin-VCAM-1 binding mediates G protein–independent capture of encephalitogenic T cell blasts to CNS white matter microvessels. J Clin Invest 108, 557–565 (2001). [DOI] [PMC free article] [PubMed] [Google Scholar]
- 24.Ma Q, Ineichen BV, Detmar M. & Proulx ST Outflow of cerebrospinal fluid is predominantly through lymphatic vessels and is reduced in aged mice. Nat Commun 8, 1434 (2017). [DOI] [PMC free article] [PubMed] [Google Scholar]
- 25.Gu Z, Gu L, Eils R, Schlesner M. & Brors B. circlize implements and enhances circular visualization in R. Bioinformatics 30, 2811–2812 (2014). [DOI] [PubMed] [Google Scholar]
Associated Data
This section collects any data citations, data availability statements, or supplementary materials included in this article.
Supplementary Materials
Data Availability Statement
scRNA-seq data are available from Gene Expression Omnibus under accession number GSE184766. All data are available in the main text or the supplementary information files.


