Abstract
In the present study we synthesized conductive nanoscale [Ca24Al28O64]4+(4e−) (hereafter denoted as C12A7:e−) material, and reduced graphene oxide (rGO) was produced, which was unexpected; graphene oxide was removed after melting the sample. The conductivity of C12A7:e− composites synthesized at 1550 °C was 1.25 S cm−1, and the electron concentration was 5.5 × 1019 cm−3. The estimated BET specific surface area of the highly conductive sample was 20 m2 g−1. Pristine C12A7:e− electride was obtained by melting the composite powder, but the nano size of C12A7:e− particles could not be preserved; the value of conductivity was ∼28 S cm−1, electron concentration was ∼1.9 × 1021 cm−3, and mass density was 93%. For C12A7−xVx:e−, where x = 0.25 to 1, the conductivity improved to a maximum value of 40 S cm−1, and the electron density improved to ∼2.2 × 1021 cm−3; this enhancement in conductivity was also proposed by a theoretical study but lacked any associated experimental support.
A facile method to prepare pristine nanoscale mayenite electride is presented. The highest achieved conductivity of melted sample was ~28 S cm−1, with 93% mass density.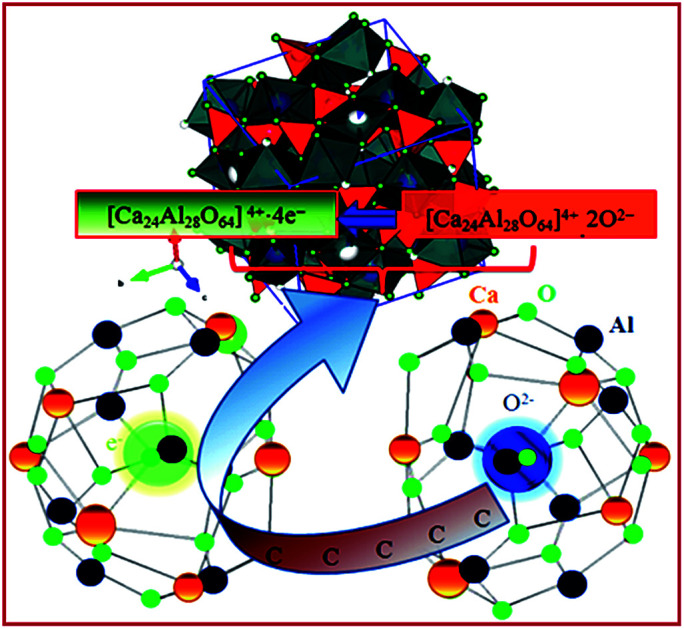
Introduction
Advances in device invention in all emerging fields with promising features and better control of material properties have permitted researchers to reveal and recognize the potential of existing materials in detail as well as to develop and explore new materials.1 There is an increasing demand for transition or post-transition metal-based transparent conductive oxides (TCOs), resulting in their increased costs. Therefore, many researchers2 have put their efforts on the low-cost abundant material oxymayenite (12CaO·7Al2O3) (Ca24Al28O66; hereafter, C12A7). Lacerda et al. were the first to introduce C12A7 as a high oxide conductor,3 and the belief that C12A7 has insulating properties changed in 2002 when Hayashi et al.2 reported for the first time its light-induced conversion into conducting mayenite, C12A7:e−. The inorganic clathrate compound C12A7:e− is light-weight, has a wide band gap (∼7 eV), and is a novel material among TCOs and electride family;4,5 a controllable way of obtaining electron gas can be found, and the conductivity from insulating nature till superconductive nature can be changed without loss of the fundamental cage framework structure.6,7 The important applications of the ubiquitous ceramic-based transparent conducting inorganic electride C12A7:e− make this novel, cheap, and environmentally friendly material more attractive. Since the discovery of the first room-temperature stable inorganic electride C12A7:e−, this material has attracted much attention due to its unique properties such as high electron concentration (∼2.3 × 1021 cm−3) and low work function (WF ∼ 2.4 eV).8 C12A7:e− has been utilized as a catalyst for ammonia synthesis/decomposition,9–11 activation and splitting of carbon dioxide,8 oxide ion conductivity,12–14 circuit of wires and electrodes,15 pinacol coupling reaction in aqueous media,16 and reforming of bio-oil;17 it has also been used as a prototype electronic conductor and chemical reducing agent for solvated electrons in alkali metal–ammonia solutions,7 in oxide fuel cells, as an oxidation catalyst or oxygen gas sensor,4 as a cathode material in fluorescent lamp,18 as a short-channel nano-wire transistor,19 electron emitter, and electron-injection layer in OLEDs, as a secondary electron emitter in a plasma display panel, and as a chemical reductant.20 Continuous improvements in its properties and applications are under way, but complexity of the previous synthesis processes of C12A7:e− has motivated many researchers towards developing direct simple synthesis routes because the previous methods were associated with high energy consumption, long synthesis time, lower surface area and most importantly, unsuitability for cation doping in C12A7:e−. Another important consideration is surface cage protection for which Ar+ sputtering with annealing at 1050 °C for <20 min (ref. 20) or ripped-thermal annealing (RTA) at 950 °C for 80 s are used,21 which improves surface conduction to a point but decreases the surface area.
The most important and interesting aspect of this research is the availability of access free cages in C12A7 unit cell, which increases the possibility of the storage of extra “extrinsic free oxygen” in the available empty cages in its unit cell.22 Hence, after reduction in doping in C12A7:e−, the extra electron, rather than that of the intrinsic electride (∼2.3 × 1023 cm−3), can be accommodated up to a maximum theoretical value of ∼6 × 1023 cm−3 and hence, the corresponding conductivity increases. Theoretical and experimental studies have been conducted for some of the cation substitutions in C12A7. Briefly, previously used conventional synthesis methods involving all types of doping caused a decrease in the electronic conductivity except Si-substitution, where the conductivity increased from 0.15 to 0.61 S cm−1 for x = 0 to 4.23 Therefore, this paper with respect to C12A7:e− electride is directed towards two challenges: designing and exploring a single step-based scalable facile approach to synthesize C12A7:e− electride nano-powders and boosting the electrical properties through doping with suitable valence cations.
Experimental strategy
Characterization methods
Possible chemical reactions during sintering were characterized using thermo gravimetric/differential thermal analyses (TG/DTA; Diamond Pyrix, Perkin Elmer, USA). X-ray powder diffraction (XRD) analysis was performed using a Bruker AXS D8 Advanced diffractometer (USA) with Cu Kα radiation source (λ = 0.15406 nm, 40 kV, 360 mA). Electrical conductivity was measured using the four probe method. Brunauer–Emmett–Teller (BET) specific surface areas and volume/width of the pores of the samples were characterized using an automatic specific surface area and pore physical adsorption analyzer (ASAP 2020, Micromeritic, USA) after heating the samples at 200 °C for 5 hours. A high resolution scanning electron microscope (HR-SEM, Hitachi-S4800, Japan) and a high resolution transmission electron microscope (HR-TEM, JEOL-2100, Japan) were used to study the microstructure and morphology of sintered powders. An X-ray photoelectron spectrometer (Thermo Scientific, VG Multilab 2000) was used for X-ray photoelectron spectroscopy (XPS) measurement with Al Kα radiation (hν = 1486.6 eV) under UHV (1.33 × 10⁻⁸ Pa). For wide and narrow scans, the energy resolutions were set to 0.5 eV and 0.05 eV, respectively. The analyzer pass energy was set to 20 eV for narrow scans. All peaks were calibrated by the carbon deposit C 1s binding energy at 284.8 eV. Finally, for the investigation and characterization of the structure of molecules and bonding of the graphitic materials, Raman spectroscopy was used. Raman spectra were obtained by excitation using a 532 nm air-cooled argon ion laser (20 mW).
Synthesis approach
Synthesis conditions and fabrication process strongly affect the final material properties. To synthesize C12A7:e−via a modified sol–gel-based synthesis method without using citric acid (CA), analytical grade starting materials Ca(NO3)2·4H2O and Al(NO3)3·9H2O were purchased from Aladdin/Shanghai, China, and they were used without further purification. First, metal nitrates were weighed using a specific molecular ratio (Ca(NO3)2·4H2O : Al(NO3)3·9H2O = 12 : 14) and then dissolved in ethylene glycol (C2H6O2, EG) at 60 °C to obtain a transparent solution. This solution was kept at about 100 °C for one hour to vaporize physically absorbed water and then, it was finally dried at 275 °C for 4 hours in an oven to vaporize extra EG and form the dried gel. The resulting yellowish dried foam-like gel was crushed into powder and further pulverized and heat-treated at 500 °C for 1 h in a nitrogen environment to decompose the metal nitrides. The product was again crushed into a fine powder and then divided into two parts: one part was pressed using an iso-static press system at 150 MPa to obtain a pellet shape (∼7.5 cm diameter), and the other part was directly used to get conductive powder. Finally, the resultant powder and pellets were sintered in an alumina crucible under a nitrogen atmosphere with a heating rate of 4 °C min−1, and the temperatures were maintained at 850 °C, 1250 °C, 1350 °C, and 1550 °C for 1 h. In the case of doping, the same synthesis procedure was repeated, and sources of “V” and “Si” were added to the precursors separately, with molar ratios x = 0.25, 0.50, 0.75, and 1.
Results and discussion
The synthesized C12A7:e− sample was then used for an initial investigation into its crystalline nanoparticles and bulk form by employing different experimental conditions based on the synthetic pathways from precursors to final conductive powder.
Thermo gravimetric and differential thermal (TG/DTA) analysis
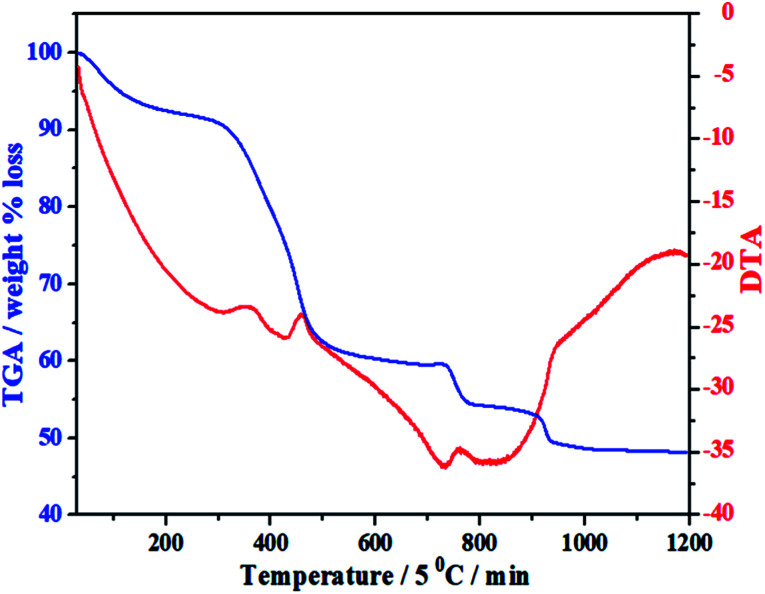
Under the guidance of the formation mechanism, the synthesized C12A7:e− powder is discussed in detail by using different experimental conditions based on the synthetic pathways from precursors to final conductive powder. Therefore, to know the basic physical and chemical changes in the material properties as a function of increasing temperature at a constant rate, TG/DTA of the gel was performed. Fig. 1 shows the TG/DTA curves of the as-prepared precursor gel; the measurement was performed in a nitrogen environment from 30 °C to 1200 °C. It was observed that there existed four major weight loss processes in this temperature range. The first weight loss was due to the removal of water in the gel system, which occurred at about 100 °C.24 The second clear continuous weight loss of about 35% up to 450 °C corresponded to the changes from nitrates to oxides and/or from absorbed EG to carbon. The heat treatments of the gels at 500 °C yielded decomposed ash (AS), which contained carbon as well as hydroxyl carbonate,25 as confirmed by the color of AS.26,27 Third, two small endothermic peaks were observed in the range of 750–930 °C accompanied by further weight loss of about 5%, as shown in the TG curve, suggesting complete decomposition of all meta-stable phases and the formation of C12A7 crystalline phase;26–28 the reduction process of C12A7 also started in this temperature range.26–28 On the other hand, a small extent of this small weight loss may also be due to some water loss; water formation at such a high temperature was caused due to OH− and O−2 in cages.9
Fig. 1. TG/DTA of mixed-milled nitrates xerox-gel.
The important point during this heat treatment process is that a distinct exothermic peak at 750 °C was obtained, which indicated the oxidization of carbon from incomplete combustion of EG;25 this oxidization of free carbon maybe because of the oxygen present in cages. The non-conductive property of the sample heated at ≤750 °C was observed because no distinct reduction occurred even the existence of carbon in sample. The sample heat-treated above this temperature had a distinct value of conductivity, which further increased with the increasing synthesis temperature under the same condition of applied environment and time.
X-ray powder diffraction (XRD) structural analysis
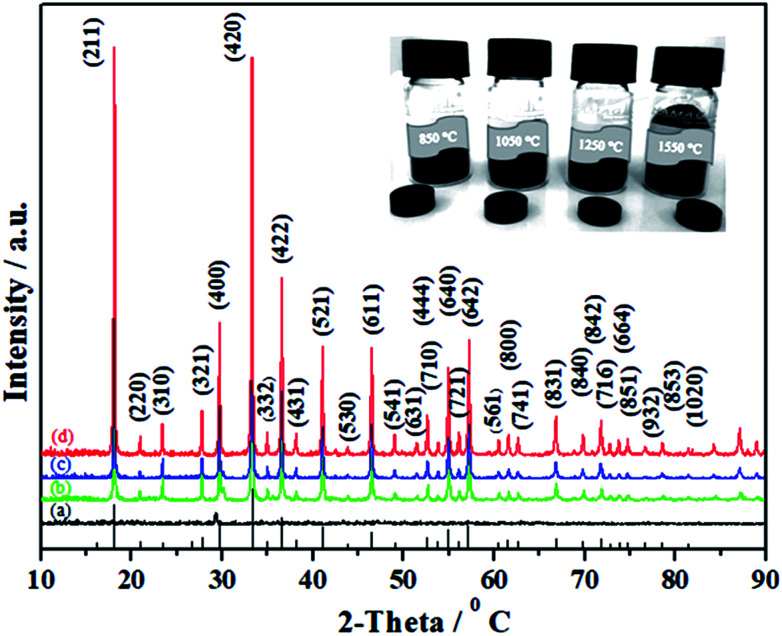
Taking into account the above-mentioned TG/DTA variation trend, we selected different synthesis temperatures and studied XRD patterns of the synthesized C12A7:e− phase. The gel was heat-treated at 500 °C for 1 h in a nitrogen environment, and it yielded dark-gray ash (AS), which was amorphous in nature and did not indicate any peaks of hydroxyl carbonate, hydroxyl and carbonate groups; it was also independent of decomposition either in a single step or in two steps.25 The C12A7:e− phase identification and crystallinity, based on XRD results, illustrated that the crystalline phase of C12A7:e− was observed first at about 1050 °C (Fig. 2).27 The samples treated at 1250 °C and 1550 °C showed well-resolved sharp peaks in the XRD pattern, which corresponded to the well-crystalline C12A7 phase (JCPDS, CAS # 48-1882).
Fig. 2. Powder XRD patterns of as-synthesized samples at (a) 850 °C, (b) 1050 °C, (c) 1250 °C, and (d) 1550 °C. For comparison, the lines on the x-axis correspond to the peak positions for the pure C12A7.
The reduction treatment changed the sample color from yellow gel to a gray ash and finally to a dark-black crystalline C12A7:e− single phase with increasing synthesis temperature for the same duration of treatment. Previously, it was reported that when the sample was heated to 1500 °C or higher than that, it decomposed to CaO·Al2O3 (CA) + 3CaO·Al2O3 (C3A) because the O2− ions in the framework tended to be removed at high temperatures, which led to the decomposition of C12A7 phase into a CA + C3A mixture; however, this was not observed here because of the presence of C22− ions.29,30 To understand the detailed structure and chemistry of the powders, Raman spectroscopy was used to characterize the residual carbon in the system.
Raman analysis
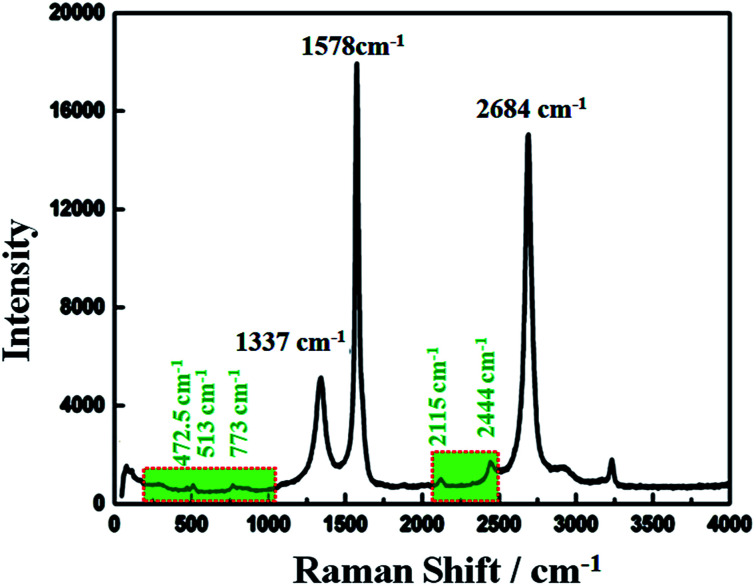
Raman spectroscopy has historical importance in the investigation and characterization of molecular structure and bonding, especially of the graphitic materials. Fig. 3 shows the obtained Raman spectra of the highly conductive C12A7:e− composite heat-treated at 1550 °C and excited with a laser of wavelength 532 nm. The highest intense G-band peak, assigned to sp2-hybridized carbon atoms, was observed at about 1578 cm−1 (G-mode), and another second intense 2D band peak was observed at 2684 cm−1 (2D-mode). It is believed that the intensity of the D-band peak is closely related to the defects (such as edges and ripples) present in graphene sheets, and this band was observed at about 1337 cm−1 (D-mode);31 this relatively low value of the D peak indicated less defects and good quality of the resulting rGO.32,33 Here, the ID/IG ratio was about 0.26, indicating some impurities and defects in the graphitized graphene structure,34 and this value was much lower than the typical value of 0.3–0.4 for polycrystalline N-doped graphene.35 However, here, we obtained a single, sharp 2D band peak for graphene.36
Fig. 3. Raman spectrum of C12A7:e− composite.
Raman bands located at 200–1000 cm−1 were obtained due to the lattice framework of C12A7, which was composed of tetrahedrally coordinated Al3+ ions. The peak between 1137 and 1164 cm−1, which was assigned as the O2− stretching mode, was not observed in the sample,37 indicating the reduction of C12A7 to C12A7:e−. The band at 1128 cm−1 assigned to the stretching mode of the extra O2− ion present in the framework was not observed here.38 The band peaks positioned at 546 cm−1 and 521 cm−1 corresponded to the CA phase, whereas the typical band peaks of the C3A phase observed at 756 cm−1 and 508 cm−1 were also not observed here, thereby confirming that there was no other phase formation.30 Therefore, the XRD patterns along with the Raman spectra showed that C12A7:e− pure phase, at all synthesis temperatures, whereas no decomposition to other phases of this family such as CA, pure C3A or mixed phases occurred. Therefore, the Raman spectra indicated the presence of the C12A7:e− species and the presence of rGO.
SEM- and TEM-based morphological study
The SEM analysis was conducted on the sample heated at 1550 °C, and images were collected at different magnifications (Fig. 4). The micrographs show randomly shaped particles of nanosized dimensions, but it was found that graphene was coated on these particles. Fig. 4 also shows EDS-based elemental mapping of the C12A7:e−–rGO composites. The element distribution maps revealed many interesting aspects. The intensity of each image is indicative of the signal intensity of each ion. In Fig. 4, Ca, Al, O and C particles are shown by different colors on the distribution maps. The results confirmed the almost expected theoretical contents of Ca, O, and Al with extra C content in the final sample, supporting Raman and XRD results.
Fig. 4. SEM images and elemental mapping obtained by EDX for C12A7:e− composites synthesized at 1550 °C.
For further explanation, we conducted TEM of the C12A7:e− composite powder. The TEM images showed isolates and uniform C12A7:e− nanosized particles with the average size of ca. 8–10 nm, without the aggregated precipitates (Fig. 5(a)). In Fig. 5(b), the d-spacing values corresponded to the well-defined diffraction planes of the C12A7 phase (JCPDS, CAS # 48-1882).
Fig. 5. TEM and HR-TEM images patterns of C12A7:e− composite synthesis at 1550 °C for 1 hour.
Electrical properties of C12A7:e− composite
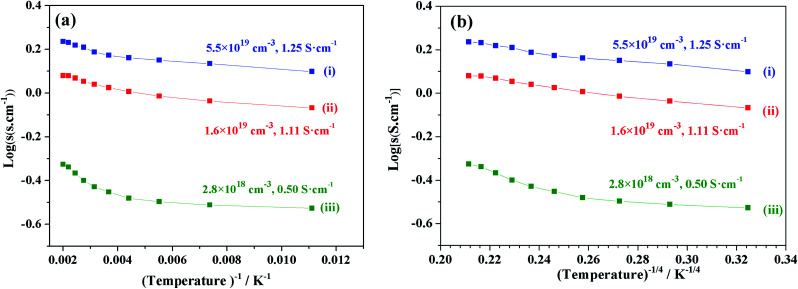
We focused on the variation in conductivity-temperature characteristics; therefore, the gel was pressed into a pellet form, and it was heated in an N2 gas atmosphere for 1 hour at 500 °C, 850 °C, 1050 °C, 1250 °C, and 1550 °C (Fig. 6). The conductivity was measured using Pt electrodes in a 4-probe configuration, with variable temperatures ranging from 90 K to 500 K (Fig. 6). Samples heat-treated at temperatures below 850 °C also had no prominent conductivity. We tested the conductivity of samples synthesized at 1050 °C, 1250 °C, and 1550 °C, where the electron concentrations of the samples were 2.8 × 1018 cm−3, 1.6 × 1019 cm−3, and 5.5 × 1019 cm−3 and the conductivities were about 0.5 S cm−1, 1.11 S cm−1 and 1.25 S cm−1, respectively. At a synthesis temperature range of 900–1300 °C, water uptake occurred, and it caused a decrease in conductivity. Therefore, an abrupt increase in conductivity at a temperature of about 1550 °C occurred.12,39
Fig. 6. log(σ) vs. temperature (T−1, T−4) of sample synthesis at (i) 1550 °C, (ii) 1250 °C, and (iii) 1050 °C.
BET-based specific surface area and pore size/volume measurement
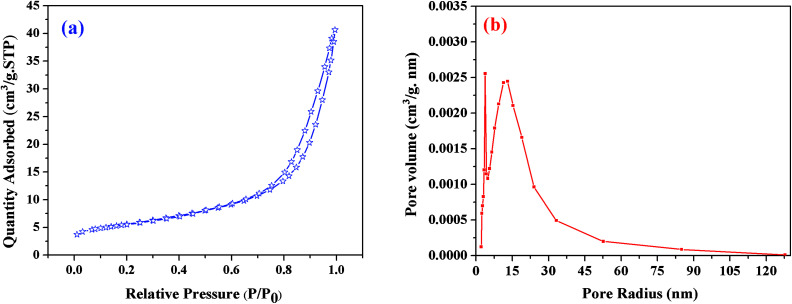
BET theory is based on the physical adsorption–desorption of gas molecules on a solid surface by which the specific surface area of that material is calculated. The estimated BET specific surface area of the resulting sample heat-treated at 1550 °C was about 20 m2 g−1; Fig. 7(a) shows its N2 adsorption–desorption profiles, where P is the partial pressure of the adsorbate and Po is the saturated vapor pressure of the adsorbent. According to the IUPAC classification, the N2 isotherm is a type-III isotherm, and the higher N2 adsorption confirmed the higher specific surface area of this sample.40 The pore size distribution was calculated using the BJH method (Fig. 7(b)). The results revealed that the C12A7:e− composite showed a sharp peak at about 2.7 nm, and another peak was observed at about 15 nm, suggesting that the sample possessed almost uniform pore size distributions of about 2.7 and 15 nm. This optimized sol–gel method is extremely valuable for the synthesis of C12A7:e− because the out-diffusion of the free oxygen ions from C12A7 is not blocked in any way, and if the carbon layer completely covers the sample powder surface, this will further enhance the reduction process.
Fig. 7. (a) BJH pore size distributions, (b) N2 adsorption/desorption isotherms of C12A7:e− composite (1550 °C, 1 h).
V-doped C12A7:e−
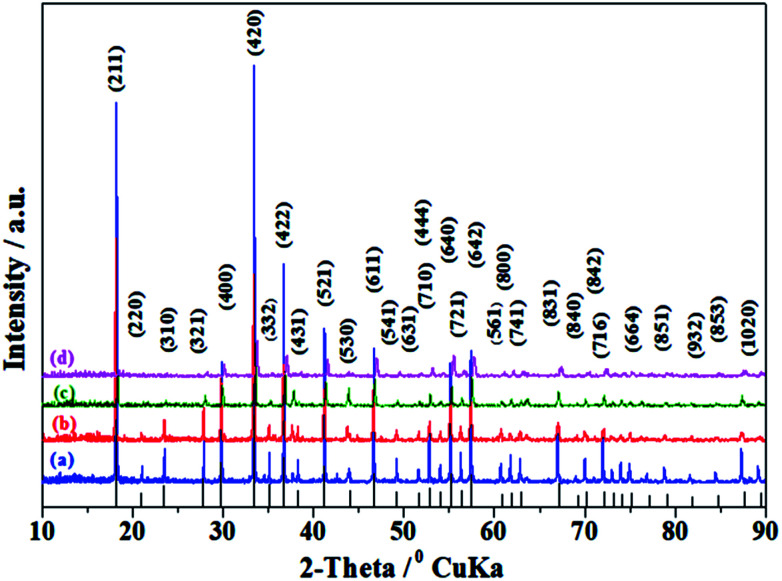
The XRD patterns of C12A7−xVx:e− samples, where x = 0.25 to 1 (hereafter, V-doped C12A7:e−), are shown in Fig. 8. Most of the peaks corresponded to the well-crystalline C12A7 phase (JCPDS, CAS # 48-1882), and the existence of any second impurity phase of the CaO or Al2O3 family was not observed. With the increasing doping level, the crystallinity decreased; the samples with higher doping level, approximately more than the doping level of x = 1.5, showed a completely amorphous nature, with an increasing trend in conductivity.
Fig. 8. XRD of C12A7−xVx:e−, where x = (a) 1, (b) 0.75, (c) 0.50, (d) 0.25, heated at 1550 °C for 1 h. The lines on the x-axis correspond to the peak positions for pure C12A7.
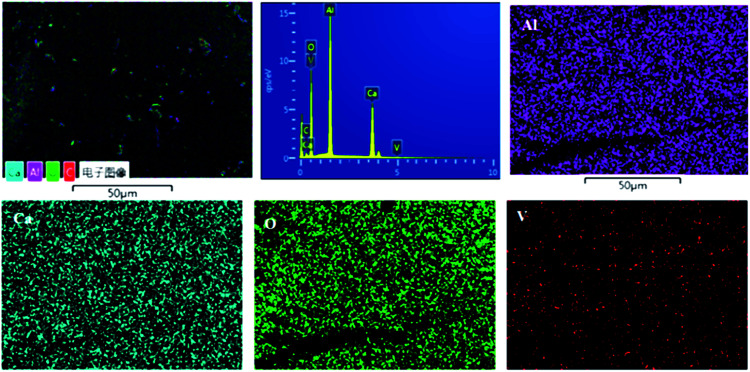
Fig. S1† shows the SEM graph of the melted V-doped C12A7:e− sample heat-treated at 1550 °C in an N2 atmosphere; a very dense surface of the sample was observed, and we also crushed it into particles for further characterizations. To further obtain more information about the distribution characteristics of the main metal elements, SEM associated with EDX techniques were used for the morphological study. Fig. 9 shows the compositional mapping obtained by EDS microanalysis conducted at the sample surface, where Ca, Al, O and V particles are shown by different colors on the distribution maps. Our results for the final sample very closely matched the theoretical values for the contents of Ca, O, V and Al. On the basis of the EDS mappings, we concluded that all the expected elements with probable contents were available and uniformly distributed on the surface of the final material.
Fig. 9. Elemental mapping obtained by EDX for C12A7−xVx:e−, where x = 1.
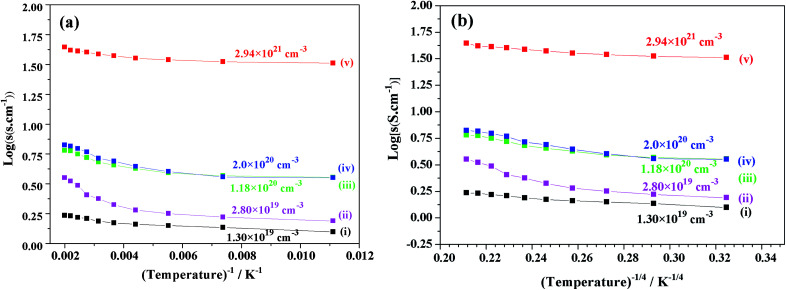
Fig. 10 shows the plots of the log(σ) vs. temperature (T−1, T−1/4 (K)) of V-doped C12A7:e− samples synthesized at 1550 °C for 1 hour. After doping with V for different doping values (x = 0.25, 0.50, 0.75, and 1), the conductivity increased to a maximum value of about 40 S cm−1 at 300 K. For the highly conductive sample synthesized at 1550 °C, log(σ) was almost constant, demonstrating that V doped-C12A7:e− with the doping level of x = 1 behaved like a metallic conductor. At the same time, increasing the doping level led to increase in electron concentrations with the values of 1.30 × 1019 cm−3, 2.80 × 1019 cm−3, 1.18 × 1020 cm−3 and 2.2 × 1021 cm−3.
Fig. 10. Graph between log(σ) (σ, conductivity) and temperature (T−1, T−1/4 (K)) for C12A7−xVx:e− samples synthesized with different V-doping levels, x = (i) 0, (ii) 0.25, (iii) 0.50, (iv) 0.75 and (v)1.
Hence, the results showed that the increase in the conductivity of V-doped samples was because of the increase in carrier concentration, which introduced new energy states, and this was suggested by theoretical calculations based on the DFT data.22 For further studying the stability and removal of rGO in our samples after melting, we used RAMAN spectroscopy.
Raman spectra of melted pristine C12A7:e− and V-doped C12A7:e−
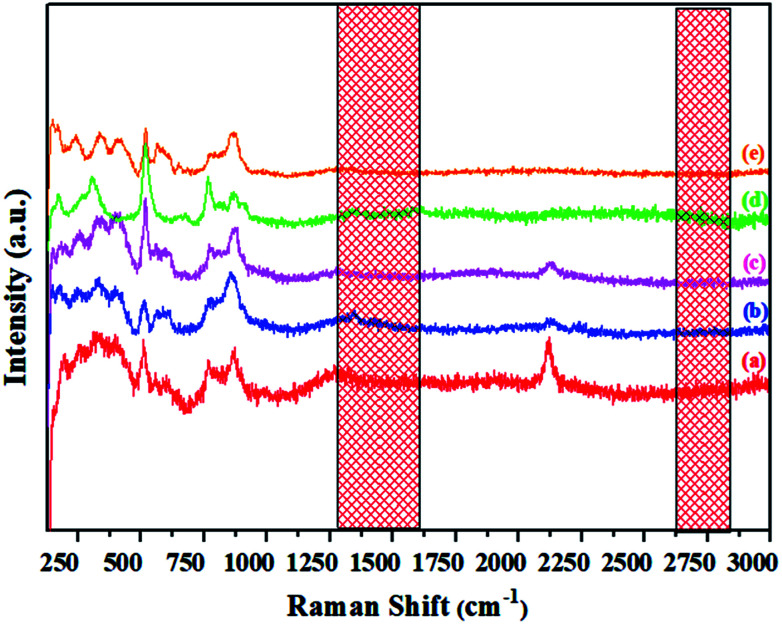
Raman spectra of the synthesized materials, shown in Fig. 11, indicate the distinct difference between the powdered electride and the molten electride. The bands at about 1340 cm−1 and 1560 cm−1 were assigned to the carbon family, which disappeared after melting; this implied that rGO was only stable in the powdered form of the crystallized C12A7:e−, and it was released from the material during the cooling process after melting the samples. Similarly, in case of V-doped C12A7:e−, all of the samples showed rGO-free phase. For further elemental analysis and bonding, we studied XPS of the highly conductive V-doped C12A7:e− sample and compared it with the undoped sample under the same conditions.
Fig. 11. Raman spectra of the molten C12A7−xVx:e− where x = (a) 0.25 V, (b) 0.50 V, (c) 0.75 V, (d) 1 V, (e) 1.5 V.
X-ray photoelectron spectroscopy (XPS)
To further improve our understanding of cation doping and its effect on the final properties of C12A7:e−, XPS measurements were carried out. The wide-scan XPS data of the C12A7:e− powders are provided in Fig. 12, and it shows the XPS core level peak spectrum of C12A7:e−, in which Ca, Al, and O can be detected. The stoichiometry was confirmed to be consistent with that of C12A7:e−, as calculated from Ca 2p, Al 2p and O 1s peak areas. Also, clear V 2p and V 2s peaks were present in the V-doped C12A7:e− powder sample.
Fig. 12. XPS survey spectra of melted material.
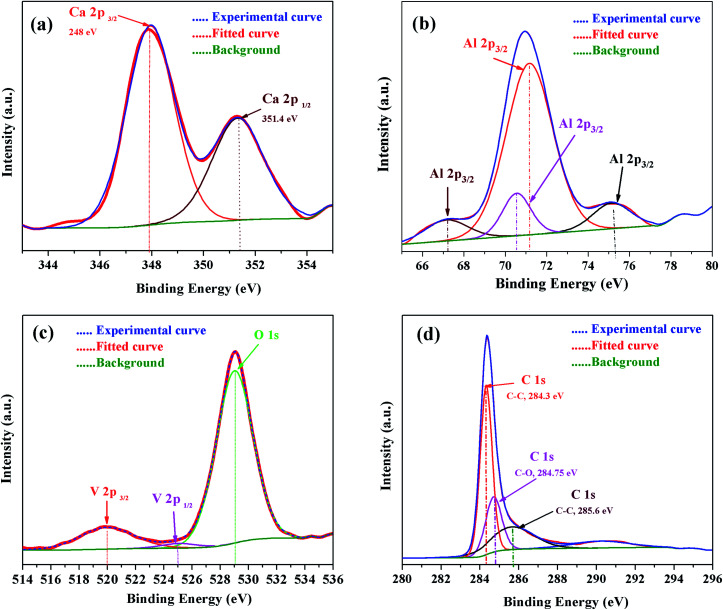
For further confirmation, the XPS spectra of individual elements, i.e., Ca 2p, Al 2p, O 1s and C 1s were obtained (Fig. 13). The Ca 2p narrow XPS spectrum (Fig. 13 (a)) had two peaks at around 352.197 eV and 348.544 eV, which were related to Ca 2p1/2 and Ca 2p3/2, respectively. Due to spin orbit splitting, Ca 2p XPS spectrum exhibited two clearly distinguishable peaks. The narrow and sharp peaks indicated that Ca was connected to O.41 The Al 2p XPS spectra in Fig. 13(b) exhibited peak positions at around 75.473 eV, which indicated that the valence state of Al in C12A7 is the same as that of Al2O3. Thus, we can conclude that only Ca–O bonds and Al–O bonds exist in C12A7:e−. The O 1s spectrum in Fig. 13(c) can be clearly deconvoluted into two distinct contributions, with peaks at around 531.99 eV and 533.421 eV. The high energy component was assigned to bridging oxygen (BO) atoms, whereas the low energy component was assigned to non-bridging oxygen (NBO) atoms.41 Small peaks of V 2p3/2 and V 2p1/2 were also clearly observed. Hence, the V-doping in C12A7:e− was clearly observed. Hence, it is clear from all these XPS results that the reduction process does not decompose the C12A7:e− phase into other CaO and Al2O3 phases; for the first time, we have successfully developed a technique that is suitable for the synthesis of pristine as well as cation-doped C12A7:e−.
Fig. 13. XPS survey spectra of V-doped C12A7:e−, (a) Ca 2p, (b) Al 2p, (c) V 2p & O 1s and (d) C 1s.
Conclusion
Herein, we presented a general strategy and provided the first demonstration of straightforward synthesis of novel nanocrystalline C12A7:e− without the limitations of type, shape, and size and without the formation of byproducts on the surface of the final C12A7:e− samples, which can stop the reduction process; we used low-cost precursors, namely, Ca(NO3)2·4H2O and Al(NO3)3·9H2O, and we also employed a very simple, cheap, and optimized sol–gel method. Stable phase of mayenite electride is acheived, which is because of the C22− template anions instead of O2− anions in inert gas atmosphere at such a high temperature, which also contributed to the reduction process. For the first time, we successfully applied this method for the rapid synthesis of nanosized C12A7:e− composite, pristine C12A7:e− electride, and Si as well as V-doped C12A7:e−. The maximum specific surface area value of the C12A7:e− composites was about 20 m2 g−1, with maximum electrical conductivity of about 1.25 S cm−1 and electron concentration of 5.5 × 1019 cm−3. Consequently, the electrical conductivity was further improved to a maximum value of 40 S cm−1 by V-doping, with electron concentration of 2.2 × 1021 cm−3. Nevertheless, the composite, pure, and doped C12A7:e− electride samples exhibited good electrical properties, and the formation of reduced graphene in such a process without using the normally used graphene sources may be beneficial in related fields for the fabrication of highly crystalline rGO having fewer defects.33,42,43
Conflicts of interest
The authors declare no conflict of interest.
Supplementary Material
Acknowledgments
Financial supports from Natural Science Foundation of China (NSFC) (Grant No.: 61275043, 61307048, and 61171006).
Electronic supplementary information (ESI) available. See DOI: 10.1039/c8ra02790k
References
- Huang J. Valenzano L. Sant G. Framework and Channel Modifications in Mayenite (12CaO•7Al2O3) Nanocages By Cationic Doping. Chem. Mater. 2015;27:4731–4741. doi: 10.1021/acs.chemmater.5b01360. [DOI] [Google Scholar]
- Hayashi K. Matsuishi S. Kamiya T. Hirano M. Hosono H. Light-induced conversion of an insulating refractory oxide into a persistent electronic conductor. Nature. 2002;419:462–465. doi: 10.1038/nature01053. [DOI] [PubMed] [Google Scholar]
- Lacerda M. Irvine J. T. S. Glasser F. P. West A. R. High oxide ion conductivity in Ca12Al14O33. Nature. 1988;332:525–526. doi: 10.1038/332525a0. [DOI] [Google Scholar]
- Ebbinghaus S. G. Krause H. Syrowatka F. Floating Zone Growth of Large and Defect-free Ca12Al14O33 Single Crystals. J. Am. Chem. Soc. 2013;13:2990–2994. [Google Scholar]
- Palacios L. Torre A. G. D. L. Bruque S. ˜oz JL Ga-M. ´a-Granda S. G. Sheptyakov D. et al., Crystal Structures and in-Situ Formation Study of Mayenite Electrides. Inorg. Chem. 2007;46(10):4167–4176. doi: 10.1021/ic0700497. [DOI] [PubMed] [Google Scholar]
- Sushko P. V. Shluger A. L. Hirano M. Hosono H. From Insulator to Electride: A Theoretical Model of Nanoporous Oxide 12CaO.7Al2O3. J. Am. Chem. Soc. 2007;129:942–951. doi: 10.1021/ja066177w. [DOI] [PubMed] [Google Scholar]
- Kim S. W. Shimoyama T. Hosono H. Solvated Electrons in High-Temperature Melts and Glasses of the Room-Temperature Stable Electride [Ca24Al28O64] 4+ 4e−. Science. 2011;333:71–74. doi: 10.1126/science.1204394. [DOI] [PubMed] [Google Scholar]
- Toda Y. Hirayama H. Kuganathan N. Torrisi A. Sushko P. V. Hosono H. Activation and splitting of carbon dioxide on the surface of an inorganic electride material. Nat. Commun. 2013:1–8. doi: 10.1038/ncomms3378. [DOI] [PMC free article] [PubMed] [Google Scholar]
- Inoue Y. Kitano M. Kim S.-W. Yokoyama T. Hara M. Hosono H. Highly Dispersed Ru on Electride [Ca24Al28O64]4+(e−)4 as a Catalyst for Ammonia Synthesis. ACS Catal. 2014;4:674–680. doi: 10.1021/cs401044a. [DOI] [Google Scholar]
- Kitano M. Inoue Y. Yamazaki Y. Hayashi F. Kanbara S. Matsuishi S. et al., Ammonia synthesis using a stable electride as an electron donor and reversible hydrogen store. Nat. Chem. 2012;4:934–940. doi: 10.1038/nchem.1476. [DOI] [PubMed] [Google Scholar]
- Honkala K. Hellman A. Remediakis I. N. Logadottir A. Carlsson A. Dahl S. et al., Ammonia Synthesis from First-Principles Calculations. Science. 2005;307:555–558. doi: 10.1126/science.1106435. [DOI] [PubMed] [Google Scholar]
- Lacerda M. Irvine J. T. S. Glasser F. P. West A. R. High oxide ion conductivity in Ca12Al14O33. Nature. 1988;332:525–526. doi: 10.1038/332525a0. [DOI] [Google Scholar]
- Lacerda M. Irvine J. T. S. Glasser F. P. West A. R. High oxide ion conductivity in Ca12Al14O33. Nature. 1988;332(7):525–526. doi: 10.1038/332525a0. [DOI] [Google Scholar]
- Hosono H. Hayashi K. Kajihara K. Sushko P. V. Shluger A. L. Oxygen ion conduction in 12CaO·7Al2O3:O2− conduction mechanism and possibility of O− fast conduction. Solid State Ionics. 2009;180:550–555. doi: 10.1016/j.ssi.2008.10.015. [DOI] [Google Scholar]
- Hayashi K. Matsuishi S. Kamiya T. Hirano M. Hosono H. Light-induced conversion of an insulating refractory oxide into a persistent electronic conductor. Nature. 2002;419:462–465. doi: 10.1038/nature01053. [DOI] [PubMed] [Google Scholar]
- Buchammagari H. Toda Y. Hirano M. Hosono H. Takeuchi D. Osakada K. Room Temperature-Stable Electride as a Synthetic Organic Reagent: Application to Pinacol Coupling Reaction in Aqueous Media. Org. Lett. 2007;9(21):4287–4289. doi: 10.1021/ol701885p. [DOI] [PubMed] [Google Scholar]
- Wang Z. Pan Y. Dong T. Zhu X. Kan T. Yuan L. et al., Production of hydrogen from catalytic steam reforming of bio-oil using C12A7.O- based catalysts. Appl. Catal., A. 2007;320:24–34. doi: 10.1016/j.apcata.2006.12.003. [DOI] [Google Scholar]
- Watanabe S. Watanabe T. Ito K. Miyakawa N. Ito S. Hosono H. et al., Secondary electron emission and glow discharge properties of 12CaO·7Al2O3 electride for fluorescent lamp applications. Sci. Technol. Adv. Mater. 2011;12:1–8. doi: 10.1088/1468-6996/12/3/034410. [DOI] [PMC free article] [PubMed] [Google Scholar]
- Nishioa Y. Nomurab K. Yanagi H. Kamiyaa T. Hiranob M. Hosono H. Short-channel nanowire transistor using a nanoporous crystal semiconductor 12CaO·7Al2O3. J. Mater. Sci. Eng. B. 2010;173:37–40. doi: 10.1016/j.mseb.2009.12.018. [DOI] [Google Scholar]
- Toda Y. Kubota Y. Hirano M. Hirayama H. Hosono H. Surface of Room-Temperature-Stable Electride [Ca24Al28O64]4+(e−)4: Preparation and Its Characterization by Atomic-Resolution Scanning Tunneling Microscopy. ACS Nano. 2011;5(3):1907–1914. doi: 10.1021/nn102839k. [DOI] [PubMed] [Google Scholar]
- Hayashi F. Kitano M. Yokoyama T. Hara M. Hosono H. Surface Treatment for Conductive 12CaO·7Al2O3 Electride Powder by Rapid Thermal Annealing Processing and Its Application to Ammonia Synthesis. ChemCatChem. 2014;6:1317–1323. [Google Scholar]
- Huang J. Valenzano L. Sant G. Framework and Channel Modifications in Mayenite (12CaO·7Al2O3) Nanocages By Cationic Doping. Chem. Mater. 2015;27:4731–4741. doi: 10.1021/acs.chemmater.5b01360. [DOI] [Google Scholar]
- MIBaTO M. Enhanced electronic conductivity in Si-substituted calcium aluminate. J. Appl. Phys. 2007;102:113704-1–113704-7. [Google Scholar]
- Dong Y. Hayashi K. Nozoe H. Shinoda Y. Hosono H. Chloride-Ion-Stabilized Strontium Mayenite: Expansion of Versatile Material Family. J. Am. Ceram. Soc. 2014;97(12):4037–4044. doi: 10.1111/jace.13194. [DOI] [Google Scholar]
- Li J. Pan Y. Qiu F. Wu Y. Guo J. Nanostructured Nd:YAG powders via gel combustion: The influence of citrate-to-nitrate ratio. Ceram. Int. 2008;34:141–149. doi: 10.1016/j.ceramint.2006.09.002. [DOI] [Google Scholar]
- Li C. Hirabayashi D. Suzuki K. Synthesis of higher surface area mayenite by hydrothermal method. Mater. Res. Bull. 2011;46:1307–1310. doi: 10.1016/j.materresbull.2011.03.023. [DOI] [Google Scholar]
- Ude S. N. Rawna C. J. Peascoe R. A. Kirkhamc M. J. Jones G. L. Payzant E. A. High temperature X-ray studies of mayenite synthesized using the citrate sol–gel method. Ceram. Int. 2014;40:1117–1123. doi: 10.1016/j.ceramint.2013.06.112. [DOI] [Google Scholar]
- Matsuyam Y. Hori M. Wakiya N. Suzuki H. Solution derived 12CaO·7Al2O3 thin films on MgO(1 0 0) substrate. J. Mater. Sci. Eng. B. 2010;173:21–24. doi: 10.1016/j.mseb.2010.02.014. [DOI] [Google Scholar]
- Kim S. W. Hosono H. Synthesis and properties of 12CaO.7Al2O3 electride: review of single crystal and thin film growth. Philos. Mag. 2012;92(19–21):2596–2628. doi: 10.1080/14786435.2012.685770. [DOI] [Google Scholar]
- Zou W. Khan K. Zhao X. Zhu C. Huang J. Li J. et al., Direct Fabrication of C12A7 Electride Target and Room Temperature Deposition of Thin Films with Low Work Function. Mater. Res. Express. 2017;4(3):1–20. [Google Scholar]
- Dai W. Yu J. Wang Y. Song Y. Alam F. E. Nishimura K. et al., Enhanced thermal conductivity for polyimide composites with a three-dimensional silicon carbide nanowire@graphene sheets filler. J. Mater. Chem. A. 2015;3:4884–4891. doi: 10.1039/C4TA06417H. [DOI] [Google Scholar]
- Khan K. Tareen A. K. Elshahat S. Yadav A. Khan U. Yang M. et al., Facile synthesis of cationic doped [Ca24Al28O64]4+. (4e−) composite via rapid citrate sol-gel method. Dalton Trans. 2018;47:3819–3830. doi: 10.1039/C7DT04543C. [DOI] [PubMed] [Google Scholar]
- Kim K. S. Zhao Y. Jang H. Lee S. Y. Kim J. M. Kim K. S. et al., Large-scale pattern growth of graphene films for stretchable transparent electrodes. Nature. 2009;457:706–710. doi: 10.1038/nature07719. [DOI] [PubMed] [Google Scholar]
- Lin C.-T. Chen W.-C. Yen M.-Y. Wang L.-S. Lee C.-Y. Chin T.-S. et al., Cone-stacked carbon nanofibers with cone angle increasing along the longitudinal axis. Carbon. 2007;45:411–415. doi: 10.1016/j.carbon.2006.09.002. [DOI] [Google Scholar]
- Xue Y. Wu B. Jiang L. Guo Y. Huang L. Chen J. et al., Low Temperature Growth of Highly Nitrogen-Doped Single Crystal Graphene Arrays by Chemical Vapor Deposition. J. Am. Chem. Soc. 2012;134:11060–11063. doi: 10.1021/ja302483t. [DOI] [PubMed] [Google Scholar]
- Ferrari A. C. Meyer J. C. Scardaci V. Casiraghi C. Lazzeri M. Mauri F. et al., Raman Spectrum of Graphene and Graphene Layers. Phys. Rev. Lett. 2006;97:187401. doi: 10.1103/PhysRevLett.97.187401. [DOI] [PubMed] [Google Scholar]
- Yin Y. Jia Z. Mu W. Gao Z. Zhang J. Tao X. Mechanism of Surface Cracking in a Ca12Al14O33 Crystal during the Cooling Process. Cryst. Growth Des. 2016:1903–1906. doi: 10.1021/acs.cgd.5b01414. [DOI] [Google Scholar]
- Dong Y. Hosono H. Hayashi K. Formation and quantification of peroxide anions in nanocages of 12CaO.7Al2O3. RSC Adv. 2013;3:18311–18316. doi: 10.1039/C3RA42521E. [DOI] [Google Scholar]
- Kim S. W. Matsuishi S. Nomura T. Kubota Y. Takata M. Hayashi K. et al., Metallic State in a Lime–Alumina Compound with Nanoporous Structure. Nano Lett. 2007;7(5):1138–1143. doi: 10.1021/nl062717b. [DOI] [PubMed] [Google Scholar]
- Ranjbar A. Rezaei M. Low temperature synthesis of nanocrystalline calcium aluminate compounds with surfactant-assisted precipitation method. Adv. Powder Technol. 2013:1–5. [Google Scholar]
- Pan R. K. Feng S. Tao H. Z. XPS and NMR analysis on 12CaO·7Al2O3. IOP Conf Series: Materials Science and Engineering. 2017;167:012017. doi: 10.1088/1757-899X/167/1/012017. [DOI] [Google Scholar]
- Medina H. Lin Y.-C. Jin C. Lu C.-C. Yeh C.-H. Huang K.-P. et al., Metal-Free Growth of Nanographene on Silicon Oxides for Transparent Conducting Applications. Adv. Funct. Mater. 2012;22:2123–2128. doi: 10.1002/adfm.201102423. [DOI] [Google Scholar]
- Shan C. Tang H. Wong T. He L. Lee S.-T. Facile Synthesis of a Large Quantity of Graphene by Chemical Vapor Deposition: an Advanced Catalyst Carrier. Adv. Mater. 2012;24:2491–2495. doi: 10.1002/adma.201200480. [DOI] [PubMed] [Google Scholar]
Associated Data
This section collects any data citations, data availability statements, or supplementary materials included in this article.


