Abstract
Semiconductor photocatalysis could be an effective means to combat nitrogen oxides (NOx) based air pollution through mineralisation of NOx to nitrate. However, most of the typically TiO2-based catalysts employed show a much higher reactivity towards NO than NO2, leading to an accumulation of this unwanted and toxic intermediate. By grafting the photocatalyst with small amounts (≤0.1 at%) of isolated iron(iii) ions, the reactivity towards NO2 is increased by the factor of 9, bringing it up to par with the NO-reactivity and alleviating the problem with intermediate accumulation. Consequently, the observed selectivity of the reaction is dramatically increased from less than 40% to more than 90%. The paper also discusses possible mechanisms for this very beneficial behavior.
By grafting small amounts of iron ions onto TiO2, the rate of photocatalytic oxidation of NO2 is increased by a factor of 9.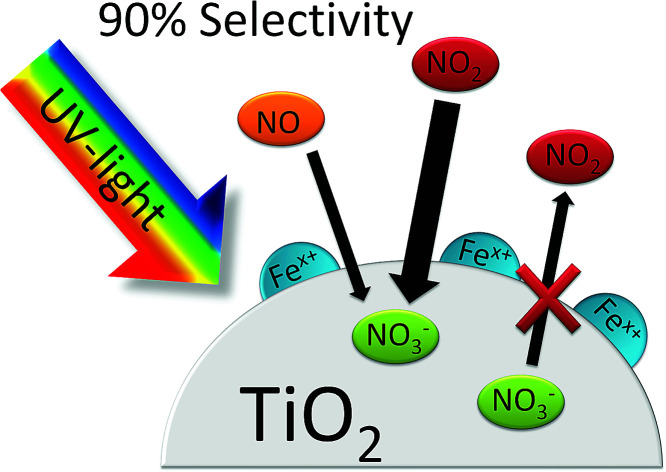
1. Introduction
The air we breathe is one of our most precious resources. However, it is contaminated with many different harmful substances such as ozone, volatile organic compounds (VOCs) and nitrogen oxides (NOx) which are endangering our health and the ecological system. Nitrogen dioxide (NO2) in particular has been the focus of new environmental legislations, like the directive 2008/50/EC of the European Union, aimed at minimizing its emissions. However, the imposed limits are frequently exceeded in many European cities.1,2 Some sampling stations even register concentrations as high as 80 μg m−3, twice the allowed value of 40 μg m−3 NO2.3 The chosen actions to achieve the target values, namely low emission zones, forbidden areas for heavy vehicles or more strict emission values for vehicles have had only negligible effects on the concentration of NO2 in recent years.1,4
Even though the main parts of the emissions are generated through high temperature processes of anthropogenic nature, i.e. combustion engines, gas- or oil based heating systems and industrial furnaces,5 the direct reduction at the emission source appears more difficult than anticipated.6 Semiconductor photocatalysis is a process with the potential of oxidizing NOx and other air pollutants independently on their source.7 In addition, it needs neither maintenance nor external reagents; it requires only sunlight, water in the form of rain and molecular oxygen which are already present in the outdoor environment. The process is based on the generation of electron/hole pairs on the semiconductor after absorption of photons with suitable energy, i.e. at least equal to the semiconductor band gap, eqn (1). In case of the commonly used TiO2, this requires UVA light, but it has recently been proposed that visible light might also induce the reaction through NO–TiO2 surface complexes.8 Providing that electron/hole pairs do not recombine, they can further react to form highly reactive oxygen species (ROS) such as hydroperoxyl radicals (HO2·), eqn (2) and (3), and hydroxyl radicals (·OH), eqn (4).9
 |
1 |
| O2 + eCB− → O2·− | 2 |
| O2·− + H+ → HO2· | 3 |
| H2O + hVB+ → ·OH + H+ | 4 |
NO can be oxidized to NO2 either in a two-step process via nitrous acid (HONO) with hydroxyl radicals, eqn (5) and (6), or with hydroperoxyl radicals via peroxynitrous acid (HOONO) and subsequent decomposition, eqn (7) and (8), the latter being the predominant one.10 NO2 can also be further oxidized with a hydroxyl radical to form nitrate or nitric acid, eqn (9).11–13
| NO + ·OH → HONO | 5 |
| HONO + ·OH → NO2 + H2O | 6 |
| NO + HO2· → HOONO | 7 |
| HOONO → NO2 + ·OH | 8 |
| NO2 + ·OH → HONO2 | 9 |
One of the main challenges for this technology remains the poor selectivity of the reaction with respect to the desired product, i.e. nitrate. As mentioned above, during the oxidation of NO, nitrous acid (HONO) and nitrogen dioxide (NO2) are formed as intermediates of the reaction, which may be desorbed and released in the process. As these are both more toxic than NO, this needs to be avoided at all cost to guarantee an improvement in the air quality.13 While HONO was only detected in small amounts during photocatalytic oxidation of NO, NO2 is often observed to be a major product.10,13,14 The selectivity towards the target product nitrate is often observed to be only as low as about 30% in typical laboratory tests.13 This is also observed in some of the real-world testing sites, which report a significant reduction in the NO level but almost no change in the NO2 levels.15,16 While there were some recent reports on progress in developing more selective photocatalysts for this application, this challenge remains far from being solved.13,17–21
Both the poor kinetics of NO2 oxidation as well as the back-reaction of already formed nitrate have been identified as causes for the low selectivity.22,23 As has already been outlined in one of our earlier publications,22 the introduction of oxygen reduction enhancing co-catalysts onto the surface of TiO2 should prevent re-reduction of already formed nitrate and thereby increase the observed selectivity.22 This effect should be especially significant at high nitrate coverages, i.e., after longer times of operation. One method to achieve this is by grafting small concentrations of metal ions such as Fe or Cu onto the titanium dioxide.24–27 Amongst other properties, these materials were reported to exhibit strongly increased oxygen reduction capabilities.28 However, the performance of these materials in photocatalytic NOx-abatement was never reported.
Therefore, in order to validate our hypothesis, we synthesized iron-grafted titanium dioxide materials and subjected them to intensive testing in photocatalytic NOx-abatement.
2. Experimental
2.1. Synthesis of Fe-grafted TiO2
The photocatalyst powders of Aeroxide P25 (Evonik), iron(iii)chloride hexahydrate (Alfa Aesar) and hydrochloric acid (Merck) were used as received. Water used in the syntheses always refers to deionized water (>10 mΩ cm).
A method developed by Irie et al.29 was adopted for the preparation of the iron grafted materials. In a typical synthesis, 100 g L−1 TiO2 were suspended in an iron(iii) chloride solution acidified to a pH value of 2 by hydrochloric acid. The iron concentration of the solution reflected the desired concentration on the photocatalyst. The suspension was stirred at 90 °C in a sealed reactor for 1 h, filtered and washed with copious amounts of water after cooling down to room temperature. The resulting material was dried at 110 °C for 24 h and finally ground in an agate mortar.
An aliquot of the filtrate was analyzed by ICP-MS (Thermo Fisher, iCAP Q) to calculate the concentration of grafted metal of the catalysis surface. For this, the difference of the total added and the not adsorbed and washed off amount was used. The ‘washed’ samples were prepared analogously, just without adding any iron salt. The specific surface area (BET) and pore volume of the powder samples were measured on an Autosorb iQ (Quantachrome).
2.2. NO oxidation
The NO abatement experiments were done in a setup according to the ISO standard 22197-1.30 All tubing and connections were made of polymers to avoid metal surfaces which could catalytically convert NOx. The nitrogen monoxide gas was supplied as a concentrated mixture. The NO gas stream was diluted by a dry and a wet synthetic air steam and made up to about 1 ppm NO, 3 L min−1 flow rate and 50% relative humidity. This test gas mixture was passed through the photocatalytic reactor made out of PEEK which comprises a sample holder with the dimensions of 5 × 10 cm2. In this holder approximately 2.8 g of the photocatalyst were uniformly dispersed and slightly pressed in with a flat plunger to form a flat uniform surface. The sample is illuminated from above through a UVA transparent cover glass by a UVA-LED-array (Omicron Laserage Laserprodukte GmbH, Germany) which is calibrated to deliver 365 nm light with 10 W m−2 intensity at the sample surface. The gas steam is passed above the sample through a 5 mm high slit that is regularly reduced to 1 mm by turbulence barriers to improve mass transport (see Ifang et al.31 for details). The resulting gas steam was analyzed using an environmental NOx and ozone analyzer (both Horiba, APNA-370 and APOA-370). It should be noted that the used analyzer does not discriminate between HONO and NO2 but measures both as NO2. Consequently, all values reported herein for NOx are strictly speaking NOy and the concentrations given for NO2 may contain an unknown quantity of HONO. However, it has been reported previously that while present, the concentrations of HONO during photocatalytic NO oxidation are relatively low.10,14
The changes in the concentrations of the pollutants were used to calculate the conversions (X = 1 − c/c0) and the nitrate selectivity 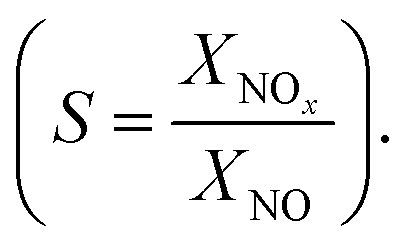 The results were further analyzed using Langmuir–Hinshelwood kinetics, eqn (10).32
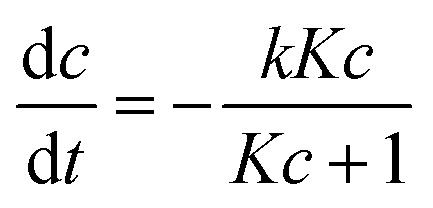 |
10 |
Integrating this rate law in plug-flow type reactors does not yield an explicit expression for the conversion. While there exists a linearized variant which enables determination of the rate constants, this approach suffers from error inversion and biased weighting problems which often lead to imprecise parameters.32 Therefore, the rate law was numerically integrated over the reactor volume (Euler–Cauchy algorithm) and the resulting conversions were fit (Levenberg–Marquardt algorithm) to the measured data points in order to obtain the respective kinetic constants. Based on these results, the first-order rate constant can be calculated according to eqn (11).32
| k1 = kK | 11 |
In case the conversion was observed to be constant with varying inlet concentration, a more simple method was used. As in this case, the reaction is purely first order in the concentration range of interest, the first-order rate constants (k1) can simply be obtained according to eqn (12).31
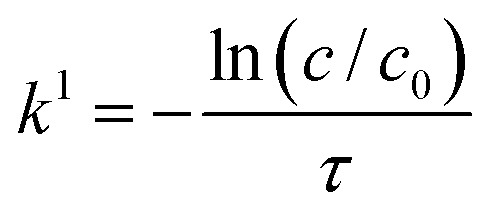 |
12 |
Since the residence time (τ) in the reactor is 0.5 s, the formula can be rewritten as eqn (13).
| k1 = −2 ln(1 − X) s−1 | 13 |
In order to make the data more comparable and setup-independent, deposition velocities (vsurf) and reactive uptake coefficients (γ) have been calculated according to eqn (14) and (15), with a surface-to-volume ratio (S/V) of 200 m−1 for the ISO setup.31 Factors for converting rate constants into reactive uptake coefficients for the given system are 4.397 × 10⁻⁵ s for NO and 5.445 × 10⁻⁵ s for NO2, respectively.
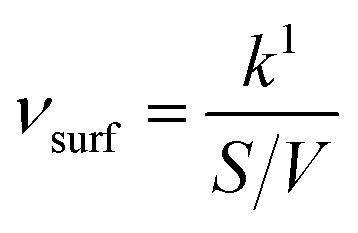 |
14 |
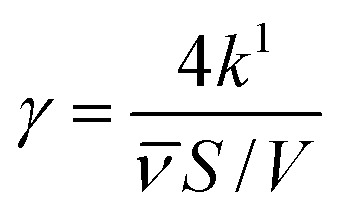 |
15 |
2.3. NO2 oxidation
These experiments were conducted analogously to the ones with NO by just changing the gas mixture to 1 ppm NO2 in the stream.
2.4. Long-term stability and recycling ability
The experiments were carried out after 20 h of NOx abatement tests. The photocatalysts were collected from the sample holder and stirred in 50 mL water for 2 h at RT, afterwards the material was filtered and dried at 110 °C for 24 h. The process was repeated after an additional 20 h of NOx oxidation. The filtrate was analyzed for iron residues by ICP-MS and nitrate by IC (Thermo Fisher iCAP Q and ICS 5000+).
2.5. EPR spectroscopy
Samples for Electron Paramagnetic Resonance (EPR) spectroscopy were prepared by loading a 4 mm EPR cell with 0.0715 g Fe–TiO2 powder containing 0.07 at% of Fe. The samples were degassed overnight on a Schlenk line under dynamic vacuum (5 × 10⁻³ mbar) at 393 K.
X-band, continuous wave (CW) EPR analysis was performed with a Bruker EMX spectrometer equipped with a ER4119HS resonator operating at 120 K under a liquid nitrogen-cooled nitrogen flow. Spectra were recorded using the following instrumental conditions: 1 × 10⁴ receiver gain; 100 kHz magnetic field modulation frequency; 5.0 Gauss magnetic field modulation amplitude and 20.2 kHz microwave power.
Irradiation was performed ex situ at 77 K in a Dewar filled with liquid nitrogen, using a Labino Nova 365 nm (350 to 395 nm bandwidth) UV-A LED light source (213 mW typical output).
Experimental spectra were simulated using the EasySpin package33 operating within the Mathworks Matlab environment.
3. Results
The photocatalyst P25 was grafted with iron ions in the concentration range of 0.0001 to 0.77 at%. The actual amount of grafted ions was determined indirectly by taking the difference of added metal salt and subtracting the residue found in the filtrate as analyzed by inductively coupled plasma mass spectrometry (ICP-MS). In most cases, it was found that the majority (>80%) of metal salts were grafted onto the TiO2 surface. In the lowest concentrations studied, the amount of iron in the filtrate was below the detection limit of the ICP-MS. Therefore, the samples' iron content was estimated as the total iron added in these cases which should be taken as an upper limit of the actual content in the samples. As reported previously,34 no evidence for a change in the crystal phase or particle size was observed in X-ray diffraction (XRD) (not shown). The grafting procedure itself leads to a noticeable increase in the pore volume for P25 from 0.31 cm3 g−1 to 0.49 cm3 g−1 even without adding any metal ions while the specific Brunauer–Emmett–Teller (BET) surface area just slightly increases from 55 m2 g−1 to 58 m2 g−1. No further significant change in either the surface area of pore volume was observed upon grafting the materials with iron ions (57 m2 g−1, 0.46 cm3 g−1).
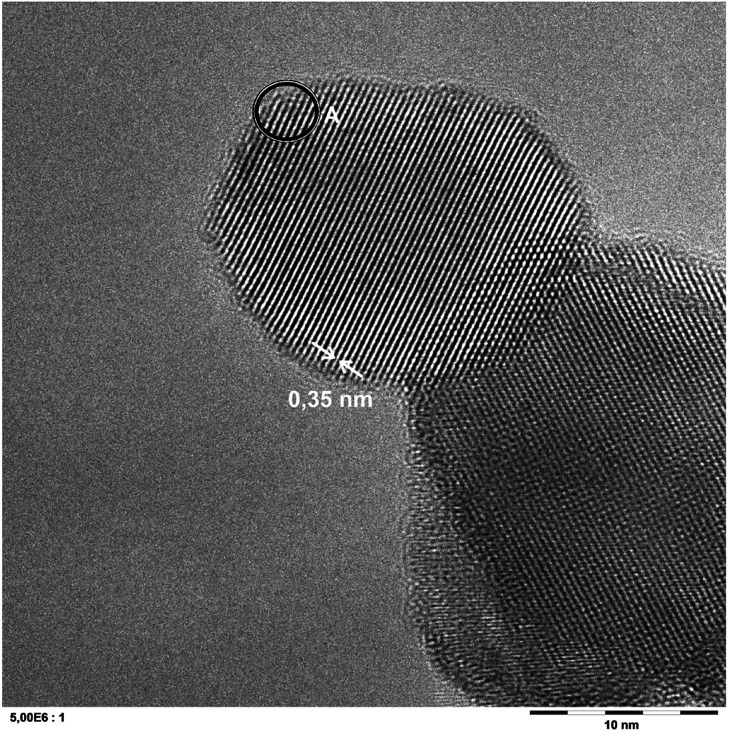
A representative sample has been analyzed in detail using transmission electron microscopy (TEM), cf.Fig. 1. The micrographs show no evidence of any modification and are indistinguishable from the pristine TiO2.
Fig. 1. A representative ATEM micrograph of a P25 sample grafted with 0.007 at% iron. The displayed lattice spacing of 0.35 nm corresponds to anatase TiO2. The indicated area A was subjected to EDX analysis, cf.Fig. 2.
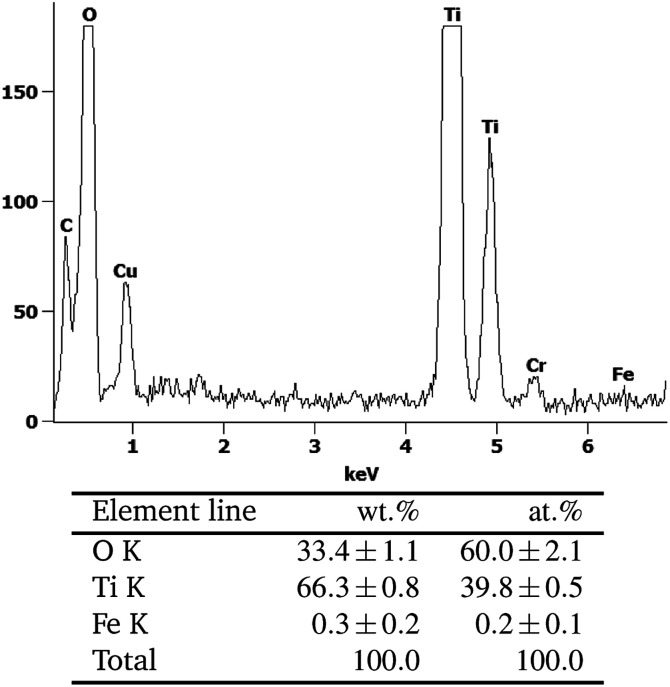
Yet, energy-dispersive X-ray spectroscopy (EDX) analysis of the samples indicates the presence of iron in extremely low amounts (0.3 ± 0.2 wt%), cf.Fig. 2. Since this is very near the detection limit of the method, quantitative interpretation is extremely challenging. Several scans of different positions on the sample either show no or the same low amount of iron, the low signal intensity implying the detection of only few iron atoms. No preferential iron localization, neither on edges, bulk nor on the different phases (anatase, rutile) could be detected and no evidence for discrete FeOx particles could be found, indicating that the iron is uniformly distributed and present either as extremely small clusters or as individual ions.
Fig. 2. The EDX-analysis of the area marked with A in Fig. 1.
Similarly, X-ray photoelectron spectroscopy (XPS) analysis reveals qualitative indication for the presence of iron, but the signals are too low and near the detection limit to clearly proof the iron content or allow quantitative interpretation, cf. Fig. S6.† The observed binding energies of 708.7 eV and 711.6 eV correspond well to FeO (709.6 eV) and Fe2O3 (710.9 eV), respectively, indicating mixed +II/+III valence of the iron ions.
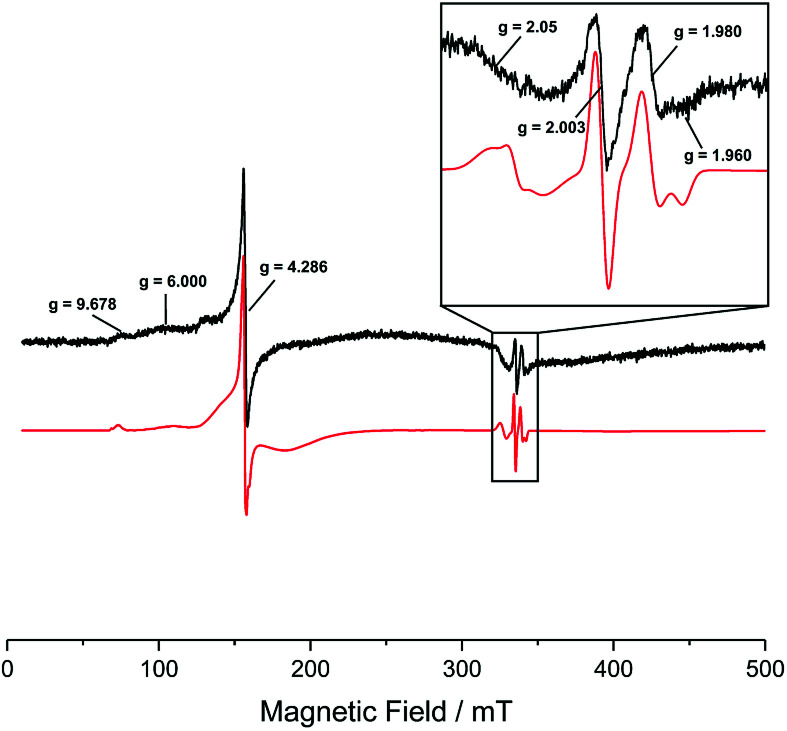
In order to prove the presence of iron in the samples with a more sensitive method, the materials were analysed using electron paramagnetic resonance (EPR) spectroscopy. The X-band, continuous wave (CW), EPR spectra of the Fe–TiO2 sample containing 0.07 at% of Fe, recorded at 120 K are shown in Fig. 3. Evident in the low field region of the spectrum are resonances at g = 9.678, 6 and a sharp (almost isotropic) resonance at g = 4.286 with shoulders on both sides. In the free spin region (i.e. around ge = 2.0023), a broad resonance at g = 2.05 and much narrower resonances at g = 2.003, 1.980 and 1.960 are visible. In addition, the experimental spectrum is characterized by a broad background signal starting at low field near g = 10 and gradually approaching zero at fields corresponding to 1 < g < 1/2, i.e. covering almost the entire magnetic field range scanned. This is evident by the fact that the baseline is not a flat line with signal amplitude equal to zero.
Fig. 3. Experimental (black) and simulated (red) X-band CW EPR spectra of the Fe–TiO2 sample containing 0.07 at% of Fe, recorded at 120 K, 1 × 10⁴ receiver gain; 100 kHz modulation frequency; 5.0 Gauss modulation amplitude and 20.2 mW microwave power, prior UV irradiation. The region of the spectrum around free spin (i.e. ge = 2.0023) is also shown enlarged.
The resonances at g = 9.678, 6, 4.286 and the broad background signal are indicative of high spin Fe(iii), 6S5/2 ground term (5 unpaired electrons).35,36 A detailed analysis of these g-values is provided in the ESI.† The almost isotropic resonance at g = 4.286 is often found in strong (D > hv) low symmetry (E/D ≈ 1/3) crystal field.35,36 This indicates that the iron is most likely present on the surface of the TiO2 and in either very small clusters or isolated ions, since a location inside the bulk of a crystal lattice (of either TiO2 or an iron oxide cluster) would be high symmetry.
The EPR analysis here presented is inconclusive as for the presence of Fe(ii) already present in the sample. Low spin Fe(ii) has spin S = 0, hence diamagnetic, hence EPR silent. High spin Fe(ii) ion has an integral spin, S = 2. In ordinary paramagnetic salts its resonance is not seen at 120 K, and sometimes not even in the liquid helium region, given that either the crystalline electric fields split the spin states by too large an amount to be observed, or the spin-lattice relaxation is so short that the resonance becomes so broad that is beyond detection.
Around the free spin region, the isotropic resonance at g = 2.003 corresponds to conduction band electrons. This signal is very common in TiO2 samples, given that TiO2 is an n-type semiconductor, hence electrons being the majority carriers. The resonances at g = 1.980 and 1.960 are the perpendicular and parallel components, respectively, of the EPR signal associated with bulk or interstitial Ti(iii) exhibiting axial symmetry.37,38 Once again, the presence of this species is common in TiO2 samples as the majority carriers, i.e. electrons, can be ‘trapped’ in Ti(iii) states, i.e., effectively reducing Ti(iv) (diamagnetic d0 ion) to Ti(iii) (paramagnetic d1 ion with S = 1/2).
An unambiguous assignment to the broad resonance around g = 2.05 is challenging. Part of this signal could still be due to high spin Fe(iii) showing extra features at 2.05 < g < 2.02.35 In addition, the signal could also comprise a contribution from the g⊥ of a lattice O− centre (i.e. trapped valence band hole) with significant levels of cationic impurities, causing an increase in the splitting of the π orbitals of the O− radical, which increase the g values compared to the cases of O− radical in P25 (g⊥ = 2.026) or O− radical in rutile (multiple g⊥ with the largest values at g⊥ = 2.043).38–41 The g∥ for a trapped hole is 2.002 and would be covered by the isotropic signal of the conduction band electrons.40 Another possibility could be the presence of a discrete amount of physisorbed oxygen on the surface of the sample.
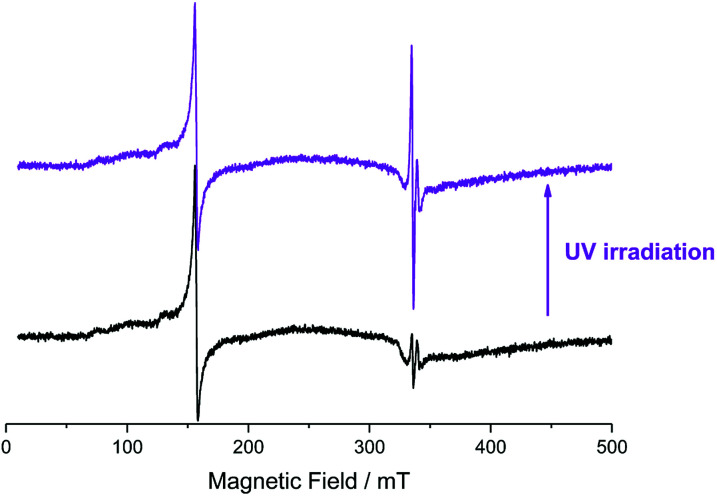
Upon UV light irradiation, an evident increase in the signals of conduction band electrons and Ti(iii) is observable, Fig. 4. This is expected given electron transition to the TiO2 conduction band and subsequent electron trapping as described above. In addition, a 12% decrease in the Fe(iii) double integrated signal intensity was observed. Since no new iron associated signals were detected this means that part of the Fe(iii) was converted into an iron species that is either EPR silent or not detectable under the employed conditions.
Fig. 4. Experimental X-band CW EPR spectra of the Fe–TiO2 sample containing 0.07 at% of Fe, recorded at 120 K, 1 × 10⁴ receiver gain; 100 kHz modulation frequency; 5.0 Gauss modulation amplitude and 20.2 mW microwave power, before (black) and after (violet) ex situ UV irradiation at 77 K.
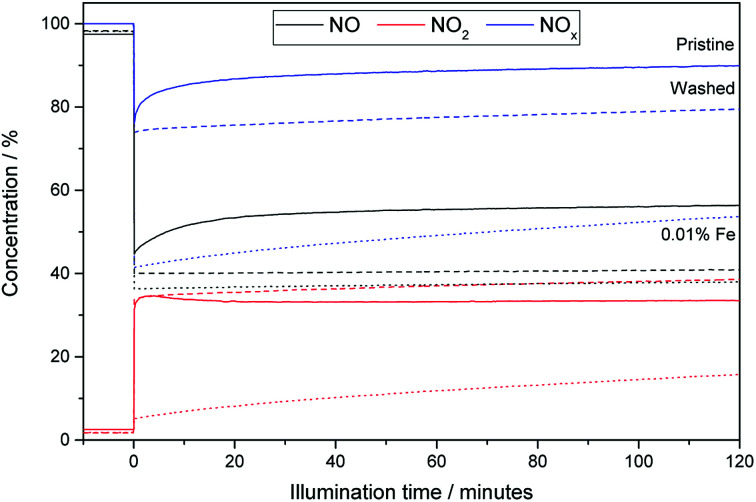
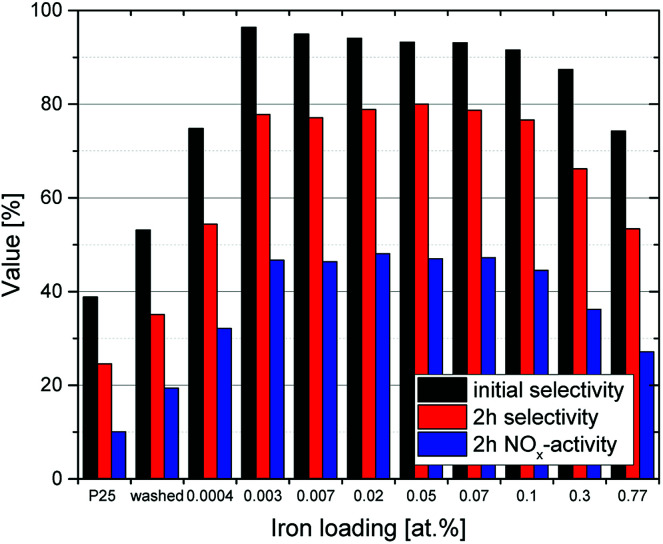
Fig. 5 shows exemplary runs of the ISO test 22197-1 for determination of the NOx-oxidation performance. While the decrease of NO concentration is quite substantial, the total variation of NOx over pristine (i.e. unmodified and unwashed) P25 is low with only about 10.1%, owing to the low nitrate selectivity of 24.6% after 2 h of measurement. The performance is immediately increased by just ‘washing’ the material without adding any iron ions to 19.4% NOx oxidation and 34.1% selectivity. This behavior is further dramatically improved by adding iron ions in the range of 0.003 to 0.1 at% which turned out to be the optimal range of iron loading (Fig. 6). Here, the initial selectivity ranges from 91.0 to 95.0%, the 2 h selectivity from 76.6 to 80.0% and the NOx oxidation activity from 44.5 to 48.1%. The improved selectivity and activity of the iron-modified materials resulted in reduced formation of NO2 in the same period compared to the metal-free TiO2 (Fig. 5). Similar experiments have been conducted with copper- and manganese-grafted materials which showed no significantly improved performance in NOx oxidation in comparison with the just washed samples, cf. Fig S7.†
Fig. 5. The relative changes in NO (black), NO2 (red) and total NOx-levels (blue) during a run of the ISO test 22197-1 with 1 ppm inlet concentration of NO. Represented are runs for pristine P25 (solid lines), washed P25 (slashed lines) and P25 grafted with 0.007 at% of Fe (dotted lines).
Fig. 6. The DeNOx-performance of P25 samples grafted with different amounts of iron. Displayed are the initial nitrate selectivity (black) as well as the selectivity (red) and NOx removal rates (green) after 2 h on stream.
As pointed out by Mills and Elouali, at high nitrate loadings TiO2 becomes an effective NO to NO2 converter with no net nitrate formation.23 This seems to also be true for the iron-grafted catalysts, which also show diminished selectivity with increasing nitrate accumulation. However, much higher nitrate loadings are required to achieve this effect with the iron-grafted materials than for the pristine catalyst. This means that they are more robust against nitrate poisoning and that complete inactivation (no net nitrate formation, zero selectivity) happens only after very long exposure times, provided it does not rain in the meantime and the catalyst is regenerated. To quantify this effect, a study of the observed selectivity for nitrate as a function of the nitrate surface coverage is useful. This illustrates the robustness of the catalyst towards increasing nitrate poisoning and is a measure for the long-term performance of the materials.22
The nitrate surface coverage can be calculated according to eqn (16) with the volume flux (V̇), pressure (p), Avogadro's constant (NA), gas constant (R), absolute temperature (T), mass of catalyst (m), its specific surface area (SA) and the maximum nitrate surface coverage (θmax = 2 nm−2).22,42
 |
16 |
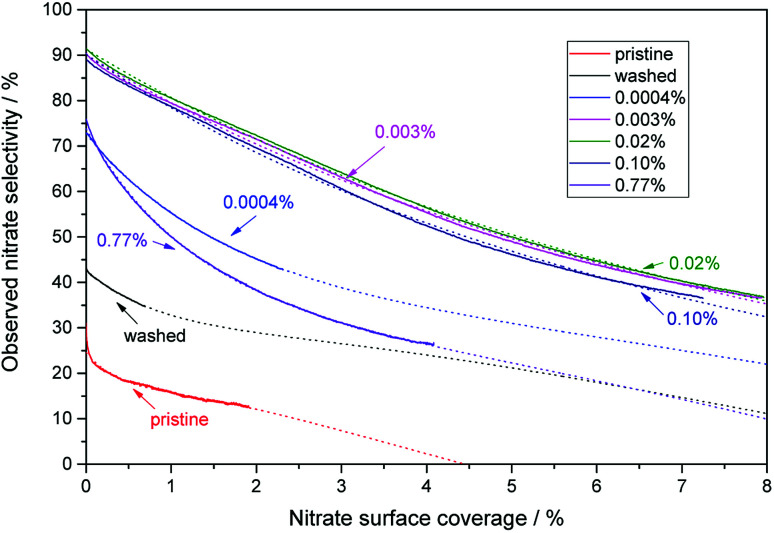
As seen in Fig. 7, all of the materials exhibit a loss of selectivity at increasing nitrate surface coverages, however, to varying degrees. Pristine P25 starts out with a rather poor selectivity of 31% which drops very fast to 18% at a nitrate surface coverage of 0.5%. The washed material without any added iron ions has a selectivity of 44% at the beginning of the experiment and only drops to 36% when a nitrate surface coverage of 0.5% is reached. A further significant improvement is achieved by even a very low iron loading of 0.0004 at%, which corresponds to a statistical mean of only 1.6 ions per particle. In this case, the initial selectivity increases to 73% and is relatively stable, only dropping to 63% with the same amount of adsorbed nitrate (0.5%). The performance of materials loaded with the optimum of iron between 0.003 to 0.1 at% is difficult to distinguish, their initial selectivity ranges between 89 to 92% and still 83 to 85% at a nitrate coverage of 0.5%, relatively independent of the iron concentration. In prolonged experiments, nitrate surface coverages of up to 8% could be achieved with these materials, which were still more selective under these conditions than the pristine material at the beginning of the experiment.
Fig. 7. The behavior of the observed nitrate selectivity with increasing nitrate surface coverage for a selection of representative iron-grafted samples. The numbers in the figure indicate the iron content of the respective samples. Also displayed are the best fits to the previously published model obtained using eqn (24) and non-linear regression as dotted lines.22.
Studies of different inlet concentrations revealed that the NO oxidation proceeded according to first-order kinetics, showing a linear dependence of the oxidation rate with increasing inlet concentration, cf. Fig. S3 and S5.† The only exception to this is the pristine P25 material which shows mixed first and zero order kinetics at higher concentration, cf. Fig. S1.† This case was analyzed using Langmuir–Hinshelwood (L–H) kinetics and all other materials were analyzed according to the simplified first-order kinetics (which in the cases yields the same first-order rate constants as when using L–H kinetics) to calculate the respective rate constants using eqn (13).22,31,32 As summarized in Table 1, the first-order rate constants for NO oxidation are virtually unaffected by both the washing procedure and the iron grafting and range from 1.6 to 1.8 s−1. Only at the highest studied iron loadings of ≥0.1 at%, the rate constant notably decreases. However, it should be mentioned that the maximum NO oxidation rate is increased by the washing procedure, apparent from the observed conversions.
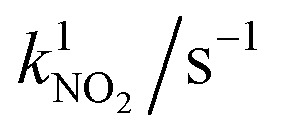
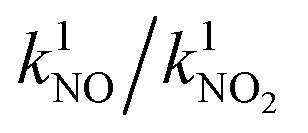
NO conversion XNO(2 h) in the ISO standard test 22197-1 in 1 ppm NO and NO2 conversion XNO2(2 h) in 1 ppm NO2 (both after 2 h) and the corresponding first-order reaction rate constants k1 of chosen samples with different iron loadings.
| Iron loading/at% | X NO(2 h)/% | k 1 /s−1 | X NO2(2 h)/% |
|
|
|---|---|---|---|---|---|
| Pristine P25 | 33 | 1.74a | 7 | 0.16 | 10.69 |
| Washed (0) | 55 | 1.68 | 14 | 0.30 | 5.03 |
| 0.0004 | 58 | 1.74 | 18 | n.d. | n.d. |
| 0.003 | 57 | 1.70 | 17 | n.d. | n.d. |
| 0.007 | 59 | 1.80 | 20 | n.d. | n.d. |
| 0.02 | 57 | 1.69 | 21 | n.d. | n.d. |
| 0.05 | 56 | 1.66 | 21 | 1.39b | 1.18 |
| 0.07 | 54 | 1.57 | 21 | n.d. | n.d. |
| 0.10 | 54 | 1.55 | 21 | n.d. | n.d. |
| 0.30 | 50 | 1.40 | 22 | n.d. | n.d. |
| 0.77 | 48 | 1.32 | 16 | n.d. | n.d. |
Not strictly adhering to first order at higher concentrations, kinetic constant obtained using Langmuir–Hinshelwood kinetics.
Determined at low concentration (<200 ppb).
Similarly, initial experiments suggested that NO2 oxidation also follows first-order kinetics in the concentration range studied. The resulting first-order rate constants are 0.16 s−1 and 0.30 s−1 for the pristine and washed P25. This shows that NO2 oxidation is about an order of magnitude slower than NO oxidation and also that the simple washing procedure already doubles the activity. Even better results were obtained with the iron modified samples which is already illustrated by their higher NO2 conversions. However, kinetic analysis of these samples proved a bit more complicated.
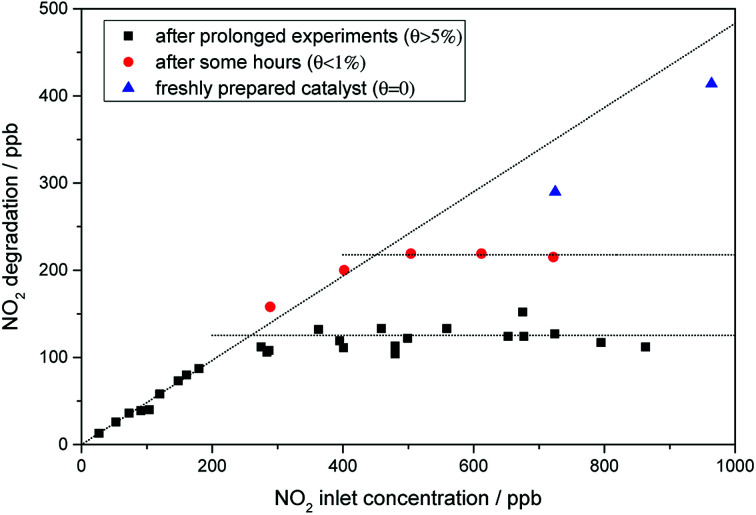
It is worth mentioning that the NO2 rate constants presented here were attained with catalysts that have been on stream for several hours. Preliminary testing with the pristine catalyst did not show a significant deviation of the activity with increasing nitrate surface coverage. However, further studies have also revealed that while for pristine and washed P25, the NO2 oxidation follows first-order kinetics (cf. Fig. S2 and S4†), this is not always the case for the iron-grafted photocatalysts. As shown in Fig. 8, the linear behavior of oxidation rate with increasing inlet concentration is only achieved for a freshly prepared (i.e. nitrate free) sample. Contrary to the observations with the pristine catalyst, accumulation of nitrate during the testing did have a significant effect on the NO2 oxidation rate. The onset of this effect can even be seen for the freshly prepared catalyst which accumulate traces of nitrate during the test, which is already sufficient to slightly deviate from perfect linear behavior (Fig. 8, blue triangles). Once the sample accumulates even moderate amounts of nitrate, the maximum achievable oxidation rate quickly levels off at a certain amount. This is even more pronounced with higher nitrate loadings. However, even at the highest measured nitrate surface coverage of about 8%, the photocatalyst still shows linear behavior at low (<200 ppb) concentrations. Since analysis of these results with L–H kinetics did not yield acceptable fits, we simply calculated first-order rate constants from the linear part at low concentrations. In this concentration range, the first-order rate constant is 1.39 s−1, which is 8.7 times the value of the pristine catalyst.
Fig. 8. The oxidation of NO2 over illuminated P25, grafted with 0.05 at% Fe, with varying inlet concentrations of NO2. Shown are a freshly prepared sample (blue triangles) as well as ones which were already subjected to short (red filled circles) and long DeNOx testing (black squares) procedures. Conditions according to ISO 22197-1, except inlet concentration.
The measurements of NO2 oxidation rates reveal that all of the catalysts show higher activity towards NO than towards NO2, for pristine P25 this ratio is 10.7. This is diminished to 5.0 for the washed variant and further for the iron-grafted materials which show ratios of about 1.2, mostly due to an increase in activity towards NO2, since the reactivity towards NO is not changed.
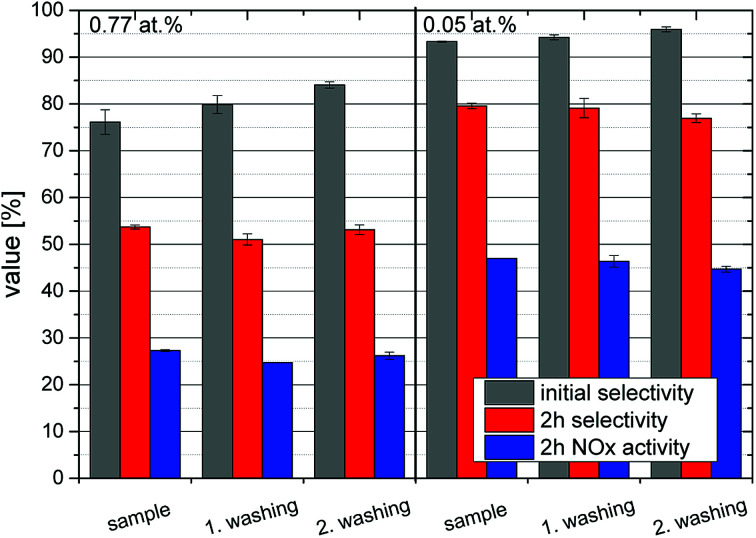
In order to determine the long-term stability of the materials, they were subjected to repeated irradiation-washing cycles. Two representative samples, one with a high iron loading of 0.77 at% and one with the optimum at 0.05 at% were chosen. Deionized water was used for the washing steps and it was subsequently collected and analyzed for nitrate content as well as traces of iron ions which might have leeched out of the powder. An average loss of 0.25 μmoliron gcatalyst−1 occurred during each cycle which correlates to 0.26% of the initial concentration of the 0.77 at% sample and 4.1% of the 0.05 at% material. The nitrate detected in the rinsing water corresponds well (73% on average) with the total nitrate formed during the preceding experiments, calculated as the integral of removed NOx over the whole time-frame, indicating that the majority of formed nitrate is readily removed by a simple washing step. Subsequent NOx-abatement tests have shown that the washed and thus regenerated samples perform virtually identical to the as-prepared samples with no apparent deactivation for at least three cycles, cf.Fig. 9. After every recycling step, the initial selectivity increases while the 2 h value and the activity are unchanged. This effect is more distinct at high iron concentrations.
Fig. 9. Long-term stability and recycling tests of the modified photocatalysts. Shown is the DeNOx-performance in terms of initial nitrate selectivity (grey) as well as the selectivity (red) and NOx removal rates (blue) after 2 h on stream for a sample with 0.77 at% iron (left) and a sample with 0.05 at% iron (right) in 3 repeated cycles with washing steps in between.
4. Discussion
Iron-grafted titanium dioxide material with metal concentrations of 0.0004 to 0.77 at% was successfully prepared by a simple impregnation technique. Interestingly, even the sample made by the same route but without adding any metal ions in the process showed an improved NOx oxidation behavior. This sample was virtually indistinguishable from the commercial product in its physical properties, except that the pore volume was increased about twofold. Yang et al.21 showed that the amount of adsorbed water plays an important role for the selectivity of titanium dioxide materials. Also the ability to degrade ozone is increased by hydrated TiO2 independent from the commercial source or the crystal phase composition.34 Therefore, we assume the observed improved performance of the washed samples is a result of an altered surface hydration state. However, at this point, it is unclear whether this hydration state and the associated positive effects on selectivity and activity will persist in real world applications.
The grafted materials were indistinguishable from the just washed material by TEM, BET and XRD analyses. No evidence for an incorporation of the iron into the TiO2 lattice or the appearance of discrete iron oxide clusters could be detected. The iron presence was confirmed by EDX, XPS and EPR measurements, the latter showed that the iron is likely present as Fe(iii) in a low symmetry environment, i.e., likely not inside the bulk of a crystal lattice. This all points towards the iron being located on the surface of the TiO2 as either isolated ions or extremely small clusters of an iron oxide, as expected by the procedure and also reported by others for similar materials.43 Signals that have been attributed for Fe(iii)-based clusters at g ≈ 20 were not detected in the samples, further underlining isolated ions as the most likely situation.44 Similar EPR-signals as seen here have also been reported for isolated penta- or hexacoordinated high-spin Fe(iii) ions in zeolites.44,45 This is further substantiated by the results of the EPR as under illumination, there appears to be a charge transfer from the TiO2 to the iron species, resulting in the disappearance of its EPR signal, meaning it is converted into a non-detected iron species (both Fe(ii) and Fe(iv) would likely not be seen under the employed conditions).
We therefore conclude that the iron is present as isolated ions on the surface of the TiO2 nanoparticles. Usually, these types of grafted ions are present in positions which the host crystal cations would occupy, either in surface cation vacancies or in apparent extensions of the host lattice.46–48 They therefore present a form of quasi-substitutional doping which are often under-coordinated due to their location at the surface. Their anchoring on the host lattice also creates a unique coordination sphere which can be comparable to some molecular catalysts and may induce similar reactivity.46
The iron grafting procedure significantly increases the NOx oxidation performance. Most notably, the performance towards NO2 was dramatically improved upon iron addition in comparison to both, the pristine and washed photocatalyst. While the improved oxygen reduction rates and better charge separation properties of iron-grafted TiO2 can account for some of the observed activity gains, there is likely an additional mechanism taking place. The reason for this is that the former has been reported to lead to improved activities in the order of two- to fourfold,43,49,50 while herein, the activity towards NO2 was increased by the factor of 8.7. Also, an increased overall activity should increase the reactivity towards both NO and NO2. However, the reactivity towards the former was not significantly altered.
As the reaction from nitrogen dioxide to nitrate requires an oxidant, a strong oxidant is likely the central element in the additional mechanism. Other authors have also observed that Fe3+-grafted TiO2 (rutile) has enhanced oxidative pathways, leading to increased production of hydroxyl radicals or other highly oxidizing species.43 We propose here that Fe(iv) ions (also called ferryl ions) are also a central element in the oxidation mechanism. The formation of both Fe(iv) and Fe(v) in photocatalytic processes has recently been proposed.51
These ferryl ions (in the form of Fe4+, FeO2+ or FeOH3+) could be formed either by direct electron transfer to valence band holes in the titanium dioxide host material, eqn (17) and (18), or indirectly by hydroxyl radicals, eqn (19). Also, mechanistic studies on the Fenton reaction suggest that ferryl ions are likely produced by the reaction of Fe2+ with hydrogen peroxide (eqn (20)), both of which can readily be formed by the reductive pathway, i.e., by photo-generated conduction band electrons.52,53 These ions would only be sufficiently stable as isolated immobile Fe ions such as the ones present here as in clusters of iron oxides, they could rapidly react with Fe(ii) ions in the vicinity.
| Fe3+ + h+ → Fe4+ | 17 |
| Fe4+ + H2O → FeO2+ + 2H+ | 18 |
| Fe3+ + ·OH → FeO2+ + H+ | 19 |
| Fe2+ + H2O2 → FeO2+ + H2O | 20 |
| FeO2+ + H2O → Fe3+ + ·OH + OH− | 21 |
| FeO2+ + NO → Fe3+ + NO2− 2.4 × 10⁷ mol L−1 s−1 (ref. 54) | 22 |
| FeO2+ + NO2 → Fe3+ + NO3− 1.7 × 10⁷ mol L−1 s−1 (ref. 55) | 23 |
While being highly unstable in aqueous media owing to the rapid hydrolysis reaction, eqn (21), the ferryl ion could be relatively stable in the gas phase and act as a very powerful oxidant. It has been shown that ferryl ion complexes react extremely rapidly with both NO and NO2, eqn (22) and (23), showing kinetic constants of 2.4 × 10⁷ and 1.7 × 10⁷mol L−1 s−1, respectively.54,55 So while the intrinsic oxidation pathway of illuminated TiO2 shows much higher reaction rates towards NO than NO2, this ferryl ion mediated pathway would not distinguish between the two and react indiscriminately with both, basically at diffusion-limited rates. The result would be a strongly suppressed accumulation of the intermediate species NO2 and therefore an increased observed selectivity towards complete oxidation to nitrate. The proposed reaction mechanism and pathways are summarized in Fig. 10.
Fig. 10. The proposed reaction mechanisms with the different pathways involving the grafted iron species.
In the proposed mechanism, the reactive Fe(iv) species can be formed both through the oxidative pathway via valence band holes or hydroxyl radicals and also through the reductive pathway via Fe(ii) and hydrogen peroxide. There are many reports that in P25, the oxidation and reduction reactions are spatially separated on the anatase and rutile particles.56,57 Likewise, there are theories that even on single polymorphs oxidation and reduction preferentially take place on different crystal faces.58,59 This means that a NO molecule that is oxidized to NO2 at or near the reductive sites via hydroperoxyl radicals, eqn (7) and (8), cannot readily be further oxidized to nitrate but has to migrate to the oxidative sites first. This might facilitate release of this intermediate species and lead to lower selectivity. On the contrary, the proposed iron-mediated mechanism can theoretically take place on both sites and therefore prevent this from happening and also make use of a higher fraction of the available surface area.
The EPR results show that the amount of Fe(iii) is reduced under illumination and we cannot exclude that oxidation to Fe(iv) (likewise reduction to Fe(ii)) might indeed take place. However, this cannot explicitly prove formation of Fe(iv) as Fe(ii) would also be EPR-silent, so this neither validates nor invalidates the proposed theory. Unfortunately, other analytical tools such as XPS are already challenged to detect the whole amount of iron due to the extremely low concentrations so detecting a highly reactive intermediate species is improbable. Measuring at higher iron loadings, however, may alter the reaction mechanism, as already indicated by the fact that >0.1 at% iron loadings perform worse than the lower concentrations. So, for the time being, we are unable to offer direct experimental evidence for the reaction mechanism proposed above.
The NO oxidation tests also show that the selectivity towards nitrate is dramatically improved upon grafting iron ions onto the TiO2 surface. This is true both for the initial selectivity as well as the long term selectivity, i.e., after a significant amount of nitrate has already been deposited on the catalyst, cf.Fig. 6 and 7.
The improved initial selectivity is likely a result from the materials' improved reactivity towards NO2. While pristine P25 reacts more than 10 times faster with NO than with NO2, this ratio is diminished to 1.2 for the iron-grafted materials. It was found that for lower concentrations (<100 ppb) of NO2, the activity of the iron-containing samples approaches the values seen for NO. It is apparent that in the case of pristine P25, the intermediate NO2 will accumulate due to the poor kinetics of the follow-up reaction. In contrast, the iron-grafted materials have a much better capacity to immediately oxidize the formed NO2 before it is desorbed and detected in the gas phase, owing to its higher reactivity towards it, especially at the locally low concentrations expected to be present of the intermediate. It is worth mentioning here that the highest NO2 oxidation rates observed here with a kinetic constant of 1.39 s−1, which correspond to a deposition velocity of 0.70 cm s−1 and reactive uptake coefficient of 7.57 × 10⁻⁵, are not only dramatically higher than for the pristine sample (by a factor of 9) but also significantly higher than anything reported in the literature under comparable conditions so far.32
However, even with the rate constants of NO and NO2 oxidation being almost the same, under the observed conditions of about 50% conversion, NO2 should still be present in significant amounts as an intermediate. Since this is not the case, at least in the first hours on stream, there might also be another mechanism in place which suppresses NO2 release. The preferable oxidation reaction for NO is its reaction with hydroperoxyl radicals HO2·, which could theoretically directly yield nitric acid/nitrate.11 However, the product of this reaction is peroxynitrous acid (HOONO, eqn (7)) which rapidly homolytically decays to NO2 and ·OH (1.2 s−1, eqn (8)) which may however immediately recombine to nitrate, eqn (9).60,61 It has recently been speculated that the surface pH of the catalyst plays an important role in this reaction, as the deprotonated form, peroxynitrite (OONO−) is much more stable so a higher pH might lead to less NO2 release through this pathway.62 In summary, the reaction of NO with hydroperoxyl radicals HO2· likely predominantly forms NO2 with peroxynitrous acid as an intermediate.
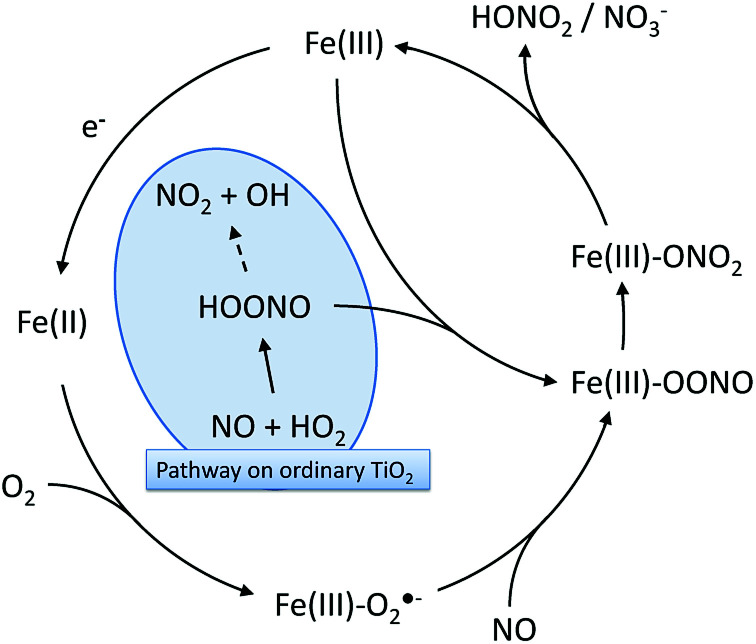
Interestingly, it has been reported that Fe(iii)-containing metallo-enzymes such as hemoglobin quantitatively isomerize peroxynitrites to nitrates in an extremely rapid reaction without releasing NO2.55,63,64 Therefore, an Fe(iii)-mediated isomerization reaction can be envisioned on the modified photocatalysts which prevents the release of NO2 from peroxynitrite/peroxynitrous acid and effectively enables hydroperoxyl radicals to directly oxidize NO to nitrate. Moreover, the iron ions can also be reduced to Fe(ii) by photo-generated conduction band electrons (supported by EPR evidence). These species readily react with molecular oxygen, forming a Fe(ii)–O2/Fe(iii)–O2·− adduct.55 Reaction of this adduct with NO yields the peroxynitrite adduct mentioned before (Fe(iii)–OONO) which then isomerizes, generating nitrate.55 This proposed mechanism is summarized in Fig. 11.
Fig. 11. The proposed reaction mechanisms for peroxynitrite/peroxynitrous acid isomerization on the grafted Fe(iii) that would prevent NO2 release through peroxynitrous acid decomposition.
The mechanisms mentioned above can readily explain the improved initial or intrinsic activity, but offer no explanation for the slower deactivation during nitrate accumulation, i.e., the improved tolerance towards nitrate poisoning. As we pointed out in an earlier study, a purely passive blocking of surface sites by accumulated nitrate should affect NO and NO2 oxidation rates by the same factor and therefore, the selectivity should not be significantly altered in the process.22 Consequently, we proposed an additional active role of the nitrate, which is that it competes with molecular oxygen for reducing equivalents. As the reduction of nitrate yields NO2, this results in an apparent lowered selectivity.22,23
To substantiate this theory and also to better differentiate the high performing iron-loaded materials, the previously reported model for the selectivity as a function of the nitrate coverage was used to analyze the materials, eqn (24).22
 |
24 |
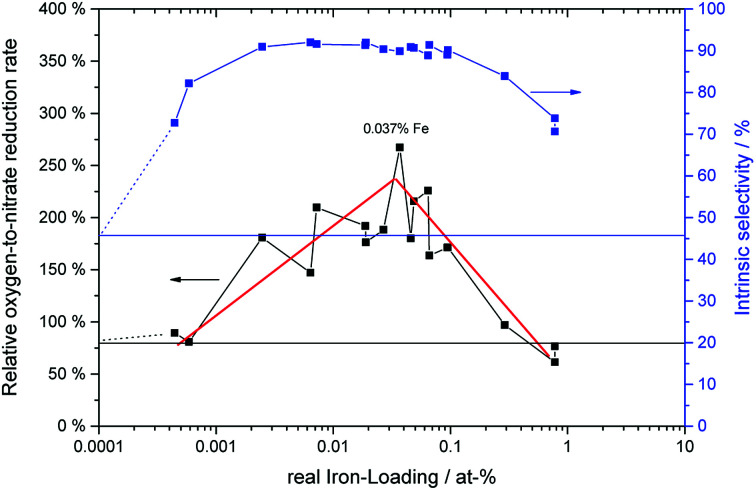
It is based on the theory mentioned above that molecular oxygen and adsorbed nitrate compete for the photo-generated conduction band electrons in TiO2, the latter forming NO2 in the process and thereby reducing the overall selectivity.22 Here, S represents the observed nitrate selectivity, θ is the nitrate surface coverage, S0 represents the initial or intrinsic selectivity of the material, when no nitrate is yet adsorbed on the surface, ko is a dimensionless figure of the relative oxygen reduction rate and the factor α is describing the rate of which the oxygen reduction switches between the four-, two- and one-electron reduction pathways.22 In all cases, the behavior of the observed nitrate selectivity (Fig. 7) could be modeled very well with the formula mentioned above (R2 ≥ 0.99) to extract the respective intrinsic selectivity S0 and oxygen reduction rates ko (Fig. 12).
Fig. 12. The relative oxygen reduction rate (black circles, left axis) and initial selectivity (blue filled circles, right axis) of the samples with varying iron-grafting ratio. The data was extracted from the fits of eqn (24) to the plots in Fig. 7. The horizontal lines represent the respective values of the ungrafted, washed reference samples.
The intrinsic or initial selectivity starts out at 45% for the washed sample and quickly rises to about 90% with very low iron-loadings of 0.003 at%, which corresponds to only a statistical mean of 10 ions per particle. Over a wide concentration range of 0.003 to 0.1 at%, the initial selectivity stays constant and then decreases again for higher iron loadings. This corresponds very well to the relative reaction rates of the materials towards NO and NO2, cf.Table 1, underlining their likely cause for this behavior.
However, the relative oxygen reduction rate of the materials shows a different behavior. Here, even the high-performing samples can be further distinguished. Further optimizing the catalysts with respect the oxygen reduction rate means that on top of a very high initial selectivity, they also retain this high value for a much longer time-frame, i.e. they get deactivated much slower.
As illustrated in Fig. 12, the oxygen reduction shows a volcano plot with a peak at 0.037 at% iron, where the relative oxygen-to-nitrate reduction rate reaches 267%, 3.4 times the value of the washed, ungrafted catalyst. The iron content of this sample corresponds to a surface coverage of 0.058 ions per nm2 and a statistical mean of 148 ions per particle.
At higher iron loadings, the probability of larger aggregates or clusters rises. These may form discrete particles of iron oxides which posses completely different catalytic properties than isolated iron ions grafted onto the TiO2 surface. The optimum iron concentration corridor ranges from approximately 0.003 to 0.1 at%, which corresponds to a statistical mean of 10 to 400 ions per particle (0.0039 to 0.148 ions per nm2). This is in line with a previously published theory that surface grafted photocatalysts should have enough metal ions to guarantee at least one ion per particle (this requires a statistical mean of about 5 ions per particle to guarantee ≥99% of the particles have at least one).65 At the same time, critically high concentrations which would lead to cluster formation, recombination centers and phase segregation should be avoided.66 There is no clear red line which can be defined when this happens, in this case it appears to begin at approximately 0.1 at%.
The procedure has also been successfully adapted for other TiO2 powders, namely Cristal Global PC105 and Kronos K7050, cf. Fig S8.† The latter one had to be calcined prior to the grafting procedure to remove residual water and sulfate from the production process. Nonetheless, this implies that the procedure is universally applicable to commercially available TiO2 materials to increase their activity and selectivity of photocatalysts for NOx abatement.
Long-term stability experiments with 0.05 at% and 0.77 at% iron-loading have shown that a small amount of iron is lost with every washing cycle, apparently invariant of the total iron concentration. This is likely governed by the solubility of iron ions in the washing medium and corresponded to a loss of 0.0019 at% per washing cycle. Obviously, this will affect the lower concentrated samples significantly, while not having a noticeable effect on the higher concentrations. For instance, at this rate, it will presumably take 52 washing cycles to completely remove the iron from a sample with 0.1 at% iron. This means, that the made catalyst are very stable for a environmental application taking into account that the used desorption method possesses a high mechanical stress to the material in contrast to rainfall in the prospective application. In consequence, the real life performance should be much higher and the photocatalyst are very active through a wide concentration range until very low loadings of 0.003 at% iron. After recycling, the photocatalysts are fully recovered in the NOx oxidation experiments or even show a better performance in the beginning of the experiments, respectively. Beside nitrate formed by the photocatalytic oxidation, other residues such as chloride resulting from the P25 production process may be removed by recycling, which could explain this slightly improved behavior upon recycling.
From the point of application it therefore makes sense to start out with the highest possible concentration of iron which is still within the optimal corridor, e.g., in the present case at 0.1 at%. This way, the material has sufficiently high reserves of iron that leaching out will take very long before the materials fall out of the optimal iron concentration regime on the lower end.
Some of the NO oxidation experiments were run for a sufficiently long time to observe turnover numbers, i.e., number of nitrate molecules formed in relation to iron ions present, of greater than 1, proving a catalytic mechanism with respect to iron. For instance, in the case of the material with 0.003 at% iron, a turnover number of 176 was observed. For higher iron loadings, this was not repeated in all cases as the respective experiments would take extremely long due to the low concentration of NOx in the gas stream, but there was no evidence to suggest a non-catalytic process in these cases.
It should also be mentioned that the same materials shown herein have recently been reported to have significantly improved activity for photocatalytic ozone depletion.34 As due to atmospheric chemistry, ozone leads to the formation of NO2via reaction with NO, this property indirectly leads to an effective additional reduction in the NO2 levels.
5. Conclusions
By grafting commercially available titanium dioxide photocatalysts with small amounts of iron ions in a very simple procedure, both, their NOx abatement activity and their selectivity towards nitrate was significantly improved.
The improved intrinsic selectivity of the material is attributed to the vastly enhanced reactivity towards NO2, presumably due to the generation of highly reactive iron(iv) centers on the surface of the photocatalyst. At expected concentrations in the environment (<100 ppb), the best catalyst exhibited a deposition velocity of 0.70 cm s−1 and reactive uptake coefficient of 7.57 × 10⁻⁵ for NO2, which is 9 times the value of the unmodified pristine catalyst. Also, an iron(iii)-catalyzed peroxynitrite isomerization mechanism was proposed to contribute to the enhanced selectivity.
At the same time, the long-term performance of the materials was also dramatically enhanced. This is likely a result of the improved oxygen reduction rates caused by the grafted iron species. Since oxygen competes with nitrate for photo-generated electrons, this leads to a higher nitrate tolerance and therefore a less pronounced decline in selectivity with higher nitrate surface coverage.
As a results of these three effects, all originating from the likely isolated single iron ions on the TiO2 surface, combined with the previously reported increased capacity to degrade ozone, these materials are much better suited than pristine titanium dioxide for photocatalytic environmental NOx abatement as they both show higher performance and emit less unwanted by-products. It has also been shown that the procedure works with many different photocatalysts so it is likely universally applicable to TiO2-based materials.
Conflicts of interest
There are no conflicts to declare.
Supplementary Material
Acknowledgments
The authors are grateful to the German Ministry of Economics for funding the AiF/IGF project 18152N. The ATEM and XPS results are provided courtesy of Evonik. Also, many thanks to Evonik, Kronos and CristalGlobal for providing us with the photocatalyst samples.
Electronic supplementary information (ESI) available: Detailed description of the g-tensor identification in the EPR experiments, the kinetic analysis of the NOx oxidation data, the XPS results and the NOx oxidation performance of Cu- and Mn-grafted P25 as well as other commercially available TiO2 materials grafted with Fe ions. See DOI: 10.1039/c8ra05017a
References
- Kurtenbach R. Kleffmann J. Niedojadlo A. Wiesen P. Environ. Sci. Eur. 2012;24:21. doi: 10.1186/2190-4715-24-21. [DOI] [Google Scholar]
- Guerreiro C. B. B. Foltescu V. de Leeuw F. Atmos. Environ. 2014;98:376–384. doi: 10.1016/j.atmosenv.2014.09.017. [DOI] [Google Scholar]
- Malley C. S. von Schneidemesser E. Moller S. Braban C. F. Hicks W. K. Heal M. R. Atmos. Chem. Phys. Discuss. 2017:1–43. doi: 10.5194/acp-2017-910. [DOI] [Google Scholar]
- Williams M. L. Carslaw D. C. Atmos. Environ. 2011;45:3911–3912. doi: 10.1016/j.atmosenv.2011.04.067. [DOI] [Google Scholar]
- Skalska K. Miller J. S. Ledakowicz S. Sci. Total Environ. 2010;408:3976–3989. doi: 10.1016/j.scitotenv.2010.06.001. [DOI] [PubMed] [Google Scholar]
- Franco V., Sánchez F. P., German J. and Mock P., Real-World Exhaust Emissions From Modern Diesel Cars, The International Council on Clean Transportation Technical Report, October, 2014 [Google Scholar]
- De_Richter R. Ming T. Davies P. Liu W. Caillol S. Prog. Energy Combust. Sci. 2017;60:68–96. doi: 10.1016/j.pecs.2017.01.001. [DOI] [Google Scholar]
- Freitag J. Domínguez A. Niehaus T. A. Hülsewig A. Dillert R. Frauenheim T. Bahnemann D. W. J. Phys. Chem. C. 2015;119:4488–4501. doi: 10.1021/jp5108069. [DOI] [Google Scholar]
- Schneider J. Matsuoka M. Takeuchi M. Zhang J. Horiuchi Y. Anpo M. Bahnemann D. W. Chem. Rev. 2014;114:9919–9986. doi: 10.1021/cr5001892. [DOI] [PubMed] [Google Scholar]
- Gandolfo A. Bartolomei V. Gomez Alvarez E. Tlili S. Gligorovski S. Kleffmann J. Wortham H. Appl. Catal., B. 2015;166–167:84–90. doi: 10.1016/j.apcatb.2014.11.011. [DOI] [Google Scholar]
- Laufs S. Burgeth G. Duttlinger W. Kurtenbach R. Maban M. Thomas C. Wiesen P. Kleffmann J. Atmos. Environ. 2010;44:2341–2349. doi: 10.1016/j.atmosenv.2010.03.038. [DOI] [Google Scholar]
- Dillert R. Engel A. Große J. Lindner P. Bahnemann D. W. Phys. Chem. Chem. Phys. 2013;15:20876. doi: 10.1039/C3CP54469A. [DOI] [PubMed] [Google Scholar]
- Bloh J. Z. Folli A. Macphee D. E. RSC Adv. 2014;4:45726–45734. doi: 10.1039/C4RA07916G. [DOI] [Google Scholar]
- Monge M. E. George C. D'Anna B. Doussin J.-F. Jammoul A. Wang J. Eyglunent G. Solignac G. Daële V. Mellouki A. J. Am. Chem. Soc. 2010;132:8234–8235. doi: 10.1021/ja1018755. [DOI] [PubMed] [Google Scholar]
- Folli A. Strøm M. Madsen T. P. Henriksen T. Lang J. Emenius J. Klevebrant T. Nilsson Å. Atmos. Environ. 2015;107:44–51. doi: 10.1016/j.atmosenv.2015.02.025. [DOI] [Google Scholar]
- Folli A. Bloh J. Z. Strøm M. Pilegaard Madsen T. Henriksen T. Macphee D. E. J. Phys. Chem. Lett. 2014;5:830–832. doi: 10.1021/jz402704n. [DOI] [PubMed] [Google Scholar]
- Dong X. Li J. Xing Q. Zhou Y. Huang H. Dong F. Appl. Catal., B. 2018;232:69–76. doi: 10.1016/j.apcatb.2018.03.054. [DOI] [Google Scholar]
- Cui W. Li J. Sun Y. Wang H. Jiang G. Lee S. C. Dong F. Appl. Catal., B. 2018;237:938–946. doi: 10.1016/j.apcatb.2018.06.071. [DOI] [Google Scholar]
- Folli A. Bloh J. Z. Armstrong K. Richards E. Murphy D. M. Lu L. Kiely C. J. Morgan D. J. Smith R. I. Mclaughlin A. C. Macphee D. E. ACS Catal. 2018:6927–6938. doi: 10.1021/acscatal.8b00521. [DOI] [Google Scholar]
- Bloh J. Z. Dillert R. Bahnemann D. W. Phys. Chem. Chem. Phys. 2014;16:5833–5845. doi: 10.1039/C3CP55136A. [DOI] [PubMed] [Google Scholar]
- Yang L. Hakki A. Wang F. Macphee D. E. ACS Appl. Mater. Interfaces. 2017;9:17034–17041. doi: 10.1021/acsami.7b01989. [DOI] [PubMed] [Google Scholar]
- Patzsch J. Folli A. Macphee D. E. Bloh J. Z. Phys. Chem. Chem. Phys. 2017;19:32678–32686. doi: 10.1039/C7CP05960D. [DOI] [PubMed] [Google Scholar]
- Mills A. Elouali S. J. Photochem. Photobiol., A. 2015;305:29–36. doi: 10.1016/j.jphotochem.2015.03.002. [DOI] [Google Scholar]
- Kamiya K. Miura S. Hashimoto K. Irie H. Electrochemistry. 2011;79:793–796. doi: 10.5796/electrochemistry.79.793. [DOI] [Google Scholar]
- Liu M. Qiu X. Miyauchi M. Hashimoto K. J. Am. Chem. Soc. 2013;135:10064–10072. doi: 10.1021/ja401541k. [DOI] [PubMed] [Google Scholar]
- Nishikawa M. Mitani Y. Nosaka Y. J. Phys. Chem. C. 2012;116:14900–14907. doi: 10.1021/jp3020657. [DOI] [PubMed] [Google Scholar]
- Nishikawa M. Takanami R. Nakagoshi F. Suizu H. Nagai H. Nosaka Y. Appl. Catal., B. 2014;160–161:722–729. doi: 10.1016/j.apcatb.2014.05.020. [DOI] [Google Scholar]
- Wang C. Zhang X. Liu Y. Appl. Surf. Sci. 2015;358:28–45. doi: 10.1016/j.apsusc.2015.08.055. [DOI] [Google Scholar]
- Irie H. Miura S. Kamiya K. Hashimoto K. Chem. Phys. Lett. 2008;457:202–205. doi: 10.1016/j.cplett.2008.04.006. [DOI] [Google Scholar]
- International Organization for Standardization, ISO 22197-1: Fine ceramics (advanced ceramics, advanced technical ceramics) – Test method for air-purification performance of semiconducting photocatalytic materials - Part 1 : Removal of nitric oxide, International organization for standardization technical report, 2007 [Google Scholar]
- Ifang S. Gallus M. Liedtke S. Kurtenbach R. Wiesen P. Kleffmann J. Atmos. Environ. 2014;91:154–161. doi: 10.1016/j.atmosenv.2014.04.001. [DOI] [Google Scholar]
- Engel A. Glyk A. Hülsewig A. Große J. Dillert R. Bahnemann D. W. Chem. Eng. J. 2015;261:88–94. doi: 10.1016/j.cej.2014.03.040. [DOI] [Google Scholar]
- Stoll S. Schweiger A. J. Magn. Reson. 2006;178:42–55. doi: 10.1016/j.jmr.2005.08.013. [DOI] [PubMed] [Google Scholar]
- Patzsch J. Bloh J. Z. Catal. Today. 2018;300:2–11. doi: 10.1016/j.cattod.2017.07.010. [DOI] [Google Scholar]
- Castner Jr. T. Newell G. Holton W. Slichter C. J. Chem. Phys. 1960;32:668–673. doi: 10.1063/1.1730779. [DOI] [Google Scholar]
- Domracheva N. Pyataev A. Manapov R. Gruzdev M. Chervonova U. Kolker A. Eur. J. Inorg. Chem. 2011:1219–1229. doi: 10.1002/ejic.201001157. [DOI] [Google Scholar]
- Folli A. Bloh J. Z. Lecaplain A. Walker R. Macphee D. E. Phys. Chem. Chem. Phys. 2015;17:4849–4853. doi: 10.1039/C4CP05521G. [DOI] [PubMed] [Google Scholar]
- Howe R. F. Grätzel M. J. Phys. Chem. 1985;89:4495–4499. doi: 10.1021/j100267a018. [DOI] [Google Scholar]
- Micic O. I. Zhang Y. Cromack K. R. Trifunac A. D. Thurnauer M. C. J. Phys. Chem. 1993;97:7277–7283. doi: 10.1021/j100130a026. [DOI] [Google Scholar]
- Jenkins C. A. Murphy D. M. J. Phys. Chem. B. 1999;103:1019–1026. doi: 10.1021/jp982690n. [DOI] [Google Scholar]
- Micic O. I. Zhang Y. Cromack K. R. Trifunac A. D. Thurnauer M. C. J. Phys. Chem. 1993:13284–13288. doi: 10.1021/j100152a036. [DOI] [Google Scholar]
- Ohko Y. Nakamura Y. Fukuda A. Matsuzawa S. Takeuchi K. J. Phys. Chem. C. 2008;112:10502–10508. doi: 10.1021/jp802959c. [DOI] [Google Scholar]
- Neubert S. Mitoraj D. Shevlin S. A. Pulisova P. Heimann M. Du Y. Goh G. K. L. Pacia M. Kruczała K. Turner S. Macyk W. Guo Z. X. Hocking R. K. Beranek R. J. Mater. Chem. A. 2016;4:3127–3138. doi: 10.1039/C5TA07036H. [DOI] [Google Scholar]
- Ribera A. Arends I. W. C. E. de Vries S. Pérez-Ramírez J. Sheldon R. A. J. Catal. 2000;195:287–297. doi: 10.1006/jcat.2000.2994. [DOI] [Google Scholar]
- Bordiga S. Buzzoni R. Geobaldo F. Lamberti C. Giamello E. Zecchina A. Leofanti G. Petrini G. Tozzola G. Vlaic G. J. Catal. 1996;158:486–501. doi: 10.1006/jcat.1996.0048. [DOI] [Google Scholar]
- Liu J. ACS Catal. 2017;7:34–59. doi: 10.1021/acscatal.6b01534. [DOI] [Google Scholar]
- Towle S. N. Brown G. E. Parks G. A. J. Colloid Interface Sci. 1999;217:299–311. doi: 10.1006/jcis.1999.6264. [DOI] [PubMed] [Google Scholar]
- Wang Y. Sun H. Tan S. Feng H. Cheng Z. Zhao J. Zhao A. Wang B. Luo Y. Yang J. Hou J. G. Nat. Commun. 2013;4:2214. doi: 10.1038/ncomms3214. [DOI] [PMC free article] [PubMed] [Google Scholar]
- Neubert S. Pulisova P. Wiktor C. Weide P. Mei B. Guschin D. A. Fischer R. A. Muhler M. Beranek R. Catal. Today. 2014;230:97–103. doi: 10.1016/j.cattod.2013.11.046. [DOI] [Google Scholar]
- Jin Q. Fujishima M. Tada H. J. Phys. Chem. C. 2011;115:6478–6483. doi: 10.1021/jp201131t. [DOI] [Google Scholar]
- Schneider J. Bahnemann D. W. J. Phys. Chem. Lett. 2013;4:3479–3483. doi: 10.1021/jz4018199. [DOI] [Google Scholar]
- Barbusinski K. Ecol. Chem. Eng. S. 2009;16:347–358. [Google Scholar]
- Conocchioli T. J. Hamilton E. J. Sutin N. J. Am. Chem. Soc. 1965;87:926–927. doi: 10.1021/ja01082a050. [DOI] [Google Scholar]
- Herold S. Rehmann F.-J. K. Free Radical Biol. Med. 2003;34:531–545. doi: 10.1016/S0891-5849(02)01355-2. [DOI] [PubMed] [Google Scholar]
- Herold S. Exner M. Nauser T. Biochemistry. 2001;40:3385–3395. doi: 10.1021/bi002407m. [DOI] [PubMed] [Google Scholar]
- Li R. Zhang F. Wang D. Yang J. Li M. Zhu J. Zhou X. Han H. Li C. Nat. Commun. 2013;4:1432. doi: 10.1038/ncomms2401. [DOI] [PubMed] [Google Scholar]
- Hurum D. C. Agrios A. G. Gray K. A. Rajh T. Thurnauer M. C. J. Phys. Chem. B. 2003;107:4545–4549. doi: 10.1021/jp0273934. [DOI] [Google Scholar]
- Sun D. Yang W. Zhou L. Sun W. Li Q. Shang J. K. Appl. Catal., B. 2016;182:85–93. doi: 10.1016/j.apcatb.2015.09.005. [DOI] [Google Scholar]
- Bae E. Murakami N. Ohno T. J. Mol. Catal. A: Chem. 2009;300:72–79. doi: 10.1016/j.molcata.2008.10.048. [DOI] [Google Scholar]
- Goldstein S. Lind J. Merényi G. Chem. Rev. 2005;105:2457–2470. doi: 10.1021/cr0307087. [DOI] [PubMed] [Google Scholar]
- Koppenol W. H. Bounds P. L. Nauser T. Kissner R. Rüegger H. Dalton Trans. 2012;41:13779. doi: 10.1039/C2DT31526B. [DOI] [PubMed] [Google Scholar]
- Mothes F. Ifang S. Gallus M. Golly B. Boréave A. Kurtenbach R. Kleffmann J. George C. Herrmann H. Appl. Catal., B. 2018;231:161–172. doi: 10.1016/j.apcatb.2018.03.010. [DOI] [Google Scholar]
- Jensen M. P. Riley D. P. Inorg. Chem. 2002;41:4788–4797. doi: 10.1021/ic011089s. [DOI] [PubMed] [Google Scholar]
- Sharma S. K. Schaefer A. W. Lim H. Matsumura H. Moënne-Loccoz P. Hedman B. Hodgson K. O. Solomon E. I. Karlin K. D. J. Am. Chem. Soc. 2017;139:17421–17430. doi: 10.1021/jacs.7b08468. [DOI] [PMC free article] [PubMed] [Google Scholar]
- Bloh J. Z. J. Phys. Chem. C. 2017;121:844–851. doi: 10.1021/acs.jpcc.6b09808. [DOI] [Google Scholar]
- Bloh J. Z. Dillert R. Bahnemann D. W. J. Phys. Chem. C. 2012;116:25558–25562. doi: 10.1021/jp307313z. [DOI] [Google Scholar]
Associated Data
This section collects any data citations, data availability statements, or supplementary materials included in this article.


