Abstract
Porous graphitic carbon nitride (P-g-C3N4) thin sheets were fabricated by a one-step calcination of a mixture of urea, melamine, and ammonia chloride at 550 °C. P-g-C3N4 showed 48% higher photocatalytic H2 production from methanol aqueous solution than conventional urea-derived graphitic carbon nitride (g-C3N4) because the existence of numerous pores reduces the recombination rate of charge carriers. In order to further enhance the photocatalytic activity, TiO2 was uniformly deposited on P-g-C3N4 by 60–300 cycles of atomic layer deposition (ALD) to form the TiO2@P-g-C3N4 composite. They exhibited much higher photocatalytic hydrogen production rates than both TiO2 and P-g-C3N4. Among all composites, the sample deposited with 180 ALD cycles of TiO2 showed the highest H2 production because of optimal diffusion length for electrons and holes. It also performed better than the sample of g-C3N4 deposited with 180 cycles of TiO2.
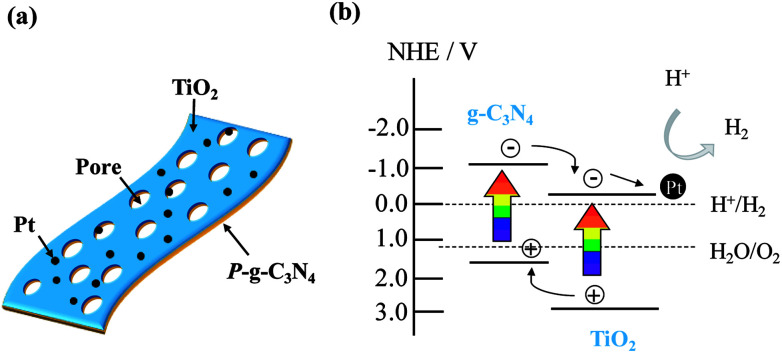
Schematic of Pt-loaded TiO2@P-g-C3N4 2D/2D heterojunction structure and the proposed mechanism of charge transfer for photocatalytic H2 evolution.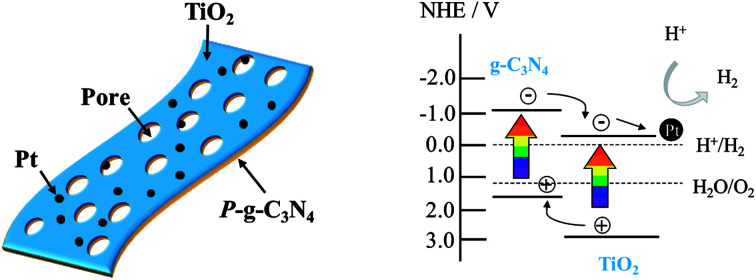
1. Introduction
Graphitic carbon nitride, a thermally and chemically stable, cheap, and abundant semiconductor material, is a visible light-driven photocatalyst. It is considered as a promising material for producing hydrogen from water splitting. Wang et al.1 first discovered that this metal-free photocatalyst could be easily obtained by pyrolysis of cyanamide and it could generate H2 from water under visible light illumination. However, the water splitting efficiency is usually limited by fast recombination of charge pairs.2,3 Furthermore, it is difficult to generate a large amount of H2 under visible light illumination by one-step photoexcitation because a good photocatalyst needs to fulfill three requirements: suitable band-edge positions, appropriate band gap, and long-term durability.4,5 In order to improve the water splitting efficiency, a heterostructure composed of a pair of photocatalysts may fulfill the requirements and also decrease the recombination rate of charge carriers.6,7
There are several oxide candidates to couple with g-C3N4 to enhance the photocatalytic H2 production, such as WO3,8,9 TiO2,10–12etc. There have been some reports on the TiO2/g-C3N4 system.10–17 However, most of the studies employed TiO2 as a support to deposit g-C3N4. Previously, we have successfully deposited TiO2 thin films on different supports for photocatalytic applications.18–20 In this study, TiO2 film was deposited on porous g-C3N4 by ALD with various thicknesses, and the physical and chemical properties were investigated. The aim is to use TiO2/g-C3N4 composite as a photocatalyst to enhance H2 evolution from water under solar light irradiation.
2. Experimental
A. Sample preparation
5 g urea (Showa Chemical, 99.0%), 2.5 g melamine (Showa Chemical, 99.5%), and 5 g ammonium chloride (Showa Chemical, 99.5%) were grinded by an agate mortar and then placed in an Al2O3 crucible with a cover. It was heated in a muffle furnace at 550 °C for 4 h in air. A yellow solid powder, P-g-C3N4, was obtained after cooling to room temperature. The conventional g-C3N4 was also prepared by heating urea under the same condition. To prepare TiO2@P-g-C3N4 composite, the P-g-C3N4 powder was first added into ethanol, ultrasonically vibrated for 30 min, and the solution was then dropped on a silicon wafer, followed by drying at 80 °C. Next, the sample was placed into the ALD chamber, and TiO2 film was deposited onto the P-g-C3N4 with different cycle numbers. The ALD was conducted in a home-built horizontal-flow type reactor with the substrate temperature maintained at 100 °C, as described previously.21 TiCl4 and H2O were used as the precursors for titanium and oxygen, respectively. Each cycle consisted of a TiCl4 pulse for 0.2 s, a purge with N2 for 7 s, followed by a H2O pulse for 0.1 s, and a second purge with N2 for 7 s to remove excess precursor and by-products. Hereafter, Ti60–CN, Ti180–CN, and Ti300–CN stand for the samples of P-g-C3N4 deposited with TiO2 by 60, 180, and 300 cycles of ALD, respectively. The as-deposited TiO2 was amorphous, so the samples were further annealed in a rapid thermal annealing (RTA) system at 450 °C for 2 min in Ar to obtain anatase phase. For photocatalysis test, Pt nanoparticles were further deposited on the samples by 30 cycles of ALD as a cocatalyst. Oxygen and trimethyl (methylcyclopentadienyl) platinum (iv) (MeCpPtM3) were used as the precursors. Each cycle consisted of a MeCpPtM3 pulse for 0.5 s, a purge with N2 for 15 s, followed by an oxygen pulse for 2 s, and a second purge with N2 for 20 s. The process of depositing Pt by ALD has also been described previously.22
B. Sample characterization
The crystalline structure of the samples was evaluated by X-ray diffraction (XRD, D2, Perkiment) with Cu Kα radiation. The surface morphologies and elementary compositions of the specimens were examined by a field emission scanning electron microscope (SEM, Hitachi SU-8010) equipped with an energy dispersive X-ray (EDX) spectrometer. High-resolution transmission electron microscopic (HRTEM) and transmission electron microscopic (TEM) examinations were conducted at 200 kV by JEM F200 (JEOL) and TEM 2010 (JEOL), respectively. The specific surface area was estimated by using the Brunauer–Emmett–Teller (BET) method on a TriStar 3000 gas adsorption analyzer with the degassing temperature at 120 °C for 5 h. To examine the growth rate of TiO2, the film was deposited by the same ALD process on silicon wafer and the thickness was detected by an ellipsometer (Sentech SER800). Fourier transform infrared spectroscopic (FTIR, Thermo iS10) analysis was conducted using KBr pallet samples. The chemical states on the surface were determined by X-ray photoelectron spectroscopy (XPS, PHI 5000 Versaprobe II, Ulvac PHI Inc.) with Al Kα radiation. The photoelectrons were collected into the analyzer with a pass energy of 23.5 eV and at a collection step 0.1 eV. Chemical shifts resulting from the charging effect were calibrated by fixing the C 1s peak of the surface carbonaceous contaminants at 284.8 eV. The loading of Pt was analyzed by inductively coupled plasma-mass spectrometer (ICP-MS, Agilent 7500ce). Thermogravimetric analysis (TGA) at a heating rate of 20 °C min−1 was carried out on a Netzsch STA 409 analyzer in Ar. The absorption edges were analyzed using UV-vis spectrometry (HITACHI 3010) in a diffused reflectance mode with a scanning range from 750 to 350 nm. Aluminum oxide (Al2O3), which is considered to exhibit total reflections, was used as the reference for all of the measurements. The diffused reflectance was then converted into absorption according to the Kubelka–Munk formula. Confocal photoluminescence (PL) spectroscopy was conducted using a He–Cd laser with the wavelength of 325 nm as the excitation light source.
C. Photocatalytic hydrogen evolution
The photocatalytic H2 evolution reaction was carried out in a quartz cell using a 300 W Xe lamp as the light source with a solar filter. The photocatalyst sample (5 mg) was immersed into a 25 mL aqueous methanol solution (20 vol%) under magnetic stirring. The evolved H2 gas was collected and analyzed by a gas chromatograph (GC, Shimadzu GC-2014) at 100 °C using a 5 Å molecular sieve in the column and argon as the carrier gas.
D. Photoelectrochemical measurement
The photoelectrochemical measurement was conducted by an electrochemical workstation (Autolab PGSTAT128N) using the prepared samples as the working electrode with an active area of 1.5 cm2, Ag/AgCl electrode as the reference electrode, and Pt as the counter electrode. The electrolyte was 0.5 M Na2SO4 aqueous solution, and the light source was a 150 W Xe lamp with a solar filter. The preparation of working electrodes from the powder samples is as follows: first, 0.15 g powder was well dispersed into 1.5 mL 50 vol% ethanol aqueous solution. Next, it was added with 0.5 mL isobutanol (Echo Chemical), followed by 0.06 g polyethylene glycol (PEG, Alfa Aesar). The slurry was then screen-printed on a fluorine-doped tin oxide (FTO) glass. After drying, the working electrode was further heated at 450 °C for 30 min. For preparation of the working electrode of TiO2 sample, a TiO2 thin film was deposited on FTO glass by 180 cycles of ALD, which was further annealed at 450 °C for 2 min in Ar by the RTA system.
3. Results and discussion
A. Comparison of g-C3N4 and P-g-C3N4 characteristics
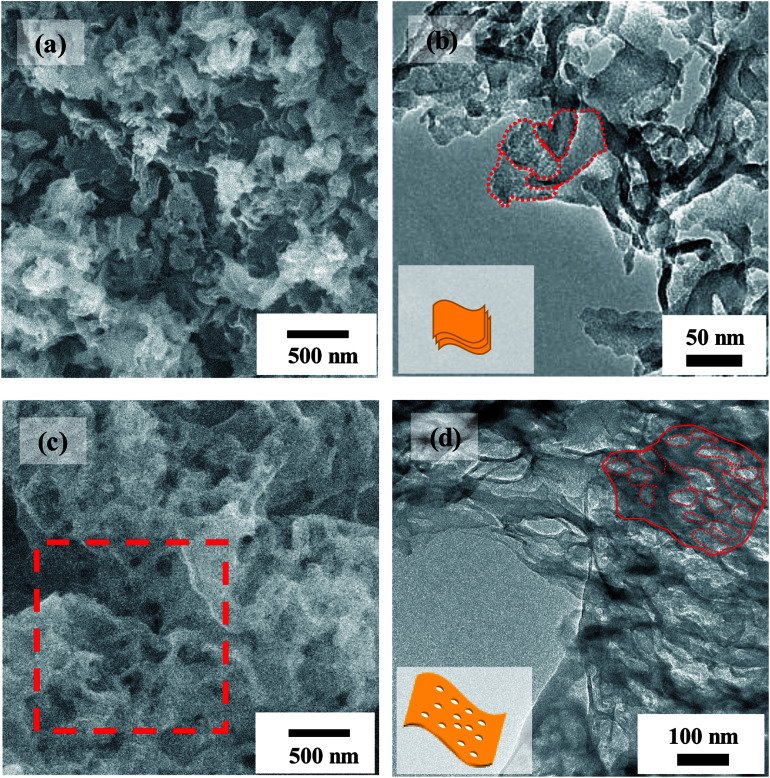
Fig. 1 shows the comparison of g-C3N4 and P-g-C3N4 in morphology. Both SEM and TEM images indicate that g-C3N4 is in the form of flat film consisting of many overlapped nanosheets, whereas P-g-C3N4 is formed as a large-area thin sheet full of pores. The schematic illustrations of the nanostructure of g-C3N4 and P-g-C3N4 are shown in the insets of Fig. 1(b) and (d), respectively.
Fig. 1. (a) SEM and (b) TEM images of g-C3N4. (c) SEM and (d) TEM images of P-g-C3N4. The selected region in red dashed square in (c) is enlarged and displayed in Fig. 4(a). The insets in (b) and (d) are schematic illustrations of overlapped nanosheets and porous sheet in the marked regions of g-C3N4 and P-g-C3N4, respectively.
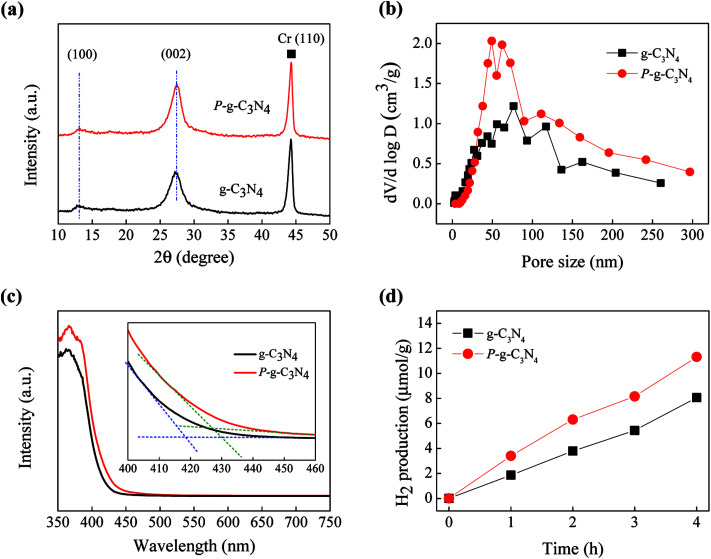
The XRD patterns of g-C3N4 and P-g-C3N4 are shown in Fig. 2(a). There are two distinct diffraction peaks. The stronger XRD peak (002) at 27.4° is due to inter-planar stacking of the conjugated aromatic system, and the other weak peak (100) at 13.1° is attributed to an in-plan structural packing motif.23–26 There is no peak shift of porous structure, as calibrated by the Cr (110) peak. However, compared to g-C3N4, the smaller full width at half maximum (FWHM) and higher intensity of (002) peak of P-g-C3N4 implies a better crystallinity and more layers of P-g-C3N4.27,28Fig. 2(b) shows the pore size distribution of the two carbon nitride samples. Because of the addition of NH4Cl, numerous pores in the range of 40 to 80 nm were formed in P-g-C3N4 by gas release during the thermal treatment.23
Fig. 2. Comparison between P-g-C3N4 and g-C3N4. (a) XRD patterns, (b) pore size distributions, (c) UV-vis diffuse reflectance spectra, and (d) solar-driven H2 evolution from 20 vol% methanol aqueous solution.
Fig. 2(c) shows the optical absorption spectra of the two samples. The absorption edges are at about 418 and 427 nm, corresponding to band gaps of 2.97 and 2.90 eV, for g-C3N4 and P-g-C3N4, respectively. The larger band gap of g-C3N4 may be due to the quantum effect because it is in the form of thinner nanosheets, as also evidenced in the XRD pattern.14,29,30Fig. 2(d) shows that P-g-C3N4 generates 48% higher average amount of H2 than g-C3N4 because of the existence of numerous pores that could shorten the diffusion length of charge carriers, which may lead to lower recombination rate.14,31,32 Therefore, in this study P-g-C3N4 was used as a support to deposit TiO2 with different ALD cycles for further experiments.
B. Characteristics of TiO2@P-g-C3N4 composites
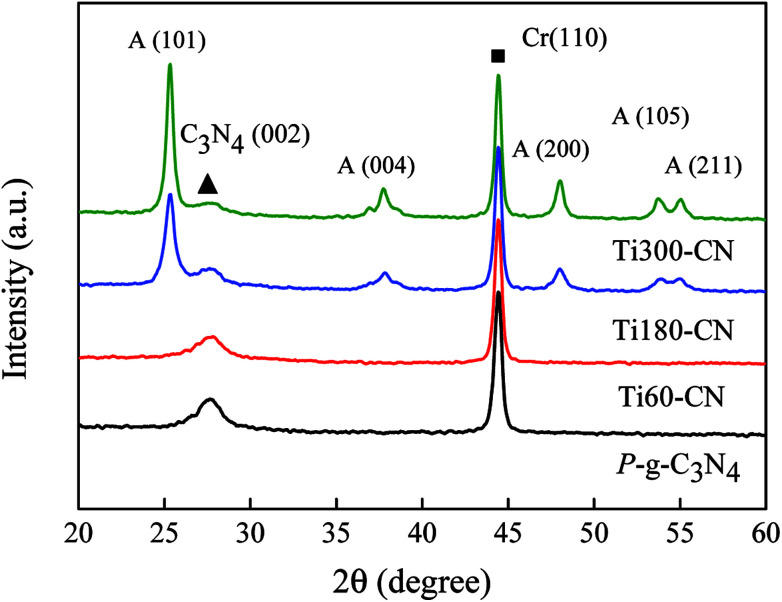
The XRD patterns of the samples are illustrated in Fig. 3. Cr powder is used as an internal standard to calibrate the position and intensity of diffraction peaks. Except Ti60–CN, in which the crystallite size of TiO2 might be too small to be observed by XRD, some new peaks from the anatase phase are present in the TiO2@P-g-C3N4 composites. The crystallite sizes of TiO2 in Ti180–CN and Ti300–CN are calculated by the Scherrer's equation and listed in Table 1. It is seen that both the peak intensity and crystallite size of the anatase phase increase with the TiO2 cycle number. There is basically no peak shift, as calibrated by the Cr (110).
Fig. 3. XRD patterns of the samples. Cr is added as an internal standard, and the symbols of square (■) and triangle (▲) show the peak positions of Cr (110) and g-C3N4 (002), respectively. The other diffraction peaks are ascribed to the anatase phase.
Crystallite size of TiO2 (101), thickness of TiO2, and specific surface area for fabricated samples.
| Sample | Crystallite size (nm) on TiO2 (101) | Thickness of TiO2 (nm) | Specific surface area (m2 g−1) |
|---|---|---|---|
| g-C3N4 | — | — | 101.1 |
| P-g-C3N4 | — | — | 79.0 |
| Ti60–CN | — | 4.05 | 55.2 |
| Ti180–CN | 9.5 | 12.64 | 41.9 |
| Ti300–CN | 16.1 | 24.69 | 27.3 |
In order to further confirm molecular structures of P-g-C3N4, TiO2, and TiO2@P-g-C3N4 composites, FTIR spectra were measured, as shown in Fig. S1.† For pure P-g-C3N4, the absorption bands between 1200–1700 cm−1 are ascribed to the typical stretching modes of CN heterocycles,23,25,28 and the broad bands in the range of 3000–3500 cm−1 are assigned to the stretching vibration modes of O–H or N–H.23,25,28 The peak at 810 cm−1 can be assigned to the out-of-plane bending vibration characteristics of the triazine or heptazine rings, and the one at 888 cm−1 is related to deformation mode of N–H.23,25,28 For pure TiO2, the absorption band at 400–800 cm−1 is due to the stretching vibration modes of Ti–O–Ti.11,16 For the three TiO2@P-g-C3N4 composites, their spectra can be considered as the combination of TiO2 and g-C3N4 spectra, confirming the formation of a heterostructure.
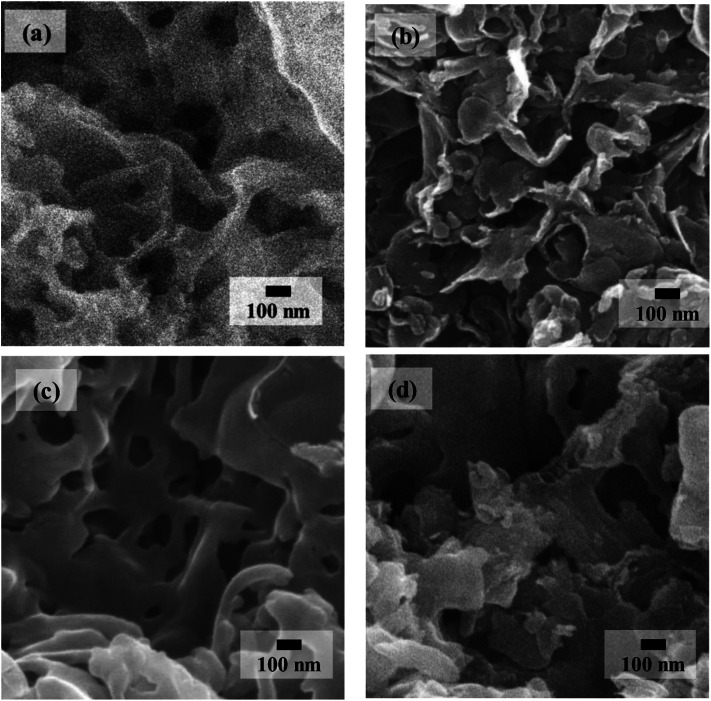
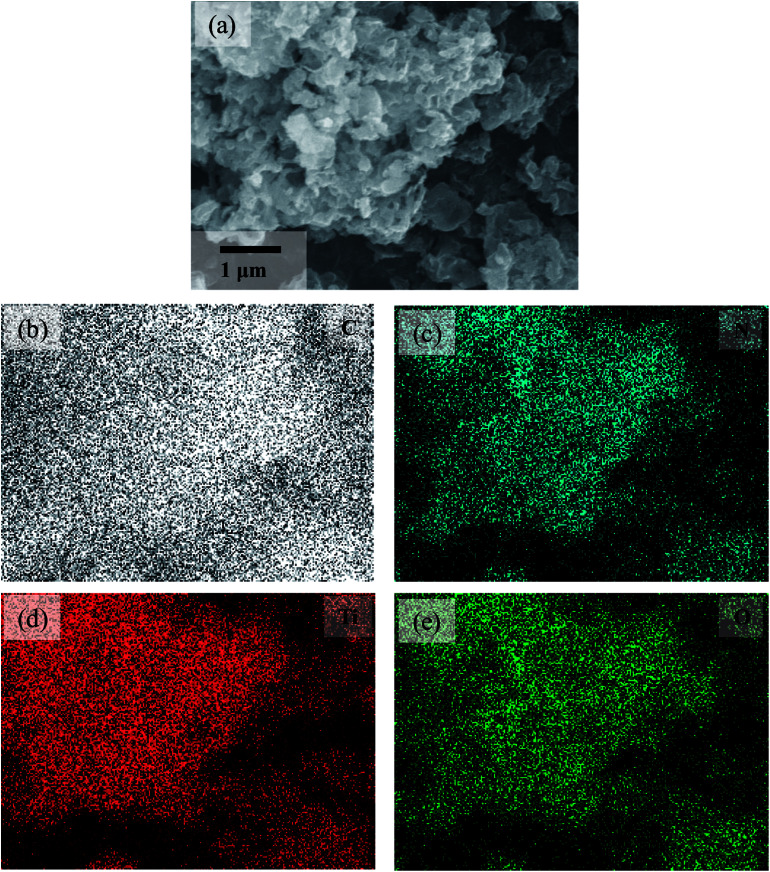
Fig. 4 shows the comparison of SEM morphologies between P-g-C3N4 and TiO2@P-g-C3N4 composites. Ti60–CN (Fig. 4(b)) shows rougher surface, and the sheet structure can be better resolved. As the cycle number of TiO2 increases to 180 cycles (Fig. 4(c)), the structure is still porous and becomes smoother, similar to that of P-g-C3N4, Fig. 4(a). When the cycle number is further raised to 300, the porous structure becomes less clear, as shown in Fig. 4(d), presumably because the pores are mostly filled up with TiO2. EDX mapping of the Ti180–CN composite displays the distribution of the constituent elements, as shown in Fig. 5. Four elements (C, N, Ti, O) are uniformly dispersed in the Ti180–CN composite, confirming that TiO2 thin film was indeed well deposited on the porous g-C3N4 by ALD.
Fig. 4. SEM images of the samples. (a) As-prepared P-g-C3N4 enlarged from Fig. 1(c). (b) Ti60–CN, (c) Ti180–CN, and (d) Ti300–CN. All composites were treated at 450 °C for 2 min by RTA in Ar.
Fig. 5. EDX mapping of the Ti180–CN sample. (a) SEM micrograph and the elemental mappings of (b) C, (c) N, (d) Ti, and (e) O.
The HRTEM images and the selected area electron diffraction (SAED) patterns of P-g-C3N4 and Ti180–CN were taken to further evidence the presence of TiO2 on P-g-C3N4, as shown in Fig. S2.† Based on the SAED pattern, well-crystallized TiO2 thin film is deposited on P-g-C3N4. Furthermore, the inset HRTEM image in Fig. S2(b)† evidences a lattice spacing of 0.352 nm, corresponding to the (101) crystal plane of anatase.
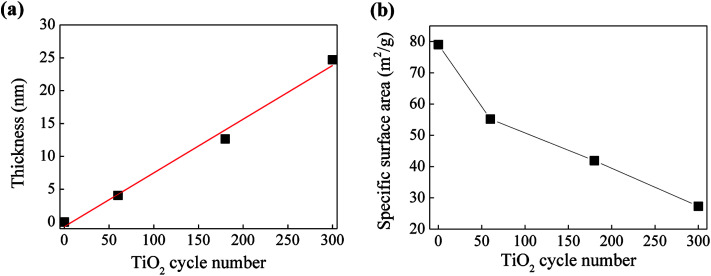
In order to determine the real molar ratios of TiO2/C3N4 in TiO2@P-g-C3N4 composites, TGA analysis was performed from 30 °C to 800 °C to measure the weight loss due to decomposition of carbon nitride, as shown in Fig. S3.† For pure P-g-C3N4, it can be completely decomposed when the temperature exceeds 720 °C. For TiO2@P-g-C3N4 composites, carbon nitride starts to decompose at around 500 °C, and could be totally removed when the temperature is above 635 °C. Therefore, the real contents of TiO2 in the samples can be calculated, as listed in Table 2. It is seen that the molar ratio of TiO2/C4N4 is linearly dependent on the cycle number. Fig. 6 shows the effects of cycle number on the thickness of TiO2 and specific surface area of the composites. The thicknesses of TiO2 films on silicon wafer were measured and listed in Table 1, and the growth rate was calculated to be approximately 0.79 Å per cycle. The specific surface areas were obtained by the BET method and also listed in Table 1. For the TiO2@P-g-C3N4 composites, the value decreases from 55.2 to 27.3 m2 g−1 when the TiO2 cycle number increases from 60 to 300 cycles. With the growth rate of 0.79 Å per cycle, the film thickness of TiO2 from 300 cycles of ALD can reach 23.7 nm (the actual thickness was 24.69 nm). This implies that the pores in the size of ∼50 nm would be almost filled up with TiO2, resulting in reduced specific surface area.
Molar ratios of TiO2/C3N4 for TiO2@P-g-C3N4 composites determined by TGA. x and y are the sample weights measured at 720 °C and 450 °C, respectively.
| Sample | x (TiO2, wt%) | y (wt%) | y–x (C3N4, wt%) | TiO2/C3N4 (wt ratio) | TiO2/C3N4 (molar ratio) |
|---|---|---|---|---|---|
| Ti60–CN | 21.12 | 93.43 | 72.31 | 0.29 | 0.34 |
| Ti180–CN | 44.67 | 92.58 | 47.91 | 0.93 | 1.07 |
| Ti300–CN | 57.30 | 93.96 | 36.66 | 1.56 | 1.80 |
Fig. 6. Dependence of (a) thickness of TiO2 and (b) specific surface area of the composites on TiO2 cycle number.
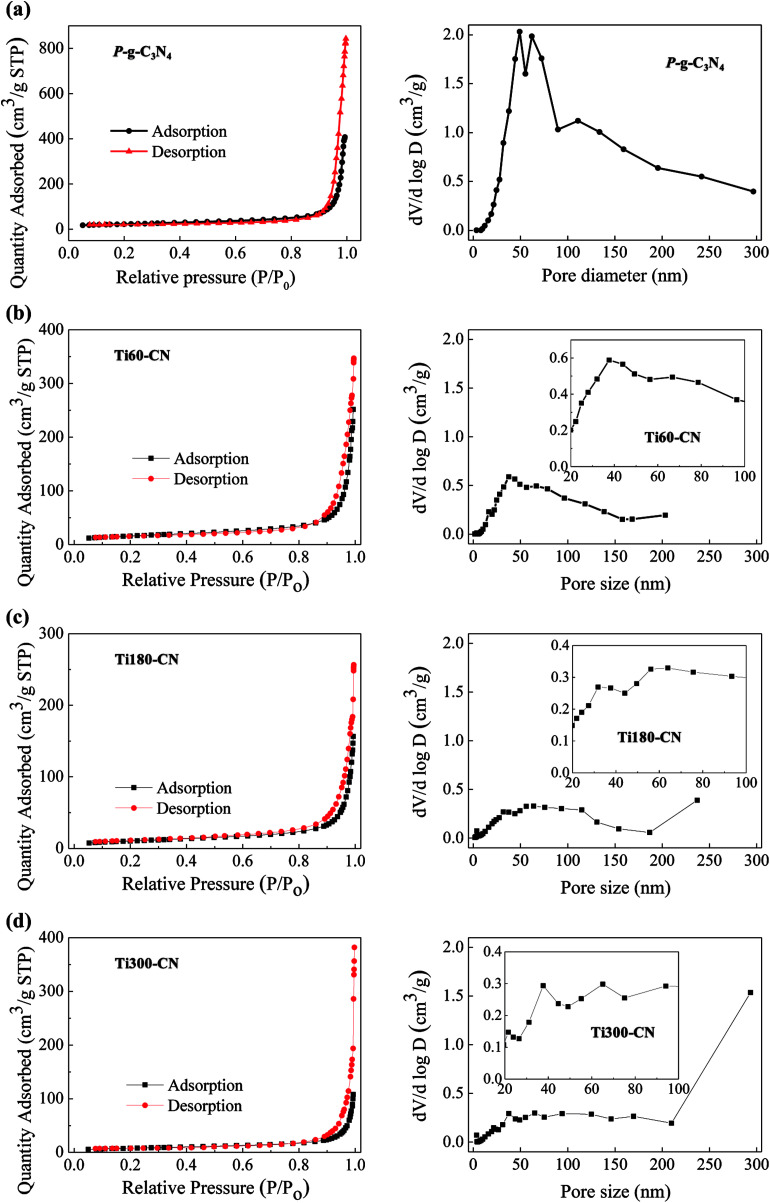
The N2 adsorption–desorption isotherms and the corresponding pore size distribution curves of the samples are shown in Fig. 7. P-g-C3N4 exhibits type IV curves based on the six isotherm types classified by the International Union of Pure and Applied Chemistry (IUPAC).33 It indicates the presence of mesopores.34 Furthermore, it also exhibits H3 adsorption hysteresis loop which may be referred to the existence of slit-like pores in the porous structure of P-g-C3N4.33 This is exactly what was observed in Fig. 1(d). Meanwhile, based on the pore-size distribution both meso and macropores are present in P-g-C3N4,34 especially a large fraction of pores are in the size of 40–80 nm. Fig. 7(b)–(d) show that the isothermal curve types of TiO2@P-g-C3N4 composites are all similar to that of P-g-C3N4. However, the volume of pores in the diameter of 20 to 100 nm decreases as the TiO2 cycle number increases.
Fig. 7. Adsorption–desorption isotherms (left) and pore-size distributions (right) of (a) P-g-C3N4, (b) Ti60–CN, (c) Ti180–CN, and (d) Ti300–CN. The insets show the magnified pore size distributions in the range of 20–100 nm.
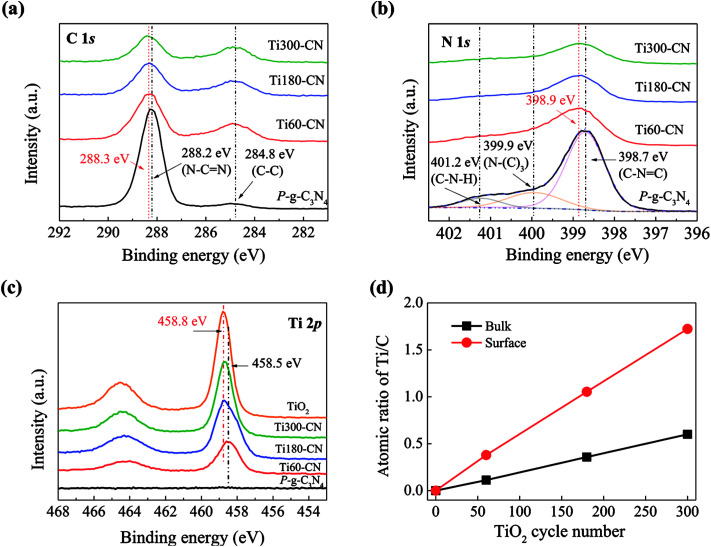
To investigate the interaction between TiO2 and P-g-C3N4, XPS analysis was performed. For pure P-g-C3N4, the bonding energies of C 1s (Fig. 8(a)) at 288.2 and 284.8 eV correspond to N–C N and C–C, respectively, and the bonding energies of N 1s (Fig. 8(b)) at 398.7 eV, 399.9 eV, and 401.2 eV correspond to C–N C, N–(C)3, and C–N–H, respectively.26,28,29,35 The peak of N–C N in TiO2@P-g-C3N4 composites has slightly shifted to higher energies than the peak in pure P-g-C3N4, which might be ascribed to the bonding between TiO2 and g-C3N4.36 For pure TiO2, the binding energy of Ti 2p3/2 is 458.8 eV. The Ti 2p spectra (Fig. 8(c)) show that the intensity and energy of Ti 2p3/2 increase with the cycle number of TiO2, which might be ascribed to the weaker interaction with g-C3N4 as the film becomes thicker. To further understand the characteristic of TiO2 on P-g-C3N4, the atomic ratios of Ti/C on the sample surface analyzed by XPS and in the bulk calculated from the molar ratios of TiO2/C3N4 by TGA are compared in Fig. 8(d). Both surface and bulk ratios of Ti/C increase linearly with the TiO2 cycle number. Furthermore, the surface ratio is three times higher than the bulk ratio. All these results evidence that TiO2 is present uniformly on P-g-C3N4 in the form of thin film.
Fig. 8. High-resolution XPS spectra of (a) C 1s, (b) N 1s, and (c) Ti 2p. (d) The bulk and surface ratio of Ti/C with the dependence of TiO2 cycle number.
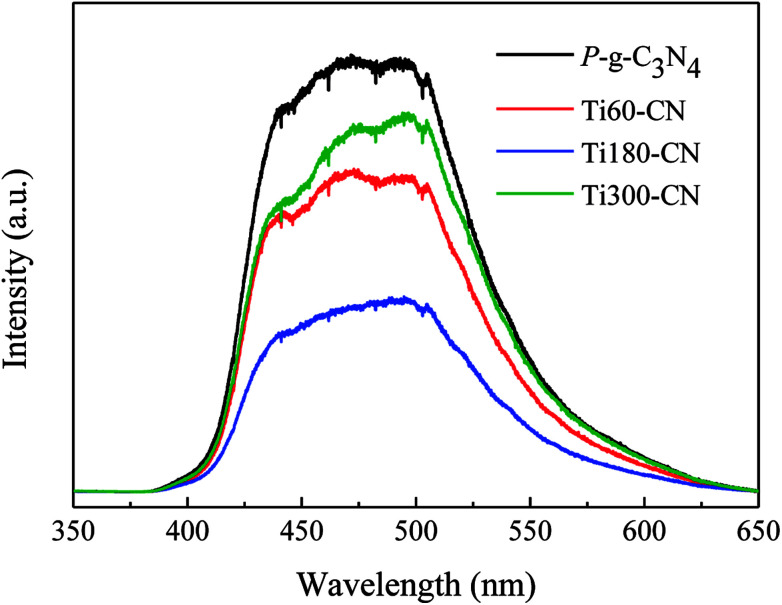
The absorption edges of TiO2@P-g-C3N4 composites remain about the same as that of P-g-C3N4, although a slight blue shift with increasing the TiO2 cycle number can be barely resolved, as shown in Fig. S4.† In order to better understand the photocatalytic mechanism, the PL analysis has been commonly used to study the recombination behavior of photo-excited electron–hole pairs. Fig. 9 displays that P-g-C3N4 exhibits a broad and strong PL emission peak in the range of 400 to 600 nm, corresponding to the recombination of charge carriers of carbon nitride. Compared to P-g-C3N4, Ti60–CN shows a lower emission peak in the same range of wavelength, which indicates a lower recombination rate of charge carriers. Ti180–CN shows the lowest emission peak among the TiO2@P-g-C3N4 samples, which is ascribed to the suitable thickness that provides more efficient transport of electrons. Therefore, the TiO2@P-g-C3N4 heterostructure would enhance the photocatalytic activity due to the lower recombination rate, and the activity is related to the thickness of the TiO2 film.
Fig. 9. PL spectra of pure P-g-C3N4 and TiO2@P-g-C3N4 composites. All samples were deposited with Pt by 30 ALD cycles.
C. Hydrogen generation from the TiO2@P-g-C3N4 composites
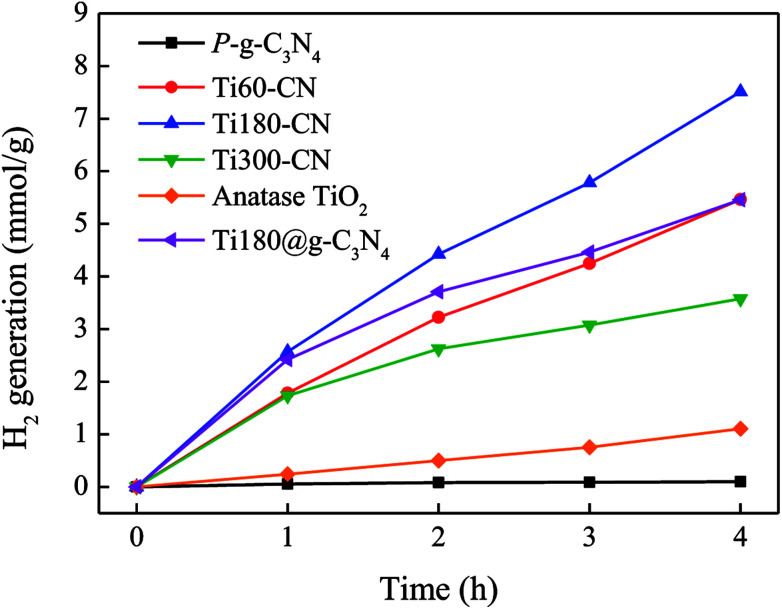
The hydrogen generation rates from the methanol aqueous solution by the TiO2@P-g-C3N4 composites loaded with 30 cycles of Pt were evaluated under 300 W Xe lamp illumination with a solar filter, as shown in Fig. 10. With 30 cycles of Pt on TiO2@P-g-C3N4, the Pt loading is ∼0.3 wt%, similar to our previous result.22 Commercial anatase TiO2 (Riedel-de Haën, 99%) and pure P-g-C3N4, both were also loaded with Pt, were used as the control specimens. All of the TiO2@P-g-C3N4 composites show higher H2 production rates than anatase (0.26 mmol g−1 h−1) and P-g-C3N4 (0.03 mmol g−1 h−1). Among the TiO2@P-g-C3N4 composites, Ti180–CN shows the highest H2 production rate (1.96 mmol g−1 h−1) because of the suitable thickness (∼13 nm), consistent with prediction from the PL analysis.37,38 When an additional specimen prepared with 180 cycles of TiO2 deposited on g-C3N4 (Ti180@g-C3N4) was also tested for comparison, it is seen that Ti180–CN exhibited 31% higher H2 generation rate than Ti180@g-C3N4 (1.50 mmol g−1 h−1). It confirms that the porous structure of P-g-C3N4 indeed has enhanced photocatalytic activity.
Fig. 10. H2 evolution generation rate from 20 vol% methanol aqueous solution under 300 W Xe lamp with a solar filter. All samples were deposited with Pt by 30 ALD cycles.
To further confirm the behavior of photogenerated charge carriers, the photoelectrochemical properties of P-g-C3N4, TiO2 (180 cycles), and Ti180–CN samples were evaluated using a three-electrode cell under 150 W Xe lamp illumination with a solar filter. The result is shown in Fig. S5.† It is seen that the heterojunction structure has indeed improved the efficiency of charge carrier separation, resulting in a higher photocurrent density.
A schematic of Pt-loaded TiO2@P-g-C3N4 2D/2D (2-dimensional) structure and the mechanism for photocatalytic H2 evolution by the composite are illustrated in Fig. 11. Porous g-C3N4 thin sheet is a 2D photocatalyst, which is an ideal form to produce H2 due to fast transport rate and low recombination rate of charge carriers.7 Using ALD to deposit TiO2 uniformly on P-g-C3N4 would further improve photocatalytic activity due to fast transport rate caused by the large contact interface.39 The electrons would easily migrate to the surface and accumulate on the Pt nanoparticles to reduce H+ to H2. Therefore, TiO2@P-g-C3N4 2D/2D photocatalysts loaded with Pt nanoparticles as cocatalyst show improved H2 production under solar illumination.
Fig. 11. (a) Schematic of Pt-loaded TiO2@P-g-C3N4 2D/2D heterojunction structure. (b) Proposed mechanism of charge transfer for photocatalytic H2 evolution from Pt-loaded TiO2@P-g-C3N4.
4. Conclusion
P-g-C3N4 thin sheet was fabricated by calcining the mixture of urea, melamine, and ammonia chloride. Compared to conventional urea-derived g-C3N4 nanosheet, P-g-C3N4 shows higher H2 production efficiency, mainly attributed to enhanced optical absorption in visible light and lower recombination rate of charge carriers because of the porous structure. P-g-C3N4 was used as a template to deposit TiO2 with various thicknesses by ALD to fabricate 2D/2D heterostructure photocatalysts. The thickness of TiO2 could be precisely controlled by the cycle number with a growth rate of 0.79 Å per cycle. Because TiO2 was deposited uniformly on P-g-C3N4 in the form of thin film, the specific surface area of the composite was decreased, and the surface atomic ratio of Ti/C was three times higher than the bulk ratio. Compared to pure P-g-C3N4 and anatase TiO2, all the TiO2@P-g-C3N4 composites showed much higher hydrogen evolution rates. Among them, Ti180–CN exhibited the best performance. It also outperformed Ti180@g-C3N4. Therefore, P-g-C3N4 coupled with TiO2 to form a 2D/2D heterostructure offers promising application in photocatalysis of water to produce hydrogen.
Conflicts of interest
There are no conflicts to declare.
Supplementary Material
Acknowledgments
This work was supported by the Ministry of Science and Technology, Taiwan under the contract No. MOST 104-2221-E-007-051-MY3. We are grateful to the assistance to take TEM images by Yu-Sheng Huang in the Department of Materials Science and Engineering, National Tsing Hua University, Hsinchu, Taiwan. The BET, FTIR, and UV-vis absorbance measurements were supported by Prof. Sue-Min Chang in the Institute of Environmental Engineering, National Chiao Tung University, Hsinchu, Taiwan.
Electronic supplementary information (ESI) available. See DOI: 10.1039/c8ra05126g
References
- Wang X. C. Maeda K. Thomas A. Takanabe K. Xin G. Carlsson J. M. Domen K. Antonietti M. Nat. Mater. 2009;8:76–80. doi: 10.1038/nmat2317. [DOI] [PubMed] [Google Scholar]
- Jafari T. Moharreri E. Amin A. S. Miao R. Song W. Q. Suib S. L. Molecules. 2016;21:900. doi: 10.3390/molecules21070900. [DOI] [PMC free article] [PubMed] [Google Scholar]
- Hoffmann M. R. Martin S. T. Choi W. Y. Bahnemann D. W. Chem. Rev. 1995;95:69–96. doi: 10.1021/cr00033a004. [DOI] [Google Scholar]
- Maeda K. Higashi M. Lu D. L. Abe R. Domen K. J. Am. Chem. Soc. 2010;132:5858–5868. doi: 10.1021/ja1009025. [DOI] [PubMed] [Google Scholar]
- Maeda K. J. Photochem. Photobiol., C. 2011;12:237–268. doi: 10.1016/j.jphotochemrev.2011.07.001. [DOI] [Google Scholar]
- Li X. Yu J. G. Low J. X. Fang Y. P. Xiao J. Chen X. B. J. Mater. Chem. A. 2015;3:2485–2534. doi: 10.1039/C4TA04461D. [DOI] [Google Scholar]
- Su T. M. Shao Q. Qin Z. Z. Guo Z. H. Wu Z. L. ACS Catal. 2018;8:2253–2276. doi: 10.1021/acscatal.7b03437. [DOI] [Google Scholar]
- Martin D. J. Reardon P. J. T. Moniz S. J. A. Tang J. W. J. Am. Chem. Soc. 2014;136:12568–12571. doi: 10.1021/ja506386e. [DOI] [PubMed] [Google Scholar]
- Zhao G. X. Huang X. B. Fina F. Zhang G. Irvine J. T. S. Catal. Sci. Technol. 2015;5:3416–3422. doi: 10.1039/C5CY00379B. [DOI] [Google Scholar]
- Yan J. Q. Wu H. Chen H. Zhang Y. X. Zhang F. X. Liu S. F. Appl. Catal., B. 2016;191:130–137. doi: 10.1016/j.apcatb.2016.03.026. [DOI] [Google Scholar]
- Zhang H. Liu F. Wu H. Cao X. Sun J. H. Lei W. W. RSC Adv. 2017;7:40327–40333. doi: 10.1039/C7RA06786K. [DOI] [Google Scholar]
- Zhang Q. Wang H. Chen S. Su Y. Quan X. RSC Adv. 2017;7:13223–13227. doi: 10.1039/C7RA00039A. [DOI] [Google Scholar]
- Singh A. P. Arora P. Basu S. Mehta B. R. Int. J. Hydrogen Energy. 2016;41:5617–5628. doi: 10.1016/j.ijhydene.2016.02.029. [DOI] [Google Scholar]
- Ong W. J. Tan L. L. Ng Y. H. Yong S. T. Chai S. P. Chem. Rev. 2016;116:7159–7329. doi: 10.1021/acs.chemrev.6b00075. [DOI] [PubMed] [Google Scholar]
- Pan C. Jia J. Hu X. Y. Fan J. Liu E. Z. Appl. Surf. Sci. 2018;430:283–292. doi: 10.1016/j.apsusc.2017.07.189. [DOI] [Google Scholar]
- Wang C. L. Hu L. M. Chai B. Yan J. T. Li J. F. Appl. Surf. Sci. 2018;430:243–252. doi: 10.1016/j.apsusc.2017.08.036. [DOI] [Google Scholar]
- Ma L. N. Wang G. H. Jiang C. J. Bao H. L. Xu Q. C. Appl. Surf. Sci. 2018;430:263–272. doi: 10.1016/j.apsusc.2017.07.282. [DOI] [Google Scholar]
- Huang S. H. Wang C. C. Liao S. Y. Gan J. Y. Perng T. P. Thin Solid Films. 2016;616:151–159. doi: 10.1016/j.tsf.2016.08.003. [DOI] [Google Scholar]
- Liu K. I. Kei C. C. Mishra M. Chen P. H. Liu W. S. Perng T. P. RSC Adv. 2017;7:34730–34735. doi: 10.1039/C7RA04853J. [DOI] [Google Scholar]
- Liu K. I. Su C. Y. Perng T. P. RSC Adv. 2015;5:88367–88374. doi: 10.1039/C5RA16492C. [DOI] [Google Scholar]
- Chen H. S. Chen P. H. Kuo J. L. Hsueh Y. C. Perng T. P. RSC Adv. 2014;4:40482–40486. doi: 10.1039/C4RA06807F. [DOI] [Google Scholar]
- Wang C. C. Hsueh Y. C. Su C. Y. Kei C. C. Perng T. P. Nanotechnology. 2015;26:254002. doi: 10.1088/0957-4484/26/25/254002. [DOI] [PubMed] [Google Scholar]
- Iqbal W. Dong C. Y. Xing M. Y. Tan X. J. Zhang J. L. Catal. Sci. Technol. 2017;7:1726–1734. doi: 10.1039/C7CY00286F. [DOI] [Google Scholar]
- Yan S. C. Li Z. S. Zou Z. G. Langmuir. 2009;25:10397–10401. doi: 10.1021/la900923z. [DOI] [PubMed] [Google Scholar]
- Xu J. Y. Li Y. X. Peng S. Q. Lu G. X. Li S. B. Phys. Chem. Chem. Phys. 2013;15:7657–7665. doi: 10.1039/C3CP44687E. [DOI] [PubMed] [Google Scholar]
- Cao S. W. Low J. X. Yu J. G. Jaroniec M. Adv. Mater. 2015;27:2150–2176. doi: 10.1002/adma.201500033. [DOI] [PubMed] [Google Scholar]
- Qiu P. X. Chen H. Xu C. M. Zhou N. Jiang F. Wang X. Fu Y. S. J. Mater. Chem. A. 2015;3:24237–24244. doi: 10.1039/C5TA08406G. [DOI] [Google Scholar]
- Feng D. Q. Cheng Y. H. He J. Zheng L. C. Shao D. W. Wang W. C. Wang W. H. Lu F. Dong H. Liu H. Zheng R. K. Liu H. Carbon. 2017;125:454–463. doi: 10.1016/j.carbon.2017.09.084. [DOI] [Google Scholar]
- Niu P. Zhang L. L. Liu G. Cheng H. M. Adv. Funct. Mater. 2012;22:4763–4770. doi: 10.1002/adfm.201200922. [DOI] [Google Scholar]
- Jiang W. J. Luo W. J. Wang J. Zhang M. Zhu Y. F. J. Photochem. Photobiol., C. 2016;28:87–115. doi: 10.1016/j.jphotochemrev.2016.06.001. [DOI] [Google Scholar]
- Zhang Y. W. Liu J. H. Wu G. Chen W. Nanoscale. 2012;4:5300–5303. doi: 10.1039/C2NR30948C. [DOI] [PubMed] [Google Scholar]
- Rajaambal S. Sivaranjani K. Gopinath C. S. J. Chem. Sci. 2015;127:33–47. doi: 10.1007/s12039-014-0747-0. [DOI] [Google Scholar]
- Thommes M. Kaneko K. Neimark A. V. Olivier J. P. Rodriguez-Reinoso F. Rouquerol J. Sing K. S. W. Pure Appl. Chem. 2015;87:1051–1069. [Google Scholar]
- ALOthman Z. A. Materials. 2012;5:2874–2902. doi: 10.3390/ma5122874. [DOI] [Google Scholar]
- Su Q. Sun J. Wang J. Q. Yang Z. F. Cheng W. G. Zhang S. J. Catal. Sci. Technol. 2014;4:1556–1562. doi: 10.1039/C3CY00921A. [DOI] [Google Scholar]
- Giannakopoulou T. Papailias I. Todorova N. Boukos N. Liu Y. Yu J. G. Trapalis C. Chem. Eng. J. 2017;310:571–580. doi: 10.1016/j.cej.2015.12.102. [DOI] [Google Scholar]
- Chandiran A. K. Comte P. Humphry-Baker R. Kessler F. Yi C. Y. Nazeeruddin M. K. Gratzel M. Adv. Funct. Mater. 2013;23:2775–2781. doi: 10.1002/adfm.201202956. [DOI] [Google Scholar]
- Huang S. H. Liao S. Y. Wang C. C. Kei C. C. Gan J. Y. Perng T. P. Nanotechnology. 2016;27:405702. doi: 10.1088/0957-4484/27/40/405702. [DOI] [PubMed] [Google Scholar]
- Lin B. Li H. An H. Hao W. B. Wei J. J. Dai Y. Z. Ma C. S. Yang G. D. Appl. Catal., B. 2018;220:542–552. doi: 10.1016/j.apcatb.2017.08.071. [DOI] [Google Scholar]
Associated Data
This section collects any data citations, data availability statements, or supplementary materials included in this article.


