Abstract
Based on the fluorophore of 2-(2′-hydroxyphenyl)benzothiazole (HBT) with aggregation-induced emission (AIE) properties, a highly selective and sensitive fluorescent probe PBT towards F− was investigated. “Turn-On” fluorescence type signaling was realized by employing fluoride-selective cleavage of the latent thiophosphinated probe in mixed aqueous media. The probe is designed in such a way that the excited state intramolecular proton transfer (ESIPT) of the HBT moiety becomes blocked. The chemodosimetric approach of F− to the probe results in the recovery of the ESIPT by removal of a free AIE-active HBT moiety through a subsequent hydrolysis process. The F− detection limit of the probe was 3.8 nM in the dynamic range of 0.5 μM to 10 μM. In addition, the proposed probe has been used to detect F− in water samples and toothpaste samples with satisfying results.
A “Turn-On” fluorescent probe PBT for sensitive and selective detection of fluoride ions based on aggregation-induced emission.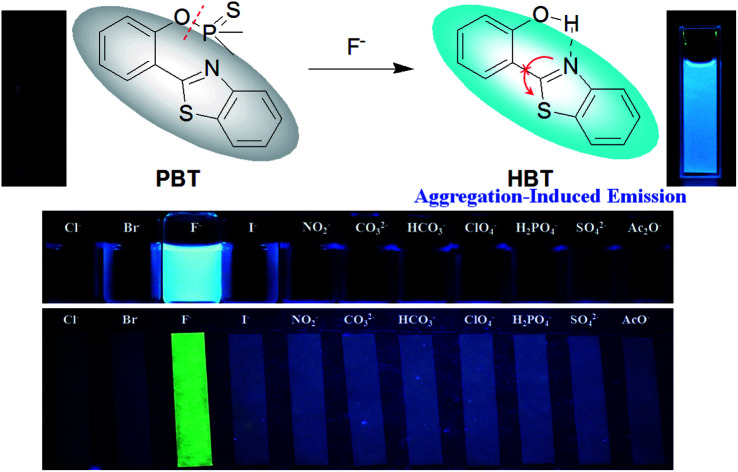
1. Introduction
Fluoride ion, the smallest anion, is regarded as one of the most important anions. Fluoride is widely used as a useful additive in toothpaste, pharmaceutical agents and even drinking water owing to its established role in dental care, and as a clinical treatment for osteoporosis and for fluorination of drinking water supplies.1–4 Appropriate fluoride ingestion can prevent dental cavities and osteofluorosis, while excess fluoride intake may result in dental and skeletal fluorosis, kidney and gastric disorders, and urolithiasis in humans, which may lead to death. 5–8 As a result, there is a need to develop new selective and sensitive methods for monitoring the concentration of fluoride in environments that are not easily served by conventional assay methods.9–11
In comparison with the conventional assay methods for F− including ion-selective electrode,12 colorimetry,13 and capillary electrophoresis,14 fluorescent techniques display apparent advantages such as operational simplicity, high sensitivity, and bioimaging analysis in living cells, even in vivo. Over the past decades, most reported F− sensors are based on the hydrogen bonding 15–18 and the Lewis acid–base interactions19,20 during the past decades. And the interactions of Lewis acid–base mainly include fluorine-boron complexation21–23 and desilylation.24–26 Fluorescent probes for F− based on desilylation that mostly divided into F−-promoted Si–C and Si–O cleavage reactions27–30 have attracted more interest among scientific research workers in recent years. To allow for proper standpoint of the fluoride-probe development, a brief comparison with some of the recent developed fluorescent chemosensors for F− has also been tabulated at Table S1 (ESI†).
On the other hand, dimethylphosphinothionyl groups have been used as side chain of phenolic OH protecting groups for tyrosine in peptide synthesis.31,32 Notably, dimethylphosphinothionyl group is the most unstable one among the phosphinyl groups, and is easy to be dislodged by F−. These favourable features make it possible for dimethylphosphinothionyl group to be widely used as a fluoride triggering-based cleavable group. However, to the best of our knowledge, there have been rare literatures on the cleavage of P–O bond for detecting F−.33,34 In this case, to design receptors generally comprised of P–O bond for facilitate spontaneous respond to the detecting F− is interesting.
However, most of the fluorescent probes for F− are based on fluorophores with aggregation-caused quenching (ACQ) properties and need to be diluted in solutions or dispersed in matrix materials, which greatly restrict their practical applications.35–39 In recent decades, contrary to ACQ, a novel series of bioimaging and biosensing dyes exhibiting unique characteristics of aggregation induced emission (AIE) have been discovered.40–44 AIE active chromophores are generally weakly or non-emissive in the solution but strongly emissive in the solid/aggregated state. Since the discovery of AIE concepts, a large number of AIE active chromophores have been reported for a wide range of application.45–52 We have also constructed several fluorescent probes which possess significant AIE feature.53–55 It is well known that the familiar excited state intramolecular proton transfer (ESIPT) fluorophore 2-(2′-hydroxyphenyl)-benzothiazole (HBT) has been widely used to construct fluorescent probes, owing to its large Stokes shift and high photostability.56–58 Moreover, HBT has typical AIE properties by virtue of ESIPT and restriction of intramolecular motion (RIM) mechanisms.59 Inspired by these properties, we have developed a fluorescent and portable sensor PBT, a thiophosphinated derivative of HBT, for selective and sensitive detection of F− based on HBT (Scheme 1). The protection of phenoxyl group with dimethylphosphinothionyl group in PBT can efficiently quench its fluorescence by disrupting the intramolecular hydrogen bond and blocking the ESIPT process. After reaction with F− to cleave the dimethylphosphinothionyl group through hydrolysis reaction, the generated AIE-active HBT will recover its fluorescence by restoring intramolecular hydrogen bond and restriction of intramolecular motion in aggregation or solid state.
Scheme 1. Design for the response of PBT towards F−.
2. Experimental section
2.1. Materials and instrumentations
Salicylaldehyde, o-aminothiophenol and dimethylthiophosphinoyl chloride were purchased from Aladdin (Shanghai, China) and used without further purification. Triethylamine was purchased from Beijing Chemical Regent Co. All the other chemicals obtained from commercial sources were analytical pure and used without further purification unless otherwise noted. The water was purified by Millipore filtration system.
1H NMR and 13C NMR spectra were measured on a Varian Gemin-400 MHz spectrometer with chemical shifts reported in ppm (TMS as internal standard). Electrosprayionization (ESI) mass spectra were collected on Bruker Daltonics Inc. Pgeneral TU-1901 and Hitachi F-4500 fluorescence spectrometers were used in performing UV-Visible and fluorescence spectra at 25 °C. All pH values in this report were carried out on a Model pHS-3C pH meter (Shanghai, China). All chemical reaction detected by thin layer chromatography under 254 nm (or 365 nm) UV lamp. Silica gel plates (HSGF254, 0.2 mm) were purchased from Yantai Chemical Industry Research Institute.
2.2. Synthesis
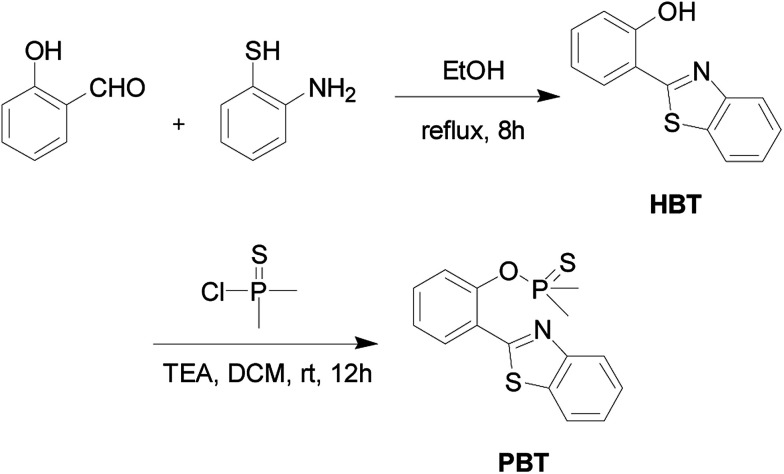
The detailed synthetic procedure of the probe PBT was outlined in Scheme 2.
Scheme 2. Synthesis of fluorescent probe PBT.
2.2.1. Synthesis of HBT
To a stirred solution of salicylaldehyde (2.00 mL, 18.77 mmol) in ethanol (50 mL) was slowly added o-aminothiophenol (2.00 mL, 18.77 mmol). The reaction mixture was stirred at 80 °C for 8 h. After cooling to −20 °C, the product was obtained as light yellow crystals (3.24 g, 76% yield). 1H NMR (400 MHz, CDCl3) δ (TMS, ppm): 7.005 (t, 1H), 7.125 (dd, 1H), 7.437 (m, 2H), 7.536 (m, 1H), 7.720 (dd, J = 2.8 Hz, 1H), 7.923 (dd, J = 2.8 Hz, 1H), 8.010–8.030 (d, J = 3.6 Hz, 1H). 13C NMR (400 MHz, CDCl3) δ (TMS, ppm): 116.82, 117.89, 119.53, 121.52, 122.20, 125.55, 126.70, 128.42, 132.62, 132.76, 151.89, 157.97, 169.40. ESI (+)-HRMS (m/z): [M+] calcd. for C13H9NOS: 227.0405, found: 228.0470. Anal. calcd for C13H9NOS: C 68.76, H 3.99, N 6.17, S 14.12; found C 68.44, H 4.02, N 6.17, S 13.96.
2.2.2. Synthesis of PBT
Dimethylthiophosphinoyl chloride (1.00 mL, 5.20 mmol) in dichloromethane (10 mL) was added slowly to a mixture of HBT (1.00 g, 4.40 mmol) and triethylamine (0.06 mL, 5.20 mmol) in 30 mL of dichloromethane. After stirring overnight at room temperature, the mixture was concentrated under reduced pressure. The residue was purified by flash chromatography on silica gel using PE/EA (petroleum ether : ethyl acetate = 20 : 1, v/v) to produce 1.15 g (82% yield) of PBT as a white powder. 1H NMR (400 MHz, CDCl3) δ (TMS, ppm): 2.114 (s, 3H), 2.147 (s, 3H), 7.357 (t, 1H), 7.506 (m, 3H), 7.880–7.900 (d, J = 8.0 Hz, 1H), 7.956–7.975 (d, J = 8.0 Hz, 1H), 8.125–8.145 (d, J = 8.0 Hz, 1H), 8.331–8.349 (d, J = 7.2 Hz, 1H). 13C NMR (400 MHz, CDCl3) δ (TMS, ppm): 23.89, 24.61, 121.37, 121.70, 121.76, 123.31, 125.21, 125.38, 126.40, 130.84, 131.47, 135.54, 148.83, 152.62. ESI (+)-HRMS (m/z): [M+] calcd. for C15H14NOPS2: 319.0254, found: 320.0314. Anal. calcd for C15H14NOPS2: C 56.47, H 4.42, N 4.39, S 20.10; found C 56.31, H 4.33, N 4.42, S 20.07. ICP-MS: calcd for P 9.70; found P 9.68.
2.3. General procedure for analysis
Stock solution of fluoride ions and other analytes were prepared in ultrapure H2O, stock solution of PBT (1.0 mM) were prepared in THF, which was diluted to the required concentration for measurement. All fluorescence measurements were carried out at room temperature on a Hitachi Fluorescence Spectrophotometer F-4500. All fluorescence spectra were recorded in the range from 300 nm to 700 nm at 1200 nm min−1 using a 335 nm excitation wavelength. The excitation and emission bandwidths were set at 5.0 nm and 10.0 nm respectively.
2.3.1. Preparation of nanoparticles
The nanoparticles of HBT were prepared by rapidly injecting 100 μL THF solution of HBT (1.0 mM) into a 10 mL THF/H2O mixture with different water fractions (0–90%) at room temperature. The samples (10 μM) were immediately taken for fluorescence detection. The scanning electron microscope (SEM) samples were prepared by dropping the mixture solutions onto a silicon plate and immediately evaporating the solvent in vacuum.
2.3.2. Time course plot of signaling
Time course for the signaling of PBT with F− was followed by monitoring the changes in fluorescence intensity of the solutions at 335 nm excitation wavelength. The concentrations of the probe PBT and F− were 10 μM and 20 μM respectively, in a mixture of THF and Tris buffer solution (pH 8.0), (1 : 9, v/v).
2.3.3. pH effect on fluoride signaling
The effects of pH on the PBT signaling of F− were elucidated by measuring the response in a pH range 2.0–14.0 using buffer solutions. Final concentrations of probe PBT, F− and each buffer solution were 10 μM, 20 μM and 20 mM respectively, under the same measurement conditions.
2.3.4. Detection limit for the F−
Following IUPAC recommendations,60 the detection limit was obtained using the equation LOD = 3δ/m, where δ is the standard deviation of the blank signal (the number of measurements = 20) and m is the slope of the calibration curve.
2.3.5. Determination of the fluorescence quantum yield
The fluorescence quantum yields of PBT was determined in THF with sulfate quinine (Φ = 0.54 in 0.1 M H2SO4) as a fluorescence standard. The quantum yields were calculated using the following equation: Where, As and A are the absorbance of sulfate quinine and sample solutions at the same excitation wavelength; Fs and F are the corresponding integrated fluorescence intensities of sulfate quinine and sample solutions; ηs and η are the refractive index of H2SO4 and THF (or THF/H2O).
2.3.6. F− detection for practical samples
Five real-water samples were collected from tap water, Qinghe River, Weiming Lake and two chemical industries in Beijing. The detection of F− for the five kinds of water samples was carried out to confirm the practical ability of PBT. The changes in the signaling of PBT for the five kinds of water samples were measured as a function of F− concentrations. Stock solutions of sodium fluoride (1.0 M) were prepared in tap water (sample 1), Qinghe River (sample 2), Weiming Lake (sample 3), industrial wastewater (A) (sample 4) and industrial wastewater (B) (sample 5). Stock solution of PBT (1.0 mM) was prepared in THF. The pH of Tris buffer solution (1.0 M) was adjusted to pH 8 with sodium hydroxide. Final concentrations of water samples, PBT and Tris buffer were 20 μM, 10 μM and 20 mM respectively.
While, several commercially available toothpastes have also been selected as samples to detect the content of F− in them. To analyze F− in toothpaste, 1.0 g toothpaste was accurately weighed and dissolved in 30 mL of water and stirred at 70 °C for 3 h. The resulting solution was cooled to room temperature and then filtered with a membrane filter (pore size, 0.45 mm) to eliminate solids in suspension. The insoluble part was washed several times with water, and the resulting solution was diluted to 10 mL with water, for further use.
3. Results and discussion
3.1. Aggregation-induced emission characteristics of HBT
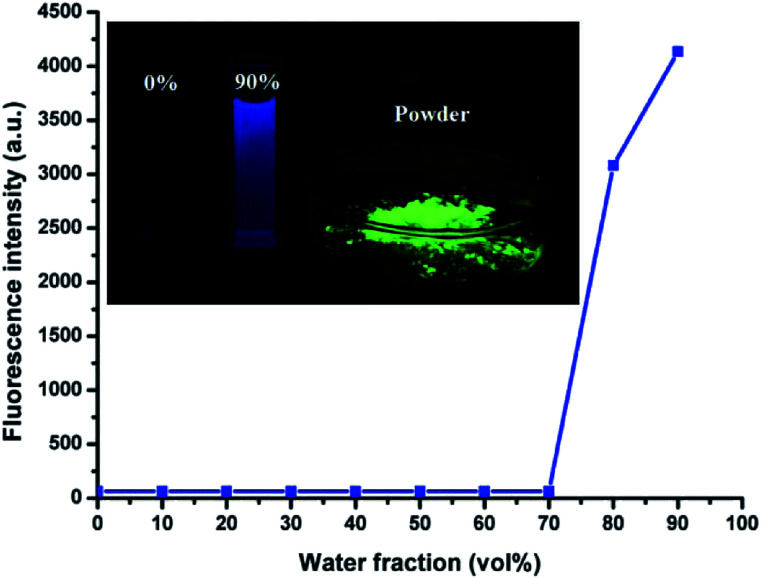
HBT is soluble in THF, DMF and DMSO, but exhibits poor solubility in water. The AIE phenomenon can be easily observed by the naked eye. The THF solution was almost non-emissive, whereas its powder or nanoparticles dispersed in water exhibited a significantly enhanced emission (Fig. 1, inset). In addition, the fluorescence quantum efficiency of its THF solution, THF/H2O (1 : 9, v/v) solution and powder were measured to be 0.004%, 9.28% and 77.3%, respectively.
Fig. 1. Fluorescent spectra of HBT (10 μM) in the THF/H2O mixture at different water fractions, λex = 335 nm, λem = 470 nm. Inset: images of HBT (10 μM) under UV illumination at 365 nm in THF solution, THF/H2O mixture (1 : 9, v/v) and power from left to right.
The AIE characteristics of HBT were also investigated by measuring its fluorescence spectra in THF/H2O mixture with different water fractions and the results are shown in Fig. 1 and S2.† As expected, there was almost no fluorescence emission could be detected in dilute THF solution, suggesting that HBT is non-fluorescence when dispersed in its “solution” state. The increasing water fractions in THF/H2O mixture can reduce the solubility of HBT and induce the formation of nanoaggregates. As shown in Fig. 1, the fluorescence intensity of HBT remained low with water fractions ranging from 0 to 70 vol%, and increased rapidly with further increasing water fractions from 70 to 90 vol%. This phenomenon indicated that increasing water fractions in the THF/H2O mixture can reduce the solubility of HBT and induce the formation of HBT aggregates.
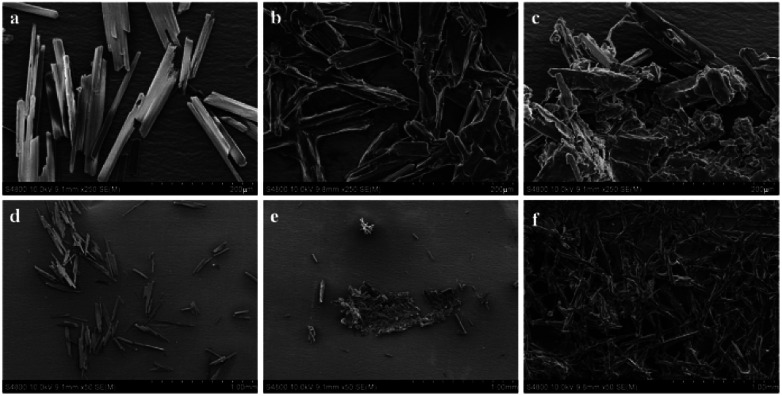
To ulteriorly investigate the aggregation behaviour of HBT, the SEM analysis was performed by dissolving HBT in THF, THF/H2O mixture (2 : 8, v/v) and THF/H2O mixture (1 : 9, v/v) respectively (Fig. 2). SEM images generated from the pure THF solution of HBT showed the presence of well-dispersed particles, images from the THF/H2O mixture of HBT showed the formation of aggregates. In pure THF solution, one-dimensional nanowires were obtained after solvent evaporation (Fig. 2a and d), while when the water fraction is above 80%, a large number of nanoclusters are formed (Fig. 2b and e). Upon using a higher fraction of water in the system, for example, up to 90%, the HBT molecules quickly agglomerate to form plenty of amorphous ramiform aggregates (Fig. 2c and f). The aggregate particles predominate in the mixture and their size is large enough to be easily observed. These results clearly indicate the presence of the AIE phenomenon in HBT.
Fig. 2. SEM images of HBT (volume percent of water: (a) and (d) 0%, (b) and (e) 80%, (c) and (f) 90%).
3.2. Study of the spectroscopy properties of the probe PBT
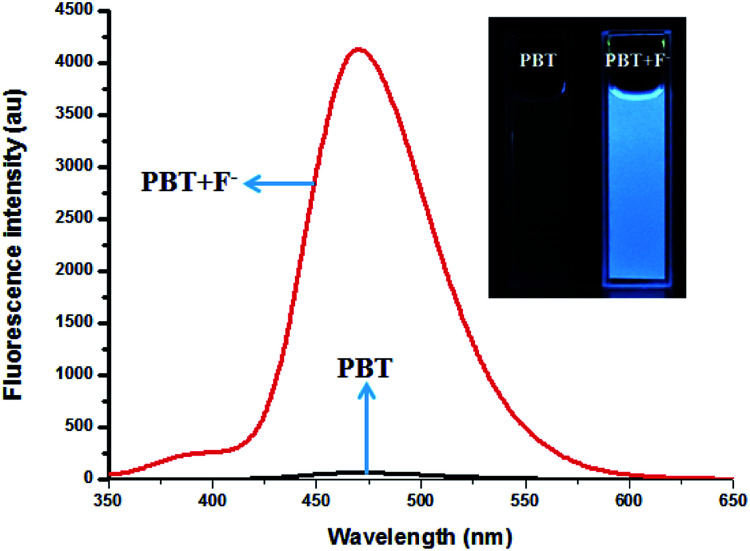
To demonstrate that PBT can be used as a light-up senor in aggregation state, we further measured the UV and fluorescence spectra of PBT and HBT in THF/H2O (1 : 9, v/v). Initially, spectroscopic evaluation of PBT and its responses to F− were carried out in THF/H2O (1 : 9, v/v, pH 8.0) at room temperature (25 °C). In the UV-vis spectra (Fig. S3, ESI†), probe PBT showed one main absorption peak at 303 nm. When PBT reacted with F−, the absorption spectra of PBT underwent significantly bathochromatic shift, indicating of the formation of the hydrolysis product HBT, with the absorption peak at 330 nm and in accordance with the synthesized HBT. Probe PBT also showed prominent off-on type fluorescence signaling for F− (Fig. 3).
Fig. 3. The fluorescence spectra of PBT in the absence and presence of F−, [PBT is 10 μM], [F− is 20 μM], [Tris buffer is 20 mM] in a mixture of THF and Tris buffer solution (pH 8.0), (1 : 9, v/v). λex = 335 nm, λem = 470 nm. Inset: The fluorescence colour change of PBT in the absence and presence of F−.
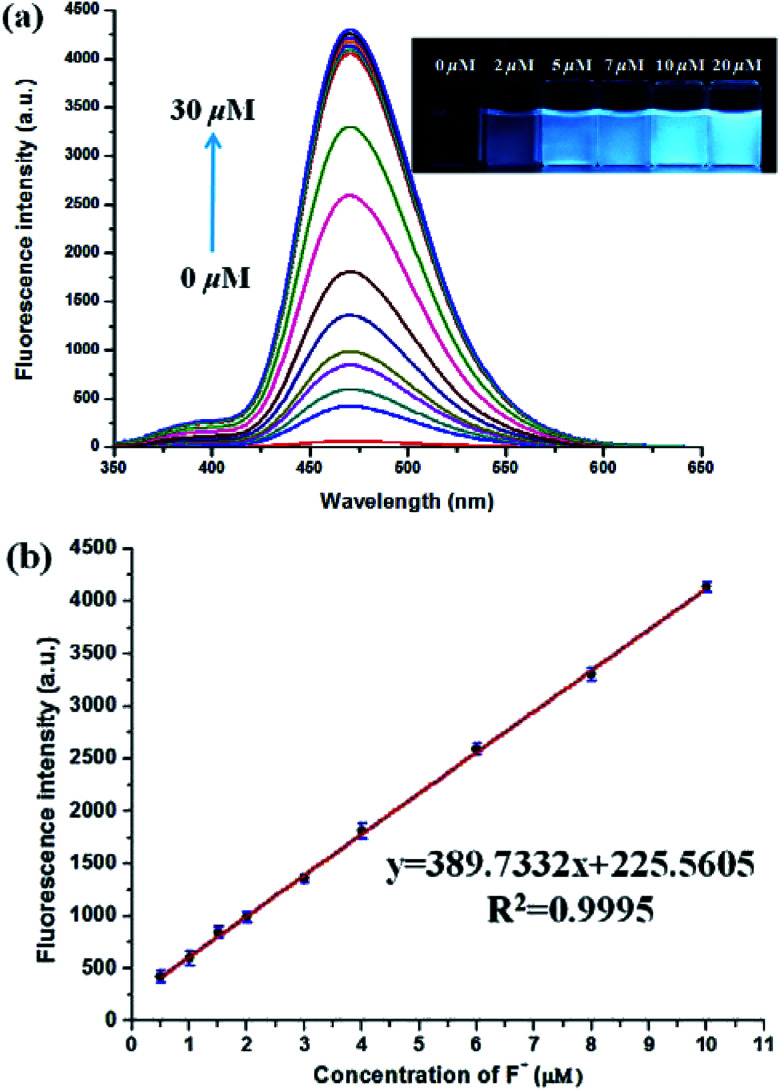
The fluorescence spectra of PBT upon titration with F− were recorded in THF/H2O (1 : 9, v/v) buffered by 20 mM Tris buffer at pH = 8.0 to investigated the turn-on behavior of F−. As shown in Fig. 3, PBT itself showed a very weak emission. However, the fluorescence of PBT (10 μM) increased dramatically at 470 nm upon the addition of F−. Simultaneously, a perceived fluorescence colour change of PBT was observed from colourless to blue (Fig. 3, inset). The change of emission intensity became constant and caused 70-fold increase when the addition of F− was to 30 μM (Fig. 4a). This experiment shows that PBT is potential to be used as a fluorescent light-up sensor in aggregation state through cleavage of the dimethylphosphinothionyl group to yield highly emissive HBT product.
Fig. 4. (a) The fluorescence spectra of PBT in the presence of different concentrations of F− [PBT is 10 μM], [Tris buffer is 20 mM] in a mixture of THF and Tris buffer solution (pH 8.0), (1 : 9, v/v), λex = 335 nm, λem = 470 nm. Inset: direct observation of the difference in fluorescence intensity of PBT under UV irradiation (365 nm) with various concentration F− (0–20 μM) after 10 min incubation time. (b) The linear relationship between fluorescence intensity and F− concentration (0.5–10 μM).
There was an approximately linear relationship (R2 = 0.9995) between fluorescence intensity and F− concentration in the range of 0.5 μM to 10 μM at 470 nm (Fig. 4b). The detection limit was found to be 3.8 nM on the basis of the equation LOD = 3δ/m (δ was the standard deviation of the blank solution and m is the absolute value of the slope between fluorescence intensity and fluoride ions concentration) (Fig. S11, ESI†). As shown in the inset of Fig. 4a, direct observation of the difference in fluorescence intensity of PBT with various concentration F− could be reached out. In addition, to confirm the stoichiometry of the binding between PBT and F−, Job's plots (continuous-variation) analysis was carried out. The maximum value of Job's plot was 0.5 molecular fraction, which suggests that the stoichiometry ratio is 1 : 1 between PBT and F− (Fig. S12, ESI†).
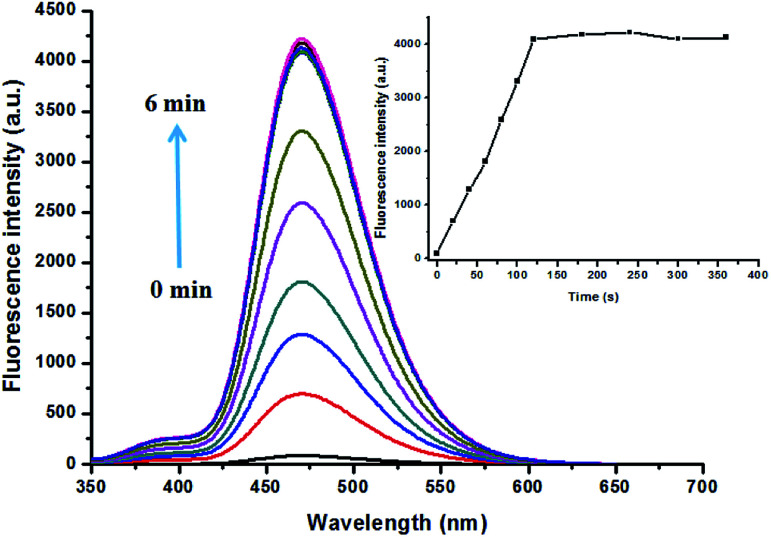
Reaction time is another important parameter to evaluate the feasibility of a probe in real time detection. Therefore, time dependent response of PBT to F− was evaluated. As shown in Fig. 5, upon the addition of F−, the fluorescence intensity of PBT showed a notably increase as the reaction time goes on. Then the fluorescence intensity of PBT reached the maximum value and reached to a plateau within 2 min, indicating that the best response time was 2 min. Further kinetic studies also showed that the calculated pseudo-first-order rate constant (k′) was 0.01269 min−1 (Fig. S13, ESI†). All the above results demonstrated that the probe PBT is a promising sensor, and could detect F− in quantitative and an expressed speed by the fluorescence spectrometry method.
Fig. 5. Time course of the signaling of PBT by F− [PBT is 10 μM], [F− is 20 μM], in a mixture of THF and Tris buffer solution (pH 8.0), (1 : 9, v/v). λex = 335 nm, λem = 470 nm. Inset: the response curve of fluorescence intensity of PBT with F− depending on the various time.
3.3. Effects of pH and selectivity studies
The effects of pH value on the fluorescent response of probe PBT toward F− were investigated. As shown in Fig. S4 (ESI†), the PBT showed pH-dependence in the detection of F−. The emission of the probe at 470 nm increased drastically in the pH range of 7.5–8.5, and reached the peak value of fluorescent intensity at pH = 8.0, which indicated that PBT would be suitable for biological applications. Besides, the fluorescent emission of probe PBT alone was unchanged at various pH values, which verified the stability of the probe.
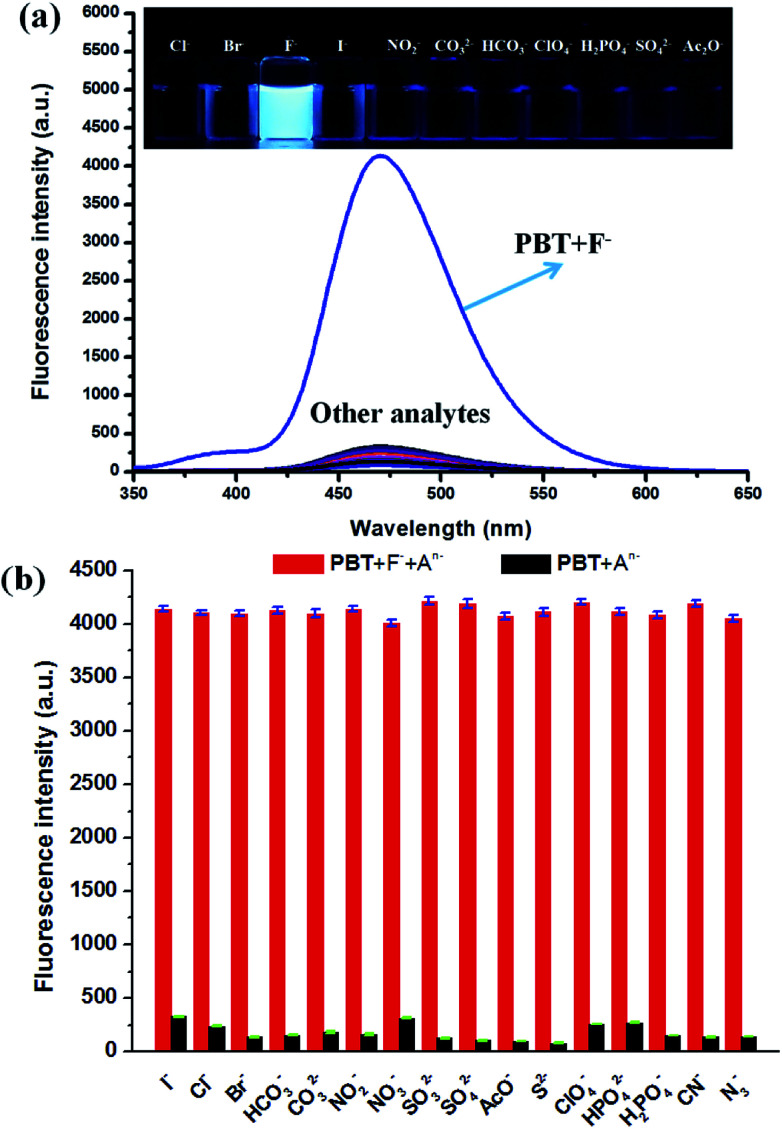
The specificity of PBT toward F− was investigated with various anions, including Cl−, Br−, I−, HCO3−, CO32−, NO2−, NO3−, SO32−, SO42−, AcO−, S2−, ClO4−, HPO42−, H2PO4−, CN−, N3− which demonstrated excellent selectivity of PBT to F−. As shown in Fig. 6a, F− induced large fluorescence increase of PBT at 470 nm upon excitation at 335 nm, whereas other anions triggered a small or negligible fluorescence variation. These indicated that probe PBT exhibits good sensitivity toward F− over other species at 470 nm with excitation at 335 nm and the presence of other anions had no obvious effects on the fluorescence intensity of PBT/F− mixture. The corresponding fluorescent images of PBT in the presence of F− and various interferent were clearly showed in the inset of Fig. 6a. Compared to the other anions, the addition of F− could turn on the fluorescence of the PBT probe solution, while the other anions did not show much of an effect (Fig. 6b). That is to say, probe PBT has good selectivity to F− and could be used as an effective probe for practical detection of F−.
Fig. 6. (a) Fluorescence spectra of PBT in the presence of various anions. [PBT] = 10 μM, [An−] = 20 μM, in a mixture of THF and Tris buffer solution (pH 8.0), (1 : 9, v/v), λex = 335 nm, λem = 470 nm. Inset: direct observation of fluorescence emission difference of the probe PBT (10 μM) under UV irradiation (365 nm) in the presence of different anions. Left to right: Cl−, Br−, I−, F−, NO2−, CO32−, HCO3−, ClO4−, H2PO4−, SO42− and AcO−. (b) The selectivity of PBT in the presence of various anions.
3.4. Reaction mechanism of PBT over fluoride ions
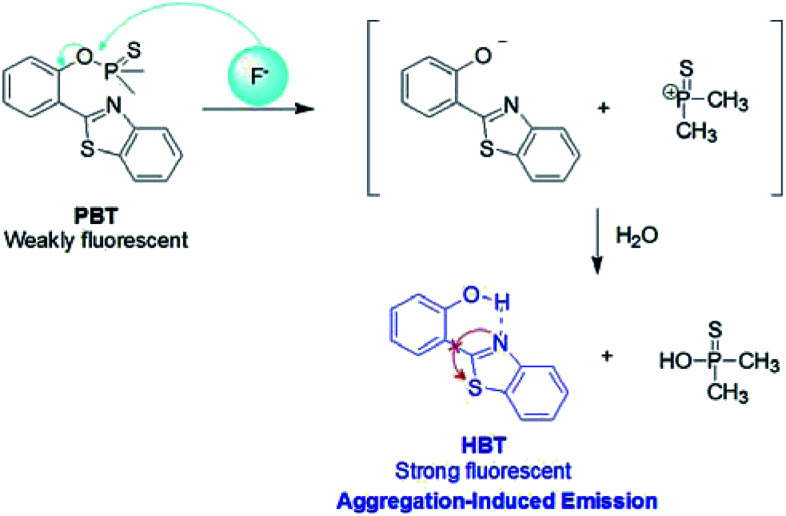
The plausible mechanism behind the return of the ESIPT through the chemical transformation of PBT to HBT, induced by F−, is shown in Scheme 3. The excited state intramolecular proton transfer (ESIPT) of the HBT moiety gets blocked. The chemodosimetric approach of F− to the probe results in the recovery of the ESIPT by removal of a free AIE-active HBT moiety through hydrolysis process. To ascertain the probe design hypotheses and whether the turn-on fluorescence response is attributed to a new thiophosphinated derivative of HBT compound that selectively gets deprotected by F− through hydrolysis process to yield a AIE-active HBT moiety, spectrum characteristics and its selective cleavage of the thiophosphinated group in probe PBT were checked with fluorescence spectra and 1H NMR, MS spectra.
Scheme 3. The reaction mechanism of PBT with F−.
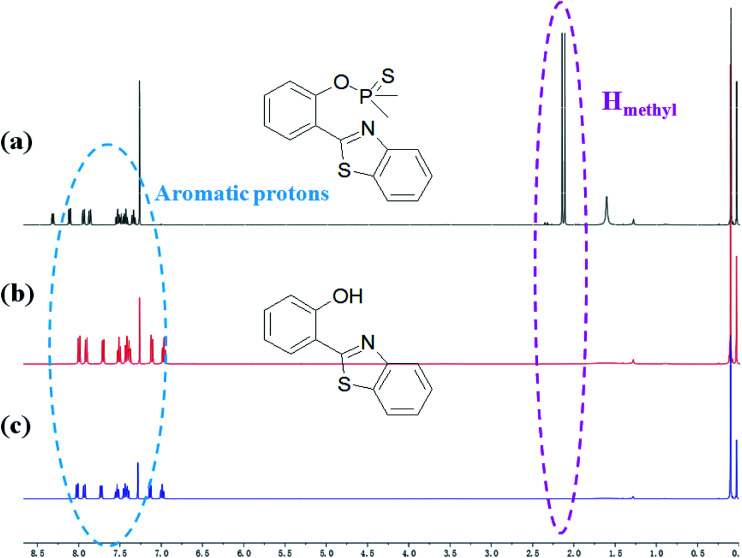
HBT was isolated from the reacting system to confirm that the breakage action of PBT with F− had indeed produced after F− was added to PBT. 1H NMR spectra of PBT, the isolated reaction product of HBT and the synthesized HBT were shown in Fig. 7. Upon the addition of F−, six protons of PBT corresponding to the protons of methyl group around 2.11 and 2.15 ppm dramatically disappeared (Fig. 7b), comparing the 1H NMR spectra of PBT (Fig. 7a). It indicated that the hydroxyl group emerged from the concomitant reaction. Especially, the isolated product of HBT (Fig. 7b) displayed a same 1H NMR spectrum with the synthesized HBT (Fig. 7c). Furthermore, detailed HR-ESI mass spectral analyses (positive ion mode) were also conducted to support the plausible mechanism. Before the addition of F−, there was a peak of [M+] (320.0314 m/z) for PBT. After adding F−, a same peak of [M+] (228.0470 m/z) for the isolated reaction product of HBT and the synthesized HBT were also found respectively (Fig. S14, ESI†). All these experimental facts support the proposed breakage reaction mechanism of PBT with F−.
Fig. 7. Partial 1H NMR spectra of PBT upon addition of F− in CDCl3. (a) Only PBT, (b) the isolated aggregates of compound after HBT reacted with F− in CDCl3 for 10 min, (c) the synthesized HBT.
3.5. Determine fluoride ion in real environmental samples
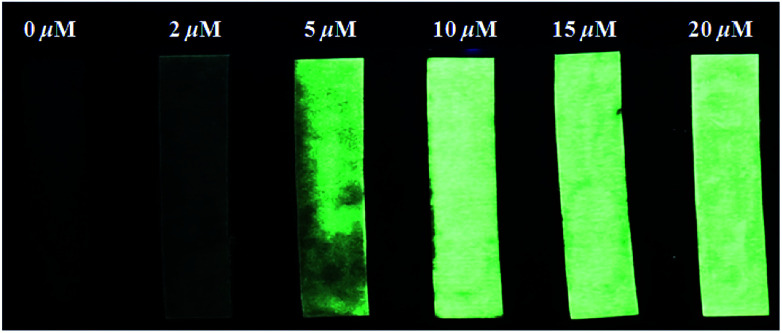
As shown in Fig. 8, the fluorescence intensity of PBT solution showed an increase with the F− concentration. While, filter papers (4 × 1 cm−2) were immersed in a THF/H2O (1 : 9, v/v) solution of PBT (1 mM) and then dried in air to prepare fluorescent test strips. After immersing in the F− aqueous solution for several seconds and drying in air, the dried test papers present luminous yellow excited at 365 nm using a hand-held UV lamp which were in accordance with the colour of synthesized HBT powder. However, the solution phase of PBT reacting with F− presents blue. The fluorescent test strips showed an increase in fluorescence intensity with the increase of F− concentration. The detection limit of the papers was as low as 2 μM of F−. According to the US Environmental Protection Agency (EPA) standards,61 the enforceable maximum contaminant level (MCL) for F− in drinking water is 4.0 mg L−1, and a nonenforceable secondary MCL for F− is 2.0 mg L−1. Thus, the test papers of probe PBT can detect the F− in drinking water.
Fig. 8. Fluorescence changes of paper test strips for detecting F− in aqueous solution with different F− concentrations. The test papers were excited at 365 nm using a hand-held UV lamp.
In addition, we also prepared the test strips which were immersed in the various anions solution for several seconds and drying in air, the fluorescent test strips showed an excellent selectivity for fluoride ions with the various anions (Fig. 9).
Fig. 9. Fluorescence changes of paper test strips for detecting F− in aqueous solution with different other anions. The test papers were excited at 365 nm using a hand-held UV lamp.
Finally, to evaluate whether PBT can serve as a potential probe to F− directly in real environmental samples, we carried out experiments in real-water samples that pretreated by a typical filtration step through 0.2 μm cellulose acetate membranes. Five real-water samples were collected from tap water, Qinghe River, Weiming Lake and two chemical industries in Beijing. The results for the determination of fluoride ions were shown in Table 1 and no F− was checked out in the five blank samples. When F− was added to them, the recovery was determined three times by the standard addition method and in range of 102–105%. These results demonstrate that the proposed assay strategy is successful in the detection of F− in real-water sample. As shown in Table 1, most of the river samples gave lower F− concentration than the recommended limit (1.5 mg L−1, 0.08 mM) for Class V surface water in China (GB3838-2002).62 The results obtained suggest that probe PBT is prospectively useful for the selective quantification of F− in practical samples.
Detection of F− in real samples (n = 3).
| Sample | Added F− (μM) | Detected (μM) | Recovery (%) | RSD (%) |
|---|---|---|---|---|
| Tap water | 0 | Not detected | — | — |
| 5 | 5.11 | 102.33 | 1.97 | |
| Qinghe River | 0 | Not detected | — | — |
| 5 | 5.16 | 103.33 | 2.03 | |
| Weiming Lake | 0 | Not detected | — | — |
| 5 | 5.12 | 102.40 | 1.86 | |
| Industrial wastewater (A) | 0 | Not detected | — | — |
| 5 | 5.15 | 103.07 | 1.29 | |
| Industrial wastewater (B) | 0 | Not detected | — | — |
| 5 | 5.22 | 104.47 | 1.74 |
Further tests of PBT for the detection of F− in several commercially available toothpaste samples were also taken. A list of the contents of F− was in Table 2 and the original spectra of the detection of F− in toothpaste samples were shown in Fig. S15 (ESI†).
Detection of F− in toothpaste samples.
| Sample | Brand | F− content (annotated) | F− content (marked) |
|---|---|---|---|
| 1 | Jiajieshi | 0.11% | 0.13% |
| 2 | Darlie | 0.10% | 0.11% |
| 3 | Zhonghua | 0.14% | 0.15% |
| 4 | Colgate | 0.10% | 0.08% |
| 5 | Saky | 0.14% | 0.12% |
4. Conclusions
In summary, we have developed a fluorescent sensor PBT for the rapid, selective and sensitive detection of F−via hydrolysis reaction to yield AIE-active HBT product, utilizing the desirable features of dimethylphosphinothionyl group as fluoride triggering-based cleavable group. The probe is designed in such a way that the excited state intramolecular proton transfer (ESIPT) of the HBT moiety gets blocked. The chemodosimetric approach of F− to the probe results in the recovery of the ESIPT by removal of a free HBT moiety through hydrolysis process. The signaling process was confirmed by the UV-vis, fluorescence measurements as well as 1H and 13C NMR and HRMS spectroscopy. The probe PBT also showed potentially useful sensing ability for the determination of F− in practical samples of environment water and toothpaste samples. The detection limit of the probe in the determination of F− was 3.8 nM in the dynamic range of 0.5 μM to 10 μM, and the response time was 2 min. The experimental studies and the practical applicability of the presented fluorometric method in environment water and toothpastes obviously demonstrated the selectivity and satisfactory detection for F− when compared with other anions.
Conflicts of interest
There are no conflicts to declare.
Supplementary Material
Acknowledgments
This work is financially supported by grants of the National Science Foundation of China (No. 21575012), and the Natural Science Foundation of Beijing (No. 2151003).
Electronic supplementary information (ESI) available. See DOI: 10.1039/c8ra06774k
Notes and references
- Zhou Y. Zhang J. F. Yoon J. Chem. Rev. 2014;114:5511–5571. doi: 10.1021/cr400352m. [DOI] [PubMed] [Google Scholar]
- Kleerekoper M. Endocrinol. Metab. Clin. North Am. 1998;27:441–452. doi: 10.1016/S0889-8529(05)70015-3. [DOI] [PubMed] [Google Scholar]
- Baker J. L. Sudarsan N. Weinberg Z. Roth A. Stockbridge R. B. Breaker R. R. Science. 2012;335:233–235. doi: 10.1126/science.1215063. [DOI] [PMC free article] [PubMed] [Google Scholar]
- Beer P. D. Gale P. A. Angew. Chem., Int. Ed. 2001;40:486–512. doi: 10.1002/1521-3773(20010202)40:3<486::AID-ANIE486>3.0.CO;2-P. [DOI] [Google Scholar]
- Fu L. Wang F. F. Gao T. Huang R. He H. Jiang F. L. Liu Y. Sens. Actuators, B. 2015;216:558–562. doi: 10.1016/j.snb.2015.04.088. [DOI] [Google Scholar]
- Kirk K. L., Biochemistry of the Halogens and Inorganic Halides, Plenum Press, New York, NY, 1991, vol. 58 [Google Scholar]
- Kleerekoper M. Endocrinol. Metab. Clin. North Am. 1998;27:441–452. doi: 10.1016/S0889-8529(05)70015-3. [DOI] [PubMed] [Google Scholar]
- Dreisbuch R. H., Handbook of Poisoning, Lange Medical Publishers, Los Altos, CA, 1980 [Google Scholar]
- Zhang P. S. Wang H. Hong Y. X. Yu M. L. Zeng R. J. Long Y. F. Chen J. Biosens. Bioelectron. 2018;99:318–324. doi: 10.1016/j.bios.2017.08.001. [DOI] [PubMed] [Google Scholar]
- Zhang P. S. Hong Y. X. Wang H. Yu M. L. Gao Y. Zeng R. J. Long Y. F. Chen J. Chem. Commun. 2018;54:7231–7234. doi: 10.1039/C8CC03240H. [DOI] [Google Scholar]
- Zhang P. S. Wang H. Zhang D. Zeng X. Y. Zeng R. J. Xiao L. H. Tao H. W. Long Y. F. Yi P. G. Chen J. Sens. Actuators, B. 2018;255:2223–2231. doi: 10.1016/j.snb.2017.09.025. [DOI] [Google Scholar]
- Breadmore M. C. Palmer A. S. Curran M. Macka M. Avdalovic N. Haddad P. R. Anal. Chem. 2002;74:2112–2118. doi: 10.1021/ac011217u. [DOI] [PubMed] [Google Scholar]
- Jiao Y. Duan X. H. Chin. J. Pharm. Biotechnol. 2014;21:180–184. [Google Scholar]
- Bebeshko G. I. Karpov Y. A. Inorg. Mater. 2012;48:1335–1340. doi: 10.1134/S0020168512140038. [DOI] [Google Scholar]
- Gujuluva G. V. K. Mookkandi P. K. Gandhi S. Jegathalaprathaban R. Sens. Actuators, B. 2018;255:3194–3206. doi: 10.1016/j.snb.2017.09.145. [DOI] [Google Scholar]
- Anand T. Sivaraman G. Iniya M. Siva A. Chellappa D. Anal. Chim. Acta. 2015;876:1–8. doi: 10.1016/j.aca.2015.03.035. [DOI] [PubMed] [Google Scholar]
- Saravanan C. Easwaramoorthi S. Hsiow C. Y. Wang K. Hayashi M. Wang L. Org. Lett. 2014;16:354–357. doi: 10.1021/ol403082p. [DOI] [PubMed] [Google Scholar]
- Zheng X. J. Zhu W. C. Liu D. Ai H. Huang Y. Lu Z. Y. ACS Appl. Mater. Interfaces. 2014;6:7996–8000. doi: 10.1021/am501546h. [DOI] [PubMed] [Google Scholar]
- Li L. Ji Y. Z. Tang X. J. Anal. Chem. 2014;86:10006–10009. doi: 10.1021/ac503177n. [DOI] [PubMed] [Google Scholar]
- Dhanunjayarao K. Mukundam V. Venkatasubbaiha K. J. Mater. Chem. C. 2014;2:8599–8606. doi: 10.1039/C4TC01711K. [DOI] [Google Scholar]
- Jakle F. Chem. Rev. 2010;110:3985–4022. doi: 10.1021/cr100026f. [DOI] [PubMed] [Google Scholar]
- Zhao H. Y. Leamer L. A. Gabbai F. P. Dalton Trans. 2013;42:8164–8178. doi: 10.1039/C3DT50491C. [DOI] [PubMed] [Google Scholar]
- Wade C. R. Broomsgrove A. E. J. Aldridge S. Gabbai F. P. Chem. Rev. 2010;110:3958–3984. doi: 10.1021/cr900401a. [DOI] [PubMed] [Google Scholar]
- Hou P. Chen S. Wang H. B. Wang J. X. Voitchovsky K. Song X. Z. Chem. Commun. 2014;50:320–322. doi: 10.1039/C3CC46630B. [DOI] [Google Scholar]
- Rao M. R. Mobin S. M. Ravikanth M. Tetrahedron. 2010;66:1728–1734. doi: 10.1016/j.tet.2009.12.039. [DOI] [Google Scholar]
- Lu H. Wang Q. H. Li Z. F. Lai G. Q. Jiang J. X. Shen Z. Org. Biomol. Chem. 2011;9:4558–4562. doi: 10.1039/C1OB05164D. [DOI] [PubMed] [Google Scholar]
- Zhang S. L. Fan J. L. Zhang S. Z. Wang J. Y. Wang X. W. Du J. J. Peng X. J. Chem. Commun. 2014;50:14021–14024. doi: 10.1039/C4CC05094K. [DOI] [Google Scholar]
- Zhang J. F. Lim C. S. Bhuniya S. Cho B. R. Kim J. S. Org. Lett. 2011;13:1190–1193. doi: 10.1021/ol200072e. [DOI] [PubMed] [Google Scholar]
- Jo M. Lim J. Miljanic O. S. Org. Lett. 2013;15:3518–3521. doi: 10.1021/ol401120a. [DOI] [PubMed] [Google Scholar]
- Xu J. B Sun S. Li Q. Yue Y. Li Y. D. Shao S. J. Anal. Chim. Acta. 2014;849:36–42. doi: 10.1016/j.aca.2014.08.014. [DOI] [PubMed] [Google Scholar]
- Ueki M. Sano Y. Sori I. Shinozaki K. Oyamada H. Ikeda S. Tetrahedron Lett. 1986;27:4181–4184. doi: 10.1016/S0040-4039(00)84943-6. [DOI] [Google Scholar]
- Ueki M. Inazu T. Bull. Chem. Soc. Jpn. 1982;55:204–207. doi: 10.1246/bcsj.55.204. [DOI] [Google Scholar]
- Kim H. Y. Im H. G. Chang S. K. Dyes Pigm. 2015;112:170–175. doi: 10.1016/j.dyepig.2014.06.030. [DOI] [Google Scholar]
- Du M. Huo B. L. Liu J. M. Li M. W. Fang L. Q. Yang Y. X. Anal. Chim. Acta. 2018;1030:172–182. doi: 10.1016/j.aca.2018.05.013. [DOI] [PubMed] [Google Scholar]
- Luo J. D. Xie Z. L. Lam J. W. Y. Cheng L. Chen H. Y. Qiu C. F. Kwok H. S. Zhan X. W. Liu Y. Q. Zhu D. B. Tang B. Z. Chem. Commun. 2001;381:1740–1741. doi: 10.1039/B105159H. [DOI] [Google Scholar]
- Zhang X. Y. Wang K. Liu M. Y. Zhang X. Q. Tao L. Chen Y. W. Wei Y. Nanoscale. 2015;7:11486–11508. doi: 10.1039/C5NR01444A. [DOI] [PubMed] [Google Scholar]
- Wan Q. Huang Q. Liu M. Y. Xu D. Z. Huang H. Y. Zhang X. Y. Wei Y. Appl. Mater. Today. 2017;9:145–160. doi: 10.1016/j.apmt.2017.06.004. [DOI] [Google Scholar]
- Xu D. Z. Zou H. Liu M. Y. Tian J. W. Huang H. Y. Wan Q. Dai Y. F. Wen Y. Q. Zhang X. Y. Wei Y. J. Colloid Interface Sci. 2017;508:248–253. doi: 10.1016/j.jcis.2017.08.060. [DOI] [PubMed] [Google Scholar]
- Jiang R. M. Liu H. Liu M. Y. Tian J. W. Huang Q. Huang H. Y. Wen Y. Q. Cao Q. Y. Zhang X. Y. Wei Y. Mater. Sci. Eng., C. 2017;81:416–421. doi: 10.1016/j.msec.2017.08.048. [DOI] [Google Scholar]
- Wei D. Xue Y. Huang H. Y. Liu M. Y. Zeng G. J. Wan Q. Liu L. J. Yu J. Zhang X. Y. Wei Y. Mater. Sci. Eng., C. 2017;81:120–126. doi: 10.1016/j.msec.2017.07.038. [DOI] [Google Scholar]
- Jiang R. M. Liu M. Y. Li C. Huang Q. Huang H. Y. Wan Q. Wen Y. Q. Cao Q. Y. Zhang X. Y. Wei Y. Mater. Sci. Eng., C. 2017;80:708–714. doi: 10.1016/j.msec.2017.07.008. [DOI] [Google Scholar]
- Cao Q. Y. Jiang R. M. Liu M. Y. Wan Q. Xu D. Z. Tian J. W. Huang H. Y. Wen Y. Q. Zhang X. Y. Wei Y. Mater. Sci. Eng., C. 2017;80:578–583. doi: 10.1016/j.msec.2017.07.006. [DOI] [Google Scholar]
- Xu D. Z. Liu M. Y. Zou H. Tian J. W. Huang H. Y. Wan Q. Dai Y. F. Wen Y. Q. Zhang X. Y. Wei Y. Talanta. 2017;174:803–808. doi: 10.1016/j.talanta.2017.07.010. [DOI] [PubMed] [Google Scholar]
- Cao Q. Y. Jiang R. M. Liu M. Y. Wan Q. Xu D. Z. Tian J. W. Huang H. Y. Wen Y. Q. Zhang X. Y. Wei Y. Mater. Sci. Eng., C. 2017;80:411–416. doi: 10.1016/j.msec.2017.06.008. [DOI] [Google Scholar]
- Tian J. W. Jiang R. M. Gao P. Xu D. Z. Mao L. C. Zeng G. J. Liu M. Y. Deng F. J. Zhang X. Y. Wei Y. Mater. Sci. Eng., C. 2017;79:563–569. doi: 10.1016/j.msec.2017.05.090. [DOI] [Google Scholar]
- Liu Y. Z. Mao L. C. Liu X. H. Liu M. Y. Xu D. Z. Jiang R. M. Deng F. J. Li Y. X. Zhang X. Y. Wei Y. Mater. Sci. Eng., C. 2017;79:590–595. doi: 10.1016/j.msec.2017.05.108. [DOI] [Google Scholar]
- Huang H. Y. Xu D. Z. Liu M. Y. Jiang R. M. Mao L. C. Huang Q. Wan Q. Wen Y. Q. Zhang X. Y. Wei Y. Mater. Sci. Eng., C. 2017;78:862–867. doi: 10.1016/j.msec.2017.04.080. [DOI] [Google Scholar]
- Yu S. X. Xu D. Z. Wan Q. Liu M. Y. Tian J. W. Huang Q. Deng F. J. Wen Y. Q. Zhang X. Y. Wei Y. Mater. Sci. Eng., C. 2017;78:191–197. doi: 10.1016/j.msec.2017.04.064. [DOI] [Google Scholar]
- Hong Y. X. Zhang P. S. Wang H. Yu M. L. Gao Y. Chen J. Sens. Actuators, B. 2018;272:340–347. doi: 10.1016/j.snb.2018.05.175. [DOI] [Google Scholar]
- Zhang P. S. Hong Y. X. Wang H. Yu M. L. Gao Y. Zeng R. J. Long Y. F. Chen J. Polym. Chem. 2017;8:7271–7278. doi: 10.1039/C7PY01696D. [DOI] [Google Scholar]
- Zhang P. S. Nie X. Z. Gao M. Zeng F. Qin A. J. Wu S. Z. Tang B. Z. Mater. Chem. Front. 2017;1:838–845. doi: 10.1039/C6QM00223D. [DOI] [Google Scholar]
- Huang Y. Zhang P. S. Gao M. Zeng F. Qin A. J. Wu S. Z. Tang B. Z. Chem. Commun. 2016;52:7288–7291. doi: 10.1039/C6CC03415B. [DOI] [Google Scholar]
- Wang A. Z. Yang Y. X. Yu F. F. Xue L. W. Hu B. W. Dong Y. J. Fan W. P. Anal. Methods. 2015;7:2839–2847. doi: 10.1039/C4AY02916J. [DOI] [Google Scholar]
- Wang A. Z. Yang Y. X. Yu F. F. Xue L. W. Hu B. W. Fan W. P. Dong Y. J. Talanta. 2015;132:864–870. doi: 10.1016/j.talanta.2014.10.048. [DOI] [PubMed] [Google Scholar]
- Yu F. F. Yang Y. X. Wang A. Z. Hu B. W. Luo X. F. Sheng R. L. Dong Y. J. Fan W. P. New J. Chem. 2015;39:9743–9751. doi: 10.1039/C5NJ01036E. [DOI] [Google Scholar]
- Li X. Tao R. R. Hong L. J. Cheng J. Jiang Q. Lu Y. M. Liao M. H. Ye W. F. Lu N. N. Han F. Hu Y. Z. Hu Y. H. J. Am. Chem. Soc. 2015;137:12296–12303. doi: 10.1021/jacs.5b06865. [DOI] [PubMed] [Google Scholar]
- Chang C. C. Wang F. Qiang J. Zhang Z. J. Chen Y. H. Zhang W. Wang Y. Chen X. Q. Sens. Actuators, B. 2017;243:22–28. doi: 10.1016/j.snb.2016.11.123. [DOI] [Google Scholar]
- Luo W. F. Liu W. S. J. Mater. Chem. B. 2016;4:3911–3915. doi: 10.1039/C6TB00680A. [DOI] [PubMed] [Google Scholar]
- Hu R. Li S. Y. Zeng Y. Chen J. P. Wang S. Q. Li Y. Yang G. Q. Phys. Chem. Chem. Phys. 2011;13:2044–2051. doi: 10.1039/C0CP01181A. [DOI] [PubMed] [Google Scholar]
- Wang Y. Q. Liu Y. He X. W. Li W. Y. Zhang Y. K. Talanta. 2012;99:69–74. doi: 10.1016/j.talanta.2012.04.064. [DOI] [PubMed] [Google Scholar]
- U.S. EPA, Basic information about fluoride in drinking water, 2013, http://water.epa.gov/drink/contaminants/basicinformation/fluoride.cfm [Google Scholar]
- SEPA, Environmental Quality Standards for Surface Water GB3838-2002, Beijing, 2002 [Google Scholar]
Associated Data
This section collects any data citations, data availability statements, or supplementary materials included in this article.


