Abstract
LAG3 is an inhibitory receptor that is highly expressed on exhausted T cells. Although LAG3-targeting immunotherapeutics are currently in clinical trials, how LAG3 inhibits T cell function remains unclear. Here we show that LAG3 moved to the immunological synapse and associated with the T cell receptor (TCR)-CD3 complex in CD4+ and CD8+ T cells, In the absence of binding to MHC class II, its canonical ligand. Mechanistically, a phylogenetically conserved, acidic, tandem glutamic acid–proline repeat in the LAG3 cytoplasmic tail lowered the pH at the immune synapse and caused the dissociation of the tyrosine kinase Lck from the CD4 or CD8 co-receptor, which resulted in a loss of co-receptor-TCR signaling and limited T cell activation. These observations indicated that LAG3 functioned as a signal disruptor in an MHC class II-independent manner, and provide insight into the mechanism of action of LAG3-targeting immunotherapies.
LAG3 (CD223) is an inhibitory receptor (IR) expressed on the surface of activated CD4+ and CD8+ T cells, NK cells and plasmacytoid dendritic cells1–3. It is similar to CD4 in having four distinct immunoglobulin-like domains and sharing the same canonical ligand, MHC class II4. LAG3-deficient T cells expand more in vivo and exhibit higher effector function in vitro12,13. LAG3 is highly upregulated on exhausted T cells in tumors and in chronic viral infections, limiting the development of sterilizing immunity5–7. Consequently, LAG3 is now a major immunotherapeutic target for the treatment of cancer and other diseases, with LAG3-targeting therapeutics being assessed in multiple clinical trials alone or in combination with therapeutics targeting the inhibitory receptor PD1 or it’s ligand PDL1. LAG3 has an unusual cytoplasmic tail that lacks any tyrosine-based motifs, but consists of a conserved putative serine phosphorylation site and two phylogenetically conserved regions with no known function: a six amino acid ‘KIEELE’ motif and a glutamic acid–proline rich tandem repeat (‘EP’) motif at the carboxy-terminus1,8,9. Both the ‘KIEELE’ motif and the membrane-proximal region, which contains the serine phosphorylation site along with the ‘EP’ motif, were reported as important for LAG3 function in T cell hybridomas8,9. However, very little is known about the mechanism by which LAG3 inhibits T cell function, although such insight is essential to optimize future LAG3-targeting therapeutics11. In this study we investigated how LAG3 inhibits TCR signaling and what are the biophysical requirements for LAG3 to function. We report that LAG3 is constitutively associated with the TCR-CD3 complex, where it is prepositioned to interact with co-receptors during synapse formation. The cytoplasmic tail of LAG3, via its EP motif, regulates the magnitude of TCR-induced signaling through the dissociation of Lck from CD4 or CD8 co-receptors.
Results
LAG3 associated with the TCR-CD3 complex
As previous studies were primarily done in the presence of MHC class II, the dependency of LAG3 on MHC class II has not been fully evaluated, in particular for CD8+ T cells, which express high amounts of LAG3 and are not MHC class II-restricted. To determine if interaction with MHC class II was required for LAG3 to inhibit T cell function, we stimulated wild-type (Lag3+/+) or Lag3−/− CD8+ and CD4+ T cells for 72h with CD3ε and CD28 Abs in the absence of MHC class II and antigen presenting cells. There was ~2-fold increase in the division index of Lag3−/− CD8+ T cells (Fig. 1a) and a ~3-fold increase in the division index of Lag3−/− CD4+ T cells, particularly at the lower CD3ε Ab concentrations (Fig. 1a, Extended Data Fig. 1a) compared to wild-type CD4+ T cells. Similar observations were made in wild-type CD4+ T cells stimulated with CD3ε and CD28 Abs in the presence of a blocking Ab for LAG3 compared to isotype control (Extended Data Fig. 1b).
Figure 1. LAG3 inhibits T cell function in the absence of MHC class II ligation.
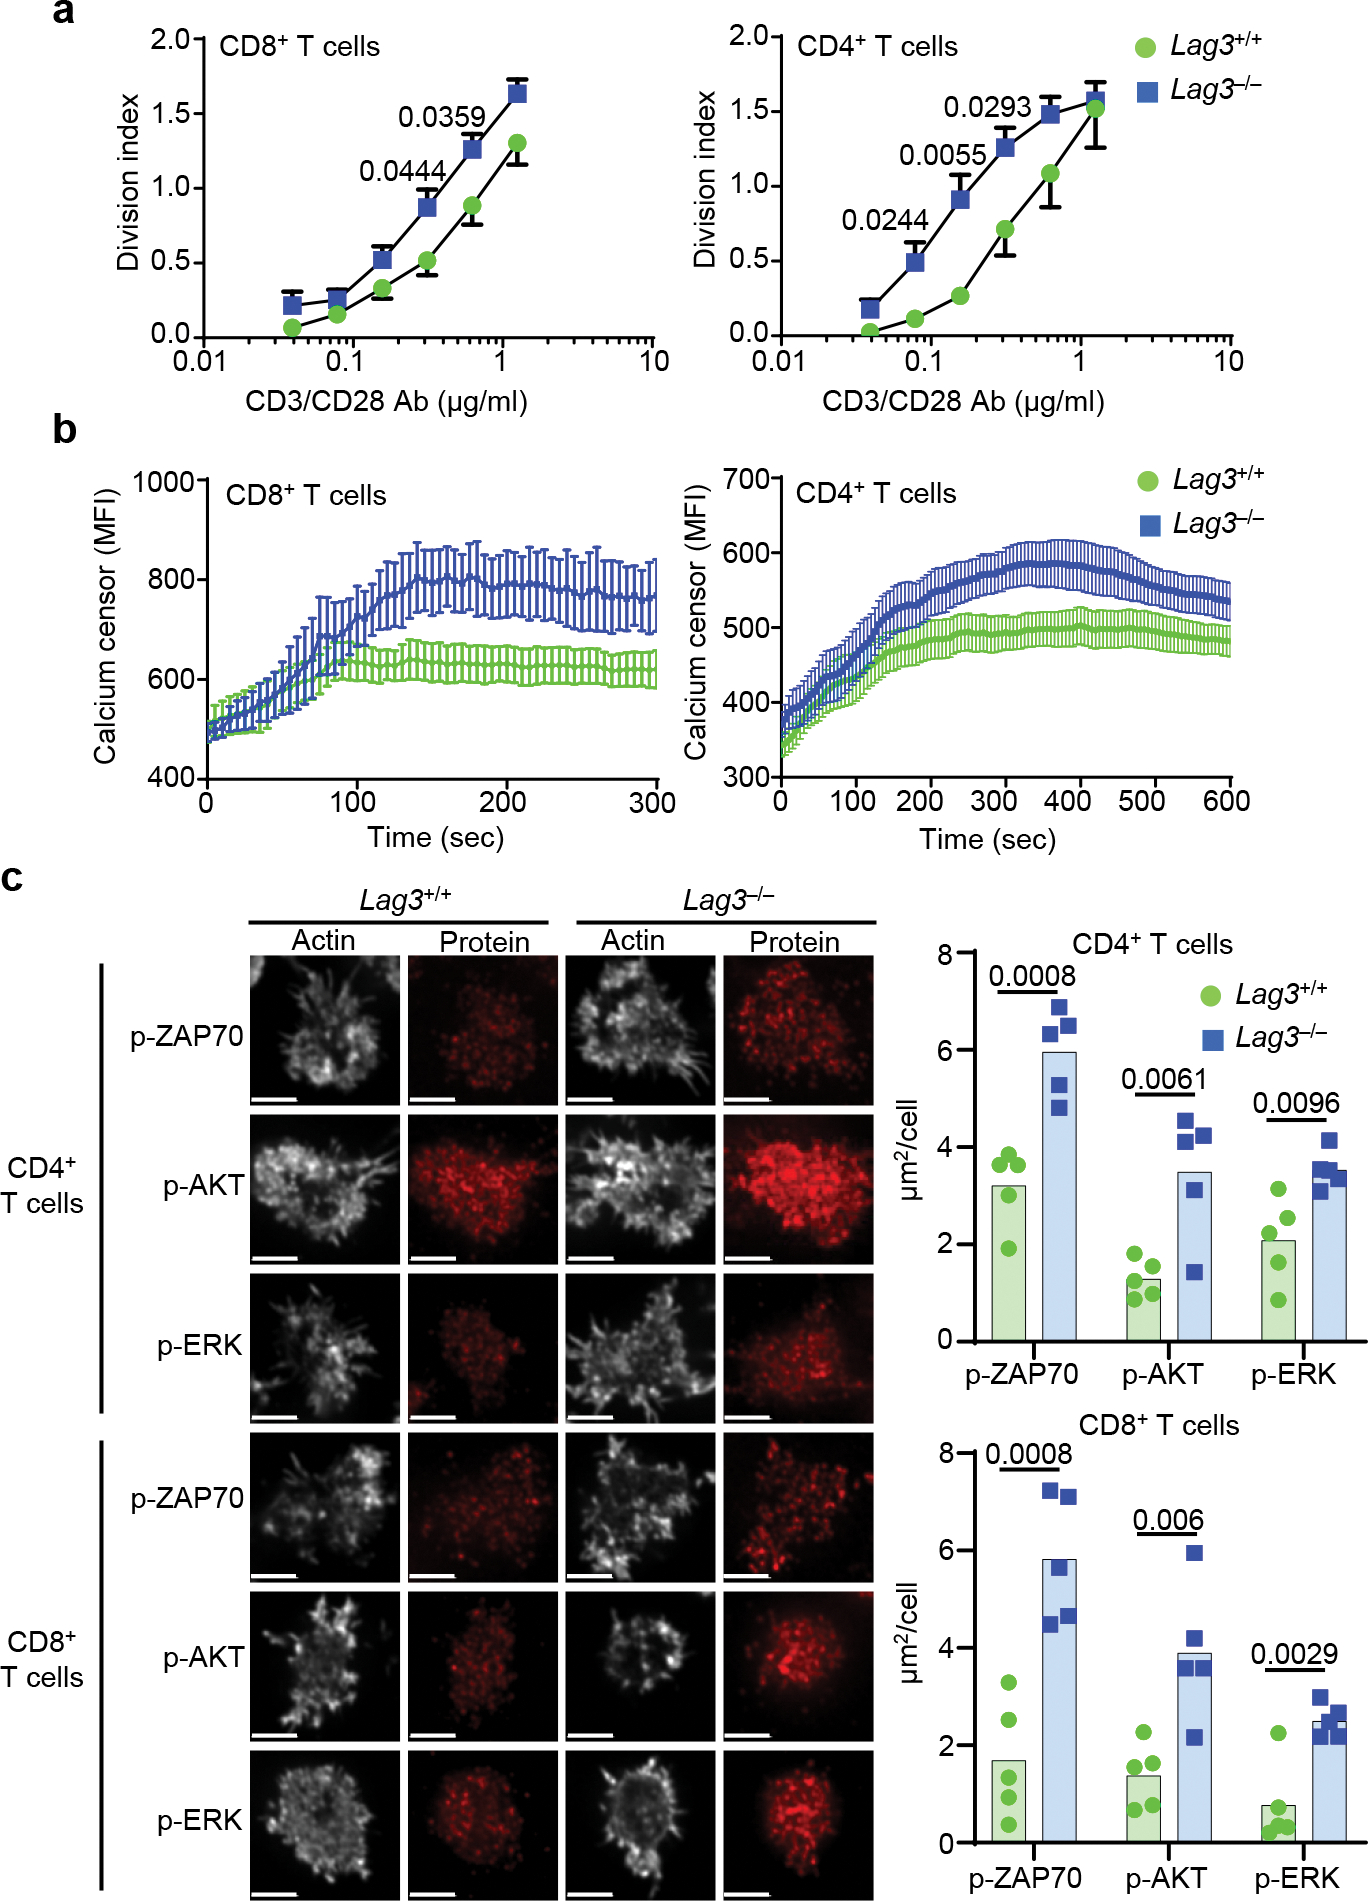
(a) Proliferation of CD8+ or CD4+ T cells from spleen and lymph nodes of LAG3+/+ and LAG3−/− mice stimulated with plate bound CD3 and CD28 Abs for 72 hr. (b) Calcium flux in CD8+ or CD4+T cell of LAG3+/+ and LAG3−/− mice isolated as above restimulated on planar lipid bilayers containing TCRβ Ab. (c) Representative confocal images of TCR–proximal signaling events in CD4+ and CD8+ T cells from spleen and lymph nodes of Lag3+/+ and Lag3−/− mice, stimulated for 48 h with plate bound CD3ε and CD28 Abs to induce LAG3 expression, rested for 48h in the presence of IL-2 and re-stimulated with TCRβ Abs for 15 min on stimulating lipid bilayers with quantification of single cell intensity measurements presented as area of puncta representing phosphorylated signaling proteins (Scale bar = 5μm). (a,b) Data represents the mean of n=7 (LAG3+/+) and n= 9 (LAG3−/−) individual mice and statistics determined by unpaired Student’s two sided t test; (a, b, c) Data from 3–5 independent experiments with P values noted in figure.
Next, we assessed the effect of LAG3 on T cell stimulation by examining the calcium flux within the first 5–10 min post-stimulation with CD3ε and CD28 Abs, in the absence of MHC class II. Lag3−/− CD8+ and CD4+ cells both exhibited higher calcium flux within 3 min (CD8+) and 10 min (CD4+) of stimulation compared to wild-type T cells (Fig. 1b). Next, we examined early signaling events using total internal reflection fluorescence microscopy (TIRFM) to track LAG3 and the TCR-CD3 complex in real time following T cell activation. Lag3+/+ or Lag3−/− CD4+ or CD8+ T cells were stimulated for 48 h with CD3ε and CD28 Abs to induce expression of LAG3 on the Lag3+/+ T cells (Extended Data Fig. 1c), rested in the presence of IL-2 for 48h and loaded for 15 min onto planar lipid bilayers displaying His-tagged ICAM1 and biotinylated TCRβ Ab, but not MHC class II (Extended Data Fig. 1d). Following TCRβ Ab stimulation, we observed a consistent increase in the activation of the proximal (p-ZAP70) and distal (p-ERK, p-AKT) TCR signaling pathways at the immune synapse (IS) in Lag3−/− CD4+ and Lag3−/− CD8+ T cells compared to Lag3+/+ CD4+ and Lag3+/+ CD8+ T cells, respectively (Fig. 1c), indicating that LAG3 inhibited TCR signaling in absence of MHC class II. Immunoblot analysis with Lag3−/− CD4+ T cells also revealed an increase in p-PLCγ, p-ZAP70 and p-AKT compared to Lag3+/+ CD4+ T cells (Extended Data Fig. 1e). As such, LAG3 inhibited proximal T cell activation independently of MHC class II.
As LAG3 appeared to regulate the early stages of TCR activation, next we assessed the location of LAG3 in relation to theTCR complex at the IS, where early activation events occur. Lag3−/− CD4+ T cells were transduced with a retrovirus encoding a fluorogen-activating peptide (FAP)14 tag attached to LAG3 via a 29 amino acid-long linker (LAG3-FAP), to facilitate LAG3 tracking. In this system, LAG3 could be visualized by adding a cell permeable dye, consisting of an n-butylamine functional group conjugated to the carboxylic acid in the malachite green fluorogen (MGnBu), prior to analysis15. Transduced Lag3−/− CD4+ T cells were loaded on planar lipid bilayers containing His-tagged ICAM1, biotinylated TCRβ Abs and streptavidin-Alexa 488, to allow the visualization of TCR clustering (Extended Data Fig. 2a), and TIRFM was used to analyze the movement of LAG3-FAP and the TCR complex following T cell activation in the absence of MHC class II. During the initial 15 min post-stimulation, we detected LAG3-FAP migrated with the TCR complex to the IS of the transduced Lag3−/− CD4+ T cells (Fig. 2a, Extended Data Video 1–3), suggesting that LAG3 may be associating with the TCR-CD3 complex. Similar observations were made in CD8+ T cells (Extended Data Fig. 2b). We next used stimulated emission depletion (STED) microscopy, a super-resolution microscopy technique and the NSInC (normalized spatial intensity correlation) statistical algorithm16,17, which allows the unbiased analysis of coordinate-based single-molecule data to determine the degree to which identified proteins are co-localized in 3-dimensional space. These analyses indicated that LAG3-FAP co-localized with the TCR-CD3 complex in CD4+ and CD8+ T cells (Fig. 2b). This was confirmed by an additional super-resolution microscopy technique, stochastic optical reconstruction microscopy (STORM), and by cell expansion microscopy18,19, a recently developed approach for improved resolution based on the physical separation of fluorophores. We obtained a five-fold improvement in resolution using cell expansion microscopy in combination with confocal-based imaging (Extended Data 2c). Both STORM and cell expansion microscopy demonstrated significant association of LAG3 with the TCR complex within the immunological synapse (Fig. 2c and Extended Data 2c, d).
Figure 2. LAG3 associates with the TCR-CD3 complex.
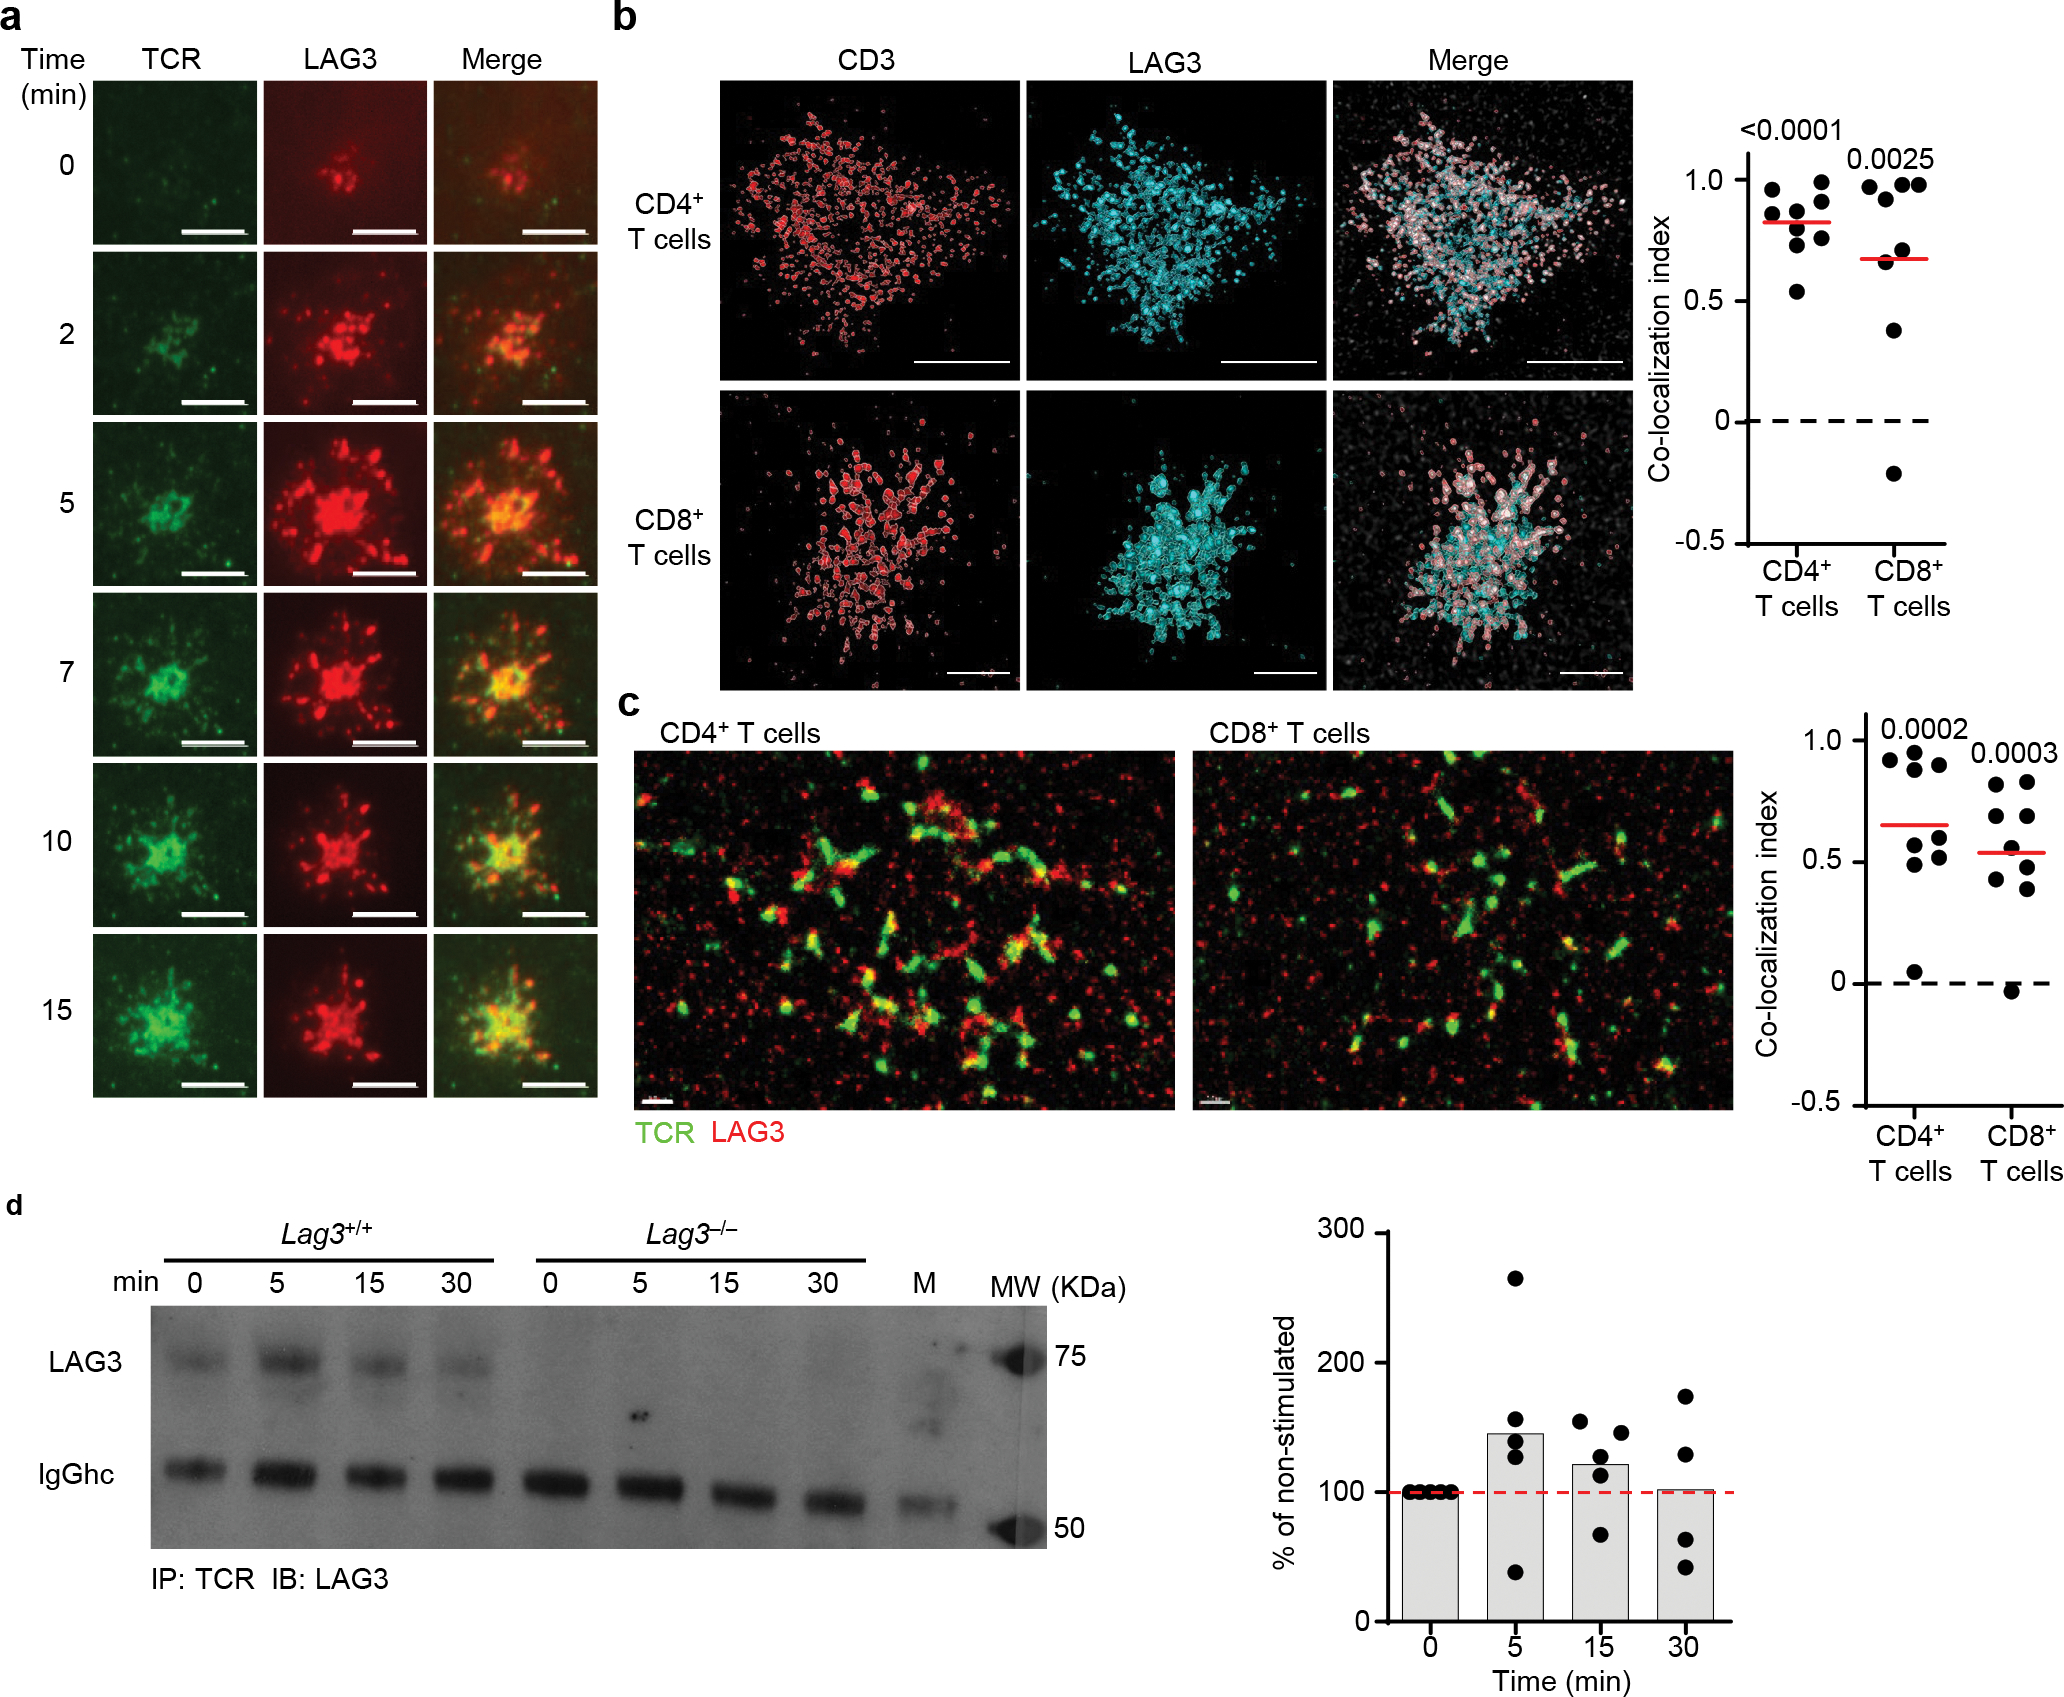
(a) TIRFM visualizing LAG3 (red) and TCR (green) of Lag3−/− CD4+ T cells isolated as above, containing FAP tagged LAG3 stimulated on a planar lipid bilayer with TCRβ Ab for 15 minutes (Scale bar = 5μm). (b) Representative super resolution STED of molecular distribution of TCR and LAG3 determined in CD4+ and CD8+ T cells isolated from spleen and lymph nodes of Lag3+/+ mice and stimulated with TCRβ Abs (scale bar = 2μm) with the co-localization index quantified shown. (c) Representative super resolution STORM of molecular distribution of TCR and LAG3 in stimulated CD4+ and CD8+ T cells as above (scale bar = 1μm) with the Co-localization index quantified shown. (d) Co-immunoprecipitation of the TCR-CD3 complex with LAG3 in resting and TCR stimulated Lag3+/+ and Lag3−/− CD4+ T cells, with quantification of 5 separate experiments depicted. Data in (a) is representative of at least 3 independent experiments. Data in (b, c) represents of the mean of 2 independent experiments and statistics determined by Wilcoxon matched pairs signed rank test with P values noted in figure. Data in (d) represents of the mean of 5 independent experiments.
To assess if LAG3 and the TCR complex physically interacted, we performed co-immunoprecipitation experiments in Lag3+/+ or Lag3−/− CD4+ T cells stimulated for 48 h with CD3ε and CD28 Abs. Immunoprecipitation with a TCR mAb pulled down LAG3 in Lag3+/+ CD4+ T cells compared to Lag3−/− CD4+ T cells (Fig. 2d). Comparable results were obtained in AND TCR transgenic Lag3+/+ or Lag3−/− CD4+ T cells stimulated with a cognate MHC class II–presented peptide (Extended Data Fig. 2e). TCR and LAG3 co-immunoprecipitated even before stimulation (0min, Fig. 2d and Extended Data Fig. 2e), suggesting LAG3 may be associated with the TCR-CD3 complex constitutively, in the presence or absence of MHC class II. To further test this notion, we applied the NSInC algorithm for assessment of intermolecular co-localization by STORM in resting Lag3+/+ CD4+ T cells using antibodies specific for LAG3 and TCR. A proportion (~50–60%) of LAG3 co-localized with the TCR-CD3 complex on the cell surface in both CD4+ and CD8+ T cells (Extended Data Fig. 2f). Together, these data suggested that LAG3 could constitutively associate with the TCR-CD3 complex in the presence or absence of MHC class II, and that following TCR stimulation, LAG3 migrated to the IS and limited TCR signaling and T cell proliferation in the absence of MHC class II ligation in CD4+ and CD8+ T cells.
LAG3 is in close proximity to CD4 and CD8
As LAG3 was reported to inhibit T cell proliferation in a CD4-dependent manner8, we investigated the spatial relationship between LAG3, the TCR and the CD4 or CD8 co-receptors during IS formation using spinning disk confocal-based FRET in CD4+ or CD8+ T cell blasts stained with Abs against the extracellular domains of the co-receptors or TCR, in combination with a non-competitive Ab to LAG3. Although we observed some FRET between LAG3 and CD4 or CD8, there were substantially more intermolecular interactions between LAG3 and the TCR (Fig. 3a, Extended Data Fig. 3a). We also assessed the spatial positioning of CD4, LAG3 and the TCR within the IS using three–dimensional stochastic optical reconstruction microscopy (3D-STORM) of Lag3+/+ CD4+ T cells. Following planar lipid bilayer stimulation, we observed TCR microclusters that contained both CD4 and LAG3 in close association (Fig. 3b). Using these STORM images, we generated 3D coordinates for TCR, CD4 and LAG3 molecules within the IS. This analysis indicated that the minimum distance between TCR and LAG3 was 45.7nm, compared with the minimum distance between LAG3 and CD4 (103.5nm) and TCR and CD4 (113.4nm) (Fig. 3b, Supplementary Table 1). We observed a high number of LAG3 molecules (13–14 on average) within a 25nm × 25nm × 50nm (x,y,z) area around single TCR-CD3 complexes compared to the number of LAG3 molecules (average: 1–2) in the same area around CD4 (Extended Data Fig. 3b, Supplementary Table 2). While not entirely quantitative, these results suggest the close association between LAG3 and the TCR-CD3 complex.
Figure 3. LAG3 association with the TCR-CD3 complex increases LAG3 proximity to the co-receptors.
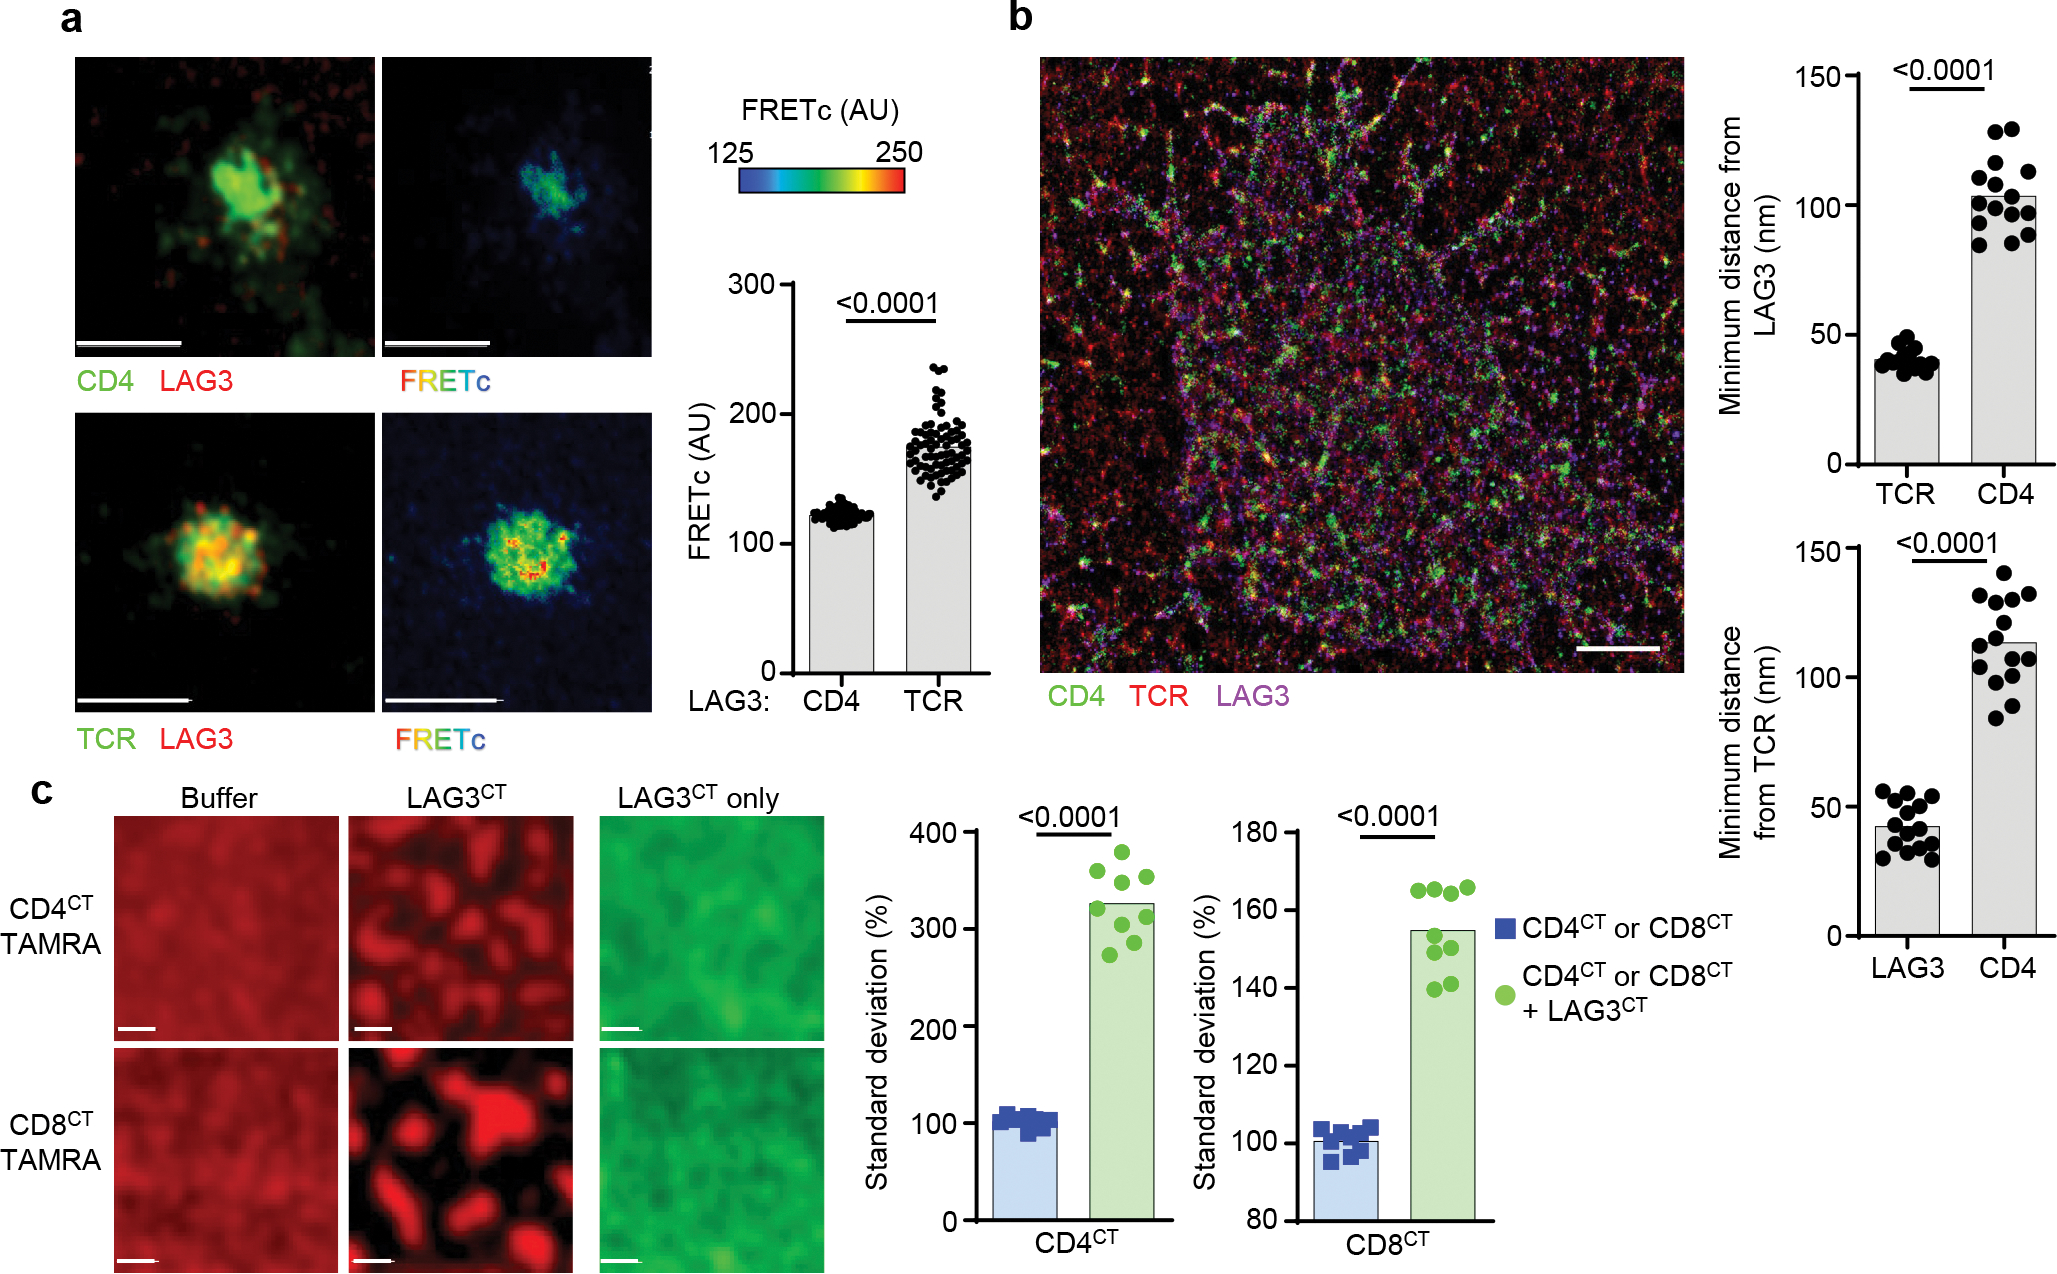
(a) Dynamic association of LAG3, TCR and CD4 on Lag3+/+ CD4+ T cells stimulated with TCRβ Ab using sensitized emission FRET with quantification shown (Scale bar = 5μm). (b) Representative super resolution STORM of molecular distribution of CD4, LAG3 and TCR within the IS determined in CD4+ T cells isolated from spleen and lymph nodes of Lag3+/+ mice and stimulated with TCRβ Abs. Three-dimensional intermolecular analyses of STORM molecule data and the median shortest distance from LAG3 to TCR and CD4 (top) or TCR to LAG3 and CD4 (bottom) (scale bar = 1μm). (c) Representative confocal image of phase separation assay using lipid bilayers containing TAMRA labeled CD4CT or CD8CT in the presence or absence of LAG3CT, with LAG3CT labeled with AF647 to visualize as a control (scale bar = 1μm). Quantification of phase separation assay with standard deviation as a measure of homogeneity. Data in (a, b and c) represent analyses from at least 3–4 independent experiments and statistics determined by unpaired Student’s two-sided t test or Wilcoxon matched pairs signed rank test with P values noted in figure.
To test whether the close association between LAG3 and the TCR allowed a direct interaction between LAG3 and the co-receptors, we next assessed whether the cytoplasmic tails (CT) of LAG3 and CD4 or CD8 interacted directly. In a cell-free biochemical approach utilizing planar nickel-containing lipid bilayers and purified poly-His-tagged CTs for human LAG3 (hLAG3CT), CD4 (hCD4CT) and CD8 (hCD8CT), (Extended Data Fig. 3c)20, lipid-tethered hLAG3CT induced clustering and partitioning of lipid-tethered TAMRA+hCD4CT or hCD8CT (Fig. 3c). These observations indicated that both hCD4CT and hCD8CT could form multimeric assemblies in response to hLAG3CT. These data suggest that the cytoplasmic tails of LAG3 and co-receptors may undergo partitioning upon TCR ligation, driven in part by the inherent ability of these receptors to interact.
LAG3 disrupts coreceptor interaction with Lck
LAG3 equally inhibits the function of CD4+ and CD8+ T cells6,12,13,23–28. Because it was suggested that ~35–50% and 20–30% of the available CD4 and CD8 in T cells respectively, are bound to the Src-family kinase Lck30–32, which is downstream of both co-receptors29,30, we next investigated whether LAG3 regulated the function of the CD8 and CD4 co-receptors by modulating its association with Lck. To test whether LAG3 absence raised the amount of Lck in association with CD4 or CD8, we used STED to assess the spatial positioning of Lck and CD4 or CD8 in 72-hour-activated Lag3+/+ or Lag3−/− CD4+ or CD8+ T cells T cell blasts, in the presence or absence of LAG3. We found significantly less (30–50%) Lck co-localized with CD4 or CD8 in Lag3+/+ CD4+ or CD8+ T cells compared to Lag3−/− CD4+ or CD8+ T cells (Fig. 4a, b). A reduction in the colocalization of Lck with CD4 was also detected in lysates of Lag3+/+ or Lag3−/− CD4+ T cells stimulated CD3ε and CD28 Abs using immunoblot analysis (Fig. 4c). Similar observations were made using STORM with Lag3+/+ CD4+ or CD8+ T cells compared to Lag3−/− CD4+ or CD8+ T cells (Extended Data Fig. 3d, e). Together, these data suggested that LAG3 limited the interaction between Lck and the CD4 or CD8 co-receptor.
Figure 4. LAG3 association with the TCR-CD3 complex increases LAG3 proximity to the co-receptors.
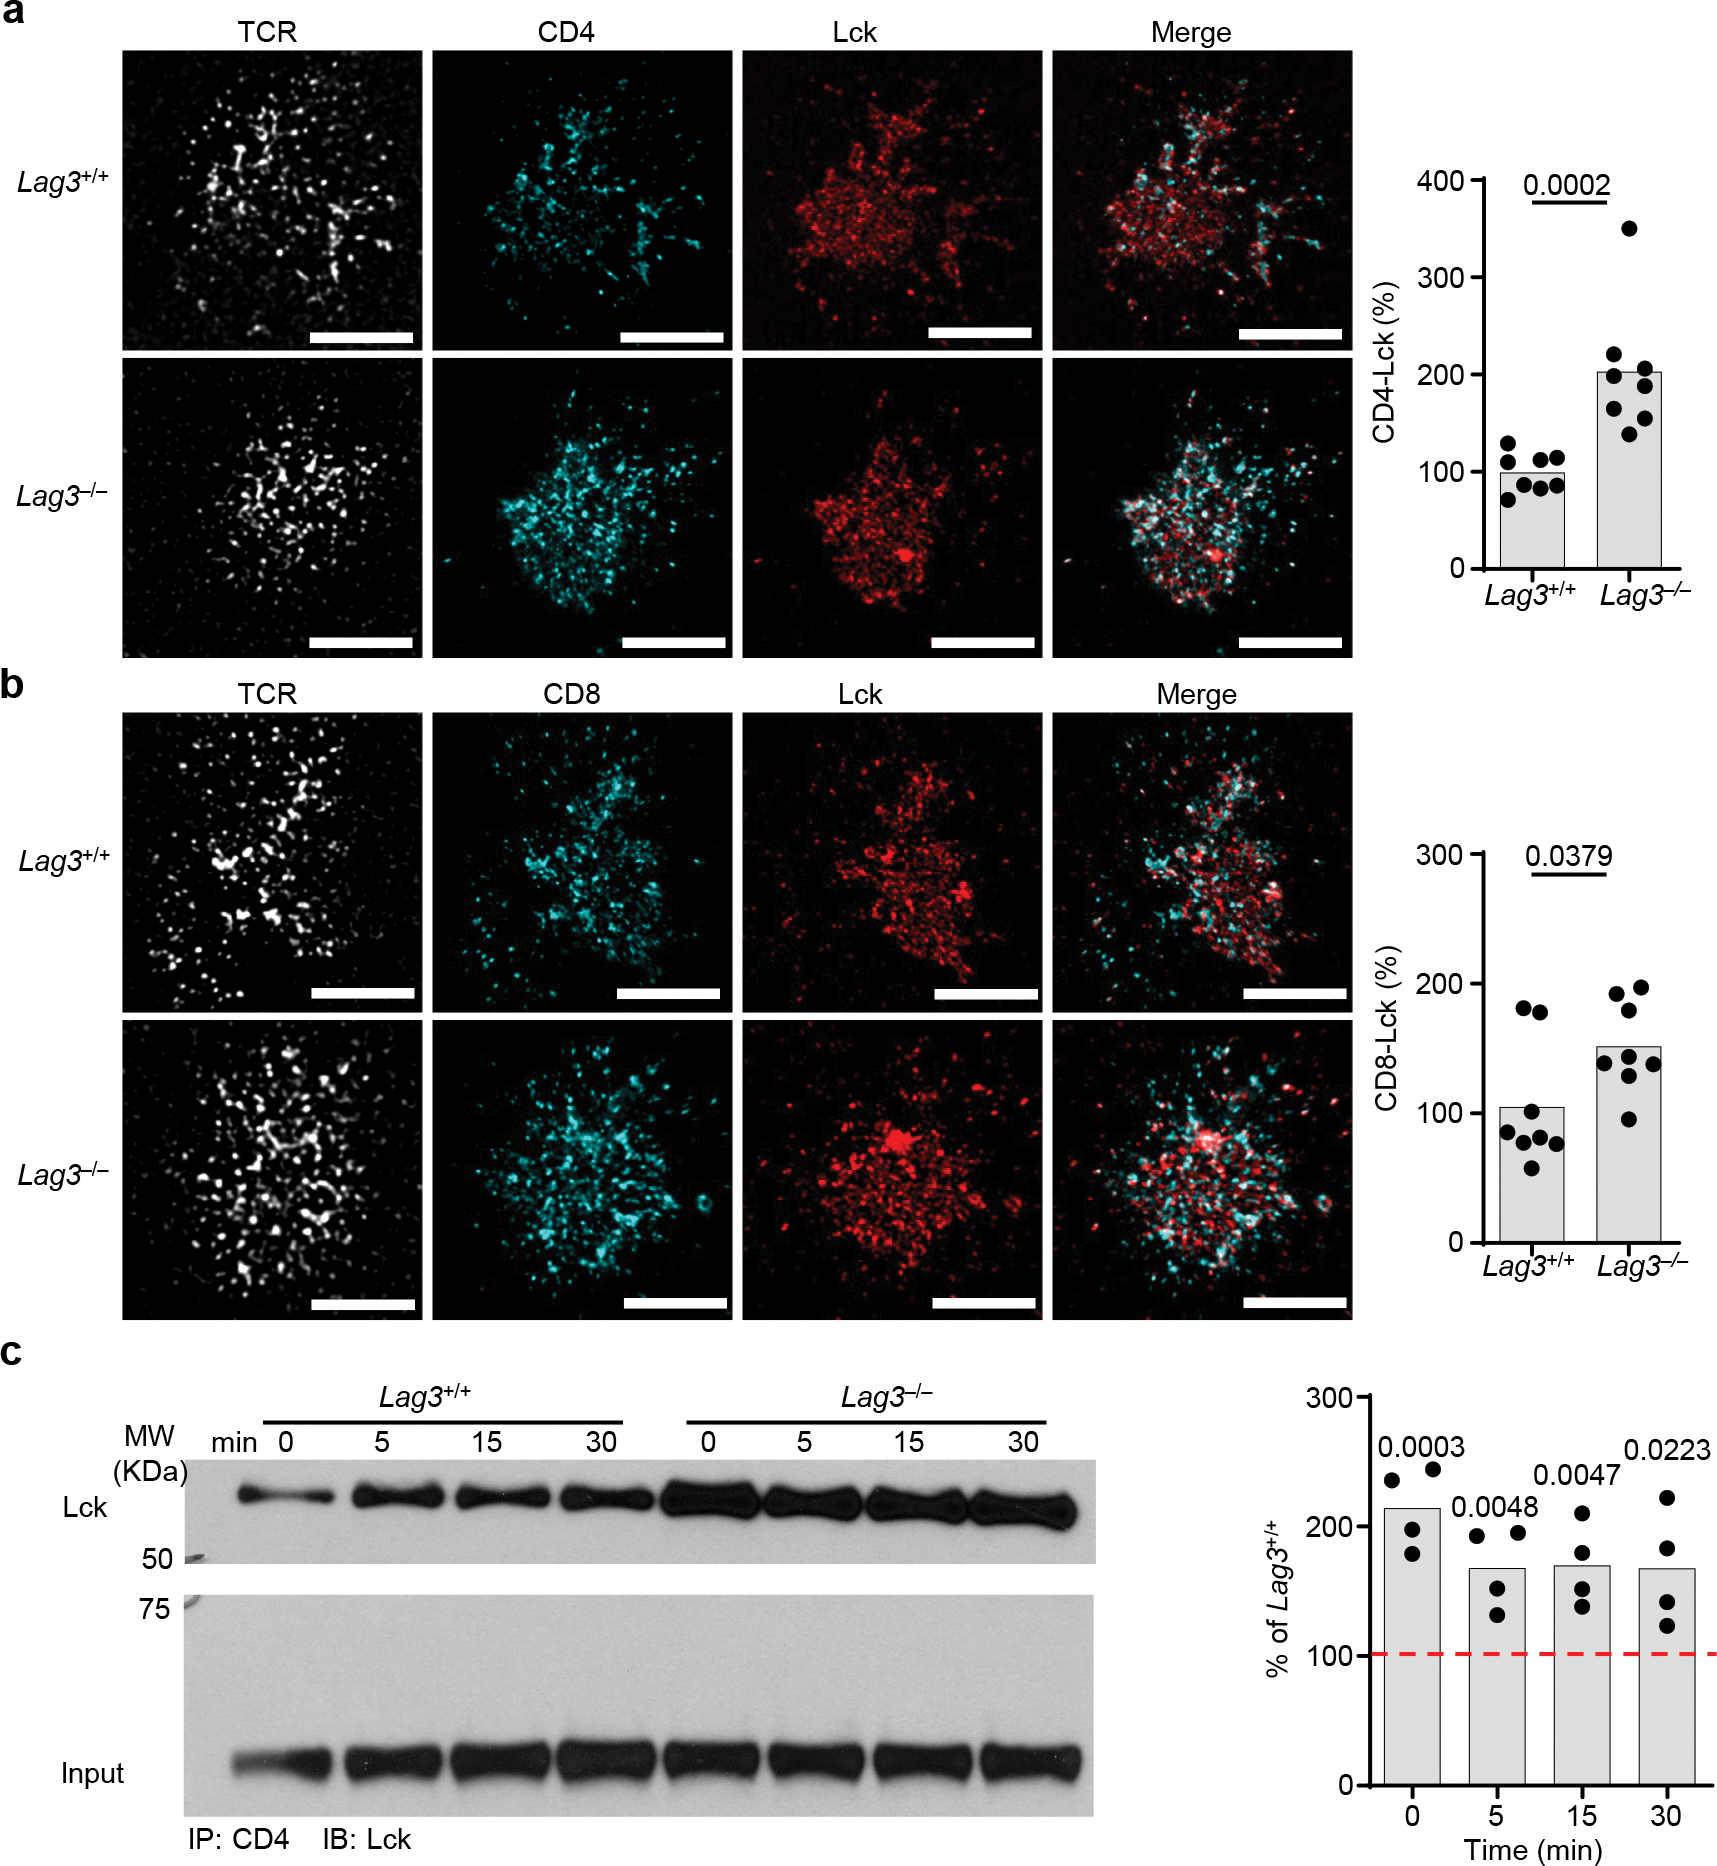
(a,b) Representative super resolution STED of association of Lck with CD4 and CD8 coreceptors in CD4+ or CD8+ T cells isolated from the spleen and lymph nodes of LAG3+/+ and LAG3−/− mice with quantification of their association shown (Scale bar = 2μm). (c) Co-immunoprecipitation western blot analyses of Lck with CD4 in CD4+ or CD8+ T cells isolated from the spleen and lymph nodes of LAG3+/+ and LAG3−/− mice, with quantification shown. Data in (a-c) represent analyses from at least 3–4 independent experiments and statistics determined by unpaired Student’s two-sided t test or (c) Wilcoxon matched pairs signed rank test with P values noted in figure.
LAG3 EP motif binds Zn2+
CD4 and CD8 associate with Lck through a unique di-cystine motif that is coordinated via Zn2+ 29. Phylogenetic analysis of the LAG3CT indicated a high frequency of glutamic acid (Glu/E) residues and a unique, highly repetitive glutamic acid-proline tandem repeat, called an EP motif (Extended Data Fig. 4). The LAG3CT and Lck have electrostatic similarities, with acidic isoelectric points (pI) of 4.75 and 4.02, respectively (see methods). As glutamic acid residues can also co-ordinate Zn2+ 33, we assessed whether LAG3 regulated the association of Lck with CD4 and CD8 through Zn2+ displacement. As such, we co-immunoprecipitated the CD4-Lck complex from Lag3−/− CD4+ T cell lysates incubated with a 26 amino acid tandem repeat peptide to mimic the wild-type LAG3 EP motif, or a series of mutants in which glutamic acid (E) was substituted with similar negatively charged residue (aspartic acid, DP), or an uncharged residue (glutamine, QP), or proline was substituted with glycine (EG) to assess the importance of these negatively charged amino acids (Extended Data Fig. 5a). The EP, DP and EG peptides alone displaced Lck from CD4 in a dose dependent manner, whereas the QP peptide did not (Fig. 5a), suggesting that a negatively charged amino acid was required to displace Lck from CD4, while the proline residue appeared to be dispensable.
Figure 5. The ‘EP’ motif in the CT of LAG3 disrupts co-receptor-Lck complex.
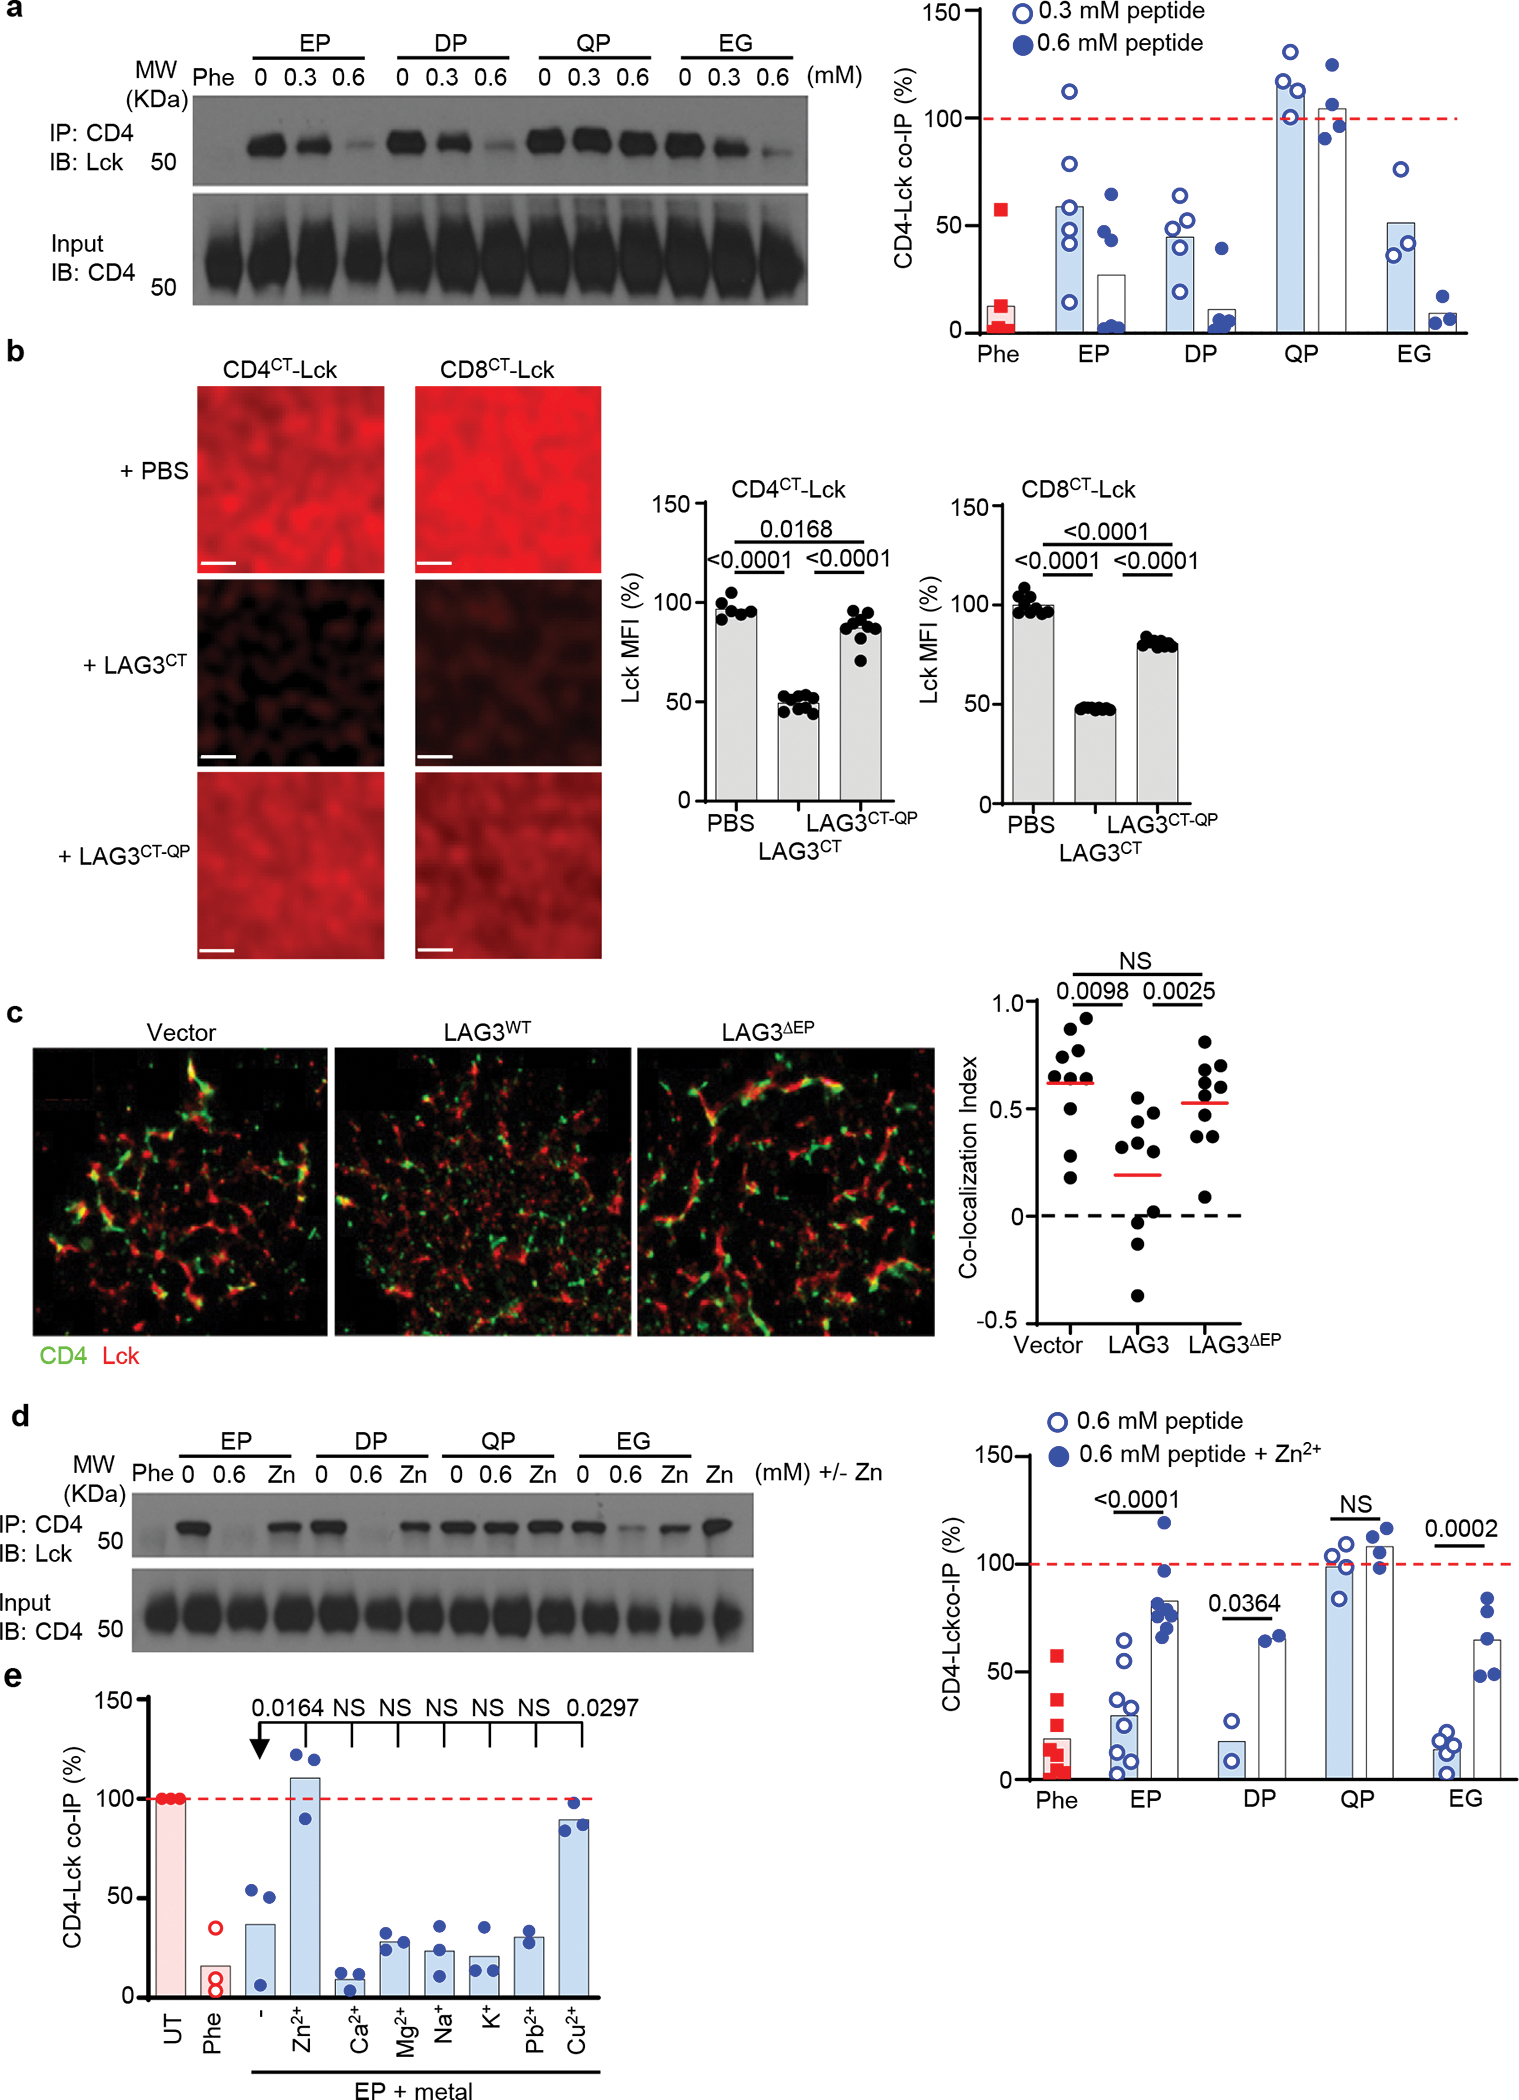
(a) Immunoblot analyses of CD4 and Lck in lysates of Lag3−/− CD4+ T cell stimulated with CD3ε and CD28 Abs, following one hour incubation with 26 amino acid LAG3 ‘EP’ peptide motif or peptides with amino acid substitutions as depicted with 1–10-O pheanthroline (Phe) utilized as a positive control. (b) Analysis of phase separation and dissociation of Lck from membrane-tethered CD4CT or CD8CT in response to LAG3CT or LAG3CT-QP mutant, with quantification shown. Scale bar 1μm. (c) Representative super resolution STORM of molecular interactions between CD4 and Lck in CD4+ T cells isolated from the spleens and lymph nodes of Lag3−/− mice, transduced with empty vector, LAG3 or LAG3 lacking the ‘EP’ motif (LAG3ΔEP) and stimulated with TCRβ Abs. The co-localization index of CD4 and Lck was analyzed and is depicted. Scale bar 5 μm. (d) Immunoblot and quantification of co-immunoprecipitation western blot analyses of CD4 and Lck in Lag3−/− CD4+ T cell lysates as above following addition of the LAG3 ‘EP’ peptide motif or peptide mutants in the presence or absence of competing Zn2+ or (e) alternative 2+ metals. Data in (a, b, d, e) are representative of 3–5 experiments, with statistical analysis performed using Student’s unpaired two-sided t test. For (c) data are representative of at least 2 experiments and 15 individual data sets with data represented as mean and statistics determined by Kruskal-Wallis test. P values are noted in figure.
We then used planar nickel-containing lipid bilayers with lipid-tethered unlabeled hCD4CT associated with non-tethered TAMRA+ Lck to evaluate the impact of hLAG3CT on hCD4CT-Lck complexes (Extended Data Fig. 5b). Addition of hLAG3CT or a hLAG3CT-QP mutant to the preformed hCD4CT-Lck complexes led to dynamic protein reorganization and partitioning (Fig.5b), accompanied by a ~50% reduction in TAMRA+ Lck fluorescence, suggesting its dissociation from the lipid-tethered hCD4CT, in response to hLAG3CT but not hLAG3CT-QP (Fig. 5b). This was also observed when using hCD8CT -Lck (Fig. 5b). LAG3CT-QP had residual ability to dissociate Lck from CD4 or CD8 (Fig. 5b), suggesting other motifs within the LAG3 cytoplasmic tail may contribute to this interruption.
Next, we used a planar lipid bilayer system and acceptor photobleaching FRET to determine if the close intermolecular interaction of CD4CT and LAG3CT was mediated through the EP motif. Phase-separated donor TAMRA+ hCD4CT exhibited efficient FRET to acceptor AF647+ hLAG3CT compared to AF647+ hLAG3CT-QP (Extended Data Fig. 5c). This was confirmed by an increase of TAMRA+ hCD4CT intensity following photobleaching of AF647-labeled hLAG3CT, which did not occur with AF647+ hLAG3CT-QP (Extended Data Fig. 5c). These data suggested that the close intermolecular interactions between CD4CT or CD8CT and LAG3CT were mediated by the EP motif, despite the fact that there are no common structural motifs in CD4CT and CD8CT (Extended Data Fig. 5d). Considering that the pI of CD4CT and CD8CT is 11.25 and 11.62, respectively, while the pI of LAG3CT is 4.75, the intermolecular interactions may be mediated through these divergent protein-protein charged interactions. We also determined the importance of the LAG3 EP motif in the dissociation of the CD4-Lck complex using STORM in Lag3−/− CD4+ T cells transduced with an empty (control) vector, full length LAG3 (LAG3WT) or a mutant LAG3, in which the EP motif was deleted (LAG3ΔEP) stimulated with TCRβ Abs on a planar lipid bilayers. We observed that LAG3WT, but not LAG3ΔEP, reduced the CD4-Lck association compared to empty vector (Fig. 5c).
We then asked if divalent cations, and in particular Zn2+, impacted the ability of the LAG3 EP motif to interfere with the CD4-Lck complex. Excess exogenous Zn2+ prevented the dissociation of the CD4-Lck in the presence of the EP, DP and EG peptides, compared to the addition of peptides alone (Fig. 5d). This observation was specific to certain divalent cations, as Cu2+ could also block the dissociation of the CD4-Lck, whereas other divalent, and all monovalent cations tested could not (Fig. 5e)34.
To assess whether the LAG3 EP motif bound Zn2+ directly and this binding induced the dissociation of the co-receptor-Lck complex, we synthesised a murine LAG3 cytoplasmic domain (mLAG3CT) and performed isothermal titration calorimetry (ITC), wherein endothermic or exothermic reactions are indicative of intermolecular interactions. ITC data determined that mLAG3CT and hLAG3CT, as well as mDP and mEG mutants bound Zn2+, but mQP did not (Extended Data Fig. 6a). Although the interaction between mLAG3CT and Zn2+ was weak (Supplementary Table 3), other factors may shift the equilibrium and induce the dissociation of the co-receptor-Lck complex when LAG3 is in close proximity. Taken together, these observations suggested that the EP motif in the cytoplasmic domain of LAG3 was sufficient to disrupt Zn2+-dependent interactions between the co-receptors and Lck.
LAG3 lowers the local pH in the IS
To test whether the large number of glutamic acid residues in the LAG3CT lowered the local pH within the microenvironment around LAG3, we used 2D NMR and purified recombinant CD4-Lck complexes bound with Zn2+ to assess the impact of pH (4–5.5) on their association compared to EDTA which chelates Zn2+ (Extended Data Fig. 6b). The 2D 1H/15N HSQC spectra represent the fingerprint of the protein amide backbone, with well-dispersed peaks indicative of a well-folded protein, peaks clustered in a narrow window in the 1H dimension indicative of disordered proteins, while changes in the peak position are indicative of changes in the protein structure. Analysis of the 2D NMR spectra indicated the disruption of the CD4-Lck complexes with decreasing pH, with an observed pKa of 4.55 ± 0.1 as determined by peak intensity analysis (Fig. 6a) emulating the release of Zn2+ with EDTA (Extended Data Fig. 6b).
Figure 6. LAG3 dissociates Lck from CD4 by lowering the local pH at the IS.
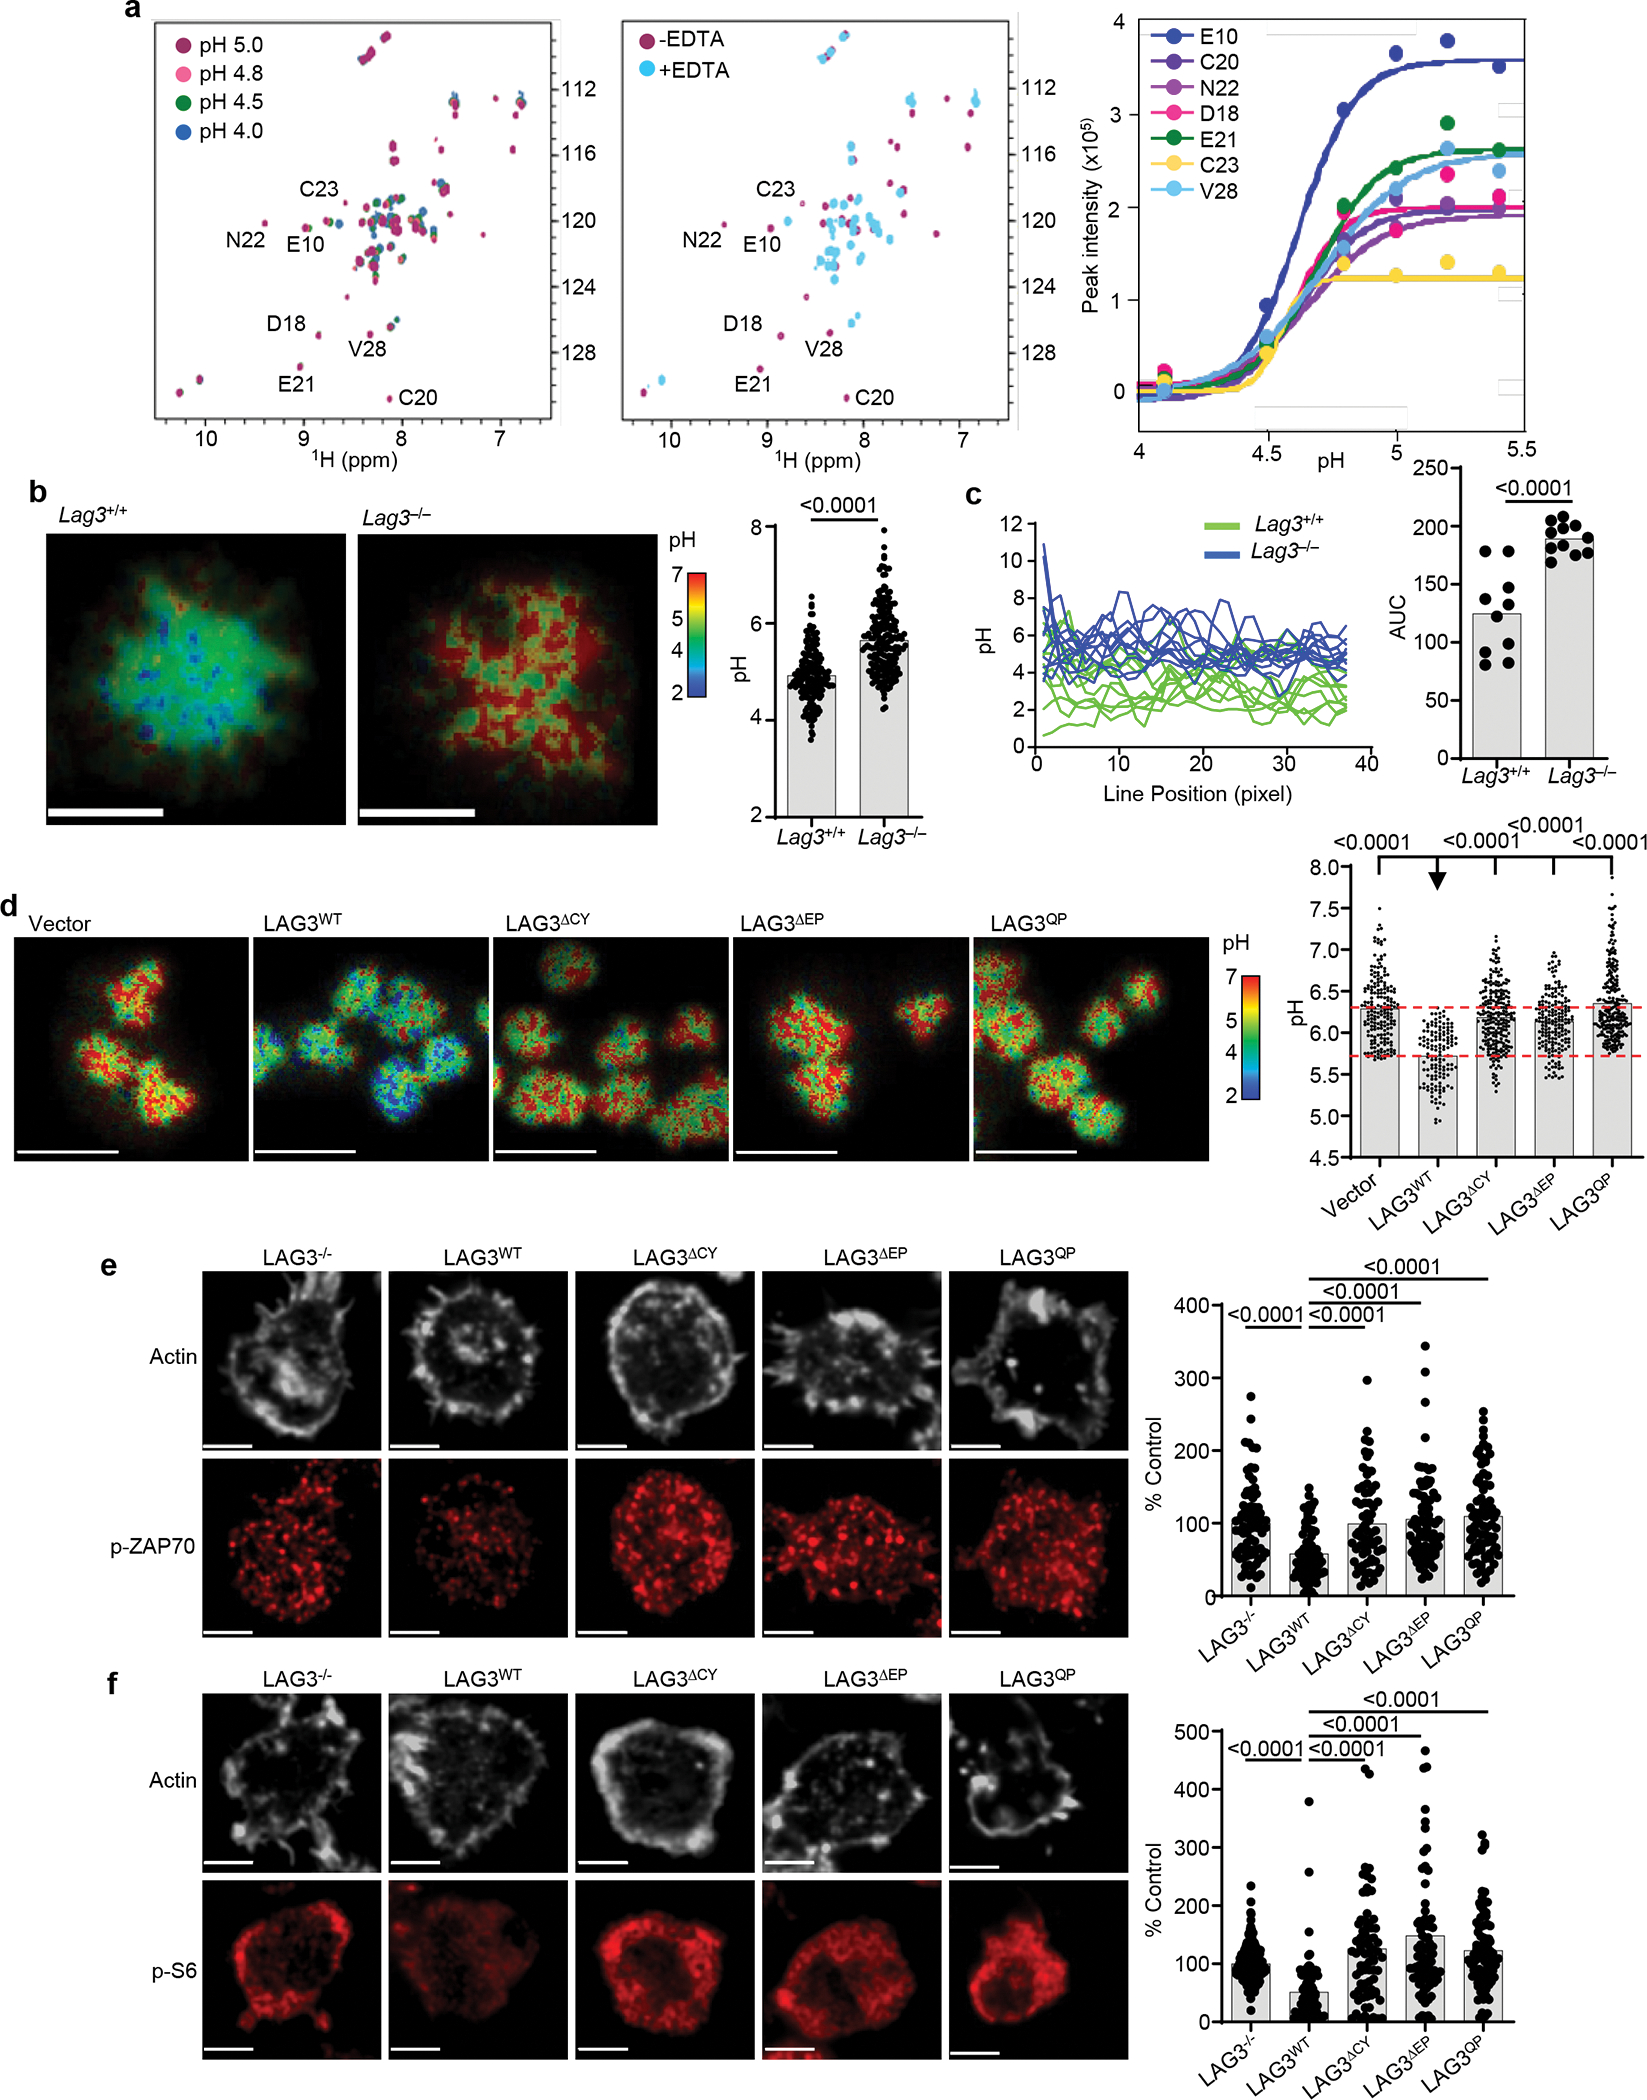
(a) Analyses of CD4-Lck complex formation evaluated by 2D NMR under conditions of varying pH, using the 1H/15N HSQC spectra of a 50 μM 1:1 complex 15N-Lck:CD4CT in the presence of 1.2 molar equivalents of Zn2+ with addition of EDTA as control. Right: pH-dependent changes in the peak intensity for selected residues normalized to their intensity in the spectrum of the fully folded complex. (b) Representative confocal FLIM images of BCECF-labeled CD4+ T cells isolated from spleen and lymph nodes of Lag3+/+ and Lag3−/− mice to determine the intracellular membrane-proximal pH by fluorescent lifetime imaging following stimulation with TCRβ Abs with quantification of membrane-proximal pH of individual cells. Scale bar 5μm. Data are replicates from 3 separate experiments. (c) pH values determined for each pixel along a line drawn through the center of the contact area with quantification of the area under the curve determined. (d) Representative confocal FLIM images of BCECF-labeled Lag3−/− CD4+ T cells transduced with LAG3 and mutants following stimulation with TCRβ Abs with quantification shown. Scale bar 10 μm. Data are replicates from 3 separate experiments. (e, f) Representative super resolution confocal images of TCR-induced signaling events in Lag3−/−CD4+ T cells, isolated as above, transduced with LAG3WT or LAG3 functional domain mutants and stimulated with TCRβ Abs. Single cell intensity measurements collected from two independent experiments presented as percent of LAG3-deficient parental cells as control. Scale bar 2μm. Data represent mean of replicate measurements from at least 2 separate experiments. Data shown for individual cells (b, e) and statistical analysis performed using unpaired Student’s two-sided t test with P values noted in figure.
Next we used fluorescence-lifetime imaging microscopy (FLIM) analysis in Lag3+/+ and Lag3−/− CD4+ T cells loaded with BCECF (2′,7′-bis-(carboxyethyl)-5-(and-6)-carboxyfluorescein), a fluorescent pH sensor, following TCR Ab stimulation on a planar lipid bilayer to calculate modulations in membrane pH at the IS. There was an increase in the pH at the IS of Lag3−/− CD4+ T cells compared to Lag3+/+ CD4+ T cells (Fig. 6a). Although this approach cannot determine the specific pH, line intensity measurements of the IS, quantified using the area under the curve (AUC), indicated that clustered membrane regions had a pH that appeared to be at or below the threshold determined by NMR to disrupt CD4-Lck binding shown above (Fig. 6c), indicating a change in pH in the presence of LAG3. Expression of LAG3WT in Lag3−/− CD4+ T cells resulted in reduced membrane pH compared to vector control, while the expression of LAG3 mutants lacking the entire CT (LAG3ΔCY), the EP motif (LAG3ΔEP) or expressing a QP mutant motif (LAG3QP) did not result in reduced membrane pH (Fig. 6d).
Finally, to validate that the LAG3 EP motif was required to disrupt signaling downstream of co-receptor-Lck interaction, we used TIRFM to assess the phosphorylation of ZAP70, which is dependent on Lck, and the phosphorylation of S6, a distal TCR signaling event. We transduced CD4+ and CD8+ Lag3−/− T cells with either LAG3WT, LAG3ΔCY, LAG3ΔEP or LAG3QP. Expression of LAG3 WT in activated CD4+ T cells significantly reduced the phosphorylation of both TCR proximal ZAP70 (Fig. 6e) and TCR distal S6 (Fig. 6f) signalling components in response to TCR ligation. In contrast, LAG3 mutants lacking the cytoplasmic tail or mutants without an intact EP motif (LAG3ΔEP or LAG3QP), did not reduce TCR-induced signalling events in comparison with Lag3−/− cells. These results were similarly observed in activated CD8+ T cells (Extended Data Fig. 7a, b) and suggest that the inhibitory activity of LAG3 on both CD4+ and CD8+ T cells is dependent on the glutamic acid residues within its EP motif. Taken together, these data indicated that the EP motif in the LAG3CT mediated a small, but physiologically meaningful reduction of local pH within the IS, which led the dissociation of the co-receptor-Lck complex, and in turn limited signalling downstream of the TCR signaling.
Discussion
Here we show LAG3 could inhibit proximal TCR signaling and T cell function in the absence of its canonical ligand, MHC class II. LAG3 molecules migrated to the immunological synapse through association with the TCR-CD3 complex. The accumulation of LAG3 and the largely phylogenetically conserved, repetitive acidic, tandem glutamic acid–proline repeat in the LAG3 cytoplasmic tail lowered the local pH at the IS. This caused co-receptor-Lck dissociation through the sequestration of Zn2+, which ultimately limited downstream TCR signaling events.
Our results do not preclude a role for MHC class II, which may be important in situations where LAG3 is limiting or as a mechanism to enhance LAG3 function on CD4+ T cells when the MHC-peptide concentration on APCs might be limiting. LAG3 on CD4+ T cells has been reported to selectively associate with stable peptide-MHC class II complexes, which are thus more likely to be engaged by the TCR. Future studies specifically examining the interactions between LAG3, CD4 or CD8, TCR-CD3 and MHC class II may provide further insight into the mechanism of LAG3 function. While we cannot exclude the possibility that LAG3 impacted TCR-CD3 complex function directly, our observations suggest that LAG3 may use the TCR to migrate to the IS. How this association is mediated remains unknown.
At least in part, our data suggest that the cytoplasmic tails of LAG3 and the co-receptors may intrinsically interact owing to electrostatically-driven protein-protein interactions. These types of interactions are often associated with phase separation and formation of multimeric protein assemblies, which have been reported to control multiple biological processes21,22. Further to this possibility, our data suggest a role for glutamic acid residues within the unstructured cytoplasmic tail of LAG3 in mediating interaction with the co-receptors. Certain glutamic acid–rich motifs are necessary for sorting to the endosomal or lysosomal compartments35,36, but a role in pH modulation has not been shown. Glutamic acid residues are over-represented in intrinsically disordered proteins (IDPs), which are well recognized to play key roles in a diverse array of biological functions, with glutamic acid residues mediating protein-protein interactions at least in part through electrostatics37. Given that LAG3 and the CD4 and CD8 co-receptors have disparate pI, electrostatically-driven interactions may underly the LAG3-driven regulation of T cell signaling. This mechanism could involve the pH-dependent dissociation of Zn2+ from co-receptor-Lck complexes and loss of Lck, with possible sequestration of Zn2+ by the LAG3 cytoplasmic tail. Reduced association of Lck, with either co-receptor would result in the reduced capacity to phosphorylate ZAP70 and abrogation of signaling downstream of the TCR-CD3 complex following stimulation.
While our proposed model is supported by multiple biochemical and cellular imaging approaches, a portion of the data presented relied upon single molecule detection using either STED or STORM-based super resolution. Such techniques are subject to limitations, which may include the possibility that relative Ab affinity and antigen availability within a densely packed region or structure may influence any Ab-based approach to determine protein abundance, while photophysical properties of the dyes utilized for super-resolution techniques may affect the depletion or blinking of these moieties in such dense structures. While it is true that illumination and detection parameters required for STED- or STORM-based imaging do not provide a quantitative determination of molecule abundance, the precision with which identified molecules can be located in x, y and z planes combined with co-ordinate-based algorithms, can yield highly informative data with respect to protein co-localization. In particular, while positioning of single molecules using STORM imaging is precise, the relative number of molecules detected can be influenced by the photophysical properties of the fluorophores used. To mitigate these effects, we utilized in this study a single reporter dye (Cy5) during multicolor activator STORM (actSTORM), rather than different reporter dyes in direct STORM (dSTORM), which may display varied brightness and duty cycles. Furthermore, we recognize that FRET-based imaging approaches could be subject to error unless performed rigorously. Sensitized emission FRET can be prone to errors from FRET donor bleedthrough and FRET acceptor cross-excitations. Thus, we determined both donor bleedthrough and direct excitation of the acceptor as separate coefficients for subsequent determination of the corrected FRET image. Sensitized emission FRET was chosen in an attempt to avoid donor photobleaching as could occur in cellular-based FRAP experiments. Despite the limitations of individual assays, collectively the data are supportive of a model wherein the association of LAG3 with the TCR complex facilitates the ability of LAG3 to regulate co-receptor-Lck interactions, thereby influencing signaling events and ultimately T cell activation.
The current LAG3-specific therapeutics for the treatment of cancer in the clinic are focused on blocking the LAG3-MHC class II interaction. Our observations provide new and exciting opportunities for the development of therapeutics targeting LAG3 and the LAG3-TCR association. These observations may also inform the development of LAG3 agonists for the treatment of autoimmune and inflammatory diseases.
METHODS
Further information and requests for reagents should be directed to and will be fulfilled by the Lead Contact, Dario A.A. Vignali (dvignali@pitt.edu)
Mice
The Lag3−/− mice obtained by Yueh-Hsiu (Stanford University, CA) with permission from Christophe Benoist and Diane Mathis (Harvard Medical School) 38 and the AND TCR transgenic mice 39 were housed in American Association for the Accreditation of Laboratory Animal Care-accredited, specific-pathogen-free facilities in Animal Resource Center, St. Jude Children’s Research Hospital (SJCRH), and Division of Laboratory Animal Resources, University of Pittsburgh Scholl of Medicine (UPSOM). Female and male mice were used. Animal protocols were approved by the Institutional Animal Care and Use Committees of SJCRH and UP.
Generation of LAG3 mutants
Constructs were generated by recombinant PCR and cloned into a mouse stem cell virus-based retroviral vector (MSCV) containing a ribosomal entry site (IRES) -Thy1.1 or GFP cassette. For all FAP, GFP, or mCherry tagged constructs a BspE1 restriction site followed by a 27 amino acid linker tagged with FAP, GFP or mCherry was inserted directly 5’ of the stop codon and all LAG3 and CD4 mutants minus a stop codon were cloned 5’ of the BspE1 site. Oligos used to generate mLAG3, hLAG3, and mCD4 mutants are listed in the STAR table or as previously described 8.
Recombinant cytoplasmic tails
Cytoplasmic tails of LAG3 (residues 475–425) and Lck (residues 7–35) were cloned in frame with an N-terminal GST affinity tag in pGEX-6p-3 vector (GE Healthcare), between BamHI and XhoI restriction sites. Residues 421–458, encompassing the cytoplasmic tail of CD4 were cloned in frame with an N-terminal poly-histidine affinity tag in pET28a vector (Novagen), between NdeI and XhoI restriction sites. Two-point mutations (C422S and C455S) were introduced in CD4 to circumvent aggregation problems caused by non-specific oxidation of these two cysteine residues. To be noted that these two residues are not involved in interaction with LCK 29 and do not alter the structure and function of the cytoplasmic tail 40.
Cell purification
Spleens and lymph nodes were removed from C57BL/6 or Lag3−/− mice, processed and stained for negative magnetic bead purification using the following biotinylated Abs: anti-CD4 (1:500) (BioLegend) anti-CD8α (1:500) (BioLegend), anti-CD11b (1:400) (BioLegend), anti-CD19 (1:500) (BioLegend), anti-B220 (1:500) (BioLegend), anti-CD25 (1:300) (BioLegend), anti-Ter119 (1:300) (BioLegend), anti-gdTCR (1:300) (Invitrogen), and anti-CD11c (1:250) (BioLegend). For cell sorting, transduced cells were stained with biotinylated anti-Thy1.1 (BD-Pharmingen) and detected with BUV395 Streptavidin (BD Biosciences). Cells were sorted on an Aria II (BD Biosciences).
Lipid bilayers
Lipid bilayers were constructed as described 41, with some modifications 42. Briefly, liposomes comprised of 90% dioleoylphosphocholine, 10% DOGS (1,2-dioleoyl-SN-Glycero-3-{[N(5-amino-1carboxypentyl) iminodiacetic acid]succinyl}), and 0.2% biotin-CAP-PE (Avanti Polar Lipids) were deposited on glass coverslips cleaned with piranha solution (50:50 mixture of 30% H2O2 and 96% H2SO4). Alexa-488 streptavidin, Alexa-647 streptavidin or unconjugated streptavidin and biotinylated TCRβ mAb were sequentially loaded onto the bilayer, while unlabeled poly-his-tagged ICAM1 produced in a baculovirus system was loaded to facilitate T cell adhesion.
T cell stimulation and phospho-imaging
CD4 and CD8 T cells were purified by negative selection and expanded for 48 hr using platebound anti-CD3 (clone 145–2c11; 1μg/mL) and anti-CD28 (clone 37.51; 1μg/mL). Cells were collected and allowed to rest on ice for 2 hr prior to stimulation with planar lipid bilayers as described above, for 15 min. Cells were subsequently fixed with 4% paraformaldehyde, permeabilized with 0.1% T-100, and blocked with PBS containing 2% bovine serum albumin and 5% goat serum before incubation with pZAP70 (cell signaling technologies, cat#2701), pERK (cell signaling technologies, cat#4370) or pAKT (cell signaling technologies, cat#4060) Abs, as well as fluorescently labeled phalloidin (ThermoFisher). All antibodies were used at 1:200. Images were acquired with a Marianas CSU-W with super resolution via optical reassignment (SoRa) spinning disc equipped with a 100X oil objective, Prime95B sCMOS camera and Slidebook software (Intelligent Imaging Innovations).
T cell transduction
Magnetic bead purified Lag3−/− CD4+ T cells were stimulated on plate bound anti-CD3/anti-CD28 for 48 hr. Cells were spin transduced at 2000g for 1 hr at 30°C in the presence of polybrene (4μg/ml) and viral supernatant generated 24–30 hours prior on HEK-293T cells transiently transfected with MSCV-based retroviral vector containing LAG3 and LAG3 mutants with an IRES-Thy1.1 cassette, and packaging plasmid pCL-Eco. The cells were allowed to rest for 24 hours and then sorted based on Thy1.1 expression.
Proliferation assays
CD4 and CD8 T cells were purified by magnetic negative selection, and cultured in 96-well tissue culture plates at 1 × 10⁵ cells per well. Proliferative responses were assessed by thymidine incorporation or by cell trace violet after 72 hr stimulation with plate bound anti-CD3 (clone 145–2C11) and anti-CD28 (clone 37.51). Monoclonal anti-LAG3 (clone C9B7W) or isotype control Abs were included during culture conditions.
Immunoblotts
CD4 T cells were activated with plate bound anti-CD3 and anti-CD28 Abs [1μg/ml] for 48 hrs, removed from the stimulatory surface and re-plated in fresh media containing 10U/mL IL-2 for a further 48 – 72 hr. Cells were collected and re-suspended in PBS containing anti-CD3, and incubated on ice for 30 min prior to receptor crosslinking with goat anti-hamster secondary Ab for times denoted in figure legends. Cells were pelleted and resuspended in lysis buffer comprised of 20mM Tris pH 8.0, 150mM NaCl, 1% NP-40 as well as protease and phosphatase inhibitors. 25 μg of total protein was electrophoretically separated and analyzed by Western blotting using the following Abs: pZAP70 (clone 65E4), pPLCγ (clone D6M9S), pAKT (S473; clone D9E), ZAP70 (clone D1C10E), AKT (9272) (Cell signaling technology) and Actin (clone AC-74; Sigma). Antibodies were at 1:1000
Immunoprecipitation – immunoblots
Co-immunioprecipitation of CD4 and Lck was performed with cell preparations as described above. For IP-Western blot analyses, 100ug of total protein was immunoprecipitated with anti-CD4 (clone GK1.5) followed by purification of complexes using protein G beads. In selected experiments, LAG3 peptides encompassing the EP motif, or the mutant peptides DP, QP or EG, were added to cell lysates derived from LAG3-deficient CD4 T cell blasts. Following 1 hr incubation with peptide at room temp, lysates were subjected to CD4 immunoprecipitation, followed by Western blot analyses to detect bound Lck (3A5). Co-immunoprecipitation studies to determine interaction of the CD3 complex with LAG3, were performed using anti-TCRβ (H57–157) or CD3ε (145–2C11) in the above buffer containing 1% NP-40, or in buffer containing either 1% CHAPS or 1% Digitonin.
Total internal reflection fluorescence (TIRF) microscopy
Transduced T cells were sorted, rested 24–48 hours, incubated with MGnBu (200nM) in RPMI without FBS or phenyl red for 15 minutes at 37°C, washed, resuspended in RPMI without FBS or phenyl red and stimulated on a planar lipid bilayer. Imaging was performed using a Nikon Ti inverted microscope equipped with motorized TIRF arm and 100× 1.40 N.A. objective. Images were acquired at 100ms intervals continuously for up to 15–20 minutes with a Zyla sCMOS camera (Andor) equipped with bandpass emission filters for DAPI, FITC, TRITC, and Cy5 spectral profiles.
Stochastic Optical Reconstruction Microscopy (STORM)
Activated CD4 blasts from wildtype C57BL/6 or LAG3-deficient mice were analyzed by high resolution STORM imaging following stimulation with planer lipid bilayers. 3-dimensional STORM was facilitated using an N-STORM system (Nikon Instruments) which incorporates an astigmatic lens into the optical path which includes a 100X 1.45 NA oil objective and DU-897 EMCCD camera (Andor), as previously described 43. Analyses of TCR microclusters was facilitated using AF647-labeled TCR molecules, and Abs directed against LAG-3 (clone 49C10), CD4 (clone RM4–5) and CD8 (clone 53–6.7) with AF568 and CR488-mediated detection in STORM imaging buffer comprised of 20mM Tris pH8.0, 50mM NaCl, 10% glucose, oxygen scavenging enzymes and 10mM thiol reagent, as previously described 43. In some experiments, transduced cells were sorted after 48 hr based on GFP expression, and rested overnight in media containing 5 U/mL IL-2, prior to restimulation with planar lipid bilayers and STORM analyses as described above using CD4 (clone RM4–5) and Lck (7385; Cell Signaling technology) Abs, with secondary STORM-appropriate Abs as reported previously44. Co-localization of STORM-identified single molecules was performed using our recently developed algorithm NSInC (Liu et al, Statistical Methods in Medical Research, in revision). NSInC was determined to be unbiased under conditions of spatial randomness, incorporating terms for edge effect and most importantly, for normalization and independence of molecule number, which is significant owing to photophysical properties of dyes used for STORM analyses. Briefly, 3-dimensional co-ordinate data were analyzed using our algorithm which contains terms correcting for molecule number as well as edge effect, and which is customizable according to the data, allowing for determination of inter-molecular clustering within a defined sphere of radius r or according to an unbiased analysis of the data distribution. An index value of 1 would indicate complete co-localization or co-occurrence within the 3D volume, a value of 0 would indicate complete spatial randomness of the molecules, while a value of −1 would indicate that the molecules are exclusionary. The algorithm and details are available with an accompanying script upon request.
Stimulated emission depletion (STED) microscopy
For super resolved confocal imaging, cells were imaged with a 100× 1.4NA oil objective on a Leica TCS SP8 STED 3X microscope equipped with a tunable (470–670 nm tunability range) white light laser and three STED depletion lasers with wavelength of 592 nm, 660 nm and 775 nm.. Alexa-488, Alexa-594, and Atto-647N dye-labeled probe channels were excited at 494 nm, 590 nm, and 650 nm wavelengths, respectively, using the white light laser and detected with Leica GaAsP HyD detectors in 498–536 nm, 595–645 nm, and 655–740 nm ranges, respectively. Alexa-594 and Atto-647N dye-labeled probe channels were imaged in 3-D STED mode using 775 nm depletion laser with pinhole diameter set to 0.8 Airy unit calculated for the lowest wavelength of the two dyes. Alexa-488 dye-labeled probe channel was imaged in confocal mode with pinhole diameter set to 0.4 Airy unit. All images were acquired with LAS X software (version 3.5) as 3-D stacks with 22 nm XY pixel size and either 120 or 150 nm Z-step size. Post-acquisition, the images were processed with built-in Lightning adaptive deconvolution module with optimized settings for each channel.
Calcium signaling
TCR-activated T cells were labelled with 1μm Oregon green BAPTA-488 (ThermoFisher; O6807) prior to stimulation with planar lipid bilayers as described above. Cells were imaged using an inverted TiE microscope, equipped with a 1.4× 40X oil objective, Lambda LS lightsource and DU-897 EMCCD camera controlled by and analyzed with, NiS Elements software (Nikon Instruments).
Protein biochemistry on planar lipid bilayers
To determine protein-protein interactions in a cell-free system, we utilized planar lipid bilayers comprised of 90% dioleoylphosphocholine, and 10% DOGS (1,2-dioleoyl-SN-Glycero-3-{[N(5-amino-1carboxypentyl) iminodiacetic acid]succinyl})20. Purified poly-his-tagged CD4 (HHHHHHRSRHRRRQAERMSQIKRLLSEKKTCQCPHRFQKTSSPI) or CD8 (HHHHHHRNRRRVCKCPRPVVKSGDK) cytoplasmic tails containing carboxy-TAMRA, was loaded onto the bilayer at a concentration of 1 μM in buffer comprised of 20 mM HEPES, 20 mM NaCl, 0.1mM ZnSO4 and 0.15% β-mercaptoethanol. Bilayers were washed with buffer prior to the addition of 1 μM LAG3wt cytoplasmic tail (HHHHHHRRQWRPRRFSALEQGIHPPQAQSKIEELEQEPEPEPEPEPEPEPEPEPEQLC) or a LAG3qp mutant (HHHHHHRRQWRPRRFSALEQGIHPPQAQSKIQQLQQQPQPQPQPQPQPQPQPQPQQLC). Bilayers were washed and imaged using a CSU-X spinning disk confocal with a 1.45 NA 100X objective and Prime95B sCMOS camera. To determine the effect of LAG3 on preformed CD4 or CD8 co-receptor complexes containing Lck, unlabeled CD4 or CD8 cytoplasmic tails were loaded onto the bilayer as above. Bilayers were washed and subsequently incubated with 1 μM TAMRA-labeled Lck (SHPEDDWMENIDVCENCHYPIVPLDGKGT). Individual lanes were washed and imaged prior to incubation with unlabeled LAG3 for 15 min. Bilayers were subsequently washed and re-imaged to determine the extent of Lck dissociation, expressed as a percent of the starting control value.
Fluorescence lifetime imaging
Intracellular pH measurements were performed using planar lipid bilayer stimulation of CD4 T cell blasts loaded with BCECF (Thermofisher). Cells were loaded with 1μM BCECF in phenol red-free RPMI media on ice for 30 min. Preparations were pelleted, washed and resuspended in phenol red-free RPMI containing 1% FCS, followed by stimulation with planar lipid bilayers for 30min. Live pH measurements were performed using frequency-domain fluorescence lifetime imaging comprised of a frequency modulated 488nm laser line, CSU-X spinning disk, FLIM intensifier (Lambert Instruments) coolsnap EZ CCD camera (Photometrics) and Slidebook acquisition and analysis software (Intelligent Imaging Innovations). Lifetime measurements of the free-acid form of BCECF [1μM] dissolved in buffer of varying pH, were used as a standard to determine intracellular pH values.
Sensitized emission FRET
CD4 T cell blasts were retrovirally transduced with vectors encoding CD4-GFP and LAG3-mCherry, wherein fluorescent reporters are tagged to the cytoplasmic portions of the receptors. Cells were stimulated with planar lipid bilayers and illuminated with TIRF microscopy using a 100X 1.45 NA oil objective, and data collected using an Evolve EMCCD camera (Photometrics) and Slidebook software (Intelligent Imaging Innovations). Singly transfected cells were utilized to determine coefficients for donor bleed through, and direct excitation of acceptor. Signals were also normalized for donor expression, yielding a normalized FRET signal which was corrected according to the experimentally-derived coefficients (nFRETc). Ab-based FRET experiments utilized AF488 labeled anti-CD4 (clone RM4–5), AF488 labeled CD8 (clone 53–6.7) or AF488 conjugated streptavidin to link TCRβ Abs to the planar bilayer as described above, in combination with AF568 labeled anti-LAG3 (clone 4–10-C9). Cells were labeled and washed prior to stimulation with planar lipid bilayers followed by determination of sensitized emission FRET using a CSU-X spinning disk confocal equipped with a 100X 1.45 NA oil objective and sCMOS Prime95B camera. Singly labeled cells were utilized to determine nFRETc as described above.
Protein expression, purification and isoelectric point determination
Plasmids were transformed in BL21(DE3) E. Coli strain (Millipore) and cultures were grown in LB broth (EMD) for natural abundance isotopes and minimal media supplemented with 15NH4Cl for 15N isotopically labeled proteins. Protein expression was induced when OD600nm reached ~ 1.0 by the addition of 100 mg/L IPTG (Gold Biotechnology) and bacterial culture incubation was continued at 30 °C, overnight for GST-fusion proteins and for 3 h at 37 °C for the poly-His tagged construct. Bacteria were harvested by centrifugation for 20 minutes at 3,500 × g, at 4 °C.
Bacterial cultures expressing GST-LCK and GST-LAG3 proteins were lysed by sonication in 50 mL buffer A [20 mM Tris, 150 mM NaCl, 5 mM β-mercaptoethanol (BME), pH 7.5], supplemented with protease inhibitors cocktail (SigmaFAST, Sigma), per 1L cell pellet, centrifuged at 30,000 × g for 20 min, the supernatant loaded onto pre-equilibrated glutathione sepharose resin (GE Healthcare) and incubated at 4 °C for 30 minutes with rocking. The resin was washed with 10 column volumes of buffer A and bound protein eluted with buffer B (20 mM Tris, 150 mM NaCl, 5 mM BME, 10 mM reduced L-glutathione, pH 7.5). The GST tag was removed by dialyzing the eluted protein against 2 L 10 mM Tris, 150 mM NaCl, 2 mM BME, pH 8.0, in the presence of HRV3C protease (Biovision).
His-CD4 expressing bacteria were resuspended in buffer C (6 M guanidine hydrochloride, 20 mM Tris, 5 mM TCEP, pH 7.5), lysed by sonication. The supernatant collected by centrifugation was loaded onto a bed of Ni-NTA resin (Qiagen), washed with 5 column volumes of buffer C, 5 column volumes of buffer D (6 M guanidine hydrochloride, 20 mM Tris, 30 mM Imidazole, 10 mM TCEP, pH 7.5) and bound protein eluted with 3 column volumes elution buffer E (6 M guanidine hydrochloride, 20 mM Tris, 5 mM TCEP, 250 mM Imidazole, pH 7.5). Eluted protein was treated for 10 minutes at room temperature with 1 mM EDTA to remove any bound metals and dialyzed against 4 L 20 mM Tris, 50 mM NaCl, 1 mM TCEP, pH 7.5 buffer at 4 °C, overnight, to remove the denaturant. Some precipitation was observed in the dialysis bag and was removed by centrifugation. Poly-His tag was removed by incubation with Thrombin (Novagen) for 2 hours at 4°C.
The proteolytic digestion reactions were concentrated via centrifugation in 3.5 kDa cutoff Amicon centrifugal filters (Millipore), treated with 1 mM EDTA for 10 minutes and then mixed 1:1 with HPLC buffer A [0.1% trifluoroacetic acid (TFA) in H2O] and injected on a C4 HPLC column (Waters). The proteins were eluted with a 1% / min gradient of buffer B (0.1% TFA in acetonitrile). Fractions containing the desired peptide were collected, flash frozen and lyophilized. The correct mass of proteins was confirmed by mass spectroscopy. Lyophilized proteins were stored at −20 °C. The proteins were reconstituted in degassed deionized water, immediately before experiments were performed. Any leftover protein was flash frozen and stored at −80 °C. Concentration of LAG3 protein was determined spectroscopically based on tryptophan absorbance at 280 nm (ε280 nm = 5690 M−1·cm−1); concentrations of LCK and CD4 were determined based on the number of reactive Cys residues, using 5,5’-dithio-bis-(2-nitrobenzoic acid) (DTNB, G-Biosciences), according to the manufacturer’s protocol.
For isoelectric point determination, protein calculator (http://protcalc.sourceforge.net/) a free online biochemistry tool was used.
NMR spectroscopy.
All NMR spectra were collected at 25 °C on a Bruker Avance III 600 MHz spectrometer equipped with a TCI triple-resonance cryogenic probe. NMR data were processed using Topspin and analyzed using CARA 45 The Computer Aided Resonance Assignment Tutorial (CANTINA Verlag, Goldau, Switzerland)) software. The pH titration data was fit to an equation describing a two-state unfolding process determined by linear extrapolation 46. Unfolding free energy changes determined by the linear extrapolation method 46.
Isothermal titration calorimetry
Peptides were dialyzed overnight at 4 °C against the reaction buffer (10 mM Tris, pH 7.0) and titrations with ZnCl2 were performed in triplicate at 15 °C, into 75 μM peptide in a MicroCal Auto-iTC200 (Malvern).
Quantification and statistical analysis
Statistics were performed using Prism v7. Student’s two-sided t tests were used in Figures 1a, 1c, 2b, 2c, 3a, 3b, 4a, 4b, 4c, 5b, 5c, 5d, 5e, 6b, 6c, 6d, 6e, 6f, extended data 1a, 1b, 1e, 2c, 3a, 3b, 5c, 7a, and 7b. The Wilcoxon matched pairs signed rank test was performed for data in Figures 2b, 2c, 5c extended data 2d, 2f, 3d and 3e.
For the STORM data and investigating interactions between 2 molecular species, we employed two metrics: the shortest distances from one species to the other and the number of cross-channel neighboring signals within the specified vicinity (25nm × 25nm × 50nm) of the first species. For all hypotheses regarding the shortest distances which approximately follow normal distributions due to high density of signals in each dataset, we employed the 2-sided t test. Regarding number of neighbors, abundant zeros were observed in the count data and percentages of excess zeros in the LAG TCR CD4 data range from 30% to 90%. So, the zero-inflated Poisson (ZIP) model is the best choice for modeling this type of count data. The estimated counts of cross-channel signals in the Poisson process after fitting ZIP model were used for a t test for hypotheses due to the approximate normal distributions.
For all data panels, the number of individual experiments are listed in the legend. Graphs show individual samples. Samples are shown with the mean and individual data points with P values noted in all figures.
Data availability
All data generated or analyzed during this study are included in this published article and its supplementary information files.
Extended Data
Extended Data Fig. 1.
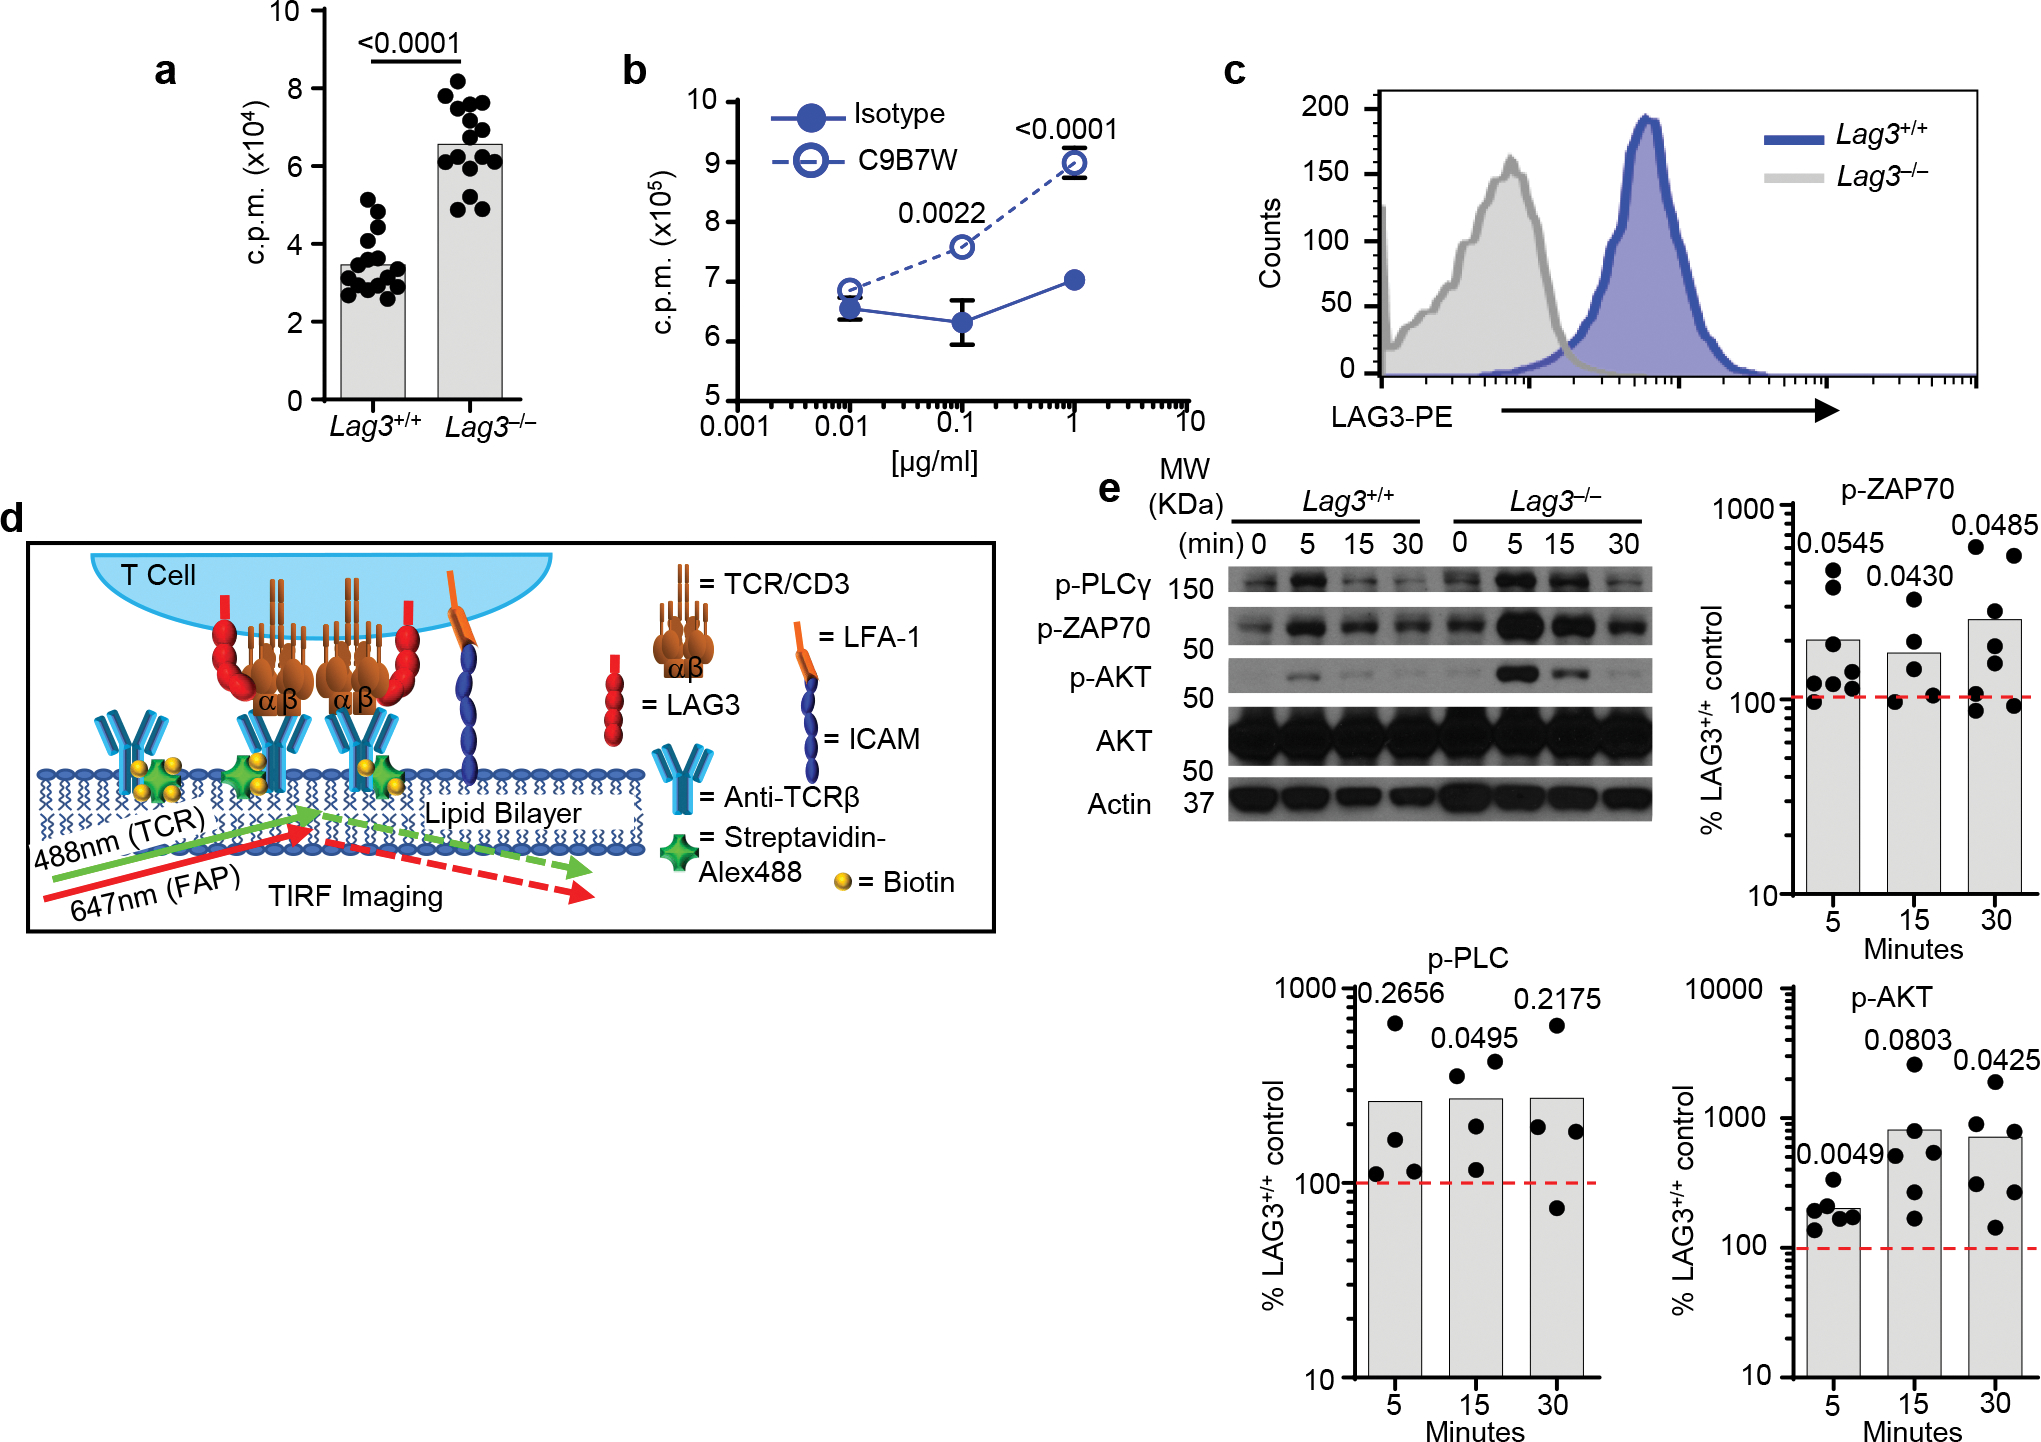
(a) Thymidine incorporation proliferation assay with purified CD4+ T cells from spleen and lymph nodes of LAG3+/+ and LAG3−/− mice stimulated with plate bound CD3ε and CD28 Abs for 72h in the absence (a) or presence of isotype control or anti-LAG3 blocking antibodies (b). (c) LAG3 expression of LAG3+/+ CD4+ T cells, isolated as above following activation with CD3ε and CD28 Abs at 48hr. Cells were gated on a live lymphocyte gate, and CD4. (d) Diagram depicting TIRF microscopy analysis on stimulating lipid bilayer. (e) Western blot analysis and quantification of TCR–proximal signaling events in Lag3+/+ or Lag3−/− CD4+ T cells stimulated for 48 hr with CD3ε and CD28 Abs to induce LAG3 expression, allowed to rest in the presence of IL-2 and then re-stimulated for 5, 15 and 30 min with anti-CD3. Quantitation determined by percent density of Lag3−/− compared to Lag3+/+. Data in (a) represents the mean of n=16 (LAG3+/+) and n= 16 (LAG3−/−) individual mice. Data in (b) represents the mean of n=6 (LAG3+/+) and n= 6 (LAG3−/−) individual mice. Data in (e) represents the mean of 4–8 individual experiments. Statistical analysis performed using Student’s unpaired two-sided t test with P values noted in figures.
Extended Data Fig. 2.
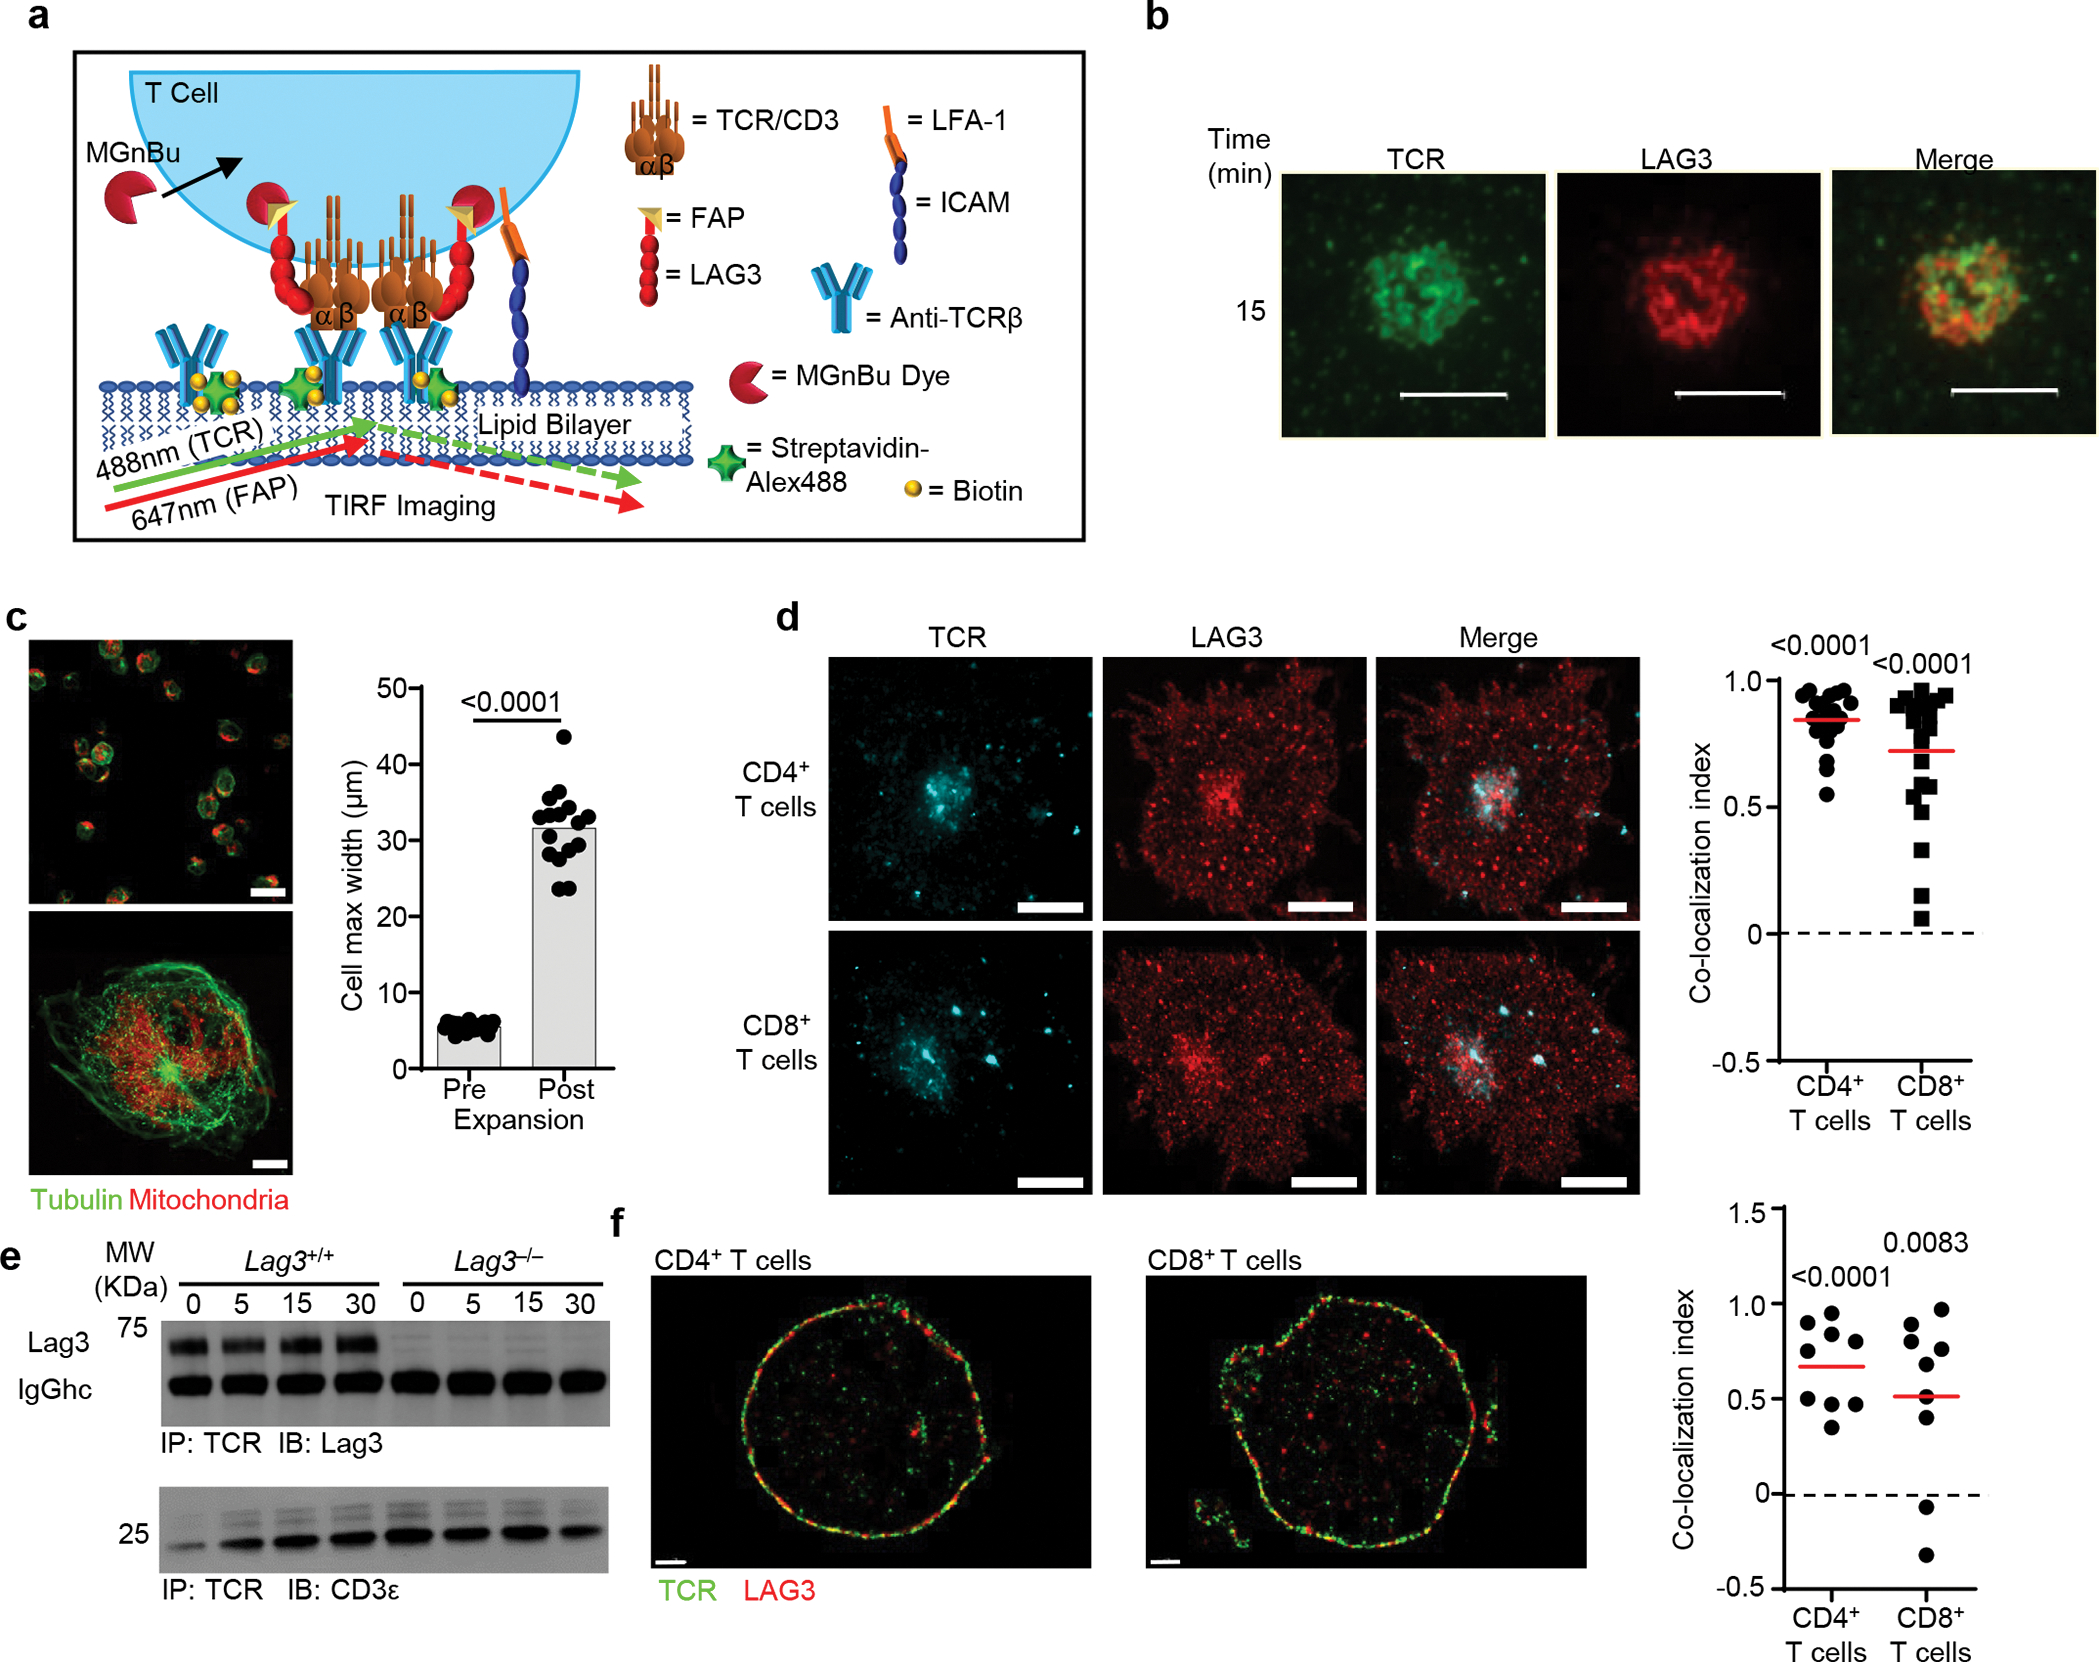
(a) Diagram depicting TIRF microscopy analysis of Lag3−/− CD4+ T cells containing FAP tagged LAG3 in the presences of MGnBu to visualize the FAP, stimulated on a planar lipid bilayer containing ICAM and biotinylated TCRβ Ab, with streptavidin Alexa 488 to allow for visualization of TCR clustering. (b) Real-time fluorescent TIRFM visualizing LAG3 (red) and TCR (green) of CD8+ T cells, isolated from spleen and lymph nodes of Lag3−/−mice, containing FAP tagged LAG3 stimulated on a planar lipid bilayer containing TCRβ Ab for 15 minutes (Scale bar = 5μm). (c) Activated T cells were immunolabeled for Tubulin (green) and mitochondria (Red) and imaged using 3-dimensional super resolution confocal either pre- (upper) or post-expansion microscopy (lower) and their maximum cell width determined as a measure of fold expansion. (d) Lag3+/+ and Lag3−/− CD4+ and CD8+ T cells, isolated as above, were immunolabeled to detect TCR and LAG3, and subjected to expansion microscopy with the degree of co-localization presented (Scale bar = 10μm). (e) Co-immunoprecipitation of the TCR-CD3 complex with LAG3 in resting Lag3+/+ and Lag3−/− transgenic CD4+ T cells and stimulated in the presence of peptide and MHC class II. (f) Molecular distribution of TCR and LAG3 in non-stimulated Lag3+/+ CD4+ and CD8+ T cells, isolated as above, as determined by STORM with quantification shown on the right (Scale bar = 1μm). Data in (b) and (d) is representative of 3 and 2 independent experiments respectively. Statistics (d, f) was determined by Wilcoxon matched pairs signed rank test or student’s unpaired two-sided t test (c) with P values noted in figures.
Extended Data Fig. 3.

(a) Dynamic association of LAG3, TCR and CD8 on Lag3+/+ CD8+ T cells stimulated with TCRβ Ab using sensitized emission FRETc with quantification shown (Scale bar = 5μm). (b) The average number of LAG3 and CD4 molecules that are within 25 nm × 25 nm × 50 nm area around the TCR in Lag3+/+ CD4+ T cells, isolated as above, following stimulation with TCRβ Ab as determined by the STORM-derived coordinates. Data are representative of at least 3–5 experiments. (c) Diagram depicting a fluid planar lipid bilayer system for analysis of protein-protein interactions. In the system, fluorescently tagged (TAMRA) CD4CT or CD8CT are anchored to the lipid bilayer via his-binding phospholipids resulting in fluid, randomly distributed TAMRA molecules visualized using confocal microscopy. Protein interactions are observed following addition of a peptide (LAG3CT) resulting in phase separation and redistribution of molecules into supramolecular clusters. (d, e) Molecular distribution of CD4 (d), CD8 (e) and Lck within the IS of Lag3+/+ and Lag3−/− CD4+ or CD8+ T cells, isolated as above, as determined by STORM with quantification of the Co-localization index (Scale bar = 0.5μm). STORM imaging data are representative of 15 data sets derived from 3 separate experiments. Statistics determined by unpaired Student’s two sided t test (a, b) and by Wilcoxon matched pairs signed rank test (d, f). P values are noted in figures.
Extended Data Fig. 4.
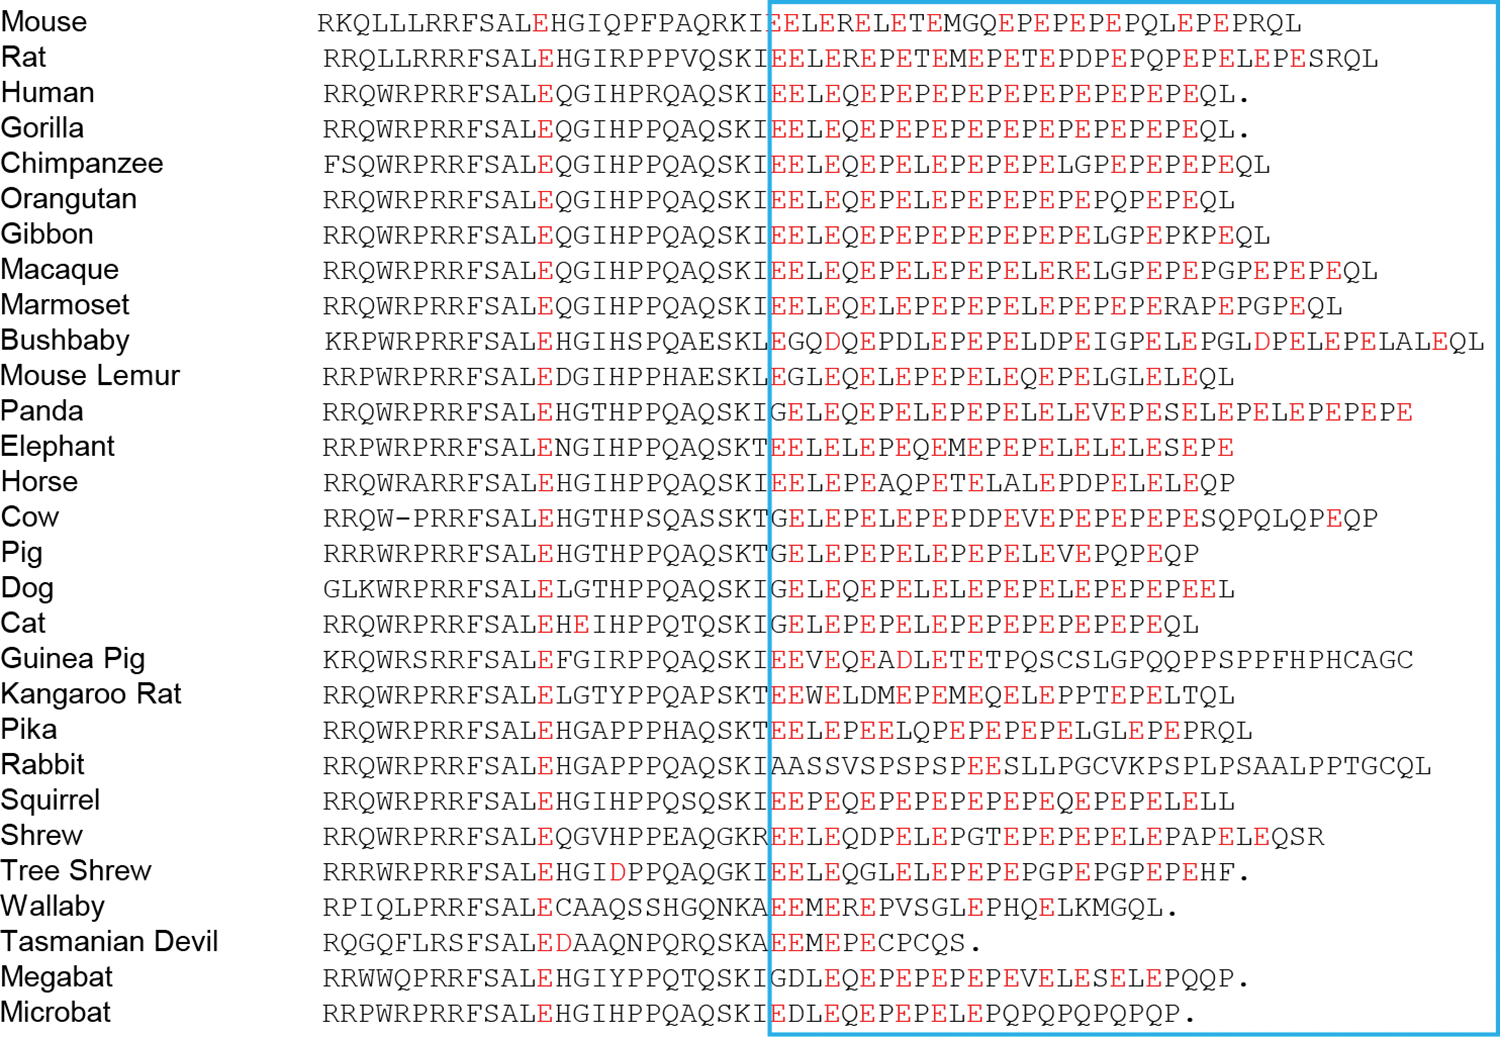
Sequence alignment of LAG3CT with acidic residues highlighted red.
Extended Data Fig. 5.
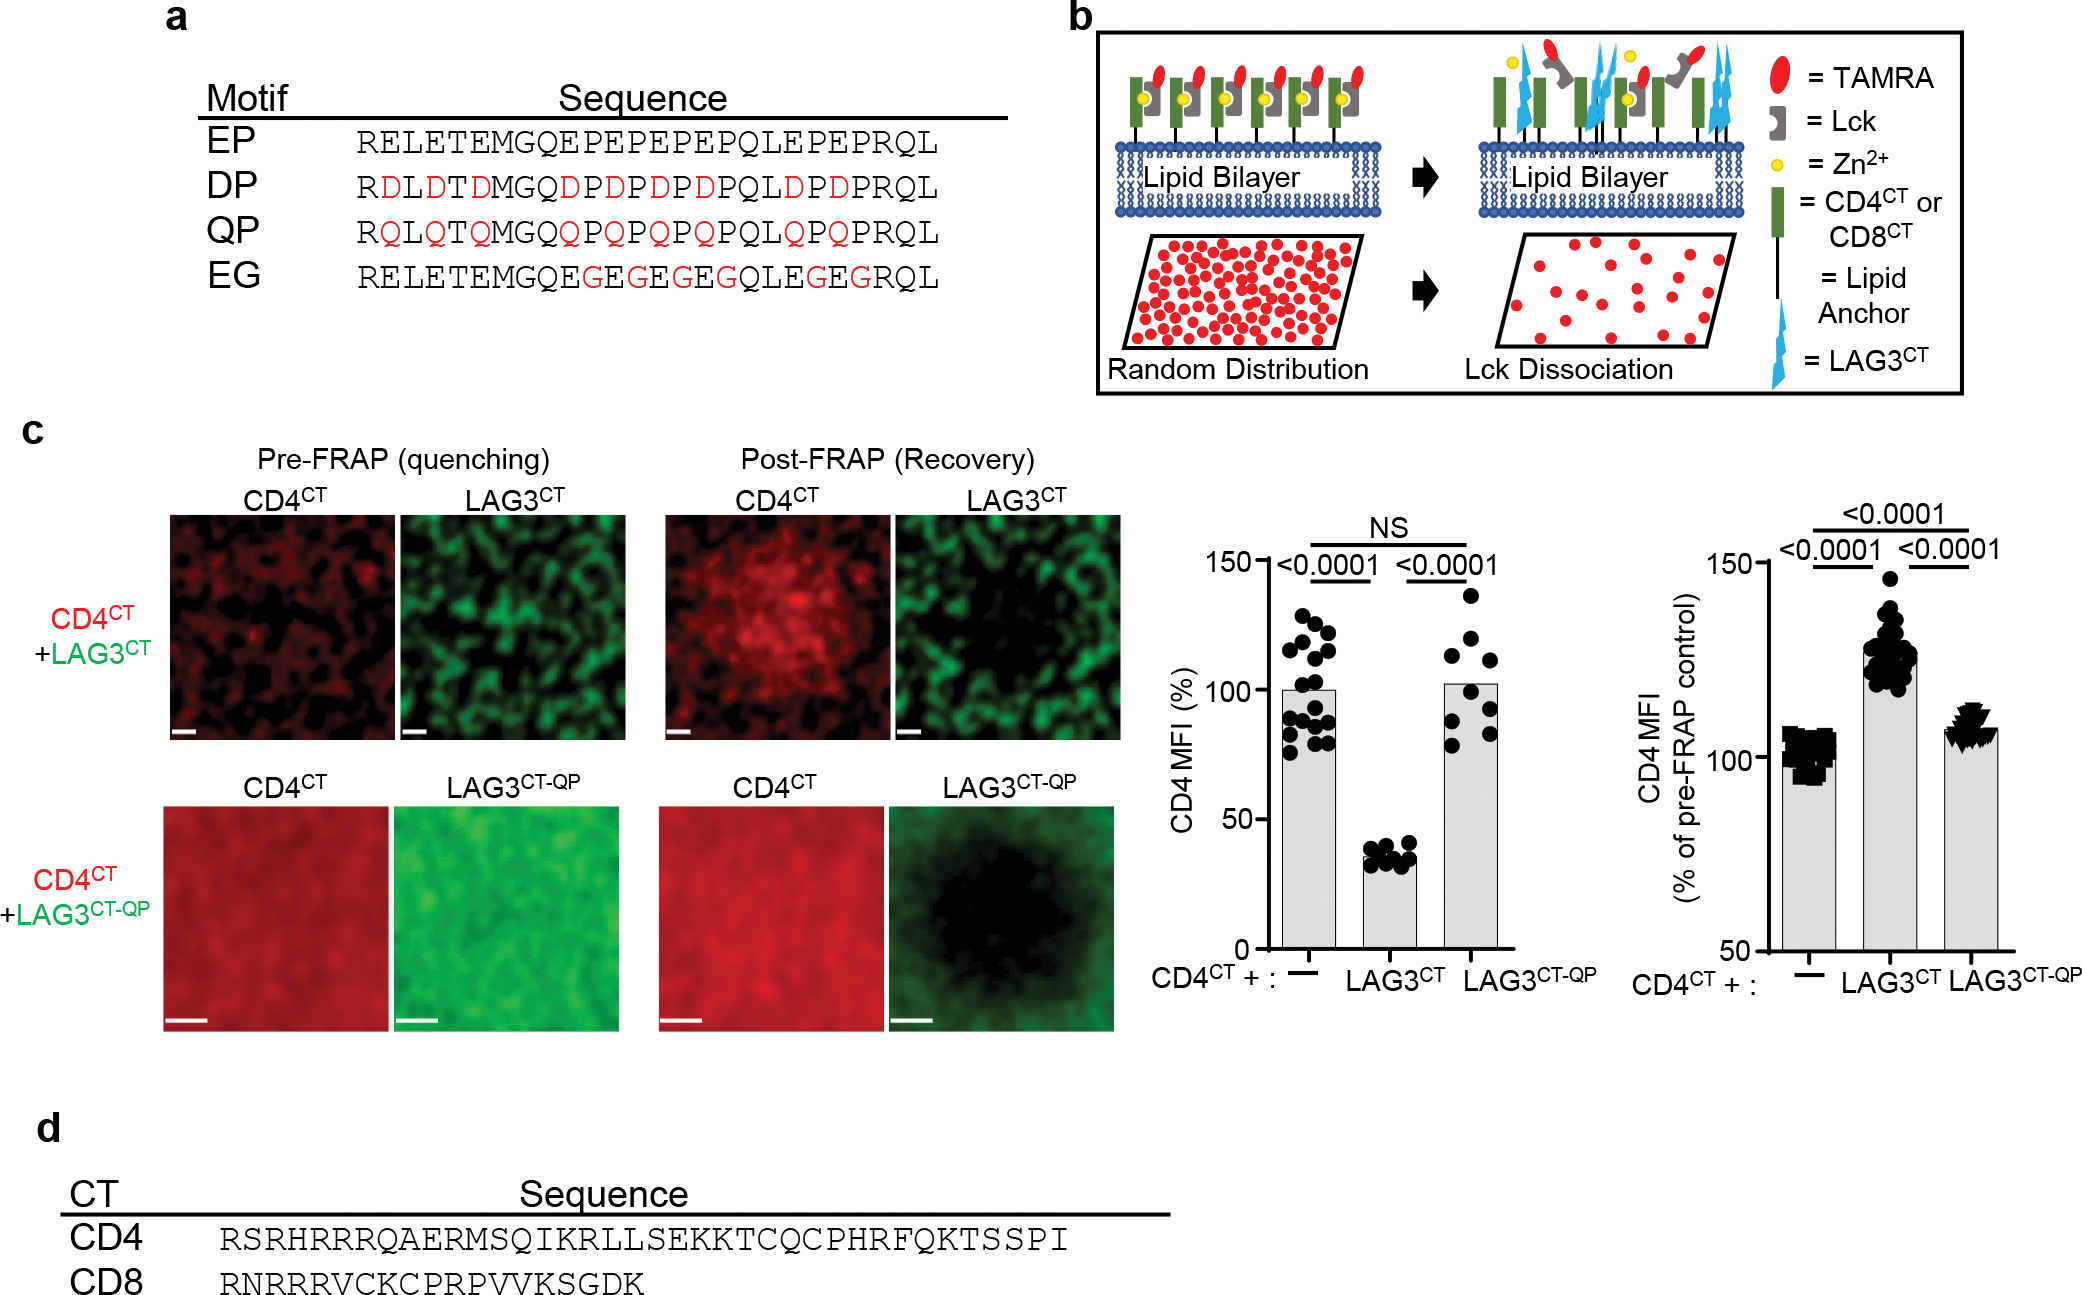
(a) LAG3CT ‘EP’ and mutant peptide sequences. (b) Diagram depicting a fluid planar lipid bilayer system for analysis of the association/disassociation of p56lck from CD4 or CD8. In the system, TAMRA labeled p56lck is associated with CD4CT or CD8CT anchored to the lipid bilayer via his-binding phospholipids resulting in fluid, randomly distributed TAMRA molecules visualized using confocal microscopy. Dissociation of p56lck is observed following addition of a peptide (LAG3CT) resulting in a reduction of TAMRA labeled p56lck and reduced MFI. (c) Determination of phase separation and intermolecular interactions using TAMRA-labeled membrane-tethered CD4CT with AF647-labeled LAG3CT or LAG3CT-QP mutant as photoquencher. Quantification of CD4 quenching or recovery post-photobleaching of acceptor is shown from 2 independent experiments (Scale bar = 1μm). (d) hCD4 and hCD8 CT sequence. Statistics determined by unpaired Student’s two sided t test. P values are noted in figures.
Extended Data Fig. 6.
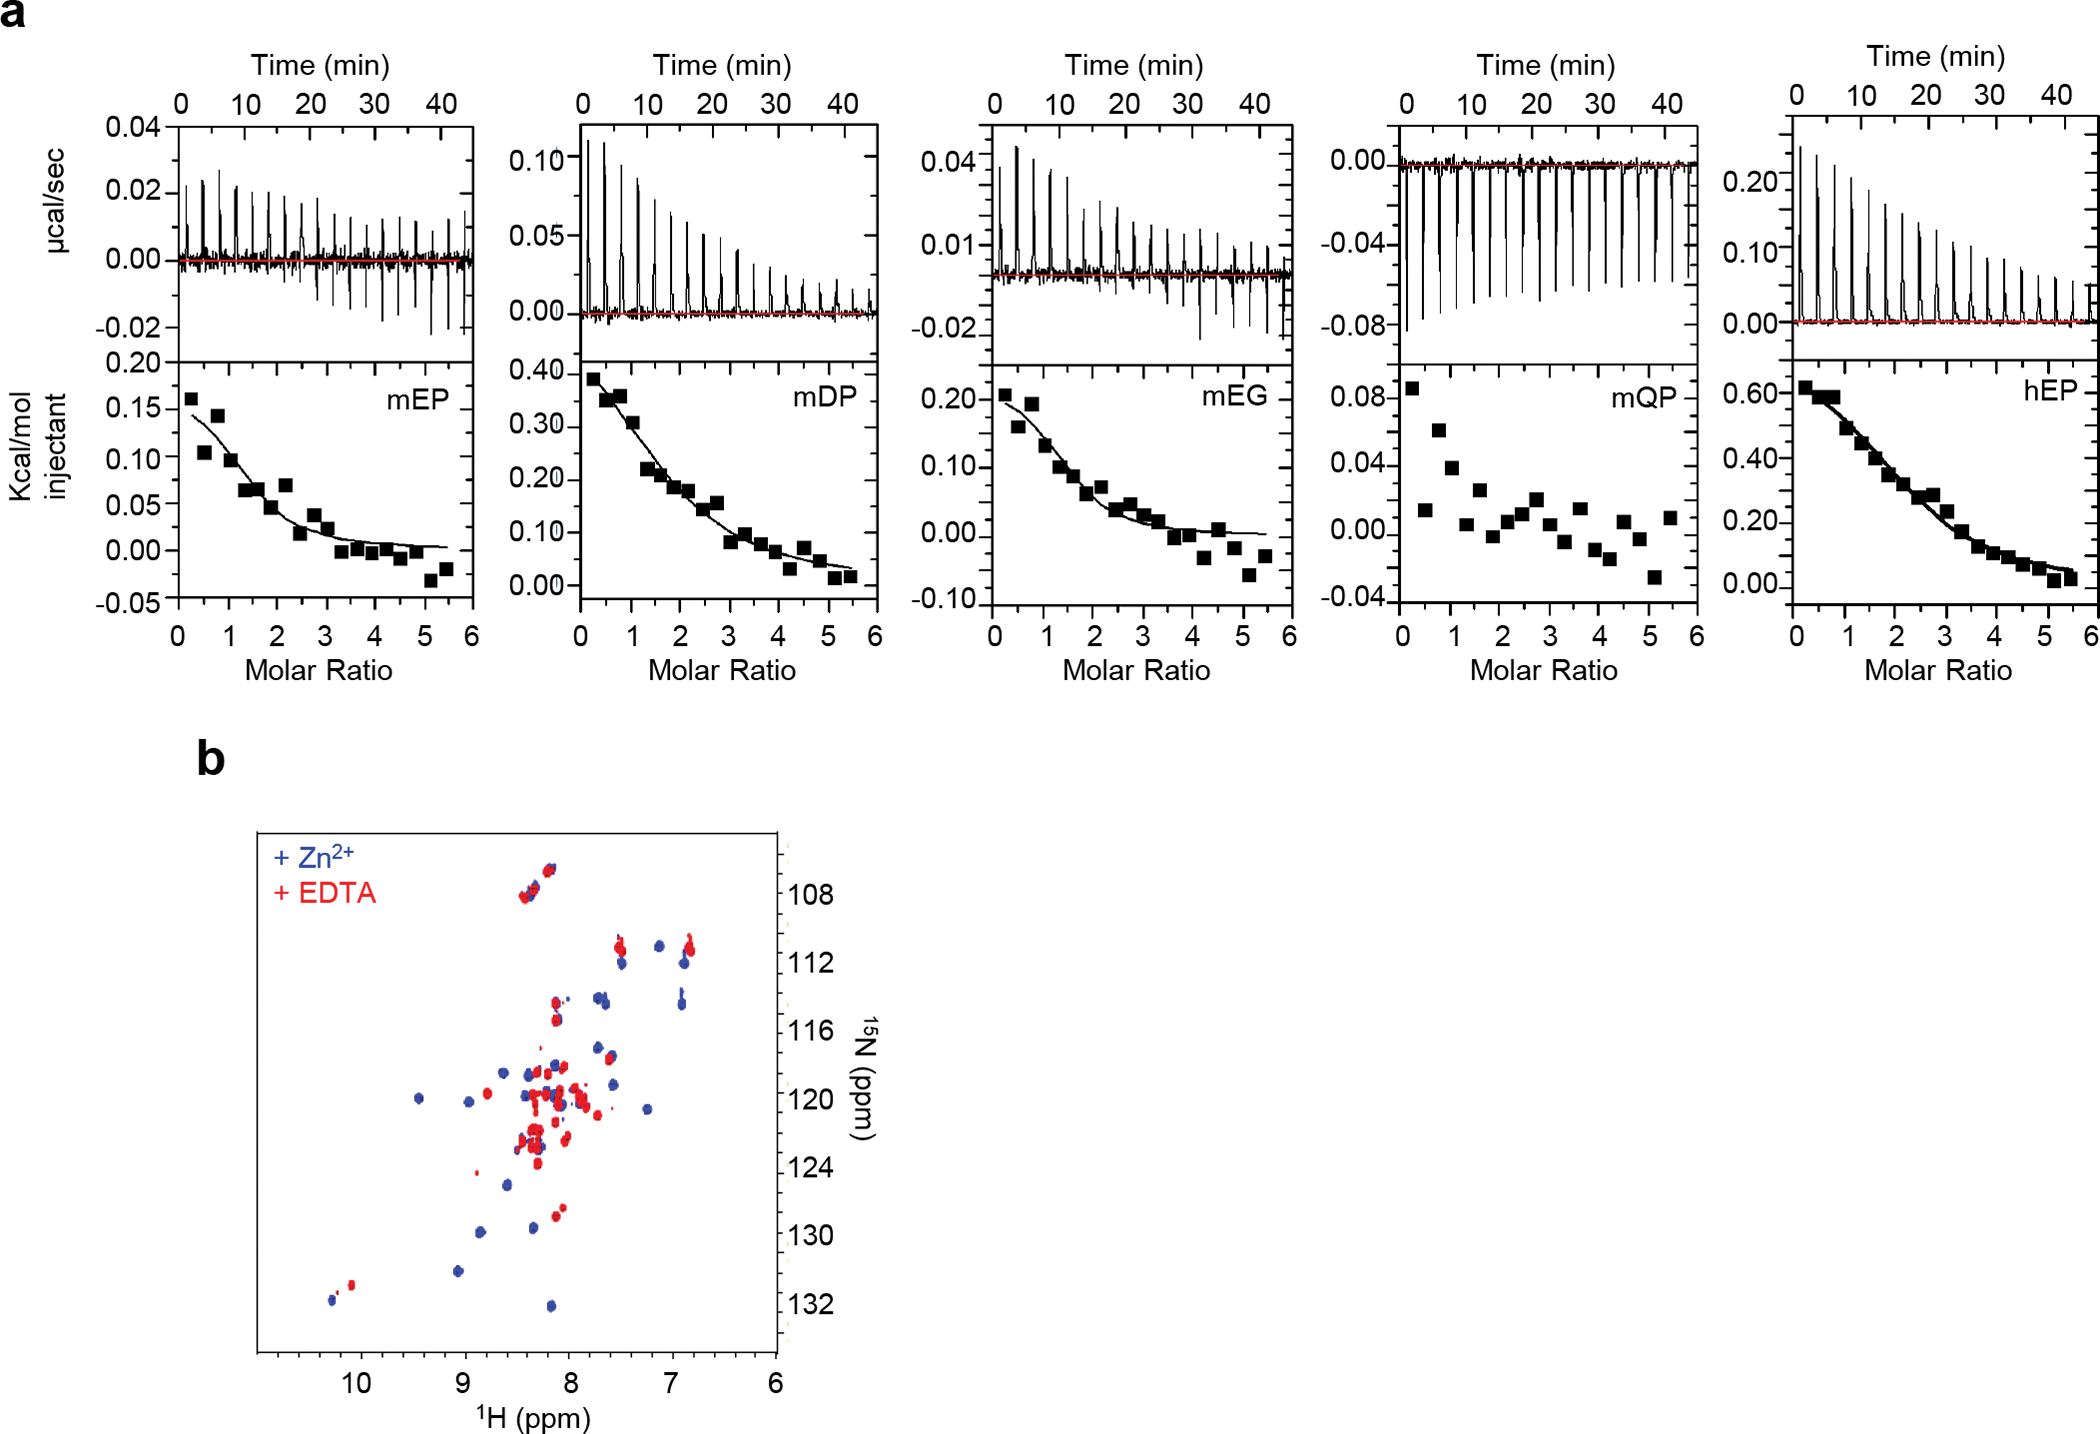
(a) The disordered cytoplasmic tail of hLAG3 binds Zn2+ weakly, in an entropically driven thermodynamic process. ITC curves at 15°C of Zn2+ titrated into 75 μM hLAG3 peptides, in 10 mM Tris pH 7.0 buffer show that acidic residues are required for metal binding. (b) Cytoplasmic tails of hLck and hCD4 fold upon binding in the presence of Zn2+ as described in Kim PW et al., Science (2003). 1H/15N HSQC spectra of a 50 μM 1:1 complex 15N-Lck : CD4, in the presence of 1.2 molar equivalents of Zn2+ (blue) and the same sample treated with 0.25 mM EDTA (red).
Extended Data Fig. 7.
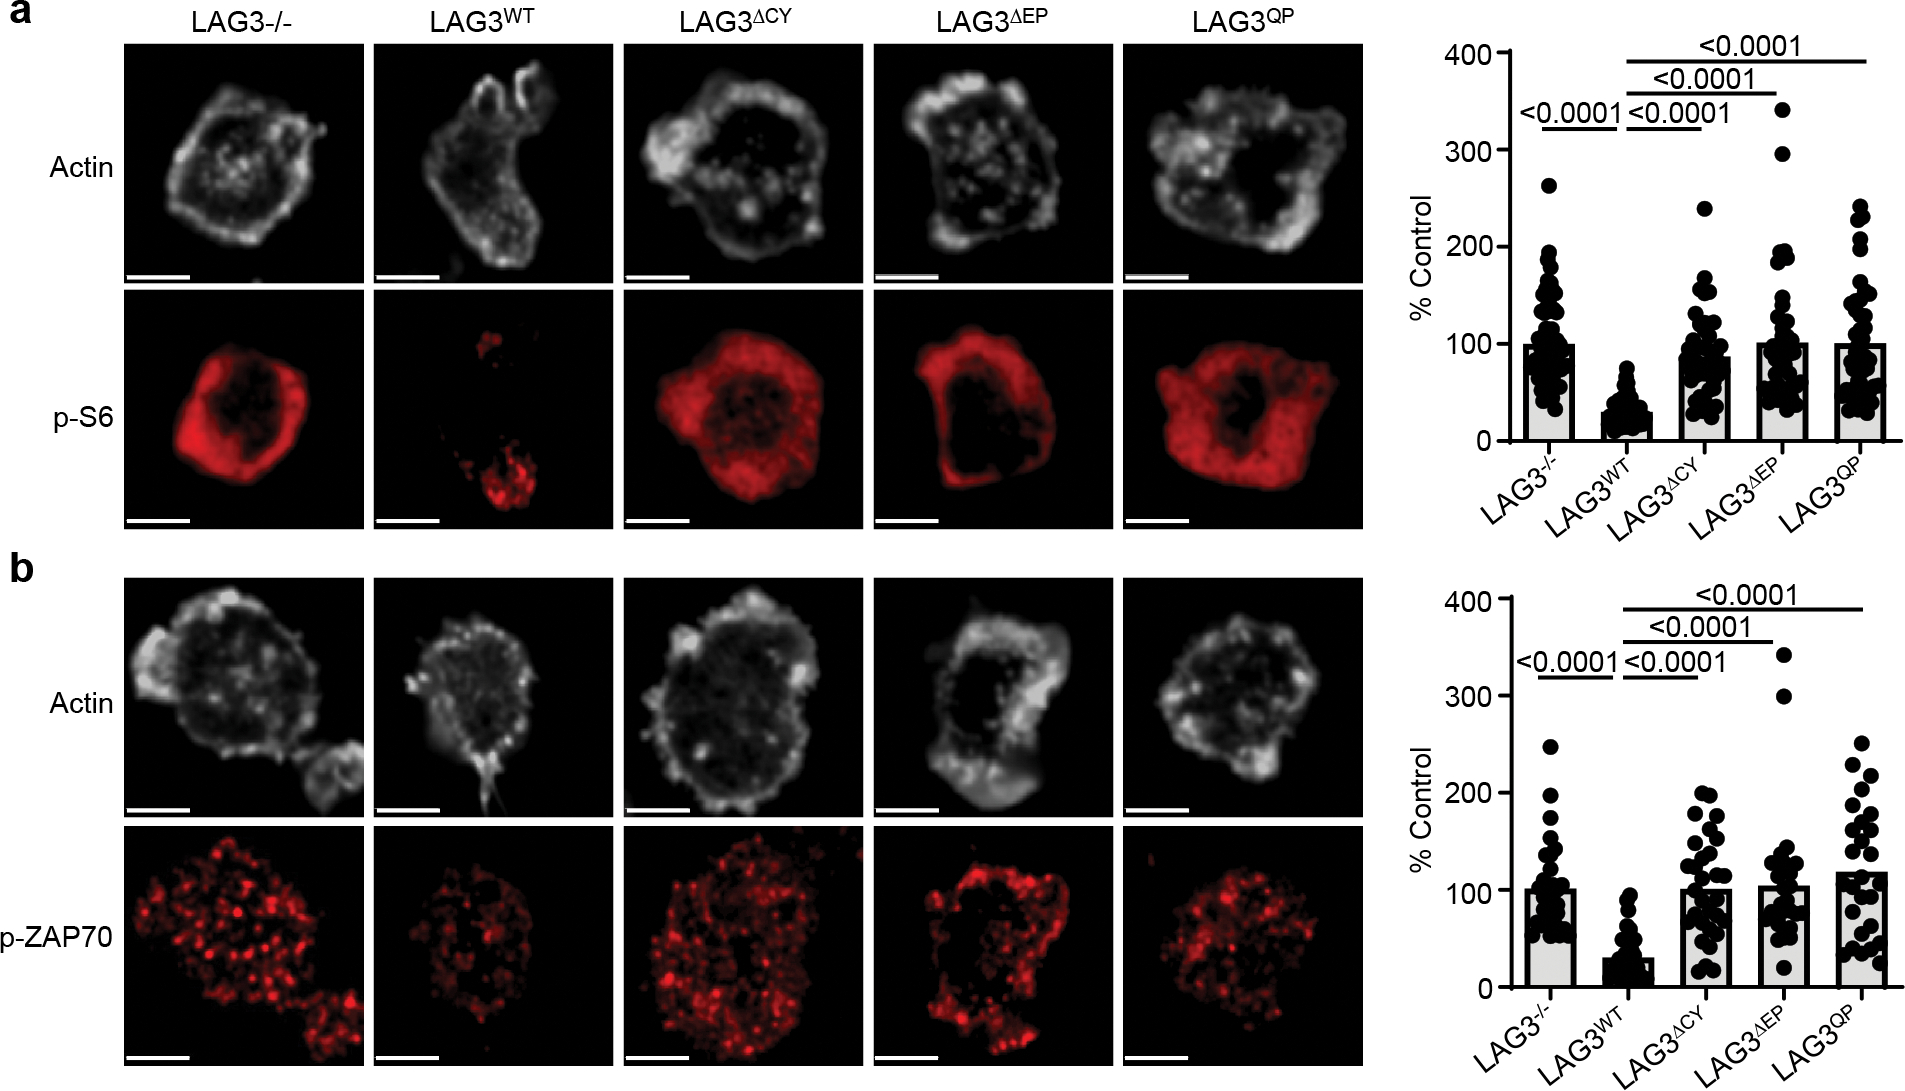
(a, b) Analysis of TCR-induced signaling events in Lag3−/−CD8+ T cells, isolated as above, transduced with LAG3WT or LAG3 functional domain mutants and stimulated with TCRβ Abs. Representative super resolution confocal images are depicted, with quantification of single cell intensity measurements collected from two independent experiments presented as percent of LAG3-deficient parental cells as control (Scale bar 2μm). Statistics determined by unpaired Student’s two sided t test. P values are noted in figures.
Extended Data Video 1.
TIRFM visualizing and TCR (green) of Lag3−/− CD4+ T cells containing FAP tagged LAG3 stimulated on a planar lipid bilayer with TCRβ Ab for 15 minutes (Scale bar = 5μm).
Extended Data Video 2.
TIRFM visualizing LAG3 (red) of Lag3−/− CD4+ T cells isolated as above, containing FAP tagged LAG3 stimulated on a planar lipid bilayer with TCRβ Ab for 15 minutes (Scale bar = 5μm).
Extended Data Video 3.
TIRFM visualizing both LAG3 (red) and TCR (green) of Lag3−/− CD4+ T cells isolated as above, containing FAP tagged LAG3 stimulated on a planar lipid bilayer with TCRβ Ab for 15 minutes (Scale bar = 5μm).
Supplementary Material
ACKNOWLEDGEMENTS
We wish to thank everyone in the Vignali Lab (Vignali-lab.com; @Vignali_Lab) for all their constructive comments and advice during this project. The authors would like to thank G. Lennon, R. Cross, and P. Ingle of the St. Jude Immunology Flow Lab for cell sorting and valuable assistance; A. Yates, D. Falkner, and H. Shen from the Immunology Flow Core at the University of Pittsburgh for cell sorting; A. McKenna and K. Forbes for maintenance, breeding, and genotyping of mouse colonies at St. Jude Children’s Research Hospital; E. Brunazzi for maintenance, breeding, and genotyping of mouse colonies at the University of Pittsburgh; and the staffs of the Shared Animal Resource Center and the Division of Laboratory Animal Services for the animal husbandry; Aaron Philips for assistance with NMR data analysis. Images were, in part, acquired at the Cell and Tissue Imaging Center, and peptide synthesis was performed by the Hartwell Center for Macromolecular Synthesis, which are supported by SJCRH and NCI P30 CA021765. This work was supported by the National Institutes of Health (P01 AI108545, R01 AI129893 to D.A.A.V.; R01 AI144422 to D.A.A.V & C.J.W.), NCI Comprehensive Cancer Center Support CORE grant (CA21765, to D.A.A.V. & R.K.), and ALSAC (to D.A.A.V. & R.K.)..
Footnotes
CONFLICTS OF INTEREST
The authors declare competing financial interests. D.M.M. is an employee and stock holder of Dewpoint Therapeutics. D.A.A.V. and C.J.W. have patents covering LAG3, with others pending, and are entitled to a share in net income generated from licensing of these patent rights for commercial development. DAAV: cofounder and stock holder – Novasenta, Potenza, Tizona, Trishula; stock holder – Oncorus, Werewolf, Apeximmune; patents licensed and royalties - Astellas, BMS, Novasenta; scientific advisory board member - Tizona, Werewolf, F-Star, Bicara, Apeximmune, T7/Imreg Bio; consultant - Astellas, BMS, Almirall, Incyte, G1 Therapeutics; research funding – BMS, Astellas and Novasenta. The remaining authors declare no competing interests.
REFERENCES
- 1.Andrews LP, Marciscano AE, Drake CG & Vignali DA LAG3 (CD223) as a cancer immunotherapy target. Immunol Rev 276, 80–96, doi: 10.1111/imr.12519 (2017). [DOI] [PMC free article] [PubMed] [Google Scholar]
- 2.Maruhashi T, Sugiura D, Okazaki IM & Okazaki T LAG-3: from molecular functions to clinical applications. J Immunother Cancer 8, doi: 10.1136/jitc-2020-001014 (2020). [DOI] [PMC free article] [PubMed] [Google Scholar]
- 3.Ruffo E, Wu RC, Bruno TC, Workman CJ & Vignali DAA Lymphocyte-activation gene 3 (LAG3): The next immune checkpoint receptor. Semin Immunol 42, 101305, doi: 10.1016/j.smim.2019.101305 (2019). [DOI] [PMC free article] [PubMed] [Google Scholar]
- 4.Huard B et al. Characterization of the major histocompatibility complex class II binding site on LAG-3 protein. Proc Natl Acad Sci U S A 94, 5744–5749 (1997). [DOI] [PMC free article] [PubMed] [Google Scholar]
- 5.Woo SR et al. Immune inhibitory molecules LAG-3 and PD-1 synergistically regulate T-cell function to promote tumoral immune escape. Cancer Res 72, 917–927, doi: 10.1158/0008-5472.CAN-11-1620 (2012). [DOI] [PMC free article] [PubMed] [Google Scholar]
- 6.Blackburn SD et al. Coregulation of CD8+ T cell exhaustion by multiple inhibitory receptors during chronic viral infection. Nat Immunol 10, 29–37, doi: 10.1038/ni.1679 (2009). [DOI] [PMC free article] [PubMed] [Google Scholar]
- 7.Wherry EJ T cell exhaustion. Nat Immunol 12, 492–499 (2011). [DOI] [PubMed] [Google Scholar]
- 8.Workman CJ, Dugger KJ & Vignali DA Cutting edge: molecular analysis of the negative regulatory function of lymphocyte activation gene-3. J Immunol 169, 5392–5395 (2002). [DOI] [PubMed] [Google Scholar]
- 9.Maeda TK, Sugiura D, Okazaki IM, Maruhashi T & Okazaki T Atypical motifs in the cytoplasmic region of the inhibitory immune co-receptor LAG-3 inhibit T cell activation. J Biol Chem 294, 6017–6026, doi: 10.1074/jbc.RA119.007455 (2019). [DOI] [PMC free article] [PubMed] [Google Scholar]
- 10.Baixeras E et al. Characterization of the lymphocyte activation gene 3-encoded protein. A new ligand for human leukocyte antigen class II antigens. J Exp Med 176, 327–337 (1992). [DOI] [PMC free article] [PubMed] [Google Scholar]
- 11.Grebinoski S & Vignali DA Inhibitory receptor agonists: the future of autoimmune disease therapeutics? Curr Opin Immunol 67, 1–9, doi: 10.1016/j.coi.2020.06.001 (2020). [DOI] [PMC free article] [PubMed] [Google Scholar]
- 12.Workman CJ & Vignali DA Negative regulation of T cell homeostasis by lymphocyte activation gene-3 (CD223). J Immunol 174, 688–695 (2005). [DOI] [PubMed] [Google Scholar]
- 13.Workman CJ & Vignali DA The CD4-related molecule, LAG-3 (CD223), regulates the expansion of activated T cells. Eur J Immunol 33, 970–979, doi: 10.1002/eji.200323382 (2003). [DOI] [PubMed] [Google Scholar]
- 14.Szent-Gyorgyi C et al. Fluorogen-activating single-chain antibodies for imaging cell surface proteins. Nat Biotechnol 26, 235–240, doi: 10.1038/nbt1368 (2008). [DOI] [PubMed] [Google Scholar]
- 15.Perkins LA et al. High-Content Surface and Total Expression siRNA Kinase Library Screen with VX-809 Treatment Reveals Kinase Targets that Enhance F508del-CFTR Rescue. Mol Pharm 15, 759–767, doi: 10.1021/acs.molpharmaceut.7b00928 (2018). [DOI] [PMC free article] [PubMed] [Google Scholar]
- 16.Samir P et al. DDX3X acts as a live-or-die checkpoint in stressed cells by regulating NLRP3 inflammasome. Nature 573, 590–594, doi: 10.1038/s41586-019-1551-2 (2019). [DOI] [PMC free article] [PubMed] [Google Scholar]
- 17.Fu G et al. Metabolic control of TFH cells and humoral immunity by phosphatidylethanolamine. Nature 595, 724–729, doi: 10.1038/s41586-021-03692-z (2021). [DOI] [PMC free article] [PubMed] [Google Scholar]
- 18.Chen F, Tillberg PW & Boyden ES Optical imaging. Expansion microscopy. Science 347, 543–548, doi: 10.1126/science.1260088 (2015). [DOI] [PMC free article] [PubMed] [Google Scholar]
- 19.Wassie AT, Zhao Y & Boyden ES Expansion microscopy: principles and uses in biological research. Nat Methods 16, 33–41, doi: 10.1038/s41592-018-0219-4 (2019). [DOI] [PMC free article] [PubMed] [Google Scholar]
- 20.Huang WYC, Ditlev JA, Chiang HK, Rosen MK & Groves JT Allosteric Modulation of Grb2 Recruitment to the Intrinsically Disordered Scaffold Protein, LAT, by Remote Site Phosphorylation. J Am Chem Soc 139, 18009–18015, doi: 10.1021/jacs.7b09387 (2017). [DOI] [PMC free article] [PubMed] [Google Scholar]
- 21.Lee KH et al. C9orf72 Dipeptide Repeats Impair the Assembly, Dynamics, and Function of Membrane-Less Organelles. Cell 167, 774–788 e717, doi: 10.1016/j.cell.2016.10.002 (2016). [DOI] [PMC free article] [PubMed] [Google Scholar]
- 22.Mitrea DM & Kriwacki RW Phase separation in biology; functional organization of a higher order. Cell Commun Signal 14, 1, doi: 10.1186/s12964-015-0125-7 (2016). [DOI] [PMC free article] [PubMed] [Google Scholar]
- 23.Bettini M et al. Cutting edge: accelerated autoimmune diabetes in the absence of LAG-3. J Immunol 187, 3493–3498, doi: 10.4049/jimmunol.1100714 (2011). [DOI] [PMC free article] [PubMed] [Google Scholar]
- 24.Huang CT et al. Role of LAG-3 in regulatory T cells. Immunity 21, 503–513, doi: 10.1016/j.immuni.2004.08.010 (2004). [DOI] [PubMed] [Google Scholar]
- 25.Woo SR et al. Differential subcellular localization of the regulatory T-cell protein LAG-3 and the coreceptor CD4. Eur J Immunol 40, 1768–1777, doi: 10.1002/eji.200939874 (2010). [DOI] [PMC free article] [PubMed] [Google Scholar]
- 26.Workman CJ et al. Lymphocyte activation gene-3 (CD223) regulates the size of the expanding T cell population following antigen activation in vivo. J Immunol 172, 5450–5455 (2004). [DOI] [PubMed] [Google Scholar]
- 27.Grosso JF et al. Functionally distinct LAG-3 and PD-1 subsets on activated and chronically stimulated CD8 T cells. J Immunol 182, 6659–6669, doi: 10.4049/jimmunol.0804211 (2009). [DOI] [PMC free article] [PubMed] [Google Scholar]
- 28.Grosso JF et al. LAG-3 regulates CD8+ T cell accumulation and effector function in murine self- and tumor-tolerance systems. J Clin Invest 117, 3383–3392, doi: 10.1172/JCI31184 (2007). [DOI] [PMC free article] [PubMed] [Google Scholar]
- 29.Kim PW, Sun ZY, Blacklow SC, Wagner G & Eck MJ A zinc clasp structure tethers Lck to T cell coreceptors CD4 and CD8. Science 301, 1725–1728, doi: 10.1126/science.1085643 (2003). [DOI] [PubMed] [Google Scholar]
- 30.Veillette A, Bookman MA, Horak EM & Bolen JB The CD4 and CD8 T cell surface antigens are associated with the internal membrane tyrosine-protein kinase Lck. Cell 55, 301–308 (1988). [DOI] [PubMed] [Google Scholar]
- 31.Rudd CE, Trevillyan JM, Dasgupta JD, Wong LL & Schlossman SF The CD4 receptor is complexed in detergent lysates to a protein-tyrosine kinase (pp58) from human T lymphocytes. Proc Natl Acad Sci U S A 85, 5190–5194 (1988). [DOI] [PMC free article] [PubMed] [Google Scholar]
- 32.Horkova V et al. Dynamics of the Coreceptor-LCK Interactions during T Cell Development Shape the Self-Reactivity of Peripheral CD4 and CD8 T Cells. Cell Rep 30, 1504–1514 e1507, doi: 10.1016/j.celrep.2020.01.008 (2020). [DOI] [PMC free article] [PubMed] [Google Scholar]
- 33.Alberts IL, Nadassy K & Wodak SJ Analysis of zinc binding sites in protein crystal structures. Protein Sci 7, 1700–1716, doi: 10.1002/pro.5560070805 (1998). [DOI] [PMC free article] [PubMed] [Google Scholar]
- 34.Rigo A et al. Interaction of copper with cysteine: stability of cuprous complexes and catalytic role of cupric ions in anaerobic thiol oxidation. J Inorg Biochem 98, 1495–1501, doi: 10.1016/j.jinorgbio.2004.06.008 (2004). [DOI] [PubMed] [Google Scholar]
- 35.Storch S, Pohl S & Braulke T A dileucine motif and a cluster of acidic amino acids in the second cytoplasmic domain of the batten disease-related CLN3 protein are required for efficient lysosomal targeting. J Biol Chem 279, 53625–53634, doi: 10.1074/jbc.M410930200 (2004). [DOI] [PubMed] [Google Scholar]
- 36.Johnson AO, Lampson MA & McGraw TE A di-leucine sequence and a cluster of acidic amino acids are required for dynamic retention in the endosomal recycling compartment of fibroblasts. Mol Biol Cell 12, 367–381 (2001). [DOI] [PMC free article] [PubMed] [Google Scholar]
- 37.Uversky VN The alphabet of intrinsic disorder: II. Various roles of glutamic acid in ordered and intrinsically disordered proteins. Intrinsically Disord Proteins 1, e24684, doi: 10.4161/idp.24684 (2013). [DOI] [PMC free article] [PubMed] [Google Scholar]
- 38.Miyazaki T, Dierich A, Benoist C & Mathis D Independent modes of natural killing distinguished in mice lacking Lag3. Science 272, 405–408 (1996). [DOI] [PubMed] [Google Scholar]
- 39.Kaye J et al. Selective development of CD4+ T cells in transgenic mice expressing a class II MHC-restricted antigen receptor. Nature 341, 746–749, doi: 10.1038/341746a0 (1989). [DOI] [PubMed] [Google Scholar]
- 40.Singh SK et al. Mapping the interaction between the cytoplasmic domains of HIV-1 viral protein U and human CD4 with NMR spectroscopy. FEBS J 279, 3705–3714, doi: 10.1111/j.1742-4658.2012.08732.x (2012). [DOI] [PubMed] [Google Scholar]
- 41.Huppa JB et al. TCR-peptide-MHC interactions in situ show accelerated kinetics and increased affinity. Nature 463, 963–967, doi: 10.1038/nature08746 (2010). [DOI] [PMC free article] [PubMed] [Google Scholar]
- 42.Kaizuka Y, Douglass AD, Varma R, Dustin ML & Vale RD Mechanisms for segregating T cell receptor and adhesion molecules during immunological synapse formation in Jurkat T cells. Proc Natl Acad Sci U S A 104, 20296–20301, doi: 10.1073/pnas.0710258105 (2007). [DOI] [PMC free article] [PubMed] [Google Scholar]
- 43.Liedmann S et al. Viral suppressors of the RIG-I-mediated interferon response are pre-packaged in influenza virions. Nat Commun 5, 5645, doi: 10.1038/ncomms6645 (2014). [DOI] [PMC free article] [PubMed] [Google Scholar]
- 44.Bates M, Huang B, Dempsey GT & Zhuang X Multicolor super-resolution imaging with photo-switchable fluorescent probes. Science 317, 1749–1753, doi: 10.1126/science.1146598 (2007). [DOI] [PMC free article] [PubMed] [Google Scholar]
- 45.Keller R The Computer Aided Resonance Assignment. 1st edn, (CANTINA, 2004). [Google Scholar]
- 46.Santoro MM & Bolen DW Unfolding free energy changes determined by the linear extrapolation method. 1. Unfolding of phenylmethanesulfonyl alpha-chymotrypsin using different denaturants. Biochemistry 27, 8063–8068 (1988). [DOI] [PubMed] [Google Scholar]
Associated Data
This section collects any data citations, data availability statements, or supplementary materials included in this article.
Supplementary Materials
Data Availability Statement
All data generated or analyzed during this study are included in this published article and its supplementary information files.


