

Abstract
Endo‐lysosomal compartments exchange proteins by fusing, fissioning, and through endosomal transport carriers. Thereby, they sort many plasma membrane receptors and transporters and control cellular signaling and metabolism. How the membrane fission events are catalyzed is poorly understood. Here, we identify the novel CROP complex as a factor acting at this step. CROP joins members of two protein families: the peripheral subunits of retromer, a coat forming endosomal transport carriers, and membrane inserting PROPPINs. Integration into CROP potentiates the membrane fission activity of the PROPPIN Atg18 on synthetic liposomes and confers strong preference for binding PI(3,5)P2, a phosphoinositide required for membrane fission activity. Disrupting CROP blocks fragmentation of lysosome‐like yeast vacuoles in vivo. CROP‐deficient mammalian endosomes accumulate micrometer‐long tubules and fail to export cargo, suggesting that carriers attempt to form but cannot separate from these organelles. PROPPINs compete for retromer binding with the SNX‐BAR proteins, which recruit retromer to the membrane during the formation of endosomal carriers. Transition from retromer–SNX‐BAR complexes to retromer–PROPPIN complexes might hence switch retromer activities from cargo capture to membrane fission.
Keywords: autophagy, endosomes, lysosomes, retromer, yeast
Subject Categories: Membranes & Trafficking
The Cargo Selective sub‐Complex of Retromer associates with the PROPPIN protein Atg18 to form a novel conserved complex involved in membrane fission and cargo export from vacuoles and endosomes.

Introduction
Endo‐lysosomal compartments play a major role in controlling the abundance of most plasma membrane transporters and receptors and therefore have a key role in defining the communication, interaction, and transport capacities of a cell. They receive proteins from the cell surface or from the Golgi and sort them either for recycling back to these compartments, or for transfer to lysosomes, where many of them become degraded (Cullen & Steinberg, 2018; Ma & Burd, 2019; Seaman, 2019). Endo‐lysosomal compartments exchange proteins and lipids through homo‐ and heterotypic fusion and fission events and through tubular–vesicular carriers. These structures can be formed by a variety of membrane coats, which can recruit cargo into them, such as retromer, retriever, CCC, or ESCPE.
Retromer is a conserved coat that consists of a peripheral part and of a lipid‐interacting part. In yeast, retromer has been discovered as a stable entity that could be dissociated into two subcomplexes, one consisting of the sorting nexins Vps5 and Vps17 (referred to as SNX), and of a complex of Vps26, Vps29, and Vps35 (referred to as CSC) (Seaman et al, 1998). SNX binds membranes via PX domains, which recognize phosphatidylinositol‐3‐phosphate (PI3P) (Burda et al, 2002), and via BAR domains, which preferentially associate with highly curved bilayers. The Vps26/29/35 complex by itself shows only weak affinity for the membrane and requires SNX for recruitment. Retromer associates with cargo and numerous other factors, which are important for the formation of the transport carriers and/or their fission from the membrane. These include components of the Rab‐GTPase system (Rojas et al, 2008; Seaman et al, 2009; Balderhaar et al, 2010; Liu et al, 2012; Jia et al, 2016; Purushothaman & Ungermann, 2018), the actin‐regulating WASH complex (Derivery et al, 2009; Gomez & Billadeau, 2009; Harbour et al, 2012; Liu et al, 2012; Chen et al, 2019), or EHD1, and ATPase with structural similarities to dynamins (Daumke et al, 2007; Gokool et al, 2007).
Structural analyses of retromer shed light onto its mode of action (Collins et al, 2005, 2008; Hierro et al, 2007; Lucas et al, 2016; Purushothaman et al, 2017; Kovtun et al, 2018; Kendall et al, 2020; Leneva et al, 2021). These studies begin to elucidate cargo recognition, the organization of the subunits on the membrane and the way in which their association promotes membrane tubulation. The subsequent step of detaching the carrier from the donor membrane is promoted by numerous protein factors, but their mechanism of action in the context of retromer is still poorly understood: The actin‐regulating WASH complex could enhance fission by increasing membrane tension and friction (Bar‐Ziv et al, 1999; Markin et al, 1999; Derivery et al, 2009; Gomez & Billadeau, 2009; Phillips‐Krawczak et al, 2015; Simunovic et al, 2017). Mechanochemical factors, such as the dynamin‐like GTPase Vps1 or ATPases of the EHD family, might constrict the membranes (Chi et al, 2014; Deo et al, 2018). Fission appears to be favored also by contact of the endosomal transport carriers to ER membranes (Rowland et al, 2014). Recently, we described fission activity of the PROPPIN Atg18 on synthetic liposomes (Gopaldass et al, 2017) and showed that its human homolog WIPI1 is required for protein exit from endosomes (DeLeo et al, 2021).
PROPPINs form a protein family that is present with multiple isoforms in eukaryotic cells from yeast to men (Dove et al, 2004). Baker's yeast expresses three isoforms, Atg18, Atg21, and Hsv2, and mammalian cells express four genes (WIPI1 through 4). PROPPINs bind phosphoinositides phosphorylated on the 3‐ and/or 5‐position and support the assembly of the autophagic machinery on phagophores (Proikas‐Cezanne et al, 2004; Baskaran et al, 2012; Krick et al, 2012; Watanabe et al, 2012; Vicinanza et al, 2015; Liang et al, 2019). In autophagy, WIPI proteins interact with and recruit key factors of this machinery, such as Atg16L1, Atg5, Atg12, and Atg2. They also participate in autophagic signaling and promote the interaction of the isolation membrane with the ER (Stromhaug et al, 2004; Obara et al, 2008; Itakura & Mizushima, 2010; Polson et al, 2010; Lu et al, 2011; Dooley et al, 2014; Proikas‐Cezanne et al, 2015; Bakula et al, 2017; Chowdhury et al, 2018; Otomo et al, 2018; Stanga et al, 2019; Lei et al, 2020). The autophagic functions of PROPPINs depend on phosphatidylinositol‐3‐phosphate (PI3P) or phosphatidylinositol‐5‐phosphate (PI5P) (Proikas‐Cezanne et al, 2004; Baskaran et al, 2012; Krick et al, 2012; Watanabe et al, 2012; Vicinanza et al, 2015; Liang et al, 2019).
PROPPINs are, however, not restricted to the sites of autophagosome formation. They show strong enrichment on endo‐lysosomal organelles, where they reduce the size of endosomes and influence the distribution of protein between the endosomes and the Golgi or vacuoles (Dove et al, 2004; Jeffries et al, 2004). The yeast PROPPIN Atg18 promotes the division of the vacuole into smaller fragments (Dove et al, 2004; Efe et al, 2007; Zieger & Mayer, 2012; Michaillat & Mayer, 2013; Gopaldass et al, 2017). This reaction promotes the inheritance of vacuoles to daughter cells (Wiemken et al, 1970) and the adjustment of their surface/volume ratio when their content changes, e.g., through storage of polyphosphate or the induction of autophagy (Bonangelino et al, 2002; Baars et al, 2007; Desfougères et al, 2016a, 2016b). The human PROPPIN WIPI1 is required in multiple protein exit pathways from endosomes, which transfer proteins to the plasma membrane, to the Golgi, or to lysosomes. Here, it promotes the PI3P‐dependent formation of endosomal transport carriers and their phosphatidylinositol‐3,5‐bisphosphate (PI(3,5)P2)‐dependent fission from endosomes (DeLeo et al, 2021). The endosomal and autophagic functions of Atg18 and WIPI1 can be differentiated through several molecular features and interactors, which are relevant only for one of the two processes (Gopaldass et al, 2017; DeLeo et al, 2021).
When incubated with synthetic giant unilamellar vesicles (GUVs) at micromolar concentrations, pure recombinant Atg18 suffices to tubulate these membranes and divide them into small vesicles, underlining its potential as a membrane fission protein (Gopaldass et al, 2017). These in vitro assays revealed that fission depends on a hydrophobic loop of Atg18, which can fold into an amphipathic helix when brought in contact with the membrane. The amphipathic helix is conserved in other PROPPINs and it is essential for membrane fission on mammalian endosomes as well as on yeast vacuoles in vivo (Gopaldass et al, 2017; DeLeo et al, 2021). It was proposed that loop insertion promotes fission by increasing membrane curvature. This effect may be amplified by oligomerization of Atg18, which could not be induced through PI3P, but only through PI(3,5)P2 (Gopaldass et al, 2017; Scacioc et al, 2017). PROPPINs are thus likely to be the effector proteins of PI(3,5)P2, the lipid that is necessary to drive fission on a variety of endo‐lysosomal compartments (McCartney et al, 2014). Although there appears to be specificity for PI(3,5)P2 in these functional terms, purified PROPPINs bind PI3P, PI5P and PI(3,5)P2 fairly promiscuously (Proikas‐Cezanne et al, 2004; Baskaran et al, 2012; Krick et al, 2012; Watanabe et al, 2012; Busse et al, 2013, 2015; Vicinanza et al, 2015; Liang et al, 2019).
While these in vitro experiments clearly demonstrated the potential of PROPPINs to promote membrane fission, they could not resolve whether they perform this function alone in the cellular context. Using the yeast PROPPIN Atg18, we hence began to search for interactors that might participate in the Atg18‐dependent fission of yeast vacuoles. This led us to discover a novel complex, which we term CROP. CROP integrates Atg18 with a part of the endosome‐ and vacuole‐associated retromer complex to generate a membrane fission device of much higher potency. We studied its activity in yeast, in human cells, and on liposomes.
Results
Atg18 forms a complex with Vps26/29/35
Seeking proteins that might cooperate with the PROPPIN Atg18 in driving membrane fission on yeast vacuoles, we affinity‐purified a FLAG‐tagged Atg18 (Atg18Gly6‐FLAG3) expressed under its native promoter in yeast. Associated proteins were quantified by mass spectrometry, using SILAC (stable isotope labeling by amino acids in cell culture) (Fig 1A). 11 proteins were significantly interacting with Atg18 (Appendix Table S1). The most abundant interactor in normal rich medium was Atg2, a protein binding Atg18 during autophagosome formation (Obara et al, 2008). Other Atg18 interactors, such as the phosphatase Sit4, which is required for vacuole fission (Michaillat et al, 2012; Michaillat & Mayer, 2013), and its regulatory subunits Cdc55 and Sap155, were detected in extracts from cells in which vacuole fission had been triggered by a moderate osmotic shock (Fig 1A). Also, three proteins from the retromer complex (Vps26, Vps35, and Vps29) bound Atg18 more strongly upon triggering vacuole fission. They form a stable subcomplex, called cargo‐selective complex (CSC) (Seaman et al, 1998). Our mass spectrometry analysis had not identified any peptides from Vps5 or Vps17, the phosphatidylinositol‐3‐phosphate (PI3P)‐interacting sorting nexins (SNX complex) that recruit CSC to the membrane (Seaman et al, 1998), nor from Grd19/Snx3, another yeast sorting nexin that associates with CSC (Strochlic et al, 2007; Purushothaman & Ungermann, 2018; Leneva et al, 2021).
Figure 1. Atg18 interacts with Vps26, Vps29, and Vps35.
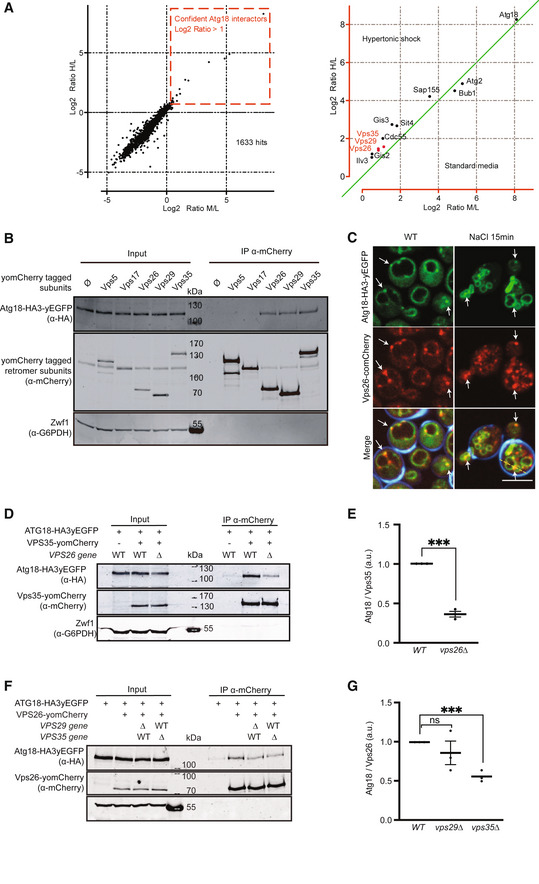
- Scatter plot of the log2 distribution of Atg18 partners identified by SILAC mass spectrometry. The abscissa shows log2 ratios of peptides found in standard media relative to the non‐tagged negative control (medium/light; M/L). The ordinate shows log2 ratios of peptides found in salt shocked cells, relative to the non‐tagged negative control (heavy/light; H/L).
- Interaction of Atg18 with retromer subunits. Genomically tagged yomCherry‐fusions of each retromer subunit were expressed in SEY6210 atg18∆, atg21∆, hsv2∆ cells, together with a plasmid expressing Atg18HA3yEGFP. Cell lysates were subjected to immunoprecipitation using RFP‐Trap magnetic beads and analyzed by SDS–PAGE and Western blotting against the indicated proteins.
- Salt‐induced vacuole fragmentation. Live‐cell confocal imaging of Atg18HA3‐yeGFP and Vps26yomCherry before and after a mild salt shock with 0.5 M NaCl for 15 min. Calcofluor white used to stain the cell walls is only shown in the merge. Arrows indicate sites of colocalization between Vps26yomCherry and Atg18HA3‐yeGFP. Scale bar: 5 µm.
- Atg18‐Vps35 interaction. Genomically tagged Vps35yomCherry was pulled down from lysates of SEY6210 WT or SEY6210 vps26∆ strains carrying genomically tagged Atg18HA3yEGFP. Adsorbed proteins were analyzed by SDS–PAGE and Western blotting using the antibodies indicated in brackets.
- Signals from the blots in d were quantified on an infrared fluorescence scanner and normalized to the amount of pulled‐down Vps35yomCherry. n = 3 independent experiments were analyzed using an unpaired Student's t‐test. Bars represent the mean and errors bars the SEM. ***P < 0.001.
- Atg18‐Vps26 interaction. Genomically tagged Vps26yomCherry was pulled down from lysates of SEY6210 WT, SEY6210 vps35∆ or SEY6210 vps29∆ strains carrying genomically tagged Atg18HA3yEGFP. Adsorbed proteins were analyzed as in D.
- Proteins from F were quantified as in E. n = 3 independent experiments were analyzed using an unpaired Student's t‐test. Bars represent the mean and errors bars the SEM. ***P < 0.001).
We tested the CSC‐Atg18 interaction through immunoadsorption. To this end, we tagged all retromer subunits individually with yomCherry and expressed them at their genomic locus, together with Atg18HA3‐yEGFP. Upon detergent lysis of whole cells and immunoadsorption on anti‐mCherry beads, the three CSC subunits, but not the SNX complex subunits, co‐adsorbed Atg18HA3‐yEGFP (Fig 1B). In live‐cell confocal fluorescence imaging, Vps26yomCherry and Atg18yEGFP formed multiple puncta, which partially overlapped at the vacuolar membrane (Fig 1C, white arrows). Triggering fragmentation of the vacuole through a moderate hypertonic shock increased the colocalization between Vps26 and Atg18, particularly at sites of vacuole–vacuole contact. Co‐immunoadsorption experiments showed that in cells lacking Vps26 (vps26Δ), the interaction between Atg18HA3‐yEGFP and Vps35yomCherry was decreased, yet it remained above the background defined by the non‐tagged control (Fig 1D and E). Conversely, we tested the impact of Vps29 and Vps35 on the interaction of Atg18HA3‐yEGFP and Vps26yomCherry. While a vps29Δ cell showed no significant difference in the interaction, vps35Δ reduced the Vps26yomCherry signal by half (Fig 1F and G). Thus, Vps26 and Vps35 may both contribute to the Atg18‐CSC interaction. Both in vivo and in vitro observations thus suggest a novel complex between CSC and Atg18, which we term the CROP (cutting retromer‐on‐PROPPIN) complex.
Atg18 and sorting nexins compete for binding to Vps26/29/35
We tested the functional relevance of retromer for fission of vacuoles by labeling these organelles with the fluorophore FM4‐64 in vivo. In agreement with previous observations (Raymond et al, 1992; Balderhaar et al, 2010; Liu et al, 2012), strains lacking the SNX subunits (vps5Δ and vps17Δ) presented many small vacuolar fragments, whereas the CSC mutants vps26Δ, vps29Δ and vps35Δ showed fewer and larger vacuoles than the wild type (Fig 2A). After addition of 0.5 M salt to stimulate vacuole fission (Bonangelino et al, 2002; Zieger & Mayer, 2012), all three CSC mutants maintained their large central vacuoles, whereas wild‐type cells fragmented the compartment into multiple (> 7) vesicles that were much smaller and numerous than before (Fig 2B and C). By contrast, snx3Δ mutants, which lack another well‐characterized sorting nexin interacting with CSC (Strochlic et al, 2007; Purushothaman & Ungermann, 2018; Leneva et al, 2021), showed normal vacuole morphology and no defects in salt‐induced vacuole fission (Fig EV1). Snx3 was hence not investigated further in this study.
Figure 2. Effects of sorting nexins and CSC subunits on vacuole structure and vacuole fission in vivo .
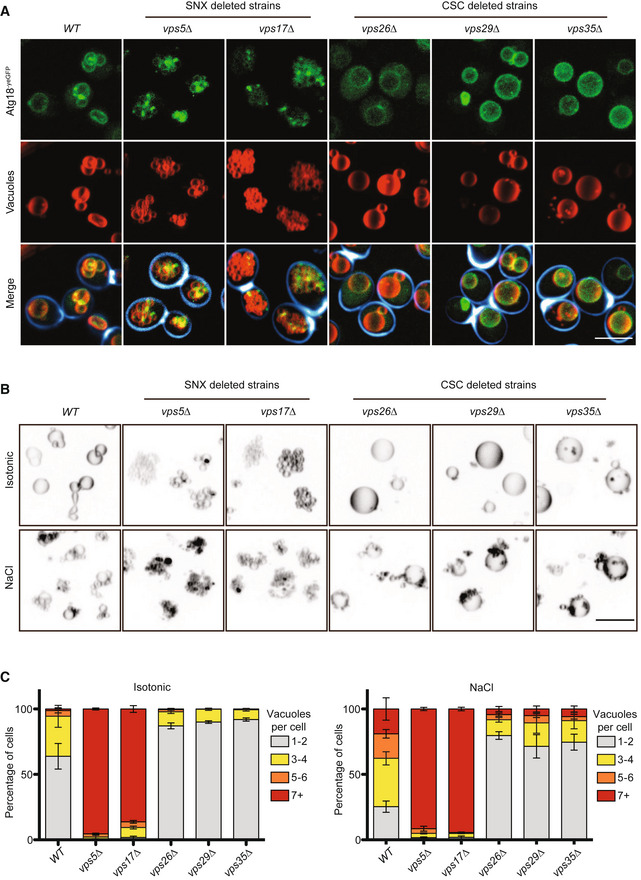
- Vacuole structure. Cells carrying Atg18yEGFP and the indicated retromer deletions were logarithmically grown in YPD medium, stained with FM4‐64 and Calcofluor white, and analyzed by confocal microscopy. Maximum intensity projections of z‐stacks are shown. Scale bar: 5 µm.
- Salt‐induced vacuole fission. The indicated cells were logarithmically grown in YPD and stained with FM4‐64. Vacuole morphology was imaged as in A, before and after a mild salt shock with 0.5 M of NaCl for 15 min. The look‐up table has been inverted to allow better representation of the clusters of extremely small vacuolar fragments in the SNX mutants. Scale bar: 5 µm.
- The number of vacuoles per cell was quantified for the samples from B. n = 3 experiments with at least 100 cells per condition were evaluated; error bars represent the SEM.
Figure EV1. Vacuole structure and vacuole fission of snx3Δ mutants.
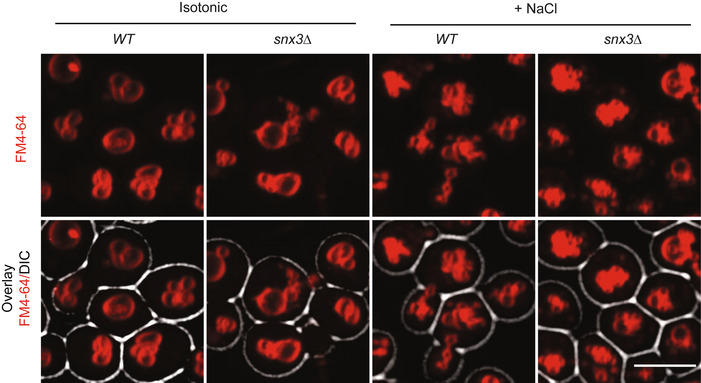
Cells were logarithmically grown in YPD and stained with FM4‐64. Vacuole morphology was imaged as in Fig 2A, before and after a mild salt shock with 0.5 M of NaCl for 15 min. Scale bar: 5 µm.
The fragmented vacuole phenotype of the SNX mutants vps5Δ and vps17Δ led us to the hypothesis that the CSC subunits promote vacuole fission, whereas Vps5 and Vps17 may prevent hyper‐activity of the fission machinery. They might do so by interfering with the formation of the CROP complex. In line with this, co‐immunoadsorption of Atg18HA3‐yEGFP with Vps26yomCherry was strongly increased in the SNX mutant vps17Δ (Fig 3A). Furthermore, the vacuolar hyper‐fragmentation of the vps17Δ cells could be fully reverted by deleting ATG18 and its redundant homolog ATG21, or by deleting VPS26 (Fig 3B and C). Thus, both CSC and Atg18 are required for vacuole fission.
Figure 3. Interaction of Atg18 and CSC.
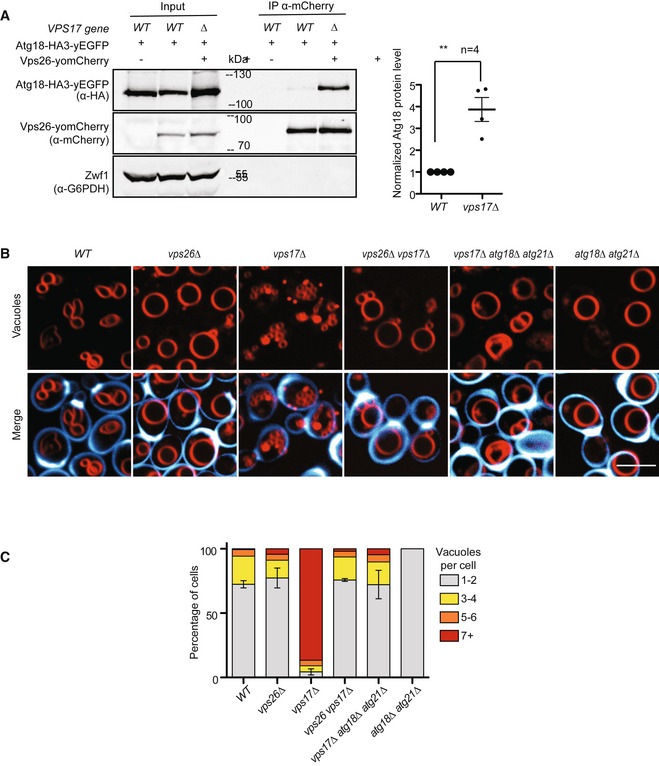
- Vps17 labilizes the Atg18‐Vps26 interaction. Wild‐type or vps17∆ cells expressing ATG18HA3‐yEGFP from a centromeric plasmid were logarithmically grown in YPD. Genomically tagged Vps26yomCherry was pulled down from whole‐cell extracts and analyzed for associated Atg18HA3‐yEGFP by SDS–PAGE and Western blotting. Glucose‐6‐phosphate dehydrogenase (Zwf1) serves as a loading control. The intensity of the interacting Atg18HA3‐yEGFP was quantified on a LICOR fluorescence imager and normalized to the amount of Vps26yomCherry. Values of the wild‐type interaction were used as the reference and set to 1. n = 4 independent experiments were analyzed using an unpaired Student's t‐test. Bars represent the mean and errors bars the SEM, **P < 0.01).
- Epistasis of ATG18 and retromer genes concerning vacuolar morphology. The indicated cells were logarithmically grown in YPD medium, stained with FM4‐64 and calcofluor white as in Fig 2A and analyzed by confocal microscopy. Scale bar: 5 µm.
- Quantification of vacuole morphology. The number of vacuoles per cell was measured in the cells from B. The graph shows the fractions of cells displaying the indicated numbers of vacuolar vesicles (n = 3 biological experiments with at least 100 cells per condition and experiment were analyzed using an unpaired Student's t‐test. Bars represent the mean, and errors bars represent the SEM. **P < 0.01.
To assay formation of CROP directly, we purified Atg18 from bacteria and CSC from yeast, where the Vps29 was labeled with GFP for detection and Vps26 was tagged with a TAP tag for affinity purification (Purushothaman & Ungermann, 2018). We noted that the addition of Atg18 to CSC‐GFP induced a strong increase in the fluorescence emission of CSC‐GFP at 525 nm (excitation at 488 nm). This gain in signal could be used to assay the binding event. Fluorescence intensity increased with recombinant Atg18 concentration, allowing us to estimate a K d value close to 50 nM (Fig 4A). We also evaluated the formation of CROP by blue native polyacrylamide gel electrophoresis and Western blotting. Here, Atg18 migrates mostly as expected for a monomer, but also shows a weaker band consistent with a dimer. Purified CSC forms two major bands, in line with previous observations of oligomerization (Kovtun et al, 2018; Kendall et al, 2020). Mixing CSC with an equimolar amount of Atg18 transformed CSC into two new species. Their mobility was between those of the two major CSC bands (tentatively assigned as CSC monomers and dimers, respectively). They both contained Atg18 and hence represent CROP (Fig 4B).
Figure 4. Formation of CROP from pure components and interference by SNX.
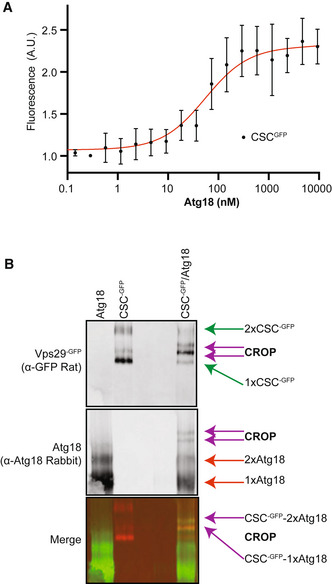
- Pure recombinant Atg18 was titrated from 0 to 75 µM using the shift of fluorescence of Vps29GFP (2.5 nM), which is induced by Atg18 binding. n = 3 independent experiments were analyzed using nonlinear curve fitting (least squares regression method) with GraphPad Prism 9. Bars represent 95% confidence intervals using an asymmetrical likelihood function.
- Purified Atg18 and CSC‐GFP were mixed in a 1:1 ratio, incubated together in PBS and analyzed by native PAGE and Western blotting using the antibodies indicated in brackets.
The Atg18‐CSC interaction is necessary for membrane fission
Our immuno‐adsorptions occasionally yielded a slightly shorter, C‐terminal proteolytic fragment of Atg18HA3‐yEGFP. This truncated form had lost the capacity of full‐length Atg18 to interact with CSC, suggesting that the binding site could be in the removed N‐terminal region, in blade 1 or 2 of the Atg18 ß‐propeller. This region has also been implicated in binding Atg2, which is required for the function of Atg18 in autophagy (Watanabe et al, 2012; Rieter et al, 2013). Alignment of various Atg18 and WIPI1/2 orthologs revealed a stretch of conserved residues in blade 2 (Fig 5A), at the opposite side of the two phosphoinositide binding sites that anchor these proteins to the membrane (Fig 5B). The motif contains three serines and threonines. At least two of these, Thr56 and Ser57, can be phosphorylated in vivo (Feng et al, 2015). We generated Atg18HA3‐yEGFP with alanine and glutamate substitutions of these residues and tested their consequences on vacuolar morphology and on the Atg18‐Vps26 interaction (Fig 5C). Except for S57E, which was hardly expressed, all other variants were expressed comparably as the wild type, and they bound to vacuoles (Fig 5D). A strong effect was observed for the T56E substitution. It largely abolished the co‐immunoadsorption of Atg18HA3‐yEGFP and Vps26yomCherry, suggesting that it compromised the interaction of Atg18 with CSC. In vivo microscopy supported this: In contrast to Atg18HA3‐yEGFP, which concentrates in numerous foci on the vacuole membrane, often at sites enriched in Vps26yomCherry, Atg18T56E‐HA3‐yEGFP showed a homogenous distribution along the vacuole and no co‐enrichment with Vps26yomCherry (Fig 5D). Thus, CSC is required to concentrate Atg18 in vivo.
Figure 5. Substitutions labilizing the Atg18‐Vps26 interaction.
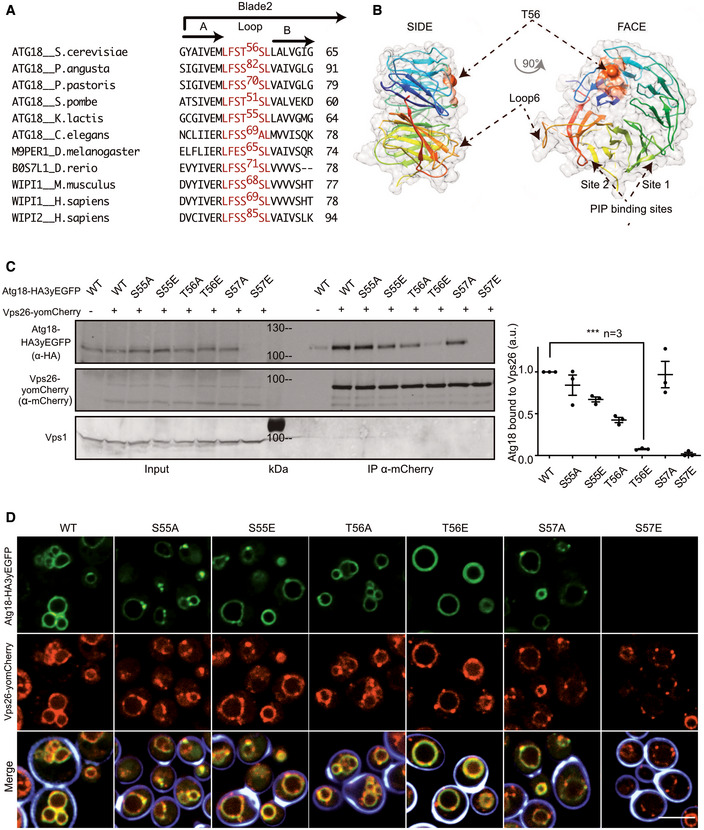
- Sequence alignment of various Atg18 and WIPI1/2 orthologs showing a conserved stretch (in red) of residues in blade 2.
- The stretch containing T56 is mapped on the structure of Atg18 from S. cerevisiae (pdb #6KYB) (Lei et al, 2020), the LFSTSL motif in from S. cerevisiae is shown in orange. Arrows show the Thr56 residue.
- Pull‐down. Cells (SEY6210 atg18∆, atg21∆) expressing genomically tagged Vps26yomCherry and the indicated Atg18HA3‐yEGFP variants were logarithmically grown in SC‐URA media. Vps26yomCherry was pulled down from whole‐cell extracts with RFP‐trap magnetic beads and analyzed by SDS–PAGE and Western blotting against the indicated proteins. Bands were quantified on a LICOR fluorescence imager. Signals of Atg18HA3yEGFP were normalized relative to those of Vps26yomCherry. Vps1 served as a loading control. n = 3 independent replicates. Data were subjected to an unpaired t‐test. Bars represent the mean and errors bars the SEM, ***P < 0.001).
- Influence of substitutions on Atg18 localization. The cells from c were stained with calcofluor white to mark the cell walls and analyzed by confocal microscopy. The calcofluor signal (blue) is only shown in the merge. Scale bar: 5 µm.
The T56E substitution also impaired vacuole fission in vivo. Upon a salt shock, which stimulates rapid vacuole fission in ATG18WT cells, atg18T56E cells maintained few large vacuoles (Fig 6A and B). The hyper‐fragmentation of vacuoles in vps17Δ cells, which depends on Atg18 (Fig 3B and C), provided an additional means of testing the effect of the T56E substitution. We used the vps17Δ atg18Δ atg21Δ cells, in which the hyper‐fragmented phenotype of vps17Δ is suppressed by the lack of functional CROP. This allows the strain to recover 1‐2 large vacuoles (see Fig 3B and C). Whereas re‐expression of ATG18WT in this strain rescued vacuole fission and re‐established hyper‐fragmented vacuoles (Fig 6C and D), atg18T56E could not provide this activity and behaved similarly as the fission‐defective atg18FGGG , a variant in which both phosphoinositide binding sites are compromised (Dove et al, 2004; Efe et al, 2007; Baskaran et al, 2012; Krick et al, 2012; Watanabe et al, 2012; Gopaldass et al, 2017). These observations support the notion that the interaction of Atg18 with CSC in the CROP complex is necessary for vacuole fission.
Figure 6. The Atg18‐CSC interaction in CROP is essential for vacuole fission.
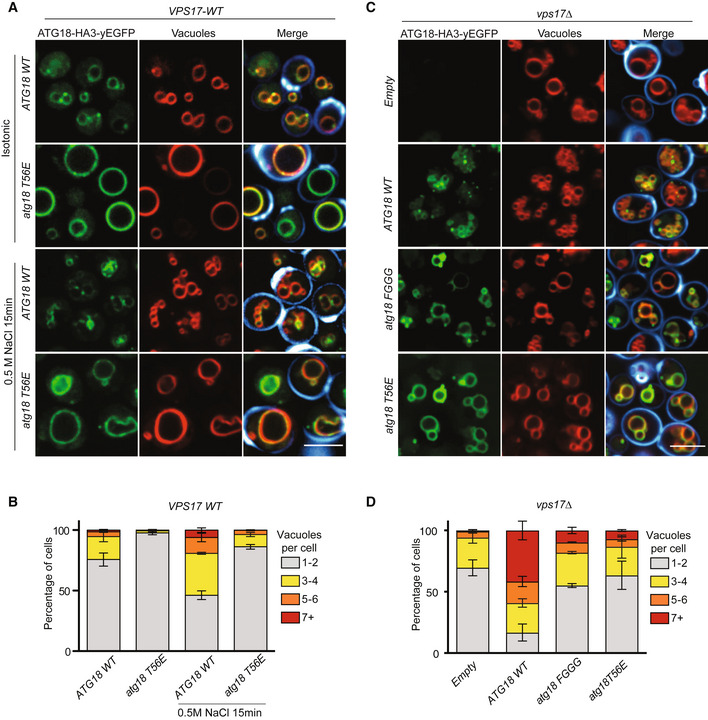
- Effect of Atg18T56E on salt‐induced vacuole fission. Cells expressing Atg18WTHA3‐yEGFP or Atg18T56E‐HA3‐yEGFP from centromeric plasmids in a SEY6210 atg18∆, atg21∆ strain were logarithmically grown in SD‐URA medium. They were stained and imaged before and after the induction of vacuole fission by a short salt shock as in Fig 1D. Calcofluor white‐stained cell walls are only represented in the merge (blue). Scale bar: 5 µm.
- Quantification of the number of vacuoles per cell from A, n = 3 biological experiments with at least 100 cells per condition were scored; bars represent the mean and error bars the SEM.
- Epistasis of atg18T56E over a vps17Δ mutation. The indicated variants of Atg18‐HA3‐yEGFP were expressed from plasmids in a SEY6210 atg18∆, atg21∆, vps17∆ strain. Cells were logarithmically grown in SD‐URA and imaged as in Fig 1D. Scale bar: 5 µm.
- Quantification of the experiments from C, n = 3 independent experiments with at least 100 cells per condition scored; bars represent the mean and error bars the SEM.
Finally, we tested the activity of atg18T56E in autophagy in vivo. We used the maturation of a soluble, cytosolic pro‐alkaline phosphatase as an assay, which depends on its transfer into vacuoles through autophagy (Noda et al, 1995). Cells expressing atg18T56E showed approx. 70% of the autophagic activity of cells expressing a wild‐type allele (Fig EV2A). This is in line with our earlier observations that the membrane fission and the autophagic functions of Atg18 and WIPI1 rely on distinct molecular features (Gopaldass et al, 2017; DeLeo et al, 2021). The functionality of Atg18T56E for autophagy also suggests that the protein cannot be generally misfolded in vivo. This was further confirmed by purifying recombinant Atg18T56E and Atg18WT protein from E. coli and analyzing them by CD spectroscopy (Fig EV2B–D). Both proteins showed similar CD spectra and thermal melting curves, suggesting that they adopt the same fold and stability. Both purified proteins also readily bound to small unilamellar liposomes. This binding was phosphoinositide‐dependent manner, confirming that the lipid binding sites of Atg18T56E are intact (Fig EV2E).
Figure EV2. Analysis of the functionality of Atg18T56E .

- Atg18T56E supports normal autophagic activity in vivo. Cells were logarithmically cultured in SD complete and then transferred to SD or SD‐N medium for 5 h. Autophagic activity of ATG18WT and T56E mutant was evaluated by measuring pho8∆60 activity (Noda & Klionsky, 2008). Error bars represent the SEM. n = 6 independent experiment. An unpaired t‐test was used for statistical analysis, bars represent the mean and errors bars the SEM, **P < 0.01.
- Secondary structures of purified, recombinant Atg18WT, and Atg18T56E were analyzed using circular dichroism (CD).
- Thermal melting CD spectra of Atg18WT and Atg18T56E, shown in the range of 198–202 nm, where the greatest changes occurred.
- Full thermal melting spectra (198–220 nm) of Atg18WT and Atg18T56E, which underlie the compilation in C. Wavelengths used for C are highlighted in green.
- Lipid binding activity. Small unilamellar vesicles without phosphoinositides (99.5%PC, 0.5% PE Cy5.5), or a parallel preparation with phosphoinositides (89.5% PC + 5% PI3P, 5% PI(3,5)P2 , 0.5% PE Cy5.5) were incubated (10 min, 25°C) with Atg18WT or Atg18T56E (1.5 μM). The vesicles were sedimented by centrifugation and supernatants (Sup.) and pellets were analyzed by SDS–PAGE and Coomassie staining.
CROP drives membrane fission on giant unilamellar liposomes
To directly test how CROP interacts with and acts on pure lipid membranes, we created in vitro models with synthetic vesicles. Small unilamellar vesicles (SUVs) containing 5% each of PI3P and PI(3,5)P2 could recruit purified CROP components in a liposome centrifugation assay. Part of Vps26CBP pelleted with the liposomes. It did not recruit the other CSC subunits with it and hence represents a fraction of Vps26CBP that dissociated from CSC (Fig 7A). It is probably recruited to the SUVs by its membrane‐inserting N‐terminus (Leneva et al, 2021). Atg18T56E and Atg18WT fractionated with the liposomes whereas Atg18FGGG bound very poorly. Vps35 could only be efficiently recruited to SUVs through Atg18WT, but much less through Atg18T56E and Atg18FGGG (Fig 7B and C). This provides evidence for the interaction of the pure CROP components on the membrane.
Figure 7. Impact of phosphoinositides on CROP binding to membranes.
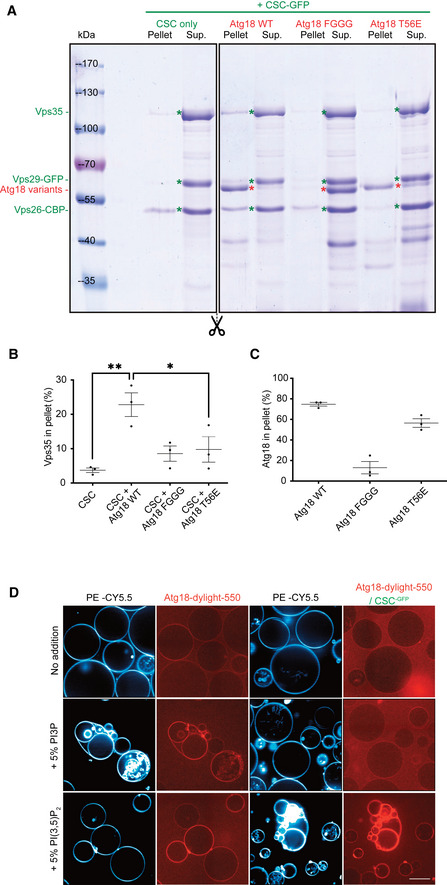
- Atg18‐dependent recruitment of CSC‐GFP to small liposomes. SUVs were incubated (10 min, 25°C) with purified CSC (1.5 µM) alone or in combination with the indicated recombinant Atg18 variants (1.5 µM). The vesicles were sedimented by centrifugation and supernatants (Sup.) and pellets were analyzed by SDS–PAGE and Coomassie staining.
- Quantification of the Coomassie signals for Vps35 by densitometry on a LICOR Odyssey scanner. n = 3 independent experiments. Bars represent the mean and error bars the SEM, **P < 0.01; *P < 0.05.
- Quantification as in B, but for the Atg18 variants.
- CROP recruitment to GUVs. GUVs containing the 5% of the indicated phosphoinositides and the fluorophore CY5.5‐PE were left to sediment (30 min, 25°C) in wells that were supplemented with recombinant Atg18 (2.5 nM) covalently linked to dylight550 and CSCGFP (100 nM) as indicated. Samples were incubated for 30 min before acquisition on a confocal microscope. Scale bar: 20 µm.
Next, we generated giant unilamellar vesicles (GUVs) from lipid mixtures containing 0.5% of the fluorescent lipid phosphatidylethanolamine‐CY5.5. These vesicles are large enough for light‐microscopic analyses (Fig 7D). Size‐fractionated GUVs were incubated with Atg18 that had been covalently coupled to a dylight550 fluorophore. Pure Atg18 rapidly bound the GUVs, but only when they contained PI3P or PI(3,5)P2, consistent with earlier studies showing that both lipids efficiently recruit PROPPINs to synthetic membranes (Baskaran et al, 2012; Krick et al, 2012; Gopaldass et al, 2017; Scacioc et al, 2017). Remarkably, Atg18 discriminated the two lipids when it was incubated in the presence of an excess of CSC, which incorporates Atg18 into CROP. Under these conditions, Atg18 bound only to the PI(3,5)P2‐containing GUVs but not to PI3P‐GUVs. This suggests that integration into CROP tunes the lipid affinity of Atg18 toward PI(3,5)P2, the phosphoinositide necessary to trigger vacuole fission in vivo.
Finally, we assessed the impact of CROP on GUV structure upon longer incubations. Atg18‐dylight550 was bound to GUVs containing both 2.5% PI3P and 2.5% PI(3,5)P2. Thereby we sought to mimic the fact that the normally minor level of PI(3,5)P2 increases substantially when vacuole fission is induced by hypertonic shift. It can then become of similar abundance as PI3P (Cooke et al, 1998; Bonangelino et al, 2002). During the 30‐min incubation, Atg18WT and Atg18T56E were recruited to the surface of the GUVs, whereas most Atg18FGGG remained in the buffer (Fig 8). Atg18WT and Atg18T56E distributed along the membrane in a homogeneous manner. Upon addition of 50 nM CSC‐GFP, followed by a second incubation phase of 30 min, CSC bound to GUVs, when Atg18WT was present. Binding coincided with the formation of a large number of small vesicles that remained attached to the GUVs. The generated vesicles showed strong signals of Atg18‐dylight550 and CSCGFP, with CSCGFP being concentrated in numerous puncta on or between these vesicles. Atg18T56E recruited less CSCGFP to the GUVs than Atg18WT, and it formed only very few smaller vesicles and CSCGFP puncta. At the concentration used (25 nM), Atg18 alone did not induce any fission or tubulation on GUVs. Pure Atg18 can promote fission of GUVS only at > 50 times higher concentration, as we have shown previously (Gopaldass et al, 2017). This suggests that the integration of Atg18 into CROP potentiates its membrane fission activity.
Figure 8. Fission of giant unilamellar liposomes by CROP.
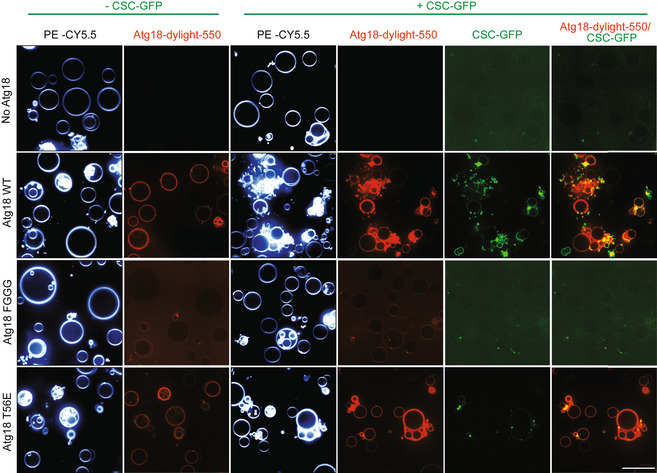
GUVs containing 2.5% PI3P, 2.5% PI(3,5)P2, and CY5.5‐PE were incubated (30 min, 25°C) alone or with recombinant Atg18 variants (25 nM), which had been covalently linked to a dylight550 fluorophore (red). CSCGFP (50 nM) was added to part of the samples for 30 min, before the vesicles were imaged on a confocal microscope. Scale bar: 20 µm.
CROP is required for protein exit from mammalian endosomes
Both CSC and PROPPINs are conserved from yeast to mammals (in mammals, CSC alone is called retromer), suggesting that also CROP might be conserved. We tested this by transfecting human HK2 cells with expression plasmids for the HA‐tagged Atg18 homolog WIPI1. The tagged protein was extracted and adsorbed to anti‐HA beads, which were then incubated with purified, recombinant human retromer. WIPI1HA on the beads led to the co‐adsorption of human retromer, suggesting that these proteins can interact (Fig EV3).
Figure EV3. Adsorption of recombinant mammalian retromer on immobilized WIPI1HA .
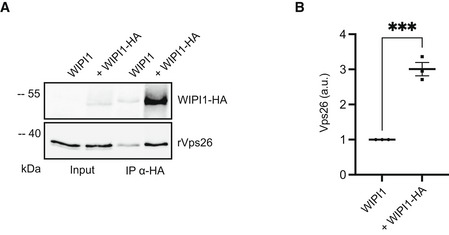
- HK2 cells were transfected with expression constructs for WIPI1HA. Cell extracts were incubated with anti‐HA beads to immobilize WIPI1HA and washed. The beads were incubated with recombinant human retromer purified from E. coli. Adsorbed proteins were analyzed by SDS–PAGE and Western blotting using the antibodies indicated in brackets.
- The intensity of the interacting hVps26 was quantified on a LICOR fluorescence imager and normalized to the signal in the sample without HA‐tag (set to 1). n = 3 biological replicates, using an unpaired t‐test. Bars represent the mean, and error bars represent the SEM, **P < 0.001.
Sequence alignment and modeling allowed us to identify the equivalent residue of Atg18 T56 in its human homolog WIPI1 as the S69 residue (Fig 5A). Since the endosomal system of mammalian cells is more developed than that of yeast (Day et al, 2018) it offers better possibilities to study the formation of endosomal transport carriers. This is illustrated by manipulations of WIPI1, which can suppress the fission of such carriers and lead to the accumulation of micrometer‐long tubules on the endosomes of HK2 cells (DeLeo et al, 2021). These tubules are very prominent and easy to recognize. They are poorly maintained upon fixation, and we hence analyze them in living cells. We deleted WIPI1 from this HK2 cell line and used plasmid transfection to re‐express fluorescent WIPI1 fusions with S69A or S69E substitutions (Fig 9A–C). Both variants were expressed to similar levels as the wild type (Fig 9C). While human VPS26EGFP extensively colocalized with WIPI1WT‐mCherry in dots, which represent endosomes (DeLeo et al, 2021), both WIPI1S69 substitutions partially segregated the two proteins. This is consistent with an impairment of their interaction. Similar observations were made using hVps35EGFP instead of hVps26EGFP (Fig EV4). The expression of hVps35 and hVps26 was unaffected by both WIPI1S69 substitutions, both for the EGFP‐tagged and the non‐tagged endogenous forms (Appendix Fig S1). In cells expressing WIPI1S69A‐EGFP, and more so in those expressing WIPI1S69E‐EGFP, micrometer‐long membrane tubules emanated from endosomes. Their abundance and size were further increased by simultaneous knockdown of hVps35 (Fig 9D–G). Similar elongated tubules appear when the fission activity of WIPI1 is abrogated by mutations in its lipid binding domains, or in its amphipathic helix in CD loop 6, which is essential for its fission activity (DeLeo et al, 2021). Substitutions inactivating the fission activity of WIPI1 also affect compartments carrying the lysosomal marker LAMP1. These were recapitulated by WIPI1S69E‐EGFP. Whereas lysosomes normally form small puncta that are dispersed in the cytosol and partially colocalize with WIPI1WT‐EGFP, LAMP1‐positive compartments are grossly enlarged in cells expressing WIPI1S69E‐EGFP (Fig EV5A). WIPI1S69A‐EGFP produced a qualitatively similar but weaker phenotype.
Figure 9. Effect of retromer and WIPI1 on human endosomes.
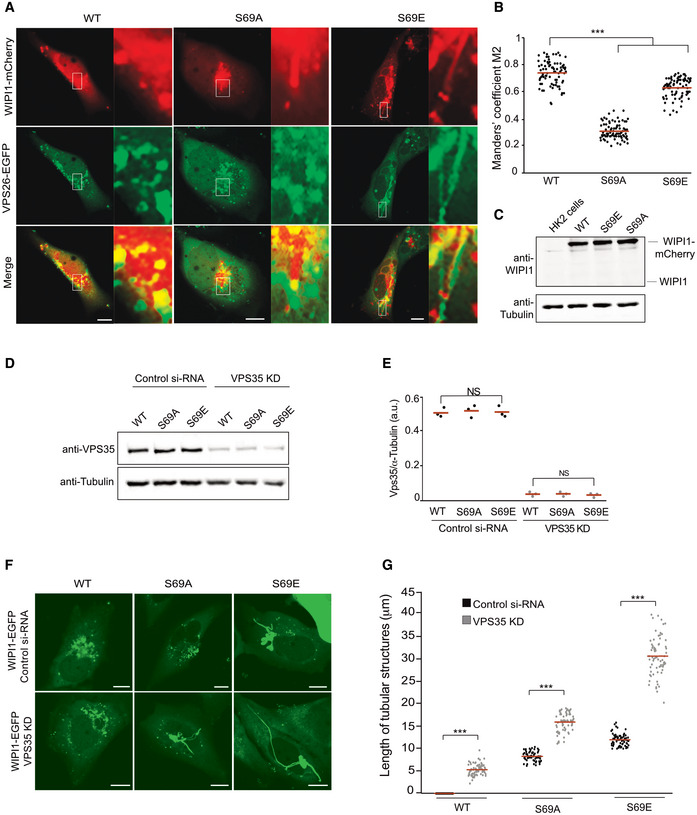
- Colocalization of WIPI1 with Vps26A. The indicated WIPI1mCherry variants and VPS26EGFP were expressed for 18 h in HK2 cells, from which endogenous WIPI1 had been deleted (WIPI1‐KO). The cells were analyzed by confocal microscopy. Scale bars: 10 μm. Insets show enlargements of the outlined areas.
- Colocalization between WIPI1 variants and Vps26 was quantified in the cells from A using the Manders’ colocalization coefficient M2. The red line indicates the mean; n = 120 cells per condition, pooled from three independent experiments. P values were calculated by t‐test (analysis performed with 99% confidence ***P < 0.0001).
- Expression levels of WIPI1mCherry variants. Lysates (50 μg of protein per sample) from the cells in A were analyzed by SDS–PAGE and Western blot against WIPI1 and tubulin.
- Depletion of VPS35. HK2 cells expressing the indicated WIPI1eGFP variants were transfected with siRNA against VPS35 (VPS35 KD) or a control siRNA pool. Lysates (50 μg per sample) from the cells were analyzed by SDS–PAGE and Western blot against Vps35 and tubulin.
- Blots from D were quantified on a LICOR Odyssey fluorescence imager. n = 3. Red lines indicate the means, n = 3 independent experiments, using a Welch’s t‐test statistical analysis. Bars represent the mean and error bars the SD.
- Cells from D were analyzed by confocal microscopy 18 h after transfection. Scale bar: 10 μm.
- Quantification of tubule length in the cells from F. Data are means ± SD. of n = 210 tubules per condition, from three independent experiments. P values were calculated by unpaired Student’s t‐test. 99% confidence: ***P < 0.0001.
Figure EV4. Colocalization of WIPI1S69 variants with hVps35.

- The indicated WIPI1S69‐mCherry variants and Vps35EGFP were expressed for 18 h in HK2 cells, from which endogenous WIPI1 had been deleted. The cells were analyzed by confocal microscopy. Scale bars: 10 μm. Insets show enlargements of the outlined areas.
- Quantification of the colocalization in a, using Manders' coefficient M2. N = 3 independent experiments with a total of 195 cells were quantified per condition. P values were calculated by unpaired Student’s t‐test. The analysis was performed with 99% confidence: ***P < 0.001.
Figure EV5. Dominant negative effect of EGFP‐WIPI1S69E on LAMP1 compartments and on transferrin recycling.
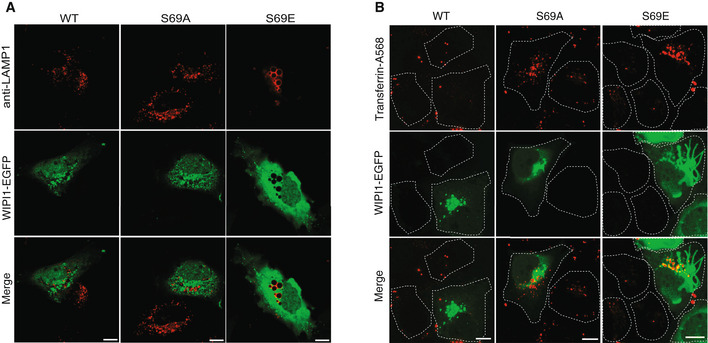
- LAMP1 compartments. HK2 cells expressing WIPI1WT‐EGFP, WIPI1S69E‐EGFP, or WIPI1S69A‐EGFP were fixed 18 h after transfection. The cells were stained for immunofluorescence analysis with anti‐LAMP1 antibody and imaged by confocal microscopy. Scale bars: 10 μm.
- Tf recycling. HK2 cells were transfected with WIPI1WT‐EGFP, WIPI1S69E‐EGFP, or WIPI1S69A‐EGFP for 18 h. Then, they were serum‐starved for 1 h, loaded with Alexa Fluor 568‐conjugated Tf, chased at 37°C for 1 h in medium without labeled Tf, and analyzed by confocal microscopy. Scale bar: 10 μM. The white dashed lines indicate the circumference of the cells.
We assayed the effects of the S69 substitutions on protein exit from the endosomes via trafficking of transferrin receptor (TfR), a protein that shuttles transferrin from the plasma membrane toward endosomes and back (Dautry‐Varsat et al, 1983). Our previous study had shown that WIPI1 and the transfection with WIPI1 variants do not impact the loading of endosomes with Tf (DeLeo et al, 2021). The endosomes of HK2 cells were loaded with transferrin as described (DeLeo et al, 2021) and then subjected to a chase in transferrin‐free medium. WIPI1 knockout cells re‐expressing WIPI1WT‐EGFP efficiently returned transferrin back to the cell surface, from where it finally dissociates, leaving very little transferrin associated with the cells after the chase period (Fig 10A and B). By contrast, cells expressing the S69 substitutions retained transferrin in their endosomes. The S69 substitutions were even dominant negative over the endogenous WIPI1, since they had a similarly strong effect on Tf recycling in wild‐type cells (Fig EV5B) as in WIPI1 knockout cells (Fig 10). The capacity to exert dominant negative effects over the wild type implies that the substituted WIPI1 versions compete with the endogenous wild‐type proteins and should hence be folded.
Figure 10. Effect of CROP on protein exit from mammalian endosomes.
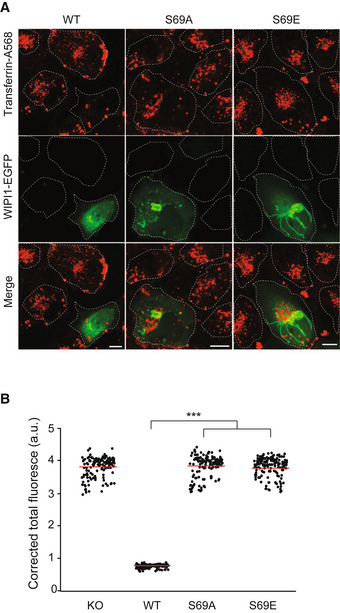
- Tf recycling. WIPI1‐KO cells were transfected with WIPI1WT‐eGFP, WIPI1S69E‐eGFP, or WIPI1S69A‐eGFP for 18 h. Then, they were serum‐starved for 1 h, loaded with Alexa Fluor 568‐conjugated Tf, chased at 37°C for 1 h without labeled Tf, and analyzed by confocal microscopy. Scale bar: 10 μm. White dashed lines delineate the circumference of the cells.
- Quantification of Tf‐fluorescence in the cells from a that expressed WIPI1 variants. Total cell fluorescence was integrated and corrected for background fluorescence. Mean values ± SD are shown. n = 3 independent experiments with a total of 150 cells analyzed per condition. P values were calculated by unpaired Student’s t‐test. 99% confidence: ***P < 0.0001.
To test the effects on further cargos, we analyzed the cellular distributions of the retromer cargo GLUT1 and of the retriever cargo α5β1 integrin (Piotrowski et al, 2013; Steinberg et al, 2013; McNally et al, 2017). Exposure of both cargos at the cell surface depends on their sorting from endosomes to the plasma membrane. In control cells that had not been detergent permeabilized, immunostaining for both proteins yielded strong signals, confirming their efficient delivery to the cell surface. In WIPI1KO cells, however, GLUT1 staining at the cell surface was strongly diminished (Fig EV6). Upon detergent permeabilization of the plasma membrane, strong GLUT1 signals appeared on intracellular compartments, which colocalized with the endosomal marker EEA1. By contrast, the retriever cargo integrin β1 showed equally good surface exposure in WIPI1KO cells and in wild‐type cells, and no accumulation in intracellular compartments of WIPI1KO cells was detected (Fig EV7). This suggests that the retromer‐dependent delivery of GLUT1 from endosomes to the cell surface requires WIPI1, whereas the retriever‐mediated exit of integrin β1 is independent of it.
Figure EV6. WIPI1 promotes transport of GLUT1 to the cell surface.
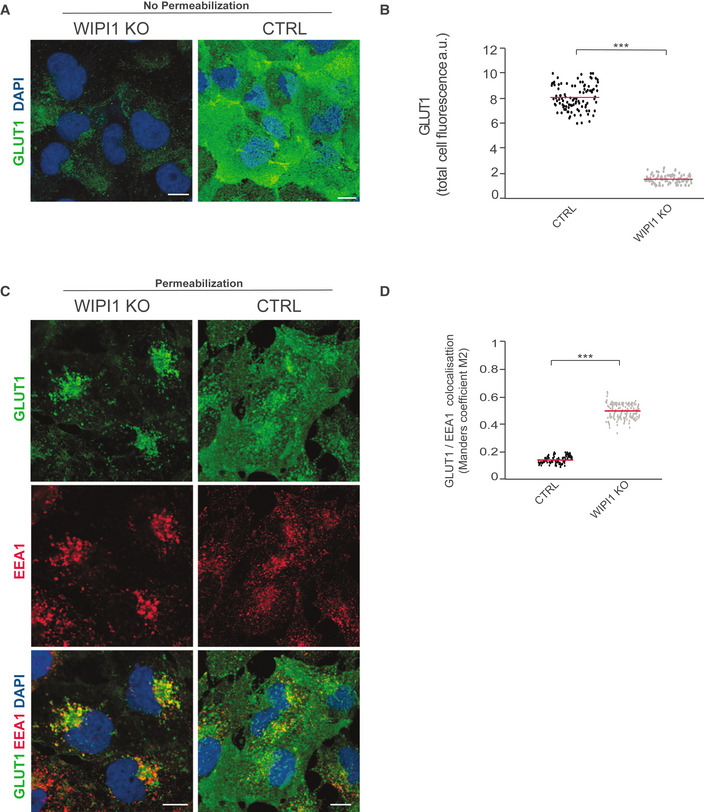
- GLUT1 surface expression. Control and WIPI1 KO cells were fixed and stained with antibody to GLUT1 (green) and with DAPI (blue), without detergent permeabilization. Scale bars: 10 μm.
- Quantification of GLUT1 immunofluorescence in cells from A. Regions of interest (ROIs) corresponding to each cell and in some regions outside the cells (background) were manually defined using ImageJ software. Total cell fluorescence was integrated and corrected for background fluorescence. 150 cells per condition, stemming from three independent experiments, were analyzed. P values are indicated and were calculated by an unpaired Student’s t‐test. The analysis was performed with 99% confidence. ***P < 0.0001.
- Immunofluorescent staining of intracellular GLUT1 (green) and EEA1 (red) in CTRL and WIPI1KO HK2 cells. Prior to staining, the cells had been fixed and permeabilized with 0.05% saponin. Scale bars: 10 μm.
- GLUT1/EEA1 colocalization was assessed in cells from C using Manders’ colocalization coefficient M2, calculated in ImageJ. The colocalization was quantified in 120 images taken from three independent experiments. P values were calculated by an unpaired Student’s t‐test. The analysis was performed with 99% confidence: ***P < 0.0001.
Figure EV7. Surface expression of α5β1 integrin is independent of WIPI1.
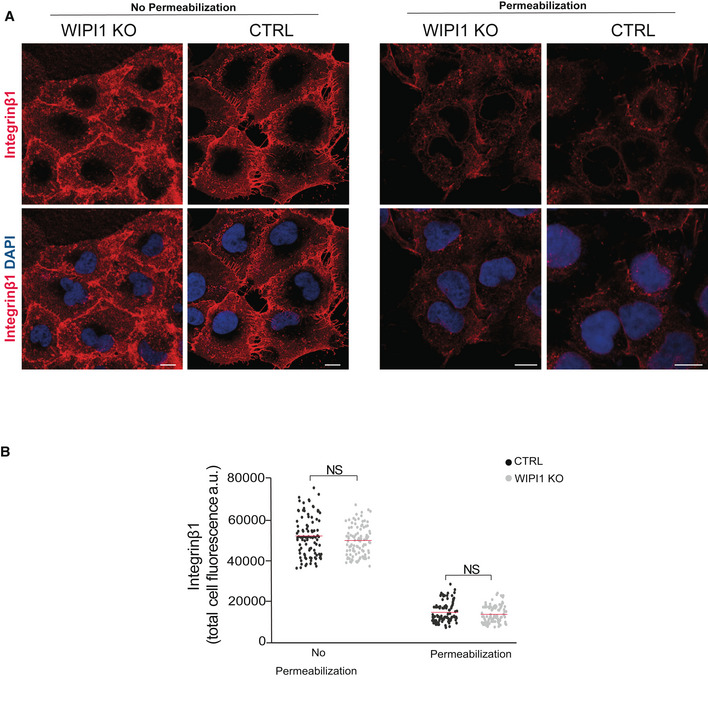
- β1 integrin surface expression. Control and WIPI1KO cells were fixed and stained with antibody to β1 integrin (red), and with DAPI (blue). Where indicated, cells had been permeabilized with saponin 0.05%) prior to staining. Scale bars: 10 μm.
- Quantification of β1 integrin‐immunofluorescence in cells from A. Regions of interest (ROIs) corresponding to each cell and in some regions outside the cells (background) were manually defined using ImageJ software. Total cell fluorescence was integrated and corrected for background fluorescence. 180 cells per condition, stemming from three independent experiments, were analyzed. Red bars show the means. P values were calculated by unpaired Student’s t‐test. The analysis was performed with 99% confidence. NS = not significant (P > 0.01).
In sum, our observations are consistent with the notion that CROP promotes fission of endosomal transport carriers at mammalian endosomes and thereby supports multiple, but not all, pathways of protein exit from this organelle.
Discussion
Our results suggest that the PROPPIN Atg18 associates with parts of retromer to form the CROP complex. While pure Atg18 alone displays fission activity on GUVs at micromolar concentrations (Gopaldass et al, 2017), CROP promotes fission of these synthetic vesicles in the low nanomolar range, i.e., with much higher potency. In line with this, destabilization of CROP produces a number of in vivo phenotypes that are consistent with a loss of fission activity: It interferes with vacuole fragmentation and with endosomal membrane exit; and it leads to the accumulation of huge endosomal tubules, which were proposed to represent endosomal carriers that continue to elongate but fail to detach (DeLeo et al, 2021). This favors the notion that CROP represents a relevant agent for fission on endo‐lysosomal membranes in vivo. CROP provides a novel function to retromer subunits that are associated with Parkinson's and Alzheimer's disease, such as hVps35 (McMillan et al, 2017; Li et al, 2019; Rahman & Morrison, 2019). Therefore, it opens novel perspectives for the mechanistic analysis of these pathologies in relation to the fission activity of CROP.
The Vps26/29/35 complex (CSC) tends to oligomerize (Collins et al, 2005, 2008; Hierro et al, 2007; Lucas et al, 2016; Purushothaman et al, 2017; Kovtun et al, 2018; Kendall et al, 2020; Leneva et al, 2021). In the context of retromer, this oligomerization supports the formation of tubular endosomal transport carriers, which sequester cargo exiting from endo‐lysosomal compartments. If such oligomerization occurred also when Atg18 is bound, it would concentrate multiple copies of Atg18 on a small membrane patch. This might be relevant for fission, because the hydrophobic CD loop 6 of Atg18 forms a conserved amphipathic alpha‐helix when brought into contact with a bilayer (Gopaldass et al, 2017). The shallow insertion of this helix into the membrane should increase the curvature of the bilayer (Campelo et al, 2008; Boucrot et al, 2012). The concentration of several helices through oligomeric CSC is expected to enhance this effect, making fission more efficient. Furthermore, CSC might have allosteric effects on Atg18, or constrain it in a specific position relative to the membrane, such as to enhance its effect on lipid conformation and destabilization of the bilayer. Such effects might also impact the two lipid interaction sites of Atg18 and induce the preference for binding PI(3,5)P2, which Atg18 displayed only when integrated into CROP.
Structural analyses of retromer and the associated SNX protein have yielded first models of how this coat might form tubular endosomal carriers (Hierro et al, 2007; Lucas et al, 2016; Kovtun et al, 2018; Kendall et al, 2020; Leneva et al, 2021). SNX complexes can either form an inner layer that recruits a peripheral layer of arch‐shaped CSC complexes. In SNX3‐coated retromer carriers, by contrast, CSC is tied to the membrane via SNX3 and by direct membrane interaction of Vps26. Our observations suggest that Atg18 and SNX compete for binding to CSC. CSC binds SNX through two interactions, one between the N‐terminal part of Vps5 and one between Vps26 and the BAR domain of Vps5 (Seaman & Williams, 2002; Collins et al, 2005; Kovtun et al, 2018) At present, we cannot judge whether the binding sites for sorting nexins and Atg18 on CSC overlap, or whether the apparent competition of Atg18 and SNX is due to steric hindrance or allosteric effects. Future studies will have to address this.
Oligomerization of retromer is supported through multiple homo‐ and heteromeric interactions between CSC subunits, SNX subunits and cargo (Weering et al, 2012; Lucas et al, 2016; Kovtun et al, 2018; Purushothaman & Ungermann, 2018; Leneva et al, 2021). If we assume that a SNX/CSC‐coated tubule is a relatively homogeneous structure, in which all Vps35 and Vps26 subunits are engaged by SNXs, as proposed (Lucas et al, 2016; Kovtun et al, 2018), we can formulate a plausible working model for fission of such ECVs. Since arch‐like CSC structures carry Vps26 subunits at each of their "legs", CSC might remain bound to the tubular coat that it has assembled through one of its legs, while on the other leg a PROPPIN could bind instead of a sorting nexin. Since the PROPPIN and sorting nexins appear to compete for binding, such a recruitment might be favored at the rim of the tubular SNX layer, i.e., at the site where fission should occur to detach an endosomal carrier. The competition for CSC binding with the SNXs might thus help to target CROP activity to the correct place.
Fission activity of CROP is not only used to facilitate departure of endosomal cargo, but it can also drive the division of an entire organelle, as shown by the fragmentation of vacuoles. In yeast, both reactions require not only CROP but also the dynamin‐like GTPase Vps1 (Peters et al, 2004; Zieger & Mayer, 2012; Alpadi et al, 2013; Chi et al, 2014; Arlt et al, 2015). This is remarkable, because dynamin‐like GTPases are mechanochemical devices, which can squeeze membrane tubules to very small radii (Antonny et al, 2016). We envision that the two protein systems cooperate to drive fission. This may create a similar situation as in endocytosis, where the detachment of endocytic vesicles requires fission‐promoting activity from dynamin and from additional membrane‐deforming factors carrying fission activity, such as epsin (Boucrot et al, 2012). Dissecting the activities of CROP, retromer and dynamins will require refined in vitro systems that should allow to measure coat assembly, PROPPIN and dynamin recruitment, and membrane constriction. Such studies should also address the relationship of WIPI1 to other factors that have already been implicated in membrane fission of endosomal carriers, such as the Rab‐GTPase system (Rojas et al, 2008; Seaman et al, 2009; Balderhaar et al, 2010; Liu et al, 2012; Jia et al, 2016; Purushothaman & Ungermann, 2018), the actin‐regulating WASH complex (Derivery et al, 2009; Gomez & Billadeau, 2009; Harbour et al, 2012; Liu et al, 2012; Chen et al, 2019), and EHD1 (Daumke et al, 2007; Gokool et al, 2007).
Materials and Methods
Antibodies
Membranes were decorated using anti‐mCherry‐1C51 (Abcam), anti‐HA.11‐16B12 (BioLegend), anti‐G6PDH (Sigma‐Aldrich), anti‐Tubulin (clone B5‐1‐2, Sigma‐Aldrich), anti‐WIPI1 (W2394 Sigma‐Aldrich), anti‐Tubulin (T9026 Sigma‐Aldrich) anti‐Vps35 (ab10099 Abcam, ab157220 Abcam) and anti‐Vps26 (ab181352 Abcam). After incubation with the primary antibody, signals were detected by secondary antibodies coupled to infrared dyes (LICOR), IRDye® 800CW goat anti‐mouse IgG, IRDye® 800CW goat anti‐rabbit IgG, IRDye® 680LT goat anti‐rabbit IgG, IRDye 800CW goat anti‐rat IgG, IRDye® 680RD donkey anti‐rabbit IgG, and detected on a LICOR Odyssey Infrared Imager. Band intensity was quantified using Odyssey software with background removal activated.
Yeast cell culture
All strains were grown in either in YP (yeast extract, peptone) or in SC (synthetic dextrose) dropout media to select for auxotrophies and to avoid plasmids loss, both supplemented with 2% glucose. Conditions for SILAC growth are described below. Strains, plasmids and primers used in this study can be found in Appendix Tables S2, 3, and 4. Liquid cultures were grown in at 30°C and shaken at 180 rpm.
Strains and plasmids
Genes were deleted by replacing a complete open reading frame with a natNT2 (Janke et al, 2004) or a loxP‐flanked kanMX4 deletion cassette (Güldener et al, 1996). Some constructs required to remove the kanMX4, using the Cre–lox P recombination method with plasmid pSH47 (Euroscarf #P30114). Atg18 and CSC have been C‐terminally tagged with either Gly6‐FLAG3::kanMX4 (available on Addgene #20754) (Funakoshi & Hochstrasser, 2009). yomCherry::kanMX4, and yomCherry::SpHIS5 (both available on Addgene #44903 & #44841) (Lee et al, 2013) by direct insertion of these tags at their genomic locus. Atg18‐GFP was expressed from pRS316‐Atg18‐HA3‐GFP (Atg18‐HG), which was a kind gift of Dr Y. Ohsumi (Tokyo Institute of Technology). GFP has been replaced for a yeast version yEGFP, subcloned from pKT0127 (Addgene #8728) (Sheff & Thorn, 2004), and placed in between the Sph1/Not1 restriction sites to generate pRS316‐Atg18‐HA3‐yEGFP. Mutants in the putative retromer interaction motif (LFSTSL) of Atg18 were created by site‐directed PCR mutagenesis (See Appendix for primer details), except for the mutant S55E, which has been generated by replacing the region between restriction site MfeI and MscI through chemically synthetized double‐stranded DNA (from Eurofins) containing the mutation. Strains used for SILAC must be auxotrophic for lysine and arginine. BJ3505 already contains the lys2‐208 auxotrophic and arginine auxotrophy was generated by deleting ARG4. Since BJ3505 cells lack activity of the arginine importer Can1, we restored uptake of exogenous arginine by expressing CAN1 from the NOP1 promoter. CAN1 was subcloned from the BY4741 background into a pRS406‐promNOP1::CaURA3 plasmid. This plasmid has been linearized using the StuI restriction site of the CaURA3 locus and transformed in BJ3505 arg4∆, complementing the ura3‐52 mutation and creating the sTC22 strain suitable for SILAC. All constructs were verified by PCR and DNA sequencing; yeast transformations were performed using the LiAc/SS carrier DNA/PEG method (Gietz & Schiestl, 2007).
eGFP‐WIPI1WT (pAR31CD vector) was kindly provided by Tassula Proikas‐Cezanne (Tübingen, Germany); EGFP‐Vps35 was a gift from Peter Cullen (Bristol, UK). To generate mCherry‐WIPI1, mCherry and WIPI1 fragments were amplified from pFA6a‐mCherry‐V5‐KanMX6 (from Fulvio Reggiori, University Medical Center Groningen, Netherlands) and eGFP‐WIPI1 plasmid, respectively, by using the primers Age1‐mCherry/eGFP‐WIPI1‐EcoRI (see Appendix Table S4). The two fragments were fused by overlap extension‐PCR and cloned into pAR31CD between Age1 and EcoR1 restriction sites.
eGFP‐WIPI1WT was used as DNA template for site‐directed mutagenesis (QuikChange mutagenesis system, Agilent Technologies) to generate point mutations in the FSSS motif. mCherry‐WIPI1S69E and mCherry‐WIPI1S69A were produced using mCherry‐WIPI1WT as template and eGFP‐WIPI1S69E, and eGFP‐WIPI1S69A using eGFP‐WIPI1WT as template following the manufacturer’s protocol using primers (Microsynth) listed in Appendix Table S4. Non‐mutated template vector was removed from the PCR mixture through digestion with Dpn1 for 1 h at 37°C. The product was purified by NucleoSpin PCR clean‐up (Macherey‐Nagel) and transformed into Escherichia coli. Plasmid DNA was purified and sequenced.
To generate Vps26‐eGFP plasmids, we subcloned hVPS26 from pmr101A‐hVPS26 (Addgene #17636) with primer hVPS26 Fw / hVPS26 Rv (Appendix Table S4), into a pcDNA3‐eGFP plasmid (Addgene #13031) using Gibson assembly.
SILAC (stable isotope labeling by amino acids in cell culture)
Strains sTC14 and sTC22 were grown to saturation (approx. 1 day) in SC (synthetic complete, Formedium). 0.5 OD600 units were transferred into 5 ml of SC‐arginine/‐lysine (Sunrise Science Products) supplemented with 0.43 mM arginine and lysine. Light and stable isotope labeled amino acids (Sigma‐Aldrich) were included in different conditions as described in Appendix Table S5.
After 4 h, these precultures were diluted into 1 Liter cultures. After 15 h of culture at 30°C, vacuole fragmentation was triggered in the R10/K8 sample through a salt shock by addition of 200 ml of SC complete supplemented with 0.43 mM of R10/K8 and 5 M NaCl. After 5 min of shaking, cells were harvested with 5‐min centrifugation (4,800 g, 4°C) in a Beckman JLA‐8100 fixed‐angle rotor. Cells were rinsed with ice‐cold TGN buffer (50 mM Tris–Cl pH 7.4, 5% glycerol, 100 mM NaCl), and frozen in liquid nitrogen. Atg18 purification is described below. Before start of the experiments, tests were carried out to verify that medium and heavy samples were completely labeled (> 99% labeling efficiency), and that no conversion of arginine to proline was observed.
Protein purification
Atg18 purification for MS
For Atg18 purification in SILAC experiments, pellets were thawed on ice in one pellet volume of TGN lysis buffer (50 mM Tris pH 7.4, 10% Glycerol, 100 mM NaCl) supplemented with 0.5% Triton, complete protease inhibitor tablets (Roche), phosphatase inhibitor tablets (Roche), 1 mM DTT, and 1 mM PMSF. Cells were passed one time through a French press (Constant Systems LTD) at 4°C with 2.2 kpsi of pressure. Atg18 was isolated by affinity purification using the Gly6‐FLAG3 tag and Dynabeads (Sigma) crosslinked with the FLAG M2 antibody (F1804 epitope, Sigma). After 1 h of incubation at 4°C, beads were washed three times with TGN buffer using a magnetic rack, transferred to new Eppendorf tubes, washed with 1 ml of elution buffer (Tris 50 mM pH 7.4), then eluted with 3xFLAG peptide (0.5 mg/ml) in elution buffer. Eluates were flashed‐frozen in liquid nitrogen and placed on a −80°C freezer before Coomassie staining and MS analysis.
Atg18 purification from bacteria
Atg18WT and mutant DNA were amplified from the corresponding pRS316 plasmids and cloned into a pEXP5‐NT/TOPO vector (Invitrogen). Plasmids were transformed into E. coli BL21. A 50 ml preculture overnight was used to inoculate 2 l of LB media (37°C). Cells were grown to an OD600 of 0.8–0.9. Cultures were then cooled to 16°C on ice, and IPTG (Roche) was added to a final concentration of 0.2 mM. Cells were shaken overnight (200 rpm, 16°C), pelleted, washed once in ice‐cold lysis buffer (500 mM NaCl, 50 mM Tris pH 7.4, 10 mM KPi), and resuspended in one pellet volume of lysis buffer with complete EDTA‐free protease inhibitor cocktail (Roche) before purification. Purification was performed as previously described (Gopaldass et al, 2017). To conjugate the Dylight550 fluorophore (Thermo Fisher), proteins were incubated at room temperature with an equimolar amount of the dye in PBS containing 300 mM of NaCl at room temperature protected from light. To remove the excess of fluorophore proteins were dialyzed in PBS with 300 mM NaCl overnight at 4°C with a 12 kDa cutoff membrane (ZelluTrans, ROTH).
Retromer purification from yeast cells
Strains for yeast purification were provided by Christian Ungermann (University of Osnabrück) (Purushothaman et al, 2017). Yeast precultures were grown in 50 ml YP‐galactose (2%) to stationary phase, diluted in 2 l of YP‐galactose and grown at least 24 h to late log phase (OD600 of 3). From this point, all steps were performed on ice or at 4°C. Cells were spun down (4,800 g, 5 min, 4°C) in a precooled Beckman JLA‐8100 fixed‐angle rotor, resuspended in one pellet volume of PBS (phosphate‐buffered saline, pH 7.4) with 0.4 mM PMSF, pelleted as before, frozen in liquid nitrogen and stored at −80°C. Pellets were thawed in one pellet volume of RP buffer (50 mM Tris pH 8.0, 300 mM NaCl, 1 mM MgCl2, 1 mM PMSF, Roche Complete protease inhibitor tablet 1×). Cells were opened using a French press (Constant Systems LTD, pressure 2.2 kpsi). 5 mg DNase I (from Bovine Pancreas grade II, Roche) was added to 50 ml of lysate. The lysate was incubated on rotating wheel at 4°C for 20 min, and pre‐cleared by centrifugation at 18,500 g for 30 min in a JLA 25.50 rotor. The supernatant was cleared by centrifugation at 177,520 g for 90 min in a Beckmann Ti60 rotor. After aspiration of the upper lipid phase, the cleared supernatant was passed through a 0.22‐µM filter (Millipore) and transferred to a new 50‐ml falcon tube. Cleared lysate was incubated with 1 ml IgG Sepharose beads suspension (6 Fast Flow, GE Healthcare) pre‐rinsed with buffer for 20 ml lysate on a rotating wheel at 4°C for 1 h. Beads were spun down at 3,000 g for 5 min with minimal deceleration (Eppendorf 5804R) and washed three times with RP buffer, then transferred to new 1.5‐ml Eppendorf tube. Beads were resuspended in 1 ml of RP buffer without inhibitors, supplemented with 250 µg of His6‐TEV protease. TEV cleavage was performed at 16°C for 1 h. The supernatant was incubated for an additional 20 min at 16°C with Ni‐NTA beads to remove TEV protease. The supernatant was then concentrated on an Amicon Ultra‐50 100K filter column at 3,000 g (Eppendorf 5804R) to reach a final volume of 250 µl. Eluates were divided into 10 µl aliquots, frozen in liquid nitrogen, and stored at −80°C until use.
Circular dichroism (CD)
Secondary structure of Atg18WT and Atg18T56E was analyzed using circular dichroism at a protein concentration of 0.3 mg/ml in 0.15 M NaF, 20 mM KPi pH 7.5 buffer on a Chirascan V100 from AppliedPhotophysics. Spectra were acquired using 150 µl of sample in a 10 mm‐wide quartz cuvette. Parameters of acquisition: Wavelength 190–260 nm; step size: 1 nm; bandwidth: 1 nm; temperatures: 20–96°C in steps of 2°C.
MS analysis and MS data analysis
Sample preparation
The light‐, medium‐ (Arg6/Lys4), and heavy‐labeled (Arg10/Lys8) samples were mixed and concentrated by a microspin column with a 10 kDa cutoff membrane. 2/3 (for shotgun analysis) and 1/3 (analysis of atg18 protein) of the mixed sample were loaded and migrated in separate lanes of a 12% SDS–PAGE gel. For the shotgun analysis, the whole lane was cut in 7 bands and digested, as described (Shevchenko et al, 1996) with sequencing‐grade trypsin (Promega). For the atg18 protein analysis, only two bands between 50 and 150 kDa were cut and digested, using methyl methanethiosulfonate (MMTS) for cysteine alkylation.
The SNX and CSC complex samples were resuspended in 15 µl of buffer (8 M urea, 50 mM TEAB, 10 mM TCEP, and 40 mM chloroacetamide) and kept 45 min in the dark at ambient temperature for cysteine alkylation. After dilution 4× with 50 mM TEAB, samples were digested with 0.2 µg Trypsin/LysC mix (Promega) for 3 h at 37°C, and then desalted on a C18 Sep‐Pak plate (Waters).
Mass spectrometry analyses
After digestion, the extracted peptides were analyzed either on a hybrid LTQ Orbitrap Velos (for the shotgun analysis), an Orbitrap Fusion Tribrid (for the atg18 protein analysis) or a QExactive Plus (for the complex analyses) mass spectrometer (Thermo Fisher Scientific, Bremen, Germany) interfaced to an Ultimate 3000 RSLC nano HPLC system (Dionex, Sunnyvale, CA, USA). Solvents used for the mobile phase were 97:3 H2O:acetonitrile (v/v) with 0.1% formic acid (A) and 20:80 H2O:acetonitrile (v/v) with 0.1% formic acid (B).
Peptides were loaded onto a trapping microcolumn Acclaim PepMap100 C18 (20 mm × 100 μm ID, 5 μm, 100 Å, Thermo Scientific) before separation on a reversed‐phase custom packed nanocolumn (Velos and Fusion, 75 μm ID × 40 cm, 1.8 μm particles, Reprosil Pur, Dr. Maisch) or an Easy Spray C18 PepMap nanocolumn (QExactive, 50 cm × 75 µm ID, 2 µm, 100 Å, Dionex). A flowrate of 0.3 μl/min was used with a gradient from 4 to 76% acetonitrile in 0.1% formic acid, with a total method time of 95 (Velos), 65 min (Fusion) or 140 min (QExactive).
In Velos instrument, full survey scans were performed at a 60,000 resolution (at m/z 400). In data‐dependent acquisition controlled by Xcalibur software (Thermo Fisher Scientific), the 10 most intense precursor ions detected in the full MS survey performed in the Orbitrap (range 350–1,500 m/z) were selected and fragmented. MS/MS was triggered by a minimum signal threshold of 3,000 counts, carried out at relative collision energy of 35% and with isolation width of 4.0 amu. Only precursors with a charge higher than one were selected for CID fragmentation and fragment ions were analyzed in the ion trap. The m/z of fragmented precursors was then dynamically excluded from any selection during 30 s.
In Fusion mass spectrometer, full survey scans (range 350–1,550 m/z) were performed at a 120,000 resolution (at m/z 200), and a top speed precursor selection strategy was applied by Xcalibur software to maximize acquisition of peptide tandem MS spectra with a maximum cycle time of 3.0 s. MS/MS was triggered by a minimum signal threshold of 5,000 counts. HCD fragmentation mode was used at a normalized collision energy of 32%, with a precursor isolation window of 1.6 m/z. Only precursors with a charge between 2 and 6 were selected for fragmentation and MS/MS spectra were acquired in the ion trap. Peptides selected for MS/MS were excluded from further fragmentation during 60 s.
In QExactive instrument, full MS survey scans were performed at 70,000 resolution (at m/z 200). In data‐dependent acquisition controlled by Xcalibur software, the 10 most intense multiply charged (2–5) precursor ions detected in the full MS survey scan (range 395–2,000 m/z) were selected for higher energy collision‐induced dissociation (HCD, normalized collision energy NCE = 27%) and analysis in the orbitrap at 17,500 resolution. The window for precursor isolation was of 1.5 m/z units around the precursor, and selected fragments were excluded for 60s from further analysis.
Data analysis
The SILAC triplex data were processed by the MaxQuant software (version 1.5.1.2) (Cox & Mann, 2008) incorporating the Andromeda search engine (Cox et al, 2011). A UniProt yeast (Saccharomyces cerevisiae, strain ATCC 204508 / S288c) proteome database was used (downloaded in October 2014, 6,674 sequences), supplemented with sequences of common contaminants. Trypsin (cleavage at K,R) was used as the enzyme definition, allowing 2 missed cleavages.
For Velos data, carbamidomethylation of cysteine was specified as a fixed modification. N‐terminal acetylation of protein, oxidation of methionine and phosphorylation of serine, threonine, and tyrosine were specified as variable modifications. For Fusion data, methylthiolation of cysteine was specified as a fixed modification. N‐terminal acetylation of protein, oxidation of methionine and phosphorylation of serine, threonine and tyrosine were specified as variable modifications. All identifications were filtered at 1% FDR at both the peptide and protein levels with default MaxQuant parameters. MaxQuant data were further processed with Perseus software (Tyanova et al, 2016).
The QExactive data were searched with Mascot 2.6 (Matrix Science, London, UK) software using a Saccharomyces cerevisiae (strain ATCC 204508 / S288c) reference proteome from UniProt (www.uniprot.org, February 2017 version: 6,049 sequences) as database. Trypsin (cleavage at K,R) was used as the enzyme definition, allowing 2 missed cleavages. Mascot was searched with a parent ion tolerance of 10 ppm and a fragment ion mass tolerance of 0.02 Da. Iodoacetamide derivative of cysteine was specified as a fixed modification. N‐terminal acetylation of protein and oxidation of methionine were specified as variable modifications.
Scaffold software (version 4.8.7, Proteome Software Inc., Portland, OR) was used to validate MS/MS based peptide and protein identifications, and to perform dataset alignment. Peptide identifications were accepted if they could be established at > 90.0% probability by the Scaffold Local FDR algorithm. Protein identifications were accepted if they could be established at > 95.0% probability, assigned by the Protein Prophet algorithm (Nesvizhskii et al, 2003), and contained at least 2 identified peptides. Proteins that contained similar peptides and could not be differentiated based on MS/MS analysis alone were grouped to satisfy the principles of parsimony. Proteins sharing significant peptide evidence were grouped into clusters.
Mass spectrometry proteomics data were deposited to the ProteomeXchange Consortium via the PRIDE partner repository with the dataset identifier PXD031244 (www.proteomexchange.org).
Retromer co‐immunoadsorption
To pull down retromer, 50‐ml cultures in SC‐URA with 2% D‐Glucose were inoculated from a stationary 24‐h pre‐culture in the same medium in and grown overnight to logarithmic phase (OD600 nm of 0.5–1). Cells were spun in 50‐ml falcon tubes in a precooled centrifuge (3,000 g / 5 min / 4°C). From this step, all manipulations were performed on ice or in the cold room. Pellets were resuspended in 1 ml ice‐cold TGN lysis buffer (50 mM Tris pH 7.4, 10% glycerol, 100 mM NaCl) supplemented with 0.5% Triton X‐100, containing complete protease inhibitor tablets 1× (Roche), phosphatase inhibitor tablets 1× (Roche), 1 mM DTT, and 1 mM PMSF, and transferred to 2‐ml Eppendorf tubes (round bottom). Cells were pelleted on a bench‐top centrifuge at 800 g for 3 min (Microfuge 16—Beckmann Coulter). After discarding supernatants, cells were resuspended with 200 µl of lysis buffer and 100 μl of acid‐washed glass beads (Sigma‐Aldrich). Tubes were vigorously shaken for 10 min on an IKA Vibrax shaker (IKA, Staufen, Germany). After a quick spin, 200 µl of cold TGN lysis buffer was added to the lysate and the lysate was removed from glass beads using a 200‐µl pipette tips to avoid transferring glass beads to the new 1.5 ml Eppendorf tube. The lysate was spun for 10 min at 10,000 g on a cold bench‐top centrifuge. Clear lysates were carefully recovered, without touching pellets, and transferred to new 1.5‐ml Eppendorf tubes. Protein concentration was assayed in a Nanodrop1000 (Thermo Fisher Scientific) at 280 nm. Protein concentrations were equilibrated between samples by diluting with cold TGN lysis buffer, resulting in 500 µl of lysates (~10 mg protein), of which 30 µl was kept as “Input” controls, and 470 µl was incubated with 20 µl pre‐rinsed (with lysis buffer) RFP‐Trap magnetic beads (Chromotek). After a 1‐h incubation on a rotating wheel, beads were pelleted using a magnetic separation rack. Beads were washed three times with TGN lysis buffer and transferred to a new Eppendorf tube. After discarding the supernatant, 20 µl of deionized water and 20 µl of NuPAGE 4× (Thermo Fisher) supplemented with 100 mM of DTT were added to the beads. Inputs and eluates were denatured at 90°C for 10 min. After denaturing, beads were pelleted with a magnetic rack and supernatants were transferred to a new Eppendorf tube to form the “IP” samples. Inputs and IP were loaded on 10% SDS–polyacrylamide gels.
SDS–PAGE and Western blotting
Lysates and eluates from Immunoprecipitations were run on 10% acrylamide gels for SDS–PAGE, freshly prepared and used the same day: 10% Protogel (30% w/v acrylamide, 0.8% bis‐acrylamide (37.5:1 solution, National diagnostics, Atlanta, USA), 380 mM Tris–HCl pH 8.8, 0.1% w/v SDS (Applichem, Darmstadt, Germany), 0.06% v/v TEMED (Applichem), 0.06% w/v APS (Applichem) for the running gel and 5% Protogel, 165 mM Tris–HCl pH 6.8, 0.1% w/v SDS, 0.08% v/v TEMED, 0.04% w/v APS for the stacking gel. Running buffer for SDS–PAGE was 190 mM glycine (Applichem), 25 mM Tris‐base (Applichem), 0.5% SDS. To facilitate Atg18 migration and avoid formation of aggregates, samples were reduced and denatured at 90°C using NuPAGE buffer (Thermo Fisher) containing LDS instead of SDS and supplemented with 100 mM DTT. Gels were blotted on 0.45 µm nitrocellulose membrane (Amersham) overnight at a constant current of 200 mA using a Trans‐Blot® Cell (Bio‐Rad, USA). Membranes were decorated using anti‐mCherry‐1C51 (Abcam), anti‐HA.11‐16B12 (BioLegend), anti‐G6PDH (Sigma‐Aldrich), anti‐Tubulin (clone B5‐1‐2, Sigma‐Aldrich), and anti‐WIPI1 (C‐terminal epitope, Sigma‐Aldrich).
Native gel electrophoresis
For native gel electrophoresis, purified proteins were mixed, incubated at 25°C for 30 min, supplemented with loading buffer (50 mM Bis‐Tris pH 7.2, 6 N HCl, 50 mM NaCl, 10% w/v glycerol) and incubated for further 10 min. Then, samples were loaded on precast Bis‐Tris polyacrylamide 4–16% gradient gels (Thermo Fisher Scientific). Electrophoresis buffers contained 50 mM Bis‐Tris, 50 mM Tricine pH 6.8 and were applied to anode buffer reservoirs. Cathode reservoirs were supplemented in addition with 0.002% Coomassie G‐250. Electrophoresis was carried out at 4°C for 90 min at a constant voltage of 150 V. Then, voltage was increased to 250 V for 60 min. Gels were Western blotted overnight with constant current of 200 mA using a Trans‐Blot® Cell (Bio‐Rad, USA). Membranes were destained from residual Coomassie traces by washes in methanol for several minutes, before blocking and antibody decoration.
Atg18‐CSC dissociation constant
The dissociation constant of CROP was determined by measuring the fluorescence intensity of a GFP coupled to Vps29. We noticed that the fluorescence emission of CSC‐GFP at 525 nm (excitation at 488 nm) increased significantly upon incubation with Atg18. This gain in signal was used to follow the binding event. Pure recombinant Atg18 was titrated from 0 to 75 µM by serial 1:1 dilution in PBS and supplemented with 2.5 nM of CSC‐GFP, giving a final volume of 100 µl. After incubation at 30°C during 30 min, fluorescence was measured in microtiter plates using a SpectraMax Gemini EM spectrofluorometer (excitation 488 nm, emission 525 nm, cutoff 520 nm). Experiments were repeated three times. K d was determined using nonlinear regression curve fitting (One site‐total) in GraphPad Prism9.
Live microscopy and vacuole fragmentation
Live‐cell imaging, FM4‐64 staining, and fragmentation assay
Cells were inoculated from a stationary pre‐culture (SC‐URA or YP) supplemented with 2% D‐glucose and grown overnight to logarithmic phase (OD600 nm between 0.5 and 1). After dilution to OD600 = 0.5 in 1 ml culture, 10 μM FM4‐64 was added from a 10 mM stock in DMSO. Cells were incubated (1 h, 30°C, 180 rpm), followed by three washing steps with medium without FM4‐64 (2 min, 3,000 g) and a chase of 1 h in medium without FM4‐64. For induction of vacuole fragmentation, NaCl was added to the media to a final concentration of 0.4 M and cells were imaged at 0, 15, and 30 min after its addition. Cells were removed from the shaker, concentrated by a brief low‐speed centrifugation, placed on a glass microscopy slide and imaged immediately. Z‐stacks with a spacing of 0.3 µm were recorded on a NIKON Ti2E Yokogawa spinning disk confocal microscope with a 100× 1.49 NA objective and Photometrics Prime BSI cameras. Image analysis was performed with ImageJ.
Liposome preparation and microscope imaging
Lipids were purchased from Avanti Polar Lipids (USA): Egg L‐a‐phosphatidylcholine (EggPC); 1,2‐dioleoyl‐sn‐glycero‐3‐phospho‐L‐serine sodium salt (PS); 1,2‐dioleoyl‐sn‐glycero‐3‐phospho‐(1′‐myo‐inositol‐3′‐phosphate) (PI3P); 1,2‐dioleoyl‐sn‐glycero‐3‐phospho‐(1′‐myo‐inositol‐3′,5′‐bisphosphate) (P(3,5)P2, 1,2‐dioleoyl‐sn‐glycero‐3‐phosphoethanolamine‐N‐(Cyanine 5.5) (Cy5.5‐PE), and porcine brain polar lipid extract (PL). All lipids were dissolved in chloroform and phosphatidylinositol phosphates were dissolved in chloroform/methanol/water (20:10:1).
Small unilamellar vesicles (SUVs) contained phospholipids in the following ratios: 89.5% PL + 5% PI3P + 5% PI(3,5)P2 supplemented with 0.5% Cy5.5‐PE. SUVs were prepared as described (Baskaran et al, 2012). Lipids from stock solutions were diluted in chloroform in a glass tube and the solvent evaporated under argon flux while gently vortexing the tube. Tubes were dried at 55°C in vacuum for 1 h in order to remove traces of solvents. Retromer SUV buffer (20 mM HEPES pH 6.8, 50 mM KAc, 130 mM Sucrose, 10 µM ZnCl2) was added (final lipid concentration 5 mg/ml), and the tubes were placed in an oven at 37°C to hydrate the lipid film for 1 h. After vortexing, lipids were transferred to an Eppendorf tube and frozen and thawed three times using liquid nitrogen. SUVs were prepared on the day of experiment or kept at −20°C and used within a week. SUVs were incubated with purified CSC‐GFP (1.5 µM) for 10 min at room temperature (25°C) alone or in addition with recombinant Atg18WT, Atg18FGGG, or Atg18T56E (1.5 µM). The suspension was spun for 10 min at 10,000 g in a bench‐top centrifuge and the supernatants and pellets were analyzed by SDS–PAGE and Coomassie staining.
Giant Unilamellar Vesicles (GUVs) were made with the following lipid composition: 89.5% PC, 5% PS, 2.5% PI3P, 2.5% PI(3,5)P2), supplemented with 0.5% Cy5.5‐PE. To prepare GUVs, we followed the electro‐formation method (Angelova et al, 1992). Freshly prepared lipid mix in chloroform was deposited on indium‐titan oxide glass slides and dried for 1 h at 55°C to evaporate all solvents in a vacuum oven. After mounting a chamber from 2 glass slides and an O‐ring filled with a 250 mM saccharose solution, GUVs were electro‐formed at 1 V and 10 Hz for 60 min at 55°C. GUV solution was removed from the chamber by careful pipetting with a cut tip and placed in a 1.5‐ml siliconized microcentrifuge tube. To purify the GUVs and remove excess lipids, GUVs from two chambers were pooled and an equivalent volume of retromer GUV buffer (20 mM HEPES pH 6.8, 115 mM KAc, 10 µM ZnCl2) was added to facilitate sedimentation in an Eppendorf swing bucket rotor for microcentrifuges (200 g / 5min / RT). The supernatant was removed without touching the GUV pellet (~50 µl). After washing a second time with the retromer GUV buffer, the supernatant was removed, and GUVs were resuspended in 150 µl of retromer GUV buffer. GUVs were used immediately for imaging.
For imaging, 10 μl of GUV suspension was added to 50 μl of retromer GUV buffer containing Atg18 protein at 25 nM concentration in a 96‐well clear bottom plate (Greiner Bio‐One, Thermo Fisher Scientific) pre‐coated with solution of BSA dissolved in water (1 mg/ml) for 30 min. GUVs were left to sediment for 30 min. Imaging was done with a NIKON Ti2E spinning disk confocal microscope. Large image acquisition was generated by automatically stitching 5 × 5 fields from multiple adjacent frames. A minimum of 5 acquisitions were performed in different regions of the well. Picture analysis was performed with ImageJ.
Mammalian cell experiments
All chemical reagents were from Sigma‐Aldrich unless otherwise specified. Other reagents: Opti‐MEM and Trypsin (Gibco® by Life Technologies); Alexa Fluor®568‐conjugated Transferrin from Human Serum (Thermo Fisher Scientific).
Cell culture, transfection and treatments
HK2 cells (ATCC® CRL‐2190™) were grown in DMEM‐HAM’s F12 (GIBCO‐Life Technologies); supplemented with 5% fetal calf serum, 50 IU/ml penicillin, 50 mg/ml streptomycin, 5 μg/ml insulin, 5 μg/ml transferrin, 5 ng/ml selenium (LuBio Science). Cells were grown at 37°C in 5% CO2 and at 98% humidity. Media, serum and reagents for tissue culture were purchased from GIBCO (Invitrogen).
HK2 cells were transfected with different plasmids using X‐tremeGENE HP DNA transfection reagent (Sigma‐Aldrich) according to the manufacturer's instructions and incubated for 18–24 h before fixation or live‐cell imaging. The HK‐2 cell line was checked for mycoplasma contamination by a PCR‐based method. All cell‐based experiments were repeated at least three times.
Generation of cell lines and RNA interference
HK2 WIPI1‐KO cells were produced by using the CRISPR/Cas9 system as described (DeLeo et al, 2021).
Lentiviral particle production and infection were performed as described (Dull et al, 1998). Stable HK2 cell lines expressing WIPI1‐HA were generated by lentiviral transduction. WIPI1 was cloned into the pLKO.1 lentiviral vector between Pst1 and EcoR1 restriction sites. To obtain WIPI1‐HA a sequence of 3Gly ‐ 1Ser ‐ 3Gly ‐ 1Ser ‐ HA ‐ HA (designed and purchased from GeneScript) was added using Gibson assembly according to the manufacturer’s protocol. Finally, the lentiviral plasmid DNA was purified and sequenced. Lentiviral transfer vector together with third generation envelope and packaging plasmids were transfected into 293T cells to generate lentivirus. Packaged lentivirus containing supernatant was added to recipient HK2 cells in the presence of 10 μg/ml Polybrene (AL‐118, Sigma‐Aldrich). HK2 cells were stably infected with a lentiviral vector for constitutive WIPI1‐HA expression for 4 h; 2 days after infection, cells were selected with 1 µg/ml of puromycin for 3 days. Protein samples were collected and used for IP experiments 5 days after infection.
For RNA interference, HK2 cells were transfected with siRNA for 72 h using Lipofectamine RNAiMax (Thermo Fisher Scientific) according to the manufacturer's instructions. The siRNA targeting VPS35 was from Sigma (5′ CTGGACATATTTATCAATATA 3′; 3′ TATATTGATAAATATGTCCAG 5′). It was used at 20 nM final concentration. Control cells were treated with identical concentrations of siGENOME Control Pool Non‐Targeting from Dharmacon (D‐001206‐13‐05).
Transferrin recycling
Experiments were performed as described (DeLeo et al, 2021). HK2 cells were serum‐starved for 1 h at 37°C, washed twice in cold PBS with 1% BSA, and then exposed to 100 μg/ml AlexaFluor‐488‐Tf for 1 h at 37°C (LOAD). After extensive washing with complete fresh HEPES‐buffered serum‐free medium, the recycling of Tf was followed by incubating the cells in Tf‐free complete medium (CHASE) for 1 h at 37°C. The cells were acid‐washed (150 mM NaCl, 10 mM acetic acid, pH 3.5) before fixation.
Immunostaining
HK2 cells were grown to 70% confluence on glass coverslips before immunofluorescence microscopy was performed. Cells were fixed for 8 min in 0.2% glutaraldehyde and 2% paraformaldehyde in PBS. This condition favors preservation of tubular endosomal structures although not to the extent seen by live microscopy. After fixation, cells were permeabilized in 0.05% (w:v) saponin (Sigma‐Aldrich, 558255), 0.5% (w:v) BSA and 50 mM NH4Cl in PBS (blocking buffer) for 30 min at room temperature. The cells were incubated for 1 h with primary antibody in blocking buffer, washed three times in PBS, incubated for 1 h with the secondary antibody. Then, cells were washed three times in PBS, mounted with Mowiol (Sigma‐Aldrich, 475904‐M) on slides and analyzed by confocal microscopy.
We used anti‐LAMP1 (H4A3, USBiological, Life Sciences); anti‐EEA1 (Cell Signaling); anti‐Integrin β1 (TS2/16 Santa Cruz Biotechnology); anti‐Glut1 (ab15309 Abcam); anti‐c16orf62 (Thermo Fisher Scientific). As secondary antibody we used Cy3‐conjugated AffiniPure Donkey anti‐Mouse IgG H + L (Jackson Immuno Research); Cy3‐conjugated AffiniPure Donkey anti‐Rabbit IgG H + L (Jackson Immuno Research); Alexa Fluor®488‐conjugated AffiniPure Donkey anti‐Rabbit IgG H + L (Jackson Immuno Research).
Confocal fluorescence microscopy and image processing
Confocal microscopy was performed on an inverted confocal laser microscope (Zeiss LSM 880 with airyscan) with a 63× 1.4 NA oil immersion lens. Z‐stack Images were acquired on a Zeiss LSM880 microscope with Airyscan. Tf‐fluorescence was quantified in CTR and WIPI1‐KO cells using ImageJ. z‐stacks were compressed into a single plane using the “maximum intensity Z‐projection” function in ImageJ. Individual cells were selected using the freeform drawing tool to create a ROI (ROI). The “Measure” function provided the area, the mean gray value, and integrated intensity of the ROI. The mean background level was obtained by measuring the intensity in three different regions outside the cells, dividing them by the area of the regions measured, and averaging the values obtained. This background noise was removed from each cell, yielding the CTCF (corrected total cell fluorescence): CTCF = integrated intensity of cell ROI − (area of ROI × mean fluorescence of background).
To quantify the degree of colocalization confocal z‐stacks were acquired, single channels from each image in 8‐bit format were thresholded to subtract background, and then the “Just Another Colocalization Plug‐in” (JACOP) of ImageJ was used to measure the Manders’ colocalization coefficient. Manders’ coefficient indicates an overlap of the signals and represents the degree of colocalization:
where S1 represents signal intensity of pixels in the channel 1 and S2 represents signal intensity of pixels in the channel 2. The colocalization coefficients M1 and M2 describe contribution of each channel to the pixels. They are not dependent on the intensity of the overlapping pixels, but they are sensitive to background, so a threshold must be set (Manders et al, 2011). For example, if the red‐green pair of channels is selected and M1 and M2 are 1.0 and 0.2, respectively, this means that all red pixels colocalize with green pixels, but only 20% of green pixels colocalize with red ones. In the GLUT1/EEA1 colocalization M2 indicates the fraction of GLUT1 overlapping with EEA1, while in the WIPI1mcherry/Vps26EGFP or WIPI1mcherry/Vps35EGFP M2 indicates the fraction of WIPI1 overlapping with Vps35 or Vps26.
To measure the levels of colocalization of WIPI1 and retromer components (Vps35 and Vps26) on tubules we used also an approach based on the detection of signal edges by through the “Canny or Sobel filters” Plug‐in for ImageJ (Canny, 1986). The surrounded fields were filled to generate binary masks. In this way, we were able to select tubules in order to separate signal from background, but also to determine a common region for analyzing both channels (i.e., red for WIPI1 and green for retromer components). These masked images were then subjected to thresholding as described above and the levels of colocalization were evaluated with ImageJ JACOP Plug‐in by calculating Manders’ coefficient.
Confocal microscopy was performed on an inverted confocal laser microscope (Zeiss LSM 880 with airyscan) with a 63x 1.4 NA oil immersion lens unless stated otherwise.
Pulldown of CROP from mammalian cells
HK2 cells expressing WIPI1‐HA protein were grown to 80% confluence in 15 cm dishes. After rinsing three times cells with phosphate‐buffered saline (PBS), they were detached and lysed by incubating 15 min at 4°C with lysis buffer: 150 mM NaCl, 2 mM EDTA, 40 mM HEPES, 1% Triton X‐100, supplemented with phosphatase and protease inhibitor cocktails (Roche #05892970001) and 1 mM PMSF out of a 200 mM solution in ethanol, which was freshly prepared immediately before use. The lysate was spun for 10 min at 10,000 g on a cold bench‐top centrifuge. Clarified extracts were incubated during 1 h at 4°C with anti‐HA magnetic beads (Pierce #88836), using a 10‐µl beads per 15 cm dish. Then, beads were washed twice with lysis buffer using a magnetic rack and transferred in a new Eppendorf tube during a third wash with IP buffer: 20 mM MOPS, 50 mM KCl, 10 µM ZnCl2, 0.5% saponin, and 50 nM recombinant purified mammalian retromer (Kendall et al, 2020). 5% of the mix was reserved as “input”. Beads were incubated for 90 min at 37°C with gentle agitation, washed three times using IP buffer without inhibitors (10 min at 4°C on a rotating wheel). After discarding the last wash, all samples were resuspended in 20 µl of deionized water, transferred to new Eppendorf tubes 20 μl NuPAGE 4× (Thermo Fisher) containing 100 mM of DTT were added. Samples were kept at 90°C for 10 min and beads were pelleted with a magnetic rack. All supernatants were transferred to a new Eppendorf tube yielding the “IP” samples. Inputs and IP were loaded on 10% SDS–polyacrylamide gels.
Gel electrophoresis and Western blot
HK2 cells were plated into 12‐well tissue culture test plates (TPP) until they reached 80–90% confluency, except for Vps35KD‐cells, which were cultured until 72 h after transfection with the siRNAs. Cells were washed three times with ice‐cold PBS (phosphate‐buffered saline), scraped, and proteins were extracted in ice‐cold lysis buffer (150 mM NaCl, 2 mM EDTA, 40 mM HEPES, and 1% Triton X‐100 pH 7.4) supplemented with phosphatase and protease inhibitor cocktail (final concentrations: 40 μM pefabloc SC (Merck, 11,429,876,001), 2.1 μM leupeptin (Merck,v11,529,048,001), 80 μM o‐phenanthroline (Merck,131,377), 1.5 μM pepstatin A (Merck, 11,524,488,001). Protein extracts were supplemented with 1/4 volume of 5× reducing sample buffer (250 mM Tris–Cl, pH 6.8, 5% β‐mercaptoethanol, 10% SDS, 30% glycerol, 0.02% bromophenol blue) and heated to 95°C for 5 min. The samples were run on either 8% or 10% SDS–polyacrylamide gels (W × L × H: 8.6 × 6.8 × 0.15 cm). The stacking gels were prepared as follows: 6% acrylamide, 0.16% bis‐acrylamide, 0.1 M Tris, pH 6.8, 0.1% SDS, 0.1% TEMED, 0.05% ammonium persulfate. Running gels were: 8 or 10% acrylamide, 0.8% bis‐acrylamide, 0.38 M Tris, pH 8.8, 0.1% SDS (Applichem, 475904‐M), 0.06% TEMED (Applichem, A1148), 0.06% APS (Applichem, A2941). The gels were run at constant current (35 mA). Proteins were blotted onto nitrocellulose membrane by the semi‐dry method for 45 min at 400 mA (Trans‐Blot® SD Semi‐Dry Electrophoretic Transfer Cell, Bio‐Rad). After incubation with the primary antibody, signals were detected by secondary antibodies coupled to infrared dyes (LICOR) and detected on a LICOR Odyssey Infrared Imager. Images were exported as TIFF files and processed in Adobe Photoshop. Band intensity was quantified using ImageJ band analysis (Schneider et al, 2012).
Statistics
Where averages were calculated, the values stemmed from experiments that were performed independently. Significance of differences was tested by a two‐tailed t‐test.
Author contributions
Thibault Courtellement: Formal analysis; Investigation; Methodology; Writing—original draft; Writing—review & editing. Maria Giovanna De Leo: Formal analysis; Investigation; Methodology. Navin Gopaldass: Supervision; Methodology. Andreas Mayer: Conceptualization; Supervision; Funding acquisition; Writing—original draft; Project administration; Writing—review & editing.
In addition to the CRediT author contributions listed above, the contributions in detail are:
TC and NG performed Atg18 interaction studies and yeast experiments. Liposome experiments were performed by TC. Their establishment and analysis were supported by NG. MGDL performed experiments with mammalian cells. AM conceived the study. All authors analyzed data and jointly wrote the manuscript.
Disclosure and competing interests statement
The authors declare that they have no conflict of interest.
Supporting information
Appendix
Expanded View Figures PDF
Acknowledgements
We thank Véronique Comte‐Misérez for assistance in protein purification, Manfredo Quadroni and Patrice Waridel from the UNIL proteomics facility for MS analyses of the SILAC experiment and of the CSC preparation, Luciano Abriata, and Florence Pojer from the EPFL Protein Production and Structure Core Facility for help with CD experiments, C. Ungermann for strains expressing CSC and SNX, and L. Jackson for strains expressing mammalian retromer. This work was supported by grants from the SNSF (179306 and 204713) and from the ERC (788442) to AM.
The EMBO Journal (2022) 41: e109646.
Data availability
Mass spectrometry proteomics data were deposited to the ProteomeXchange Consortium via the PRIDE partner repository with the dataset identifier PXD031244 (http://proteomecentral.proteomexchange.org/cgi/GetDataset?ID=PXD031244).
References
- Alpadi K, Kulkarni A, Namjoshi S, Srinivasan S, Sippel KH, Ayscough K, Zieger M, Schmidt A, Mayer A, Evangelista M et al (2013) Dynamin‐SNARE interactions control trans‐SNARE formation in intracellular membrane fusion. Nat Commun 4: 1704 [DOI] [PMC free article] [PubMed] [Google Scholar]
- Angelova MI, Soleau S, Méléard P, Faucon F, Bothorel P (1992) Preparation of giant vesicles by external AC electric fields. Kinetics and applications. Prog Colloid Polym Sci 89: 127–131 [Google Scholar]
- Antonny B, Burd C, De Camilli P, Chen E, Daumke O, Faelber K, Ford M, Frolov VA, Frost A, Hinshaw JE et al (2016) Membrane fission by dynamin: what we know and what we need to know. EMBO J 35: 2270–2284 [DOI] [PMC free article] [PubMed] [Google Scholar]
- Arlt H, Reggiori F, Ungermann C (2015) Retromer and the dynamin Vps1 cooperate in the retrieval of transmembrane proteins from vacuoles. J Cell Sci 128: 645–655 [DOI] [PubMed] [Google Scholar]
- Baars TL, Petri S, Peters C, Mayer A (2007) Role of the V‐ATPase in regulation of the vacuolar fission‐fusion equilibrium. Mol Biol Cell 18: 3873–3882 [DOI] [PMC free article] [PubMed] [Google Scholar]
- Bakula D, Müller AJ, Zuleger T, Takacs Z, Franz‐Wachtel M, Thost A‐K, Brigger D, Tschan MP, Frickey T, Robenek H et al (2017) WIPI3 and WIPI4 β‐propellers are scaffolds for LKB1‐AMPK‐TSC signalling circuits in the control of autophagy. Nat Commun 8: 15637 [DOI] [PMC free article] [PubMed] [Google Scholar]
- Balderhaar HJK, Arlt H, Ostrowicz C, Bröcker C, Sündermann F, Brandt R, Babst M, Ungermann C (2010) The Rab GTPase Ypt7 is linked to retromer‐mediated receptor recycling and fusion at the yeast late endosome. J Cell Sci 123: 4085–4094 [DOI] [PubMed] [Google Scholar]
- Bar‐Ziv R, Tlusty T, Moses E, Safran SA, Bershadsky A (1999) Pearling in cells: a clue to understanding cell shape. Proc Natl Acad Sci USA 96: 10140–10145 [DOI] [PMC free article] [PubMed] [Google Scholar]
- Baskaran S, Ragusa MJ, Boura E, Hurley JH (2012) Two‐site recognition of phosphatidylinositol 3‐phosphate by PROPPINs in autophagy. Mol Cell 47: 339–348 [DOI] [PMC free article] [PubMed] [Google Scholar]
- Bonangelino CJ, Nau JJ, Duex JE, Brinkman M, Wurmser AE, Gary JD, Emr SD, Weisman LS (2002) Osmotic stress‐induced increase of phosphatidylinositol 3,5‐bisphosphate requires Vac14p, an activator of the lipid kinase Fab1p. J Cell Biol 156: 1015–1028 [DOI] [PMC free article] [PubMed] [Google Scholar]
- Boucrot E, Pick A, Camdere G, Liska N, Evergren E, McMahon HT, Kozlov MM (2012) Membrane fission is promoted by insertion of amphipathic helices and is restricted by crescent BAR domains. Cell 149: 124–136 [DOI] [PMC free article] [PubMed] [Google Scholar]
- Burda P, Padilla SM, Sarkar S, Emr SD (2002) Retromer function in endosome‐to‐Golgi retrograde transport is regulated by the yeast Vps34 PtdIns 3‐kinase. J Cell Sci 115: 3889–3900 [DOI] [PubMed] [Google Scholar]
- Busse RA, Scacioc A, Hernandez JM, Krick R, Stephan M, Janshoff A, Thumm M, Kühnel K (2013) Qualitative and quantitative characterization of protein‐phosphoinositide interactions with liposome‐based methods. Autophagy 9: 79–78 [DOI] [PMC free article] [PubMed] [Google Scholar]
- Busse RA, Scacioc A, Krick R, Pérez‐Lara A, Thumm M, Kühnel K (2015) Characterization of PROPPIN‐phosphoinositide binding and role of loop 6CD in PROPPIN‐membrane binding. Biophys J 108: 2223–2234 [DOI] [PMC free article] [PubMed] [Google Scholar]
- Campelo F, McMahon HT, Kozlov MM (2008) The hydrophobic insertion mechanism of membrane curvature generation by proteins. Biophys J 95: 2325–2339 [DOI] [PMC free article] [PubMed] [Google Scholar]
- Canny J (1986) A computational approach to edge detection. IEEE Trans Pattern Anal Mach Intell 8: 679–698 [PubMed] [Google Scholar]
- Chen K‐E, Healy MD, Collins BM (2019) Towards a molecular understanding of endosomal trafficking by Retromer and Retriever. Traffic 20: 465–478 [DOI] [PubMed] [Google Scholar]
- Chi RJ, Liu J, West M, Wang J, Odorizzi G, Burd CG (2014) Fission of SNX‐BAR‐coated endosomal retrograde transport carriers is promoted by the dynamin‐related protein Vps1. J Cell Biol 204: 793–806 [DOI] [PMC free article] [PubMed] [Google Scholar]
- Chowdhury S, Otomo C, Leitner A, Ohashi K, Aebersold R, Lander GC, Otomo T (2018) Insights into autophagosome biogenesis from structural and biochemical analyses of the ATG2A‐WIPI4 complex. Proc Natl Acad Sci USA 58: 201811874 [DOI] [PMC free article] [PubMed] [Google Scholar]
- Collins BM, Norwood SJ, Kerr MC, Mahony D, Seaman MNJ, Teasdale RD, Owen DJ (2008) Structure of Vps26B and mapping of its interaction with the retromer protein complex. Traffic 9: 366–379 [DOI] [PubMed] [Google Scholar]
- Collins BM, Skinner CF, Watson PJ, Seaman MNJ, Owen DJ (2005) Vps29 has a phosphoesterase fold that acts as a protein interaction scaffold for retromer assembly. Nat Struct Mol Biol 12: 594–602 [DOI] [PubMed] [Google Scholar]
- Cooke FT, Dove SK, McEwen RK, Painter G, Holmes AB, Hall MN, Michell RH, Parker PJ (1998) The stress‐activated phosphatidylinositol 3‐phosphate 5‐kinase Fab1p is essential for vacuole function in S. cerevisiae . Curr Biol 8: 1219–1222 [DOI] [PubMed] [Google Scholar]
- Cox J, Mann M (2008) MaxQuant enables high peptide identification rates, individualized p.p.b.‐range mass accuracies and proteome‐wide protein quantification. Nat Biotechnol 26: 1367–1372 [DOI] [PubMed] [Google Scholar]
- Cullen PJ, Steinberg F (2018) To degrade or not to degrade: mechanisms and significance of endocytic recycling. Nat Rev Mol Cell Biol 19: 679–696 [DOI] [PubMed] [Google Scholar]
- Daumke O, Lundmark R, Vallis Y, Martens S, Butler PJG, McMahon HT (2007) Architectural and mechanistic insights into an EHD ATPase involved in membrane remodelling. Nature 449: 923–927 [DOI] [PubMed] [Google Scholar]
- Dautry‐Varsat A, Ciechanover A, Lodish HF (1983) pH and the recycling of transferrin during receptor‐mediated endocytosis. Proc Natl Acad Sci USA 80: 2258–2262 [DOI] [PMC free article] [PubMed] [Google Scholar]
- Day KJ, Casler JC, Glick BS (2018) Budding yeast has a minimal endomembrane system. Dev Cell 44: 56–72.e4 [DOI] [PMC free article] [PubMed] [Google Scholar]
- DeLeo MG, Berger P, Mayer A (2021) WIPI1 promotes fission of endosomal transport carriers and formation of autophagosomes through distinct mechanisms. Autophagy 17: 3644–3670 [DOI] [PMC free article] [PubMed] [Google Scholar]
- Deo R, Kushwah MS, Kamerkar SC, Kadam NY, Dar S, Babu K, Srivastava A, Pucadyil TJ (2018) ATP‐dependent membrane remodeling links EHD1 functions to endocytic recycling. Nat Commun 9: 5187 [DOI] [PMC free article] [PubMed] [Google Scholar]
- Derivery E, Sousa C, Gautier JJ, Lombard B, Loew D, Gautreau A (2009) The Arp2/3 activator WASH controls the fission of endosomes through a large multiprotein complex. Dev Cell 17: 712–723 [DOI] [PubMed] [Google Scholar]
- Desfougères Y, Neumann H, Mayer A (2016a) Organelle size control ‐ increasing vacuole content activates SNAREs to augment organelle volume through homotypic fusion. J Cell Sci 129: 2817–2828 [DOI] [PubMed] [Google Scholar]
- Desfougères Y, Vavassori S, Rompf M, Gerasimaite R, Mayer A (2016b) Organelle acidification negatively regulates vacuole membrane fusion in vivo . Sci Rep 6: 29045 [DOI] [PMC free article] [PubMed] [Google Scholar]
- Dooley HC, Razi M, Polson HEJ, Girardin SE, Wilson MI, Tooze SA (2014) WIPI2 links LC3 conjugation with PI3P, autophagosome formation, and pathogen clearance by recruiting Atg12‐5‐16L1. Mol Cell 55: 238–252 [DOI] [PMC free article] [PubMed] [Google Scholar]
- Dove SK, Piper RC, McEwen RK, Yu JW, King MC, Hughes DC, Thuring J, Holmes AB, Cooke FT, Michell RH et al (2004) Svp1p defines a family of phosphatidylinositol 3,5‐bisphosphate effectors. EMBO J 23: 1922–1933 [DOI] [PMC free article] [PubMed] [Google Scholar]
- Dull T, Zufferey R, Kelly M, Mandel RJ, Nguyen M, Trono D, Naldini L (1998) A third‐generation lentivirus vector with a conditional packaging system. J Virol 72: 8463–8471 [DOI] [PMC free article] [PubMed] [Google Scholar]
- Efe JA, Botelho RJ, Emr SD (2007) Atg18 regulates organelle morphology and Fab1 kinase activity independent of its membrane recruitment by phosphatidylinositol 3,5‐bisphosphate. Mol Biol Cell 18: 4232–4244 [DOI] [PMC free article] [PubMed] [Google Scholar]
- Feng W, Zhang W, Wang H, Ma L, Miao D, Liu Z, Xue Y, Deng H, Yu L (2015) Analysis of phosphorylation sites on autophagy proteins. Protein Cell 6: 698–701 [DOI] [PMC free article] [PubMed] [Google Scholar]
- Funakoshi M, Hochstrasser M (2009) Small epitope‐linker modules for PCR‐based C‐terminal tagging in Saccharomyces cerevisiae . Yeast Chichester Engl 26: 185–192 [DOI] [PMC free article] [PubMed] [Google Scholar]
- Gietz RD, Schiestl RH (2007) High‐efficiency yeast transformation using the LiAc/SS carrier DNA/PEG method. Nat Protoc 2: 31–34 [DOI] [PubMed] [Google Scholar]
- Gokool S, Tattersall D, Seaman MNJ (2007) EHD1 interacts with retromer to stabilize SNX1 tubules and facilitate endosome‐to‐Golgi retrieval. Traffic 8: 1873–1886 [DOI] [PubMed] [Google Scholar]
- Gomez TS, Billadeau DD (2009) A FAM21‐containing WASH complex regulates retromer‐dependent sorting. Dev Cell 17: 699–711 [DOI] [PMC free article] [PubMed] [Google Scholar]
- Gopaldass N, Fauvet B, Lashuel H, Roux A, Mayer A (2017) Membrane scission driven by the PROPPIN Atg18. EMBO J 36: 3274–3291 [DOI] [PMC free article] [PubMed] [Google Scholar]
- Güldener U, Heck S, Fiedler T, Beinhauer J, Hegemann JH (1996) A new efficient gene disruption cassette for repeated use in budding yeast. Nucleic Acids Res 24: 2519–2524 [DOI] [PMC free article] [PubMed] [Google Scholar]
- Harbour ME, Breusegem SY, Seaman MNJ (2012) Recruitment of the endosomal WASH complex is mediated by the extended “tail” of Fam21 binding to the retromer protein Vps35. Biochem J 442: 209–220 [DOI] [PubMed] [Google Scholar]
- Hierro A, Rojas AL, Rojas R, Murthy N, Effantin G, Kajava AV, Steven AC, Bonifacino JS, Hurley JH (2007) Functional architecture of the retromer cargo‐recognition complex. Nature 449: 1063–1067 [DOI] [PMC free article] [PubMed] [Google Scholar]
- Itakura E, Mizushima N (2010) Characterization of autophagosome formation site by a hierarchical analysis of mammalian Atg proteins. Autophagy 6: 764–776 [DOI] [PMC free article] [PubMed] [Google Scholar]
- Janke C, Magiera MM, Rathfelder N, Taxis C, Reber S, Maekawa H, Moreno‐Borchart A, Doenges G, Schwob E, Schiebel E et al (2004) A versatile toolbox for PCR‐based tagging of yeast genes: new fluorescent proteins, more markers and promoter substitution cassettes. Yeast 21: 947–962 [DOI] [PubMed] [Google Scholar]
- Jeffries TR, Dove SK, Michell RH, Parker PJ (2004) PtdIns‐specific MPR pathway association of a novel WD40 repeat protein, WIPI49. Mol Biol Cell 15: 2652–2663 [DOI] [PMC free article] [PubMed] [Google Scholar]
- Jia DA, Zhang J‐S, Li F, Wang J, Deng Z, White MA, Osborne DG, Phillips‐Krawczak C, Gomez TS, Li H et al (2016) Structural and mechanistic insights into regulation of the retromer coat by TBC1d5. Nat Commun 7: 1–11 [DOI] [PMC free article] [PubMed] [Google Scholar]
- Kendall AK, Xie B, Xu P, Wang J, Burcham R, Frazier MN, Binshtein E, Wei H, Graham TR, Nakagawa T et al (2020) Mammalian Retromer is an adaptable scaffold for cargo sorting from endosomes. Structure 28: 393–405.e4 [DOI] [PMC free article] [PubMed] [Google Scholar]
- Kovtun O, Leneva N, Bykov YS, Ariotti N, Teasdale RD, Schaffer M, Engel BD, Owen DJ, Briggs JAG, Collins BM (2018) Structure of the membrane‐assembled retromer coat determined by cryo‐electron tomography. Nature 561: 561–564 [DOI] [PMC free article] [PubMed] [Google Scholar]
- Krick R, Busse RA, Scacioc A, Stephan M, Janshoff A, Thumm M, Kühnel K (2012) Structural and functional characterization of the two phosphoinositide binding sites of PROPPINs, a β‐propeller protein family. Proc Natl Acad Sci USA 109: E2042–E2049 [DOI] [PMC free article] [PubMed] [Google Scholar]
- Lee S, Lim WA, Thorn KS (2013) Improved blue, green, and red fluorescent protein tagging vectors for S. cerevisiae . PLoS One 8: e67902 [DOI] [PMC free article] [PubMed] [Google Scholar]
- Lei Y, Tang D, Liao G, Xu L, Liu S, Chen Q, Li C, Duan J, Wang K, Wang J et al (2020) The crystal structure of Atg18 reveals a new binding site for Atg2 in Saccharomyces cerevisiae . Cell Mol Life Sci 290: 1717–1813 [DOI] [PMC free article] [PubMed] [Google Scholar]
- Leneva N, Kovtun O, Morado DR, Briggs JAG, Owen DJ (2021) Architecture and mechanism of metazoan retromer:SNX3 tubular coat assembly. Sci Adv 7: eabf8598 [DOI] [PMC free article] [PubMed] [Google Scholar]
- Li J‐G, Chiu J, Praticò D (2019) Full recovery of the Alzheimer’s disease phenotype by gain of function of vacuolar protein sorting 35. Mol Psychiatry 8: 5659 [DOI] [PMC free article] [PubMed] [Google Scholar] [Retracted]
- Liang R, Ren J, Zhang Y, Feng W (2019) Structural conservation of the two phosphoinositide‐binding sites in WIPI proteins. J Mol Biol 431: 1494–1505 [DOI] [PubMed] [Google Scholar]
- Liu T, Gomez TS, Sackey BK, Billadeau DD, Burd CG (2012) Rab GTPase regulation of retromer‐mediated cargo export during endosome maturation. Mol Biol Cell 23: 2505–2515 [DOI] [PMC free article] [PubMed] [Google Scholar]
- Lu Q, Yang P, Huang X, Hu W, Guo B, Wu F, Lin L, Kovács AL, Yu L, Zhang H (2011) The WD40 repeat PtdIns(3)P‐binding protein EPG‐6 regulates progression of omegasomes to autophagosomes. Dev Cell 21: 343–357 [DOI] [PubMed] [Google Scholar]
- Lucas M, Gershlick DC, Vidaurrazaga A, Rojas AL, Bonifacino JS, Hierro A (2016) Structural mechanism for cargo recognition by the retromer complex. Cell 167: 1623–1635.e14 [DOI] [PMC free article] [PubMed] [Google Scholar]
- Ma M, Burd CG (2019) Retrograde trafficking and plasma membrane recycling pathways of the budding yeast Saccharomyces cerevisiae . Traffic 21: 45–59. [DOI] [PubMed] [Google Scholar]
- Manders EMM, Verbeek FJ, Aten JA (2011) Measurement of co‐localization of objects in dual‐colour confocal images. J Microsc 169: 375–382 [DOI] [PubMed] [Google Scholar]
- Markin VS, Tanelian DL, Jersild RA, Ochs S (1999) Biomechanics of stretch‐induced beading. Biophys J 76: 2852–2860 [DOI] [PMC free article] [PubMed] [Google Scholar]
- McCartney AJ, Zhang Y, Weisman LS (2014) Phosphatidylinositol 3,5‐bisphosphate: low abundance, high significance. BioEssays 36: 52–64 [DOI] [PMC free article] [PubMed] [Google Scholar]
- McMillan KJ, Korswagen HC, Cullen PJ (2017) The emerging role of retromer in neuroprotection. Curr Opin Cell Biol 47: 72–82 [DOI] [PMC free article] [PubMed] [Google Scholar]
- McNally KE, Faulkner R, Steinberg F, Gallon M, Ghai R, Pim D, Langton P, Pearson N, Danson CM, Nägele H et al (2017) Retriever is a multiprotein complex for retromer‐independent endosomal cargo recycling. Nat Cell Biol 19: 1214–1225 [DOI] [PMC free article] [PubMed] [Google Scholar]
- Michaillat L, Baars TL, Mayer A (2012) Cell‐free reconstitution of vacuole membrane fragmentation reveals regulation of vacuole size and number by TORC1. Mol Biol Cell 23: 881–895 [DOI] [PMC free article] [PubMed] [Google Scholar]
- Michaillat L, Mayer A (2013) Identification of genes affecting vacuole membrane fragmentation in Saccharomyces cerevisiae . PLoS One 8: e54160 [DOI] [PMC free article] [PubMed] [Google Scholar]
- Nesvizhskii AI, Keller A, Kolker E, Aebersold R (2003) A statistical model for identifying proteins by tandem mass spectrometry. Anal Chem 75: 4646–4658 [DOI] [PubMed] [Google Scholar]
- Noda T, Klionsky DJ (2008) The quantitative Pho8Delta60 assay of nonspecific autophagy. Meth Enzymol 451: 33–42 [DOI] [PubMed] [Google Scholar]
- Noda T, Matsuura A, Wada Y, Ohsumi Y (1995) Novel system for monitoring autophagy in the yeast Saccharomyces cerevisiae . Biochem Bioph Res Commun 210: 126–132 [DOI] [PubMed] [Google Scholar]
- Obara K, Sekito T, Niimi K, Ohsumi Y (2008) The Atg18‐Atg2 complex is recruited to autophagic membranes via phosphatidylinositol 3‐phosphate and exerts an essential function. J Biol Chem 283: 23972–23980 [DOI] [PMC free article] [PubMed] [Google Scholar]
- Otomo T, Chowdhury S, Lander GC (2018) The rod‐shaped ATG2A‐WIPI4 complex tethers membranes in vitro . Contact 1: 251525641881993 [DOI] [PMC free article] [PubMed] [Google Scholar]
- Peters C, Baars TL, Buhler S, Mayer A (2004) Mutual control of membrane fission and fusion proteins. Cell 119: 667–678 [DOI] [PubMed] [Google Scholar]
- Phillips‐Krawczak CA, Singla A, Starokadomskyy P, Deng Z, Osborne DG, Li H, Dick CJ, Gomez TS, Koenecke M, Zhang J‐S et al (2015) COMMD1 is linked to the WASH complex and regulates endosomal trafficking of the copper transporter ATP7A. Mol Biol Cell 26: 91–103 [DOI] [PMC free article] [PubMed] [Google Scholar]
- Piotrowski JT, Gomez TS, Schoon RA, Mangalam AK, Billadeau DD (2013) WASH knockout T cells demonstrate defective receptor trafficking, proliferation, and effector function. Mol Cell Biol 33: 958–973 [DOI] [PMC free article] [PubMed] [Google Scholar]
- Polson HEJ, de Lartigue J, Rigden DJ, Reedijk M, Urbé S, Clague MJ, Tooze SA (2010) Mammalian Atg18 (WIPI2) localizes to omegasome‐anchored phagophores and positively regulates LC3 lipidation. Autophagy 6: 506–522 [DOI] [PubMed] [Google Scholar]
- Proikas‐Cezanne T, Takacs Z, Dönnes P, Kohlbacher O (2015) WIPI proteins: essential PtdIns3P effectors at the nascent autophagosome. J Cell Sci 128: 207–217 [DOI] [PubMed] [Google Scholar]
- Proikas‐Cezanne T, Waddell S, Gaugel A, Frickey T, Lupas A, Nordheim A (2004) WIPI‐1alpha (WIPI49), a member of the novel 7‐bladed WIPI protein family, is aberrantly expressed in human cancer and is linked to starvation‐induced autophagy. Oncogene 23: 9314–9325 [DOI] [PubMed] [Google Scholar]
- Purushothaman LK, Arlt H, Kuhlee A, Raunser S, Ungermann C (2017) Retromer‐driven membrane tubulation separates endosomal recycling from Rab7/Ypt7‐dependent fusion. Mol Biol Cell 28: 783–791 [DOI] [PMC free article] [PubMed] [Google Scholar]
- Purushothaman LK, Ungermann C (2018) Cargo induces retromer‐mediated membrane remodeling on membranes. Mol Biol Cell 29: 2709–2719 [DOI] [PMC free article] [PubMed] [Google Scholar]
- Rahman AA, Morrison BE (2019) Contributions of VPS35 mutations to Parkinson’s disease. Neuroscience 401: 1–10 [DOI] [PMC free article] [PubMed] [Google Scholar]
- Raymond CK, Howald‐Stevenson I, Vater CA, Stevens TH (1992) Morphological classification of the yeast vacuolar protein sorting mutants: evidence for a prevacuolar compartment in class E vps mutants. Mol Biol Cell 3: 1389–1402 [DOI] [PMC free article] [PubMed] [Google Scholar]
- Rieter E, Vinke F, Bakula D, Cebollero E, Ungermann C, Proikas‐Cezanne T, Reggiori F (2013) Atg18 function in autophagy is regulated by specific sites within its β‐propeller. J Cell Sci 126: 593–604 [DOI] [PubMed] [Google Scholar]
- Rojas R, van Vlijmen T, Mardones GA, Prabhu Y, Rojas AL, Mohammed S, Heck AJR, Raposo G, van der Sluijs P, Bonifacino JS (2008) Regulation of retromer recruitment to endosomes by sequential action of Rab5 and Rab7. J Cell Biol 183: 513–526 [DOI] [PMC free article] [PubMed] [Google Scholar]
- Rowland AA, Chitwood PJ, Phillips MJ, Voeltz GK (2014) ER contact sites define the position and timing of endosome fission. Cell 159: 1027–1041 [DOI] [PMC free article] [PubMed] [Google Scholar]
- Scacioc A, Schmidt C, Hofmann T, Urlaub H, Kühnel K, Pérez‐Lara A (2017) Structure based biophysical characterization of the PROPPIN Atg18 shows Atg18 oligomerization upon membrane binding. Sci Rep 7: 14008 [DOI] [PMC free article] [PubMed] [Google Scholar]
- Schneider CA, Rasband WS, Eliceiri KW (2012) NIH Image to ImageJ: 25 years of image analysis. Nat Methods 9: 671–675 [DOI] [PMC free article] [PubMed] [Google Scholar]
- Seaman MNJ (2019) Back from the brink: retrieval of membrane proteins from terminal compartments: unexpected pathways for membrane protein retrieval from vacuoles and endolysosomes. BioEssays 41: e1800146 [DOI] [PubMed] [Google Scholar]
- Seaman MNJ, Harbour ME, Tattersall D, Read E, Bright N (2009) Membrane recruitment of the cargo‐selective retromer subcomplex is catalysed by the small GTPase Rab7 and inhibited by the Rab‐GAP TBC1D5. J Cell Sci 122: 2371–2382 [DOI] [PMC free article] [PubMed] [Google Scholar]
- Seaman MN, McCaffery JM, Emr SD (1998) A membrane coat complex essential for endosome‐to‐Golgi retrograde transport in yeast. J Cell Biol 142: 665–681 [DOI] [PMC free article] [PubMed] [Google Scholar]
- Seaman MNJ, Williams HP (2002) Identification of the functional domains of yeast sorting nexins Vps5p and Vps17p. Mol Biol Cell 13: 2826–2840 [DOI] [PMC free article] [PubMed] [Google Scholar]
- Sheff MA, Thorn KS (2004) Optimized cassettes for fluorescent protein tagging in Saccharomyces cerevisiae . Yeast 21: 661–670 [DOI] [PubMed] [Google Scholar]
- Shevchenko A, Wilm M, Vorm O, Mann M (1996) Mass spectrometric sequencing of proteins silver‐stained polyacrylamide gels. Anal Chem 68: 850–858 [DOI] [PubMed] [Google Scholar]
- Simunovic M, Manneville J‐B, Renard H‐F, Evergren E, Raghunathan K, Bhatia D, Kenworthy AK, Voth GA, Prost J, McMahon HT et al (2017) Friction mediates scission of tubular membranes scaffolded by BAR proteins. Cell 170: 172–184.e11 [DOI] [PMC free article] [PubMed] [Google Scholar]
- Stanga D, Zhao Q, Milev MP, Saint‐Dic D, Jimenez‐Mallebrera C, Sacher M (2019) TRAPPC11 functions in autophagy by recruiting ATG2B‐WIPI4/WDR45 to preautophagosomal membranes. Traffic 20: 325–345 [DOI] [PubMed] [Google Scholar]
- Steinberg F, Gallon M, Winfield M, Thomas EC, Bell AJ, Heesom KJ, Tavaré JM, Cullen PJ (2013) A global analysis of SNX27–retromer assembly and cargo specificity reveals a function in glucose and metal ion transport. Nat Cell Biol 15: 461–471 [DOI] [PMC free article] [PubMed] [Google Scholar]
- Strochlic TI, Setty TG, Sitaram A, Burd CG (2007) Grd19/Snx3p functions as a cargo‐specific adapter for retromer‐dependent endocytic recycling. J Cell Biol 177: 115–125 [DOI] [PMC free article] [PubMed] [Google Scholar]
- Stromhaug PE, Reggiori F, Guan J, Wang C‐W, Klionsky DJ (2004) Atg21 is a phosphoinositide binding protein required for efficient lipidation and localization of Atg8 during uptake of aminopeptidase I by selective autophagy. Mol Biol Cell 15: 3553–3566 [DOI] [PMC free article] [PubMed] [Google Scholar]
- Tyanova S, Temu T, Sinitcyn P, Carlson A, Hein MY, Geiger T, Mann M, Cox J (2016) The Perseus computational platform for comprehensive analysis of (prote)omics data. Nat Methods 13: 731–740 [DOI] [PubMed] [Google Scholar]
- Vicinanza M, Korolchuk VI, Ashkenazi A, Puri C, Menzies FM, Clarke JH, Rubinsztein DC (2015) PI(5)P regulates autophagosome biogenesis. Mol Cell 57: 219–234 [DOI] [PMC free article] [PubMed] [Google Scholar]
- Watanabe Y, Kobayashi T, Yamamoto H, Hoshida H, Akada R, Inagaki F, Ohsumi Y, Noda NN (2012) Structure‐based analyses reveal distinct binding sites for Atg2 and phosphoinositides in Atg18. J Biol Chem 287: 31681–31690 [DOI] [PMC free article] [PubMed] [Google Scholar]
- van Weering JRT, Sessions RB, Traer CJ, Kloer DP, Bhatia VK, Stamou D, Carlsson SR, Hurley JH, Cullen PJ (2012) Molecular basis for SNX‐BAR‐mediated assembly of distinct endosomal sorting tubules. EMBO J 31: 4466–4480 [DOI] [PMC free article] [PubMed] [Google Scholar]
- Wiemken A, Matile P, Moor H (1970) Vacuolar dynamics in synchronously budding yeast. Arch Mikrobiol 70: 89–103 [DOI] [PubMed] [Google Scholar]
- Zieger M, Mayer A (2012) Yeast vacuoles fragment in an asymmetrical two‐phase process with distinct protein requirements. Mol Biol Cell 23: 3438–3449 [DOI] [PMC free article] [PubMed] [Google Scholar]