Abstract
Insulin receptor (IR) signaling controls multiple facets of animal physiology. Maximally four insulins bind to IR at two distinct sites, termed site-1 and site-2. However, the precise functional roles of each binding event during IR activation remain unresolved. Here, we showed that IR incompletely saturated with insulin predominantly forms an asymmetric conformation and exhibits partial activation. The one insulin bound IR adopts a Γ-shaped conformation. The two insulins bound IR assumes a Ƭ-shaped conformation. One insulin is bound at site-1 and another insulin simultaneously contacts both sites-1 and −2 in the Ƭ-shaped IR dimer. We further demonstrated that the concurrent binding of four insulins to sites-1 and −2 prevents the formation of asymmetric IR and promotes the T-shaped symmetric, fully active state. Collectively, our results demonstrate how the synergistic binding of multiple insulins promotes optimal IR activation.
Introduction
Insulin activates insulin receptor (IR) at the cell surface1,2. The activated IR initiates downstream signaling to control metabolism and cell growth1,3,4. Impairment of IR signaling causes metabolic disorders and severe insulin resistance syndromes5,6. Each IR protomer consists of L1, CR, L2, FnIII-1, FnIII-2 and FnIII-3 domains in the extracellular region, and transmembrane and kinase domains in the intracellular region7-9 (Extended Data Fig. 1a). The crystal structure of the insulin-free IR (apo-IR) shows a Λ-shaped conformation, with the two membrane-proximal FnIII-3 domains separated by ~120Å10. The physical separation of two FnIII-3 domains in the apo-IR prevents trans-autophosphorylation, indicating that Λ-shaped IR is in an auto-inhibited conformation. Recent cryo-EM structures of IR/insulin complexes reveal that insulin binding disrupts the apo-IR and induces a large conformational change of IR from the Λ- to the T-shape9,11-15. The distance between the two membrane-proximal FnIII-3 domains in the T-shaped IR dimer is reduced to ~40Å14, enabling trans-autophosphorylation between two kinase domains.
Importantly, we and others have shown that four insulins bind to two distinct sites in the T-shaped IR dimer (denoted as site-1 and site-2)14,15. Site-1 is a primary insulin binding site, composed of structural elements from both protomers, including L1 of one protomer and α-CT of the other (site-1a), and FnIII-1 loop from the protomer that has donated α-CT (site-1b). Thus, insulin binding at IR site-1 bridges the two IR protomers, thereby stabilizing the T-shaped active state. Site-2 resides on one face of a major β sheet of the FnIII-1 domain of IR14. Mutations of key residues on IR site-2 diminished insulin binding both in vitro and in cell-based assays, and also reduced IR autophosphorylation14. These findings suggest that multiple insulins binding to two distinct sites on IR facilitates optimal IR activation. However, due to the inherent complexity of the IR activation event, and the absence of the structural information regarding the intermediate states of IR, it is unclear how insulin binding to sites-1 and 2 cooperatively promotes full IR activity.
Here, we determined the cryo-EM structures of a series of full-length IR/insulin mutant complexes, including IR/insulin ValA3E (an insulin mutant that only binds to IR site-2), IR/insulin LeuA13R (an insulin mutant that only binds to IR site-1), IR/insulin LeuB17R (another insulin mutant that only binds to IR site-1) and IR/insulin ValA3E /insulin LeuA13R, at near-atomic resolution. Our structures of the IR bound with site selective insulin mutants show that, IR with an insulin mutant only bound at site-1 predominantly adopts an asymmetric Ƭ-shaped conformation, whereas the cryo-EM structure of IR with both sites-1 and −2 insulin mutants bound displays a T-shaped symmetric conformation. This observation suggests that the binding of multiple insulins to both of IR sites-1 and 2 is essential to overcome the energetic barrier associated with the asymmetric state, thereby promoting formation of the T-shaped IR dimer. To further test this idea, we determined the cryo-EM structure of full-length IR at substoichiometric concentrations of native insulin. Consistent with structures of IR/insulin mutants, IR with one or two insulins bound predominantly adopts asymmetric conformations. The structure of IR with one insulin bound at site-1 is almost identical that of IGF1R bound with one IGF1. The structure of IR with two native insulins bound bears a similar Ƭ-shaped conformation as observed in the structures of IR/insulin LeuA13R or LeuB17R. In this asymmetric state, one insulin is bound at the canonical site-1, while another insulin simultaneously engages the adjacent sites-1 and −2. Our structural analysis suggest that, the binding of a third insulin to this hybrid site in the asymmetric conformation cannot occur, due to the spatial constraint by the two disulfide-linked α-CT motifs. This explains why the asymmetric conformation of IR cannot be formed upon the binding of four insulins to both sites-1 and −2. The structural insights presented here, taken together with complementary functional assays in cells and in mice, indicate that insulin binding to sites-1 and −2 on IR synergistically promotes the formation of a T-shaped dimer, leading to optimal IR activation.
Results
The design of insulin mutants that selectively bind to IR site-1 or site-2
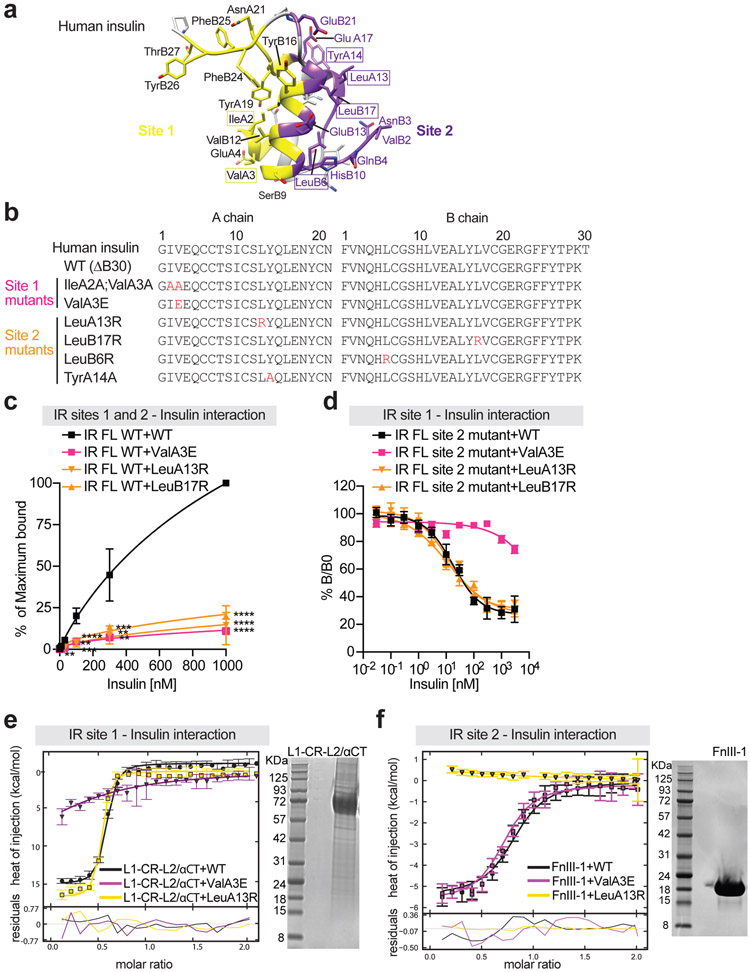
To investigate the function and mechanism of multi-site insulin binding during IR activation, we designed and synthesized insulin with mutation(s) at residues that are essential for either site-1 or site-2 binding (Fig. 1a, b). Specifically, we introduced mutations in insulin8 – IleA2A;ValA3A and ValA3E, to disrupt the insulin-IR site-1 interaction (namely insulin site-1 mutant), and LeuA13R, LeuB17R, LeuB6R, and TyrA14A to interrupt the insulin-IR site-2 interaction (namely insulin site-2 mutant) (Extended Data Fig. 1b, c).
Figure 1. Binding to IR by insulin site-1 and site-2 mutants.
a. Insulin structure with receptor binding sites-1 and −2 (PDB 6PXW). The residues in site 1 are marked as yellow, site-2 as purple, and backbone as grey.
b. Sequences of human insulin and insulin analogs. The last amino acid in the B-chain of insulin analogs is deleted (WT: ΔB30). Mutations in insulin are in red.
c. Binding of insulin analogs labeled with Alexa Fluor 488 to purified IR WT in the indicated conditions (Mean ± SD; WT, n=9 independent experiments; ValA3E, n=3; LeuA13R, n=6; LeuB17R, n=3). Significance calculated using two-tailed student t-test; **p<0.01 and ***p<0.001 (The exact p values are provided in the source data).
d. Insulin competition-binding assay for full-length IR site-2 mutant (K484E/L552A) and insulin WT/mutants (ValA3E, LeuA13R and LeuB17R) (Mean ± SD, n=3).
e. Isothermal titration calorimetry (ITC) analysis of binding between human L1-CR-L2/α-CT domains and insulin WT/mutants (ValA3E and LeuA13R). The integrated data points were displayed with their respective estimated error bars. Kd for the insulin WT binding to L1-CR-L2/α-CT is ~90 [60, 120] nM (n=2). The confidence intervals of Kd are shown in square brackets. A SDS-PAGE analysis of isolated L1-CR-L2/α-CT domains is shown.
f. ITC analysis of binding between human IR FnIII-1 domain and insulin WT/mutants (ValA3E and LeuA13R). The integrated data points were displayed with their respective estimated error bars. Kd for site 2 insulin WT binding is ~760 [540, 1070] nM (n=2). The confidence intervals of Kd are shown in square brackets. A SDS-PAGE analysis of isolated FnIII-1 domain is shown.
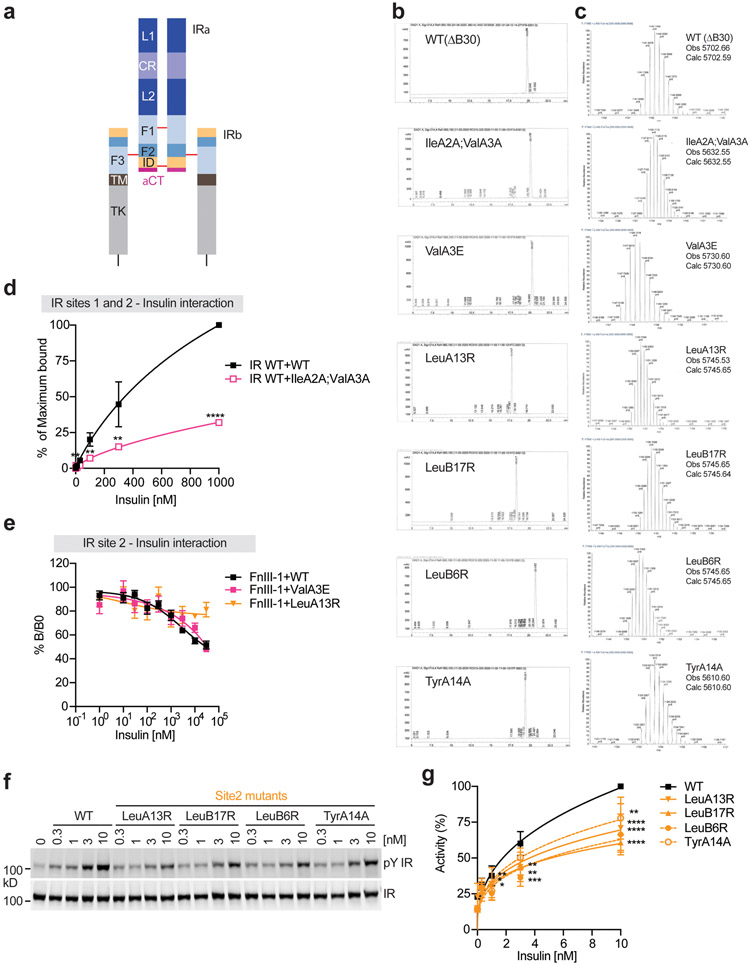
Consistent with results of previous insulin-IR binding assays8,16,17, insulin site-1 and site-2 mutants demonstrated much weaker insulin-binding affinity, relative to insulin wild-type (WT) over a broad range of ligand concentrations (Fig. 1c; Extended Data Fig. 1d). Furthermore, in vitro insulin-binding assays using isolated L1-CR-L2/α-CT domains and full-length IR site-2 mutants (IR FL K484E/L552A) showed that insulin site-2 mutants (LeuA13R and LeuB17R) could bind IR site-1 with similar affinity as insulin WT (Fig. 1d, e). Likewise, the insulin site-1 mutant (ValA3E) could engage IR site-2 (isolated FnIII-1 domain) in a similar potency as insulin WT (Fig. 1f; Extended Data Fig. 1e). These results confirm that the designed insulin mutants can selectively bind to IR site-1 or site-2 with a similar binding affinity as insulin WT.
Structure with insulin bound only at IR site-2
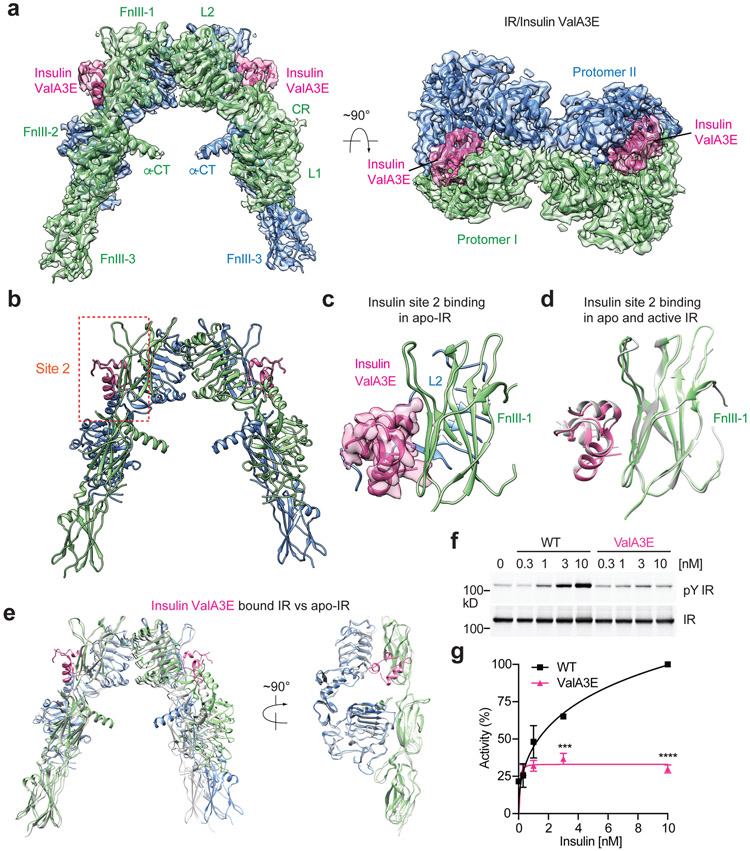
Solving the structures of IR in the intermediate states is critical for understanding the specific roles of two distinct insulin binding sites in IR activation. As insulin binding to full-length IR exhibits around 30-fold increased binding affinity relative to its isolated extracellular domain17,18, we hypothesized that structural studies of the full-length IR in complex with designed insulin mutants would capture the intermediate states of IR during activation. We first determined the cryo-EM structure of full-length IR with insulin bound to site-2 only. We expressed and purified full-length mouse IR (Extended Data Fig. 2), and reconstituted the IR-insulin ValA3E complex, which is deficient in IR site-1 binding, for cryo-EM analysis. The initial 3D reconstruction of the IR/insulin ValA3E complex with 2-fold symmetry applied was determined at 3.6Å (Fig. 2a; Extended Data Fig. 3). To improve the resolution, we used the symmetry expansion approach as well as focused refinement19,20, which resulted in 3.2Å resolution reconstruction, comprising half of the IR/insulin ValA3E complex (Extended Data Fig. 3). We built a nearly complete model for the entire extracellular region of IR/insulin ValA3E complex.
Figure 2. Structure of IR with insulin only bound to site-2.
a. 3D reconstruction of the 2:2 IR/insulin ValA3E complex and the corresponding ribbon representation of this complex fitted into cryo-EM map at 3.5 Å resolution, shown in two orthogonal views.
b. The ribbon representation of the 2:2 IR/insulin ValA3E complex.
c. Close-up view of the binding of insulin ValA3E at site-2 of apo-IR. The cryo-EM density of insulin is shown.
d. Superposition between the structures of insulin bound at FnIII-1 domain of apo- (colored) and active-states (grey; PDB 6PXV) of IR.
e. Superposition between the structures of insulin ValA3E bound IR (colored) and unliganded, apo-IR (grey; PDB 4ZXB).
f. Insulin-induced IR autophosphorylation in 293FT cells expressing IR wild-type (WT). Cells were treated with the indicated insulin WT or site-1 mutant (ValA3E) for 10 min. The IR autophosphorylation levels were assessed by quantitative western blotting with a phospho-tyrosine (pY) IRβ antibody. Expression levels of IRβ were monitored by anti-Myc blotting against the C-terminal Myc-tag.
g. Quantification of the western blot data shown in f (Mean ± SD). Each experiment was repeated three times. Significance calculated using two-tailed student t-test; ***p=0.000277; ****p=0.000001. Uncropped images for all blots and gels are available as source data.
The overall structure of the IR/insulin ValA3E complex has a symmetric Λ-shape (Fig. 2a, b). No additional densities were found close to the L1/α-CT domains of each protomer, which further substantiates that insulin ValA3E is incapable of binding to the IR site-1. Well-defined densities, however, were identified on each side of IR dimer that could be unequivocally attributed to insulin (Fig. 2a-c). In this 2:2 IR/insulin ValA3E complex, insulin binds IR predominantly through engaging a side surface of FnIII-1 domain of IR (Fig. 2c). This IR/insulin binding mode is nearly identical to that utilized for the site-2 insulin binding in the T-shaped 2:4 IR/insulin complex14 (denoted as canonical site-2 insulin binding hereafter) (Fig. 2d).
Superimposition of the site-2 insulins bound IR structure with the crystal structure of apo-IR reveals no major structural differences, indicating that insulin binding to site-2 of apo-IR alone is unable to induce conformational change (Fig. 2e). To test the functional relevance of insulin binding to IR site-2 alone, we next examined the insulin-dependent IR autophosphorylation in IR-overexpressing 293FT cells. Consistent with our cryo-EM results, the insulin ValA3E mutation diminished the potency of insulin in triggering IR activation (Fig. 2f, g), suggesting that the binding of insulin only to IR site-2 is insufficient to activate IR (Fig. 2a).
Structure of IR with insulin bound only at IR site-1
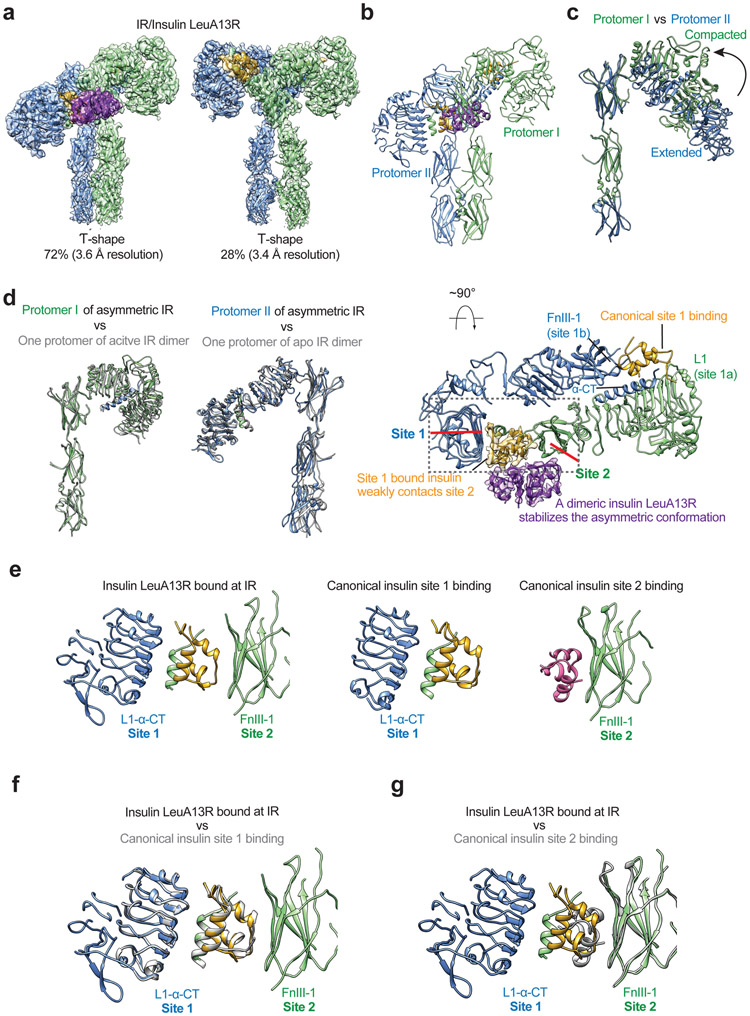
While our cryo-EM analysis demonstrated that insulin can bind to the site-2 of apo-IR, this result does not explain why insulin binding at IR site-2 promotes the optimal IR activation. To understand the functional role of site-2 insulin binding in IR activation, we determined the cryo-EM structure of IR with insulin LeuA13R mutant, which is deficient in IR site-2 binding. After initial 3D classification of IR/insulin LeuA13R particles set, two good classes were identified. The 3D reconstruction from the minor class (comprising 28% of well-preserved particles) was resolved at 3.4Å resolution and displayed a T-shaped symmetric conformation with two insulin bound at canonical site-1s (Fig. 3a; Extended Data Fig. 4). This site-1 binding pattern has been observed in the cryo-EM structure of the 2:4 IR/insulin complex that is essential for stabilizing the T-shaped active conformation of IR14. No observable density was detected at either of the site-2s of IR, further validating the deficiency of insulin LeuA13R in site-2 binding (Fig. 3a; Extended Data Fig. 4). Without site-2 insulin binding, this symmetric IR dimer adopts a nearly identical conformation as that observed in the T-shaped 2:4 IR/insulin complex (Fig. 3a). These structural observations suggest that the insulin LeuA13R, which only binds the IR site-1, promotes the T-shaped symmetric, active conformation of IR, but with much lower efficiency than insulin WT which can bind both IR sites-1 and −2.
Figure 3. Structures of IR with insulin LeuA13R only bound to site-1.
a. 3D reconstructions of the IR/insulin LeuA13R complex in both asymmetric and symmetric conformations, and the corresponding ribbon representations of this complex fitted into cryo-EM map at 3.6 Å (asymmetrical) and 3.4 Å resolution (symmetrical). The asymmetric and symmetric cryo-EM structures were reconstructed from 72% and 28% of good particles, respectively.
b. The ribbon representation of the asymmetric IR/insulin LeuA13R complex, shown in two orthogonal views. The top view of the asymmetric IR/insulin LeuA13R complex, showing, in half of the complex, one insulin bound at site-1 of one protomer also weakly contacts the side-surface of FnIII-1 domain of another protomer. The binding of a dimeric insulin (purple) stabilizes this specific asymmetric conformation. The cryo-EM densities of insulins are shown.
c. Superposition between the structures of two protomers in the asymmetric complex by aligning the FnIII-1-3 domains, revealing the structural rearrangements of L1-CR-L2 domains.
d. Superposition between the structures of Γ-shaped protomer in the asymmetric complex (green) and one protomer in the active IR-dimer (grey; PDB 6PXV). Superposition between the structures of V-shaped protomer in the asymmetric complex (blue) and one protomer in the apo IR-dimer (grey; PDB 4ZXB).
e. The structures of sandwiched insulin in the asymmetric complex (left), insulin bound at site-1 of active IR (middle, PDB 6PXV) and insulin bound at site-2 of active IR (right, PDB 6PXV).
f. Superposition between the structures of sandwiched insulin in the asymmetric complex (colored) and insulin bound at site-1 of active IR (grey) by aligning the L1 domain, showing identical binding pattern.
g. Superposition between the structures of sandwiched insulin in the asymmetric complex (colored) and insulin bound at site-2 of active IR (grey) by aligning the FnIII-1 domain, showing distinct binding pattern.
The reconstruction of particles from the major class, comprising 72% of total well-preserved particles, reached 3.6Å resolution and showed an asymmetric conformation (Fig. 3a, b; Extended Data Fig. 4). The top part of this complex was further improved to 3.4Å resolution after focused 3D refinement (Extended Data Fig. 4). The overall conformation of the asymmetric IR/insulin LeuA13R complex appears to be a ‘tower-crane’ (denoted as Ƭ-shape for simplicity), in which two L1/α-CT domains of IR dimer are localized in the top and middle parts of the Ƭ, respectively (denoted as the higher and lower L1 domains respectively, hereafter) (Fig. 3a, b). The two stalk regions of the IR dimer are placed in close proximity in this asymmetric complex (Fig. 3b), but their relative position differs from that in the T-shaped symmetric IR.
The two IR protomers in this asymmetric complex adopt distinct conformations (Fig. 3c). One protomer assumes a Γ-shape, with L1-CR-L2 domains adopting a compact form; while another promoter bears a V-shape, with L1-CR-L2 domains having a more extended conformation (Fig. 3c). Structural comparisons reveal that the Γ-shaped protomer in the asymmetric complex closely resembles one protomer in the T-shaped IR, whereas the V-shaped protomer in the asymmetric complex is similar to one protomer in the Λ-shaped apo-IR (Fig. 3d).
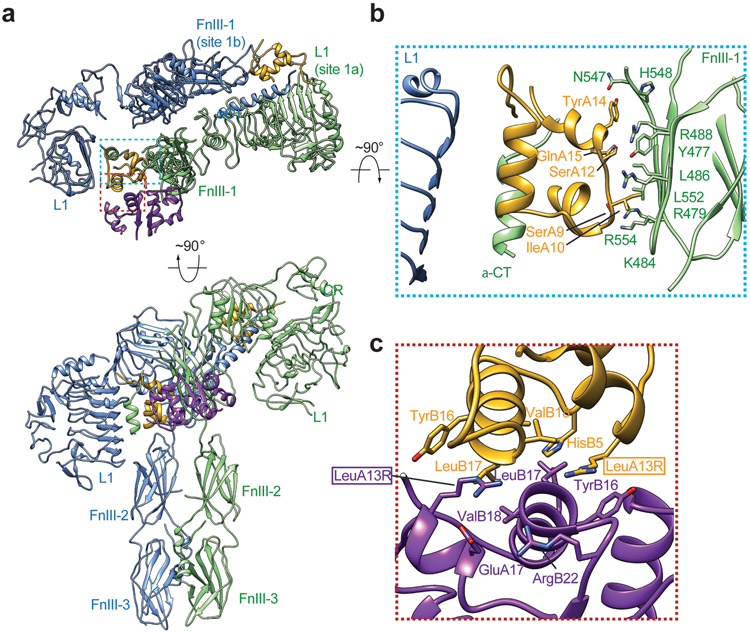
In one half of the asymmetric IR/insulin LeuA13R complex, insulin LeuA13R binds at site-1 in the head region of the complex, similar to insulin at site-1 in the T-shaped IR (Fig. 3b). In the other half of the asymmetric complex, insulin LeuA13R, localized halfway down the Ƭ-shaped complex, is sandwiched between two adjacent protomers (Fig. 3b). Specifically, this insulin predominately binds at the site-1a of V-shaped protomer accessing the same set of residues as those in the canonical site-1 insulin binding (Fig. 3e,f) while simultaneously weakly interacting with the side surface of FnIII-1 of the Γ-shaped protomer (Fig. 3e,f; Extended Data Fig. 5a, b). The simultaneous binding of one insulin LeuA13R to both L1/α-CT domains of one protomer and FnIII-1 domain of another stabilizes this specific asymmetric conformation (Fig. 3e). Notably, although this FnIII-1 surface engaged by insulin LeuA13R overlaps with that used for the canonical site-2 insulin binding, the detailed binding modes are significantly different (Fig. 3e,g; Extended Data Fig. 5a, b). Firstly, the buried surface of insulin LeuA13R binding at FnIII-1 in this Ƭ-shape IR (360 Å2) is significantly smaller than the one buried by the canonical site-2 insulin binding (580 Å2), suggesting that insulin LeuA13R interacts with FnIII-1 domain of IR with much lower affinity than in the canonical site-2 insulin binding. Secondly, the insulin residues that are involved in the FnIII-1 contact are not identical. We previously showed that a total 14 residues of insulin participate in the canonical site-2 binding14. In contrast, 5 residues from A chain of insulin LeuA13R (SerA9, IleA10, SerA12, TyrA14, and GlnA15) participate in this interaction, of which SerA9 and GlnA15 are not involved in canonical site-2 binding (Extended Data Fig. 5a, b).
Unexpectedly, an additional insulin dimer was well resolved in the middle part of the asymmetric IR/insulin LeuA13R complex. This insulin dimer forms a tripartite interaction with the monomeric insulin that is sandwiched between the two protomers and the FnIII-1 domain of the Γ-shaped protomer (Fig. 3b). Such tripartite interaction is likely to stabilize the Ƭ-shape IR/insulin LeuA13R complex, which explains in part why the cryo-EM structure of the IR/insulin LeuA13R asymmetric complex can be solved at high resolution. (Fig. 3b). The structure of this IR bound insulin dimer can be superimposed onto that of the free insulin dimer (PDB 1TRZ)21, suggesting that a preformed insulin LeuA13R dimer can bind IR without structural change.
Similar structural transitions of IR by insulin site-2 mutants
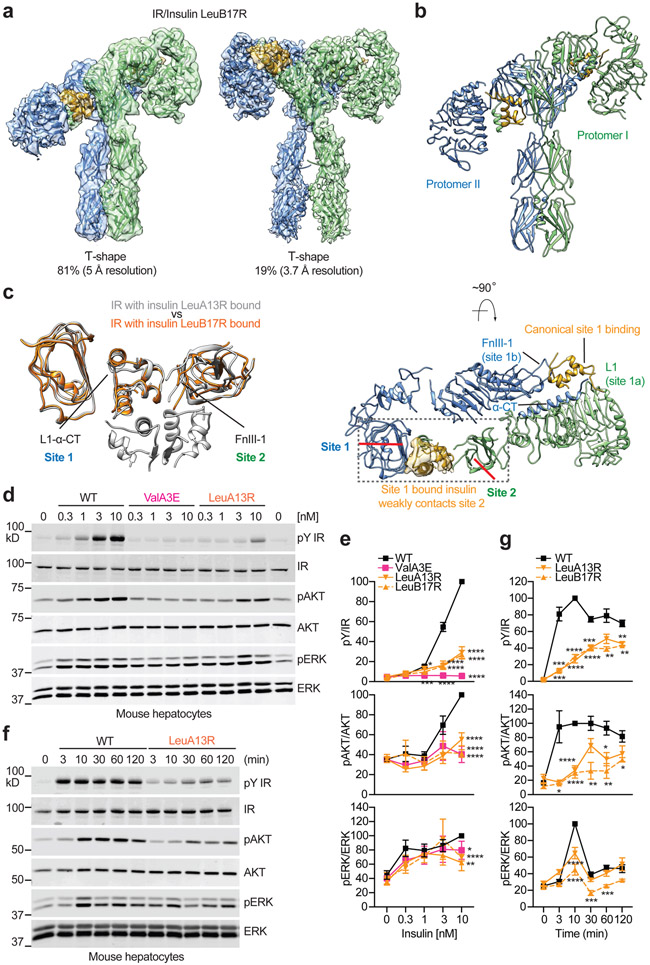
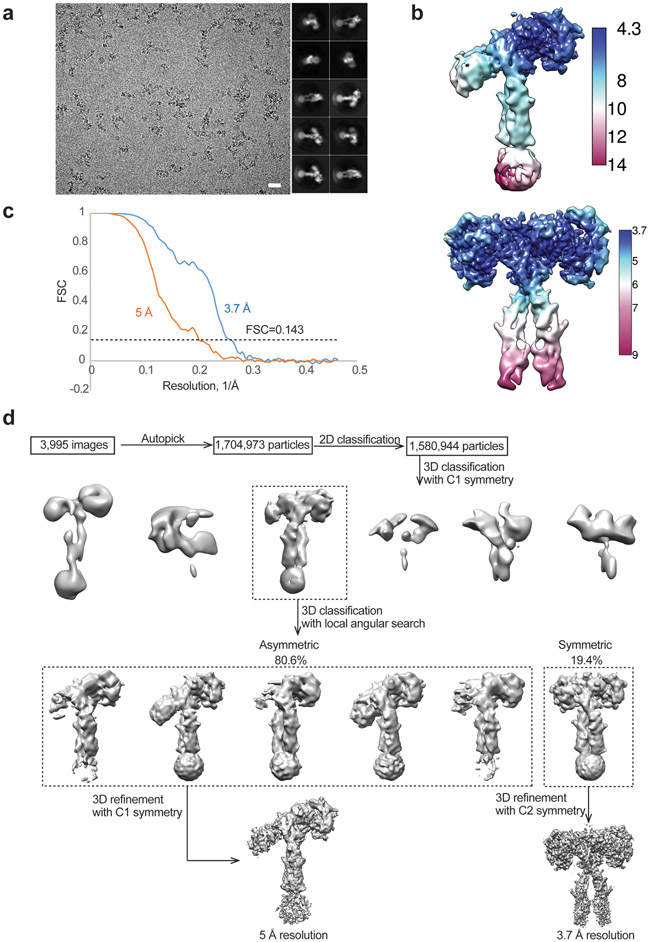
The asymmetric conformation of IR/insulin LeuA13R is in part stabilized by dimeric insulin at one-half of the complex. After careful inspection of this model, we noticed that the mutated insulin residue —LeuA13R— is localized precisely at the interface between the sandwiched monomeric and dimeric insulins (Extended Data Fig. 5a, c). This raises the possibility that our designed LeuA13R mutation may lead to the artificial binding of dimeric insulins to the IR dimer, thereby coincidentally inducing the asymmetric conformation of IR. To exclude this possibility, we performed the cryo-EM analysis of IR/insulin LeuB17R complex, another site-2 insulin mutant. Initial 3D classification of IR/insulin LeuB17R with coarse angular sampling revealed a single good class that showed an overall asymmetric conformation with half of the complex displaying less well-resolved cryo-EM density (Extended Data Fig. 6). Subsequent application of further 3D classification with finer angular sampling into six classes identified one class with a T-shaped symmetric conformation, comprising 19.4 % of total well-preserved particles (Extended Data Fig. 6). Further 3D refinement of the corresponding particles from this class with C2 symmetry imposed produced a map with an overall 3.7Å resolution (Fig. 4a; Extended Data Fig. 6). The other 5 classes from the second round of 3D classification showed overall asymmetric conformations. In 3 out of 5 classes, the lower L1-CR domains were relatively poorly resolved, indicating high structural flexibility of this region (Extended Data Fig. 6). Another 2 classes with similar asymmetric conformations displayed well-defined density for the entire extracellular region of IR/insulin LeuB17R complex. The final refinement of selected particles with C1 symmetry imposed resulted in a cryo-EM map at 5Å resolution (Fig. 4a; Extended Data Fig. 6), enabling us to build an accurate model for the entire extracellular region of asymmetric IR/insulin LeuB17R complex with the help of available structures of each domain of IR and insulin (Fig. 4b).
Figure 4. Structures of IR with insulin LeuB17R only bound to site-1 and functional importance of site-2 insulin binding.
a. 3D reconstructions of the IR/insulin LeuB17R complex in both asymmetric and symmetric conformations, and the corresponding ribbon representations of this complex fitted into cryo-EM map at 5 Å (asymmetrical) and 3.7 Å resolution (symmetrical). The asymmetric and symmetric conformations comprise of 81% and 19% of good particles, respectively.
b. The ribbon representation of the asymmetric IR/insulin LeuB17R complex, shown in two orthogonal views. The top view of the asymmetric IR/insulin LeuB17R complex, showing, in half of the complex, one insulin bound at site-1 of one protomer also weakly contacts the side-surface of FnIII-1 domain of another protomer. The cryo-EM density of insulin is shown.
c. Superposition between the structures of IR/insulin LeuA13R (grey) and IR/insulin LeuB17R (orange), showing similar insulin binding pattern that one insulin is sandwiched between L1/α-CT of one protomer and FnIII-1 of another.
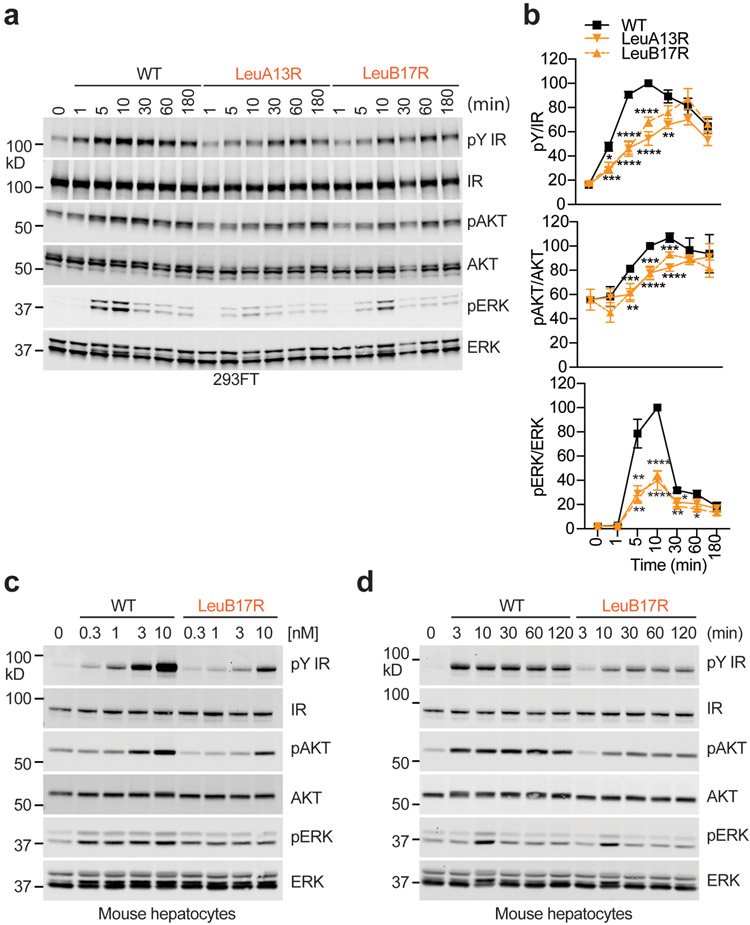
d. IR signaling in primary mouse hepatocytes treated with the indicated concentrations of insulin for 10 min. Cell lysates were blotted with the indicated antibodies.
e. Quantification of the western blot data shown in d. Mean ± SD. For pY/IR, WT, n=11 independent experiments; ValA3E, n=7; LeuA13R, n=6; LeuB17R, n=6; For pAKT/AKT, WT, n=7; ValA3E, n=4; LeuA13R, n=3; LeuB17R, n=4; For pERK/ERK, WT, n=8; ValA3E, n=4; LeuA13R, n=3; LeuB17R, n=5. Significance calculated using two-tailed student t-test; *p<0.05; **p<0.01, ***p<0.001, and ****p<0.0001 (The exact p values are provided in the source data).
f. IR signaling in primary mouse hepatocytes treated with 10 nM insulin for the indicated times. Cell lysates were blotted with the indicated antibodies.
g. Quantification of the western blot data shown in f. Mean ± SD. Each experiment was repeated three times. Significance calculated using two-tailed student t-test; *p<0.05; **p<0.01, ***p<0.001, and ****p<0.0001(The exact p values are provided in the source data). Uncropped images for all blots and gels are available as source data.
The overall conformation of the asymmetric IR/insulin LeuB17R complex bears a strong resemblance to that of the asymmetric IR/insulin LeuA13R complex (Fig. 4c). However, no additional dimeric insulin could be identified in the IR/insulin LeuB17R complex (Fig. 4b, c), confirming that the asymmetric conformation of IR is caused by the lack of site-2 binding, rather than association with a dimeric insulin.
An asymmetric IR represents a partially active state
To validate the functional importance of site-2 insulin binding to IR activation, we analyzed insulin-dependent IR autophosphorylation in IR-overexpressing 293FT cells. All insulin site-2 mutants including LeuA13R and LeuB17R displayed greatly reduced potency in triggering IR activation as compared to insulin WT (Extended Data Fig. 1f, g). We next monitored the insulin-induced IR autophosphorylation and phosphorylation of AKT (pAKT) and ERK1/2 (pERK) substrates at multiple time points (Extended Data Fig. 7a, b). Tyrosine autophosphorylation of IR quickly increased from basal levels and peaked at 10 min after insulin WT stimulation, and did not fall below 60% of the peak level after 3 hr. In contrast, IR phosphorylation induced by site-2 mutants peaked at 1 hr after initial stimulation, reaching less than 80% of the peak level induced by insulin WT. The levels of pAKT and pERK were greatly reduced in insulin site-2 mutant-stimulated cells, underscoring the functional importance of insulin site-2 binding.
To further confirm the requirement of the site-2 insulin binding in promoting IR activation and signaling, we monitored the insulin-induced IR signaling in freshly isolated primary hepatocytes. Consistent with the IR-overexpressing 293FT cells findings, primary hepatocytes stimulated by insulin site-2 mutants showed weakened and delayed IR autophosphorylation over a wide range of insulin concentrations (Fig. 4d, e; Extended Data Fig. 7c) at multiple time points (Fig. 4f, g; Extended Data Fig. 7d). The levels of pAKT and pERK were also statistically decreased in primary hepatocytes treated with insulin site-2 mutants, compared to those in cells treated with insulin WT. These data suggest that the site-2 insulin binding facilitates optimal IR activation and signaling. Importantly, the vast majority (~80%) of the IR with insulin only bound at site-1 exhibits an asymmetric conformation, suggesting that the asymmetric IR is a partially active state.
Insulin binding to sites-1 and 2 promotes the T-shaped IR
As described above, insulin directly binds the site-2 of apo-IR, but this type of binding alone is unable to disrupt the apo-IR conformation (Fig. 2), which is critical for IR activation. In contrast, insulin binding to IR site 1 alone induces a large conformational change of IR as well as partial IR activation. Nevertheless, upon the stimulation of insulin mutants that are deficient in IR site-2 binding, only a small subset of the particles (~20%) are promoted to T-shaped symmetric conformation (Fig. 3 and 4), in contrast to our previous result that nearly all of the particles adopt T-shaped symmetric conformation upon insulin WT binding to both sites-1 and −214. Collectively, these new and published results14,22,23 suggest that insulin binding to both of sites-1 and 2 is a prerequisite for efficient promotion of the IR dimer from the apo-state to the T-shaped, fully active state. Our results further indicate that, during IR activation, insulin binding to IR site-1 plays a critical role in disrupting the apo-state of IR and stabilizing its active state, whereas insulin binding to IR site-2 plays an auxiliary role that facilitates the conformational change of IR from asymmetric (partial activity) to symmetric (full activity).
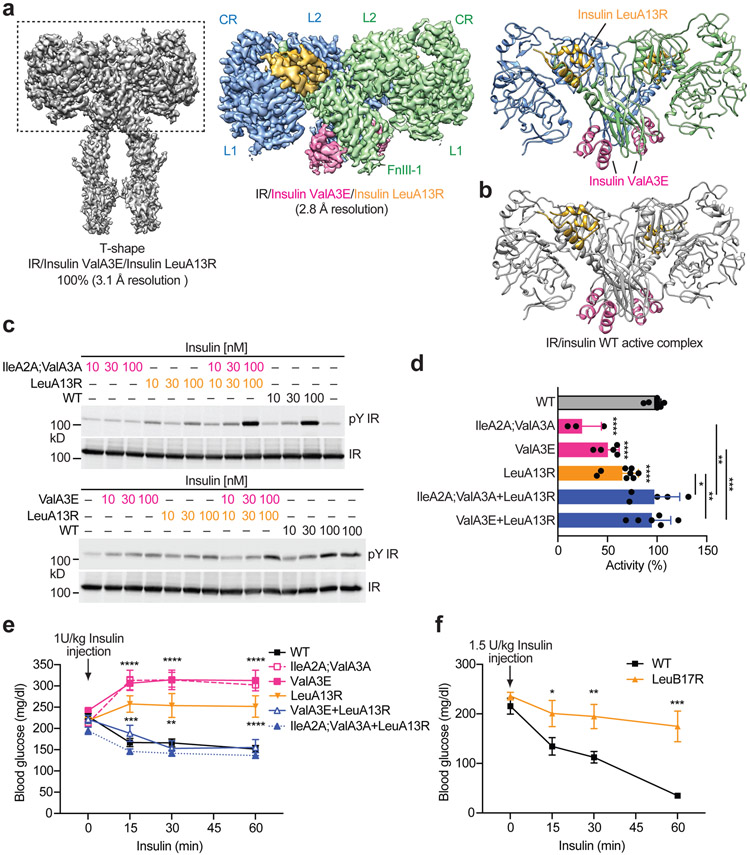
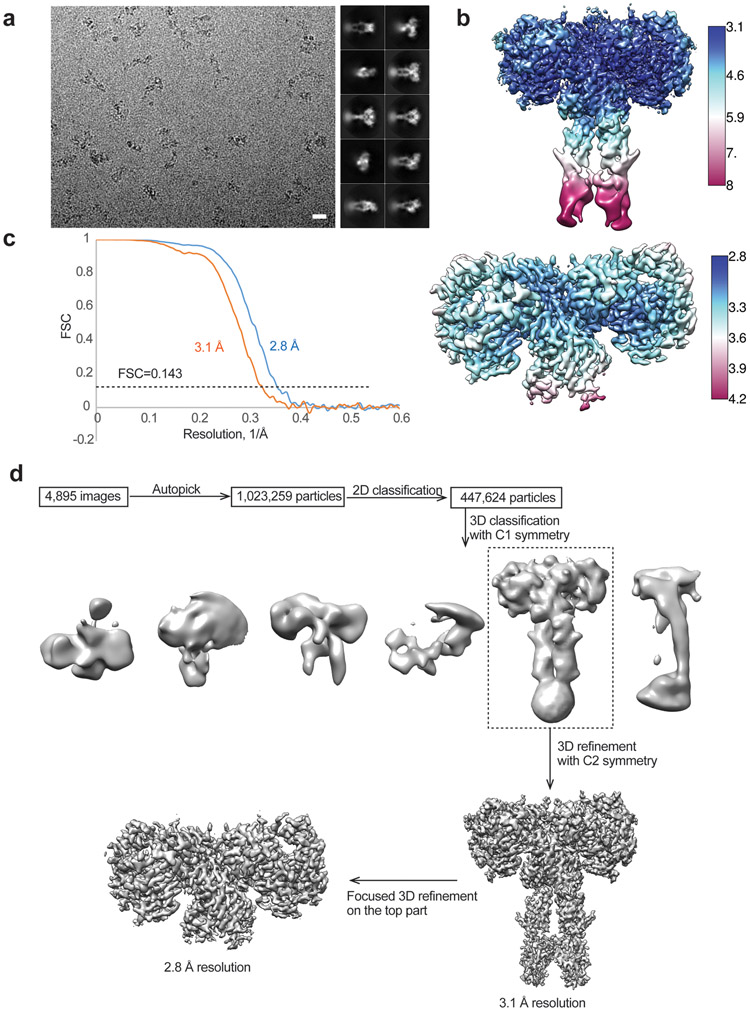
To test this idea, we determined the cryo-EM structure of the full-length IR in the presence of both insulin ValA3E (deficient in IR site-1 binding) and LeuA13R (deficient in IR site-2 binding) (Extended Data Fig. 8). The 3D classification of IR/insulin ValA3E /insulin LeuA13R dataset resulted in a single good class, showing a T-shaped conformation (Fig. 5a; Extended Data Fig. 8). The subsequent global and focused 3D refinements produced cryo-EM maps for the entire extracellular domain of IR/insulin complex as well as its top part at 3.1Å and 2.8Å resolution, respectively (Fig. 5a). Intriguingly, our cryo-EM model of the IR/insulin ValA3E/insulin LeuA13R complex showed that the binding of insulin LeuA13R and ValA3E to IR sites-1 and −2, respectively, could effectively promote the formation of a symmetric, presumably fully active, T-shaped IR. No discernable structural differences were observed between IR/insulin ValA3E /insulin LeuA13R and IR/insulin WT complexes, indicating that the conformation of IR induced by both insulins ValA3E and LeuA13R is identical to that of insulin WT alone (Fig. 5a, b). These results strongly support our hypothesis that insulin binding to sites-1 and 2 synergistically triggers the formation of T-shaped symmetric IR dimer and full activity.
Figure 5. Mixture of the insulin site-1 and site-2 mutants promotes the formation of T-shaped IR dimer and activates IR signaling.
a. 3D reconstruction of the IR dimer with four insulin site-1 and site-2 mutants bound, as well as that after focused 3D refinement (left) and the corresponding ribbon representation (right).
b. The structure of IR with four insulins WT bound at sites-1 and −2 (PDB 6PXW). The IR is colored in grey, site-1 insulins are colored in yellow, and site-2 insulins are colored in pink.
c. Insulin-induced IR autophosphorylation in 293FT cells expressing IR wild-type (WT). Cells were treated with the WT, site-1 (IleA2A;ValA3A or ValA3E), site-2 (LeuA13R) or 1:1 mixture of the insulin mutants for 1 min.
d. Quantification of the western blot data shown in c (100 nM insulin, Mean ± SD) WT, n=15 independent experiments; ValA3E, n=5; LeuA13R, n=8; IleA2A;ValA3A, n=3; ValA3E+LeuA13R, n=6, IleA2A;ValA3A+LeuA13R, n=5. Significance calculated using two-tailed student t-test; *p<0.05; **p<0.01, ***p<0.001, and ****p<0.0001 (The exact p values are provided in the source data).
e. Insulin tolerance test of 2-month old male mice. Mice were injected intraperitoneally with insulin WT and mutants at 1 U per kg body weight, and their blood glucose levels were measured at the indicated time points after injection. Animal number, WT, n= 34; IleA2A;ValA3, n=5; ValA3E, n=18; LeuA13R, n=11; IleA2A;ValA3A+LeuA13R, n=8; ValA3E+LeuA13R, n=8. Mean ± SEM. Significance calculated using multiple Mann-Whitney tests with two-stage linear step-up procedure; **p<0.01, ***p<0.001 and ****p<0.0001 (The exact p values are provided in the source data).
f. Insulin tolerance test of 3-month old male mice. Mice were injected intraperitoneally with insulin WT and mutants at 1.5 U per kg body weight, and their blood glucose levels were measured at the indicated time points after injection. Mean ± SEM. WT, n=7; LeuB17R, n=8. Significance calculated using Mann-Whitney test with two-stage linear step-up procedure; *p=0.050194, **p=0.008236, and ***p=0.000622. Uncropped images for all blots and gels are available as source data.
To provide more functional validation of our proposed IR activation model, we treated IR-overexpressing 293FT cells individually, or with a 1:1 mixture of the insulin sites-1 and 2 mutants. Our cellular assay showed that IR autophosphorylation in cells co-treated with insulin site-1 (ValA3E) and site-2 (LeuA13R) mutants at equal levels was significantly increased as compared to that in cells treated with insulin site-1 or site-2 mutants alone (Fig. 5c, d). IR autophosphorylation was also greatly increased by treatment of a 1:1 mixture of the insulin mutants (IleA2A;ValA3A and LeuA13R) and was similar to those in cells treated with insulin WT. These data are consistent with our cryo-EM structure and that binding of insulins to two distinct sites on each IR dimer triggers full IR activation.
Insulin stimulates uptake of circulating glucose into cells, and thereby reducing blood glucose level. In order to investigate the metabolic effects of insulin mutants in vivo, we evaluated them using an insulin tolerance assay. As expected, administration of insulin WT lowered blood glucose levels in mice (Fig. 5e, f). In contrast, individual administration of insulin site-1 (IleA2A;ValA3A and ValA3E) or site-2 mutants (LeuA13R and LeuB17R) alone did not reduce the blood glucose levels (Fig. 5e, f). Strikingly, administration of 1:1 mixture of insulin mutants (IleA2A; ValA3A+LeuA13R or ValA3E+LeuA13R) markedly reduced blood glucose levels, similarly to that observed with insulin WT administration (Fig. 5e, f). These results validate the physiological importance of insulin binding to both IR sites-1 and −2 in insulin-mediated IR activation.
Structure of IR in the partially liganded states
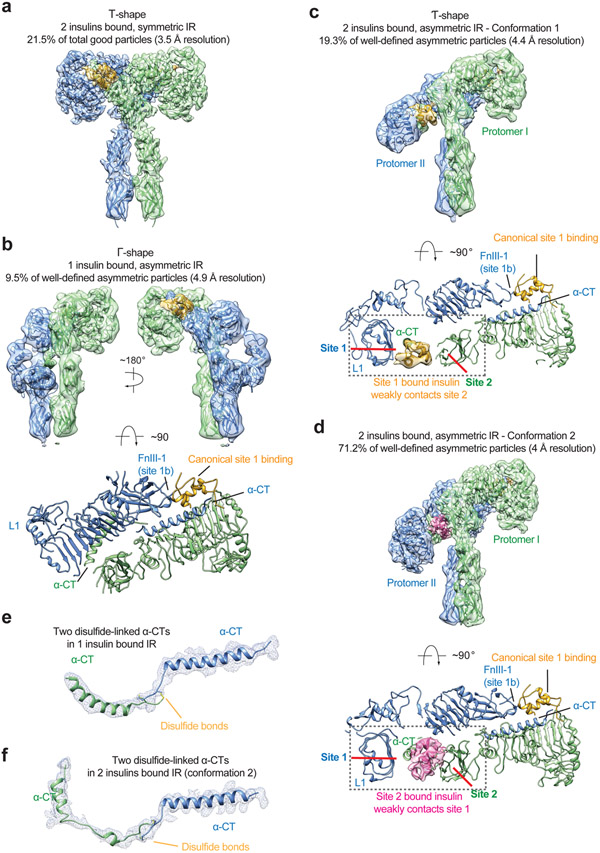
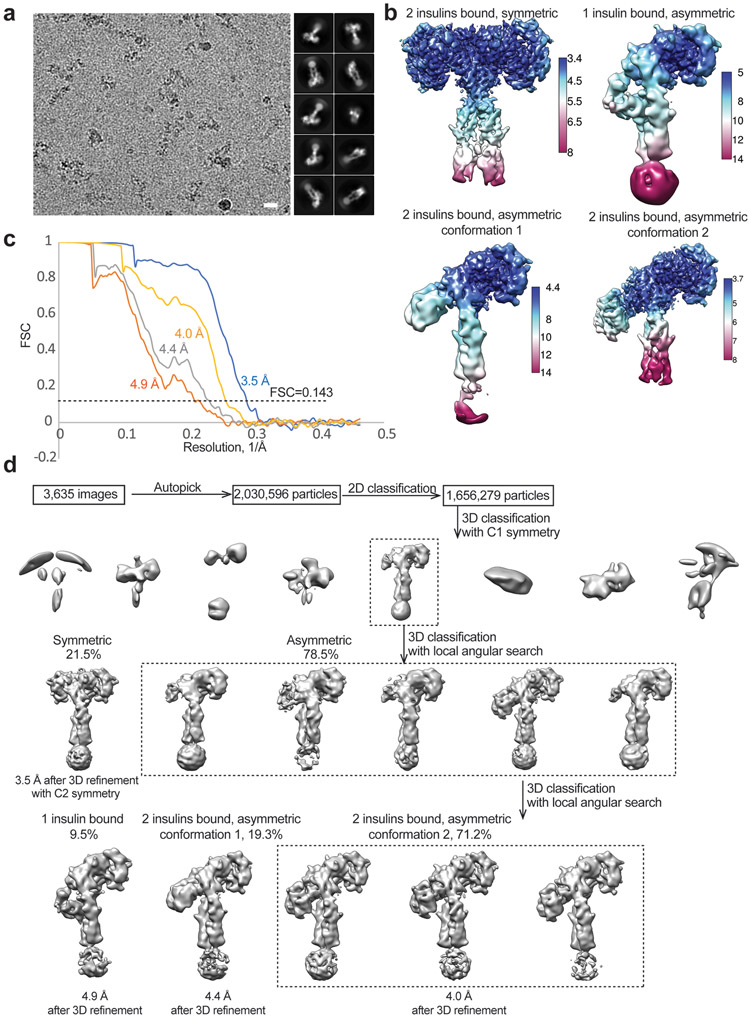
Our results demonstrate that the binding of four insulins to both IR sites-1 and −2 efficiently promote the formation of the fully active, T-shaped IR. We therefore reasoned that, when insulin concentrations are low, IR incompletely saturated with insulin may predominantly adopts an asymmetric conformation. To test this hypothesis, we performed cryo-EM analysis for the IR/insulin WT sample in a stoichiometry of 2:2 (one IR dimer with two insulins) (Extended Data Fig. 9). After multiple rounds of 3D classification, we identified four major classes with well-defined density throughout the entire extracellular region (Extended Data Fig. 9). As expected, the IR dimer in these four classes is bound to maximally two insulins, confirming that they are all captured in the partially liganded states.
One class assumes a symmetric conformation that comprises of 21.5% well-preserved particles, while the other three classes bear asymmetric conformations (Extended Data Fig. 9). Consistent with the cryo-EM results of IR/insulin site-2 mutants (Fig. 3, 4), the partially liganded IR was predominately in an asymmetric conformation. The symmetric conformation observed has an overall T-shape with two insulins bound at two canonical site-1s, which is identical to the symmetric IR conformations induced by insulin site-2 mutants (Fig. 6a).
Figure 6. Structures of IR/insulin WT complex at subsaturated insulin concentrations.
a. 3D reconstruction of the IR/insulin WT in two insulins bound, symmetric conformation, and the corresponding ribbon representation fitted into cryo-EM map at 3.5 Å resolution. The symmetric cryo-EM structure was reconstructed from 21.5% of good particles.
b. 3D reconstruction of the IR/insulin WT in a single insulin bound, asymmetric conformation, and the corresponding ribbon representation fitted into cryo-EM map at 4.9 Å resolution, shown in three orthogonal views. The asymmetric cryo-EM structure was reconstructed from 9.5% of well-defined asymmetric particles.
c. 3D reconstruction of the IR/insulin WT in two insulins bound, asymmetric conformation, and the corresponding ribbon representation fitted into cryo-EM map at 4.4 Å resolution. The asymmetric cryo-EM structure was reconstructed from 19.3% of well-defined asymmetric particles. The ribbon representation of the asymmetric IR/insulin WT complex, shown in two orthogonal views. The top view of the asymmetric IR/insulin WT complex, showing, in half of the complex, one insulin bound at site-1 of one protomer also weakly contacts the side-surface of FnIII-1 domain of another protomer. The cryo-EM densities of insulins are shown.
d. 3D reconstruction of the IR/insulin WT in two insulins bound, asymmetric conformation, and the corresponding ribbon representation fitted into cryo-EM map at 4 Å resolution. The asymmetric cryo-EM structure was reconstructed from 71.2% of well-defined asymmetric particles. The ribbon representation of the asymmetric IR/insulin WT complex, shown in two orthogonal views. The top view of the asymmetric IR/insulin WT complex, showing, in half of the complex, one insulin bound at site-2 of one protomer also weakly contacts the site 1a of neighboring protomer. The cryo-EM densities of insulins are shown.
e. Cryo-EM density and model of dimerized α-CT motifs in a single insulin bound, asymmetric IR (b).
f. Cryo-EM density and model of dimerized α-CT motifs in two insulins bound, asymmetric IR (d).
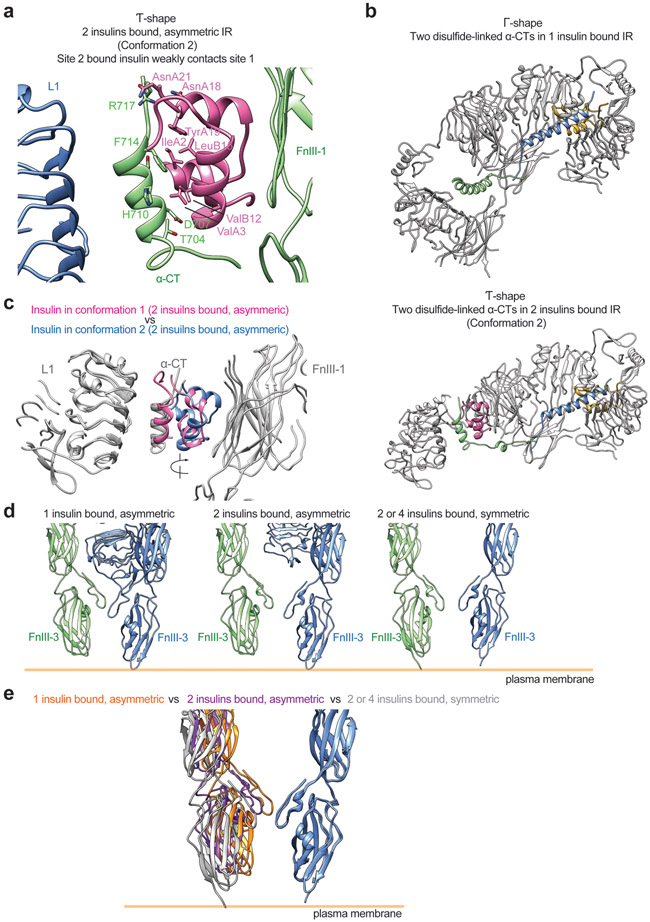
Among three asymmetric classes, a single insulin bound at the site-1 of the Γ-shaped asymmetric IR dimer (Fig. 6b). This conformation resembles that of one insulin bound IR extracellular domain linked with leucine zipper motifs13, and is nearly identical to that of a single IGF1 bound full-length IGF1R20. By analogy to the activation of IGF1R by IGF1, the binding of a single insulin to site-1 disrupts the auto-inhibited conformation for one half of the apo-dimer, meanwhile the unliganded protomer retains the L1-FnIII-2 interaction in the apo state (Fig. 6b). Along with the conformational change, the two α-CTs motifs together form a rigid beam-like structure (Fig. 6e), and the two membrane-proximal domains move in close proximity.
In 2 out of 3 asymmetric classes, two insulins bind to the IR, and the IR/insulin complexes adopt two distinct conformations (namely conformations 1 and 2) (Fig. 6c, d). Conformation 1 is similar to the asymmetric IR dimer induced by insulin site-2 mutants (Fig. 6c). In this state, one insulin is bound at the canonical site-1, while the second insulin, which is bound at another site-1 in the middle part of the Ƭ (lower L1/α-CT domains), weakly contacts the site-2 of the FnIII-1 domain from the neighboring protomer (Fig. 6c). Conformation 2 adopts a similar Ƭ-shape as conformation 1 (Fig. 6d). However, the binding modes of insulin in the middle region of the IR dimer in conformations 1 and 2 differ. Specifically, the insulin in the middle part of conformation 2 primarily binds at canonical site-2 of the IR (Fig. 6d). Intriguingly, this site-2 insulin also weakly contacts the α-CT motif (burying 478 Å2 solvent-exposed surface), which is part of the site-1a of the neighboring promoter (Fig. 6d). 5 residues from one side of α-CT motif (T704, D707, H710, F714, and R717) are involved in this interaction (Extended Data Fig. 10a). In this binding model, one insulin simultaneously contacts sites-2 and −1 between two protomers, thereby stabilizing this asymmetric conformation.
Structural comparison between conformations 1 and 2 indicates that one insulin binds to the canonical site-1 in the top part of the IR dimer (Fig. 6c, d). In the middle region of the Ƭ-shaped asymmetric dimer, the site-1 from one protomer and site-2 from another are placed in proximity (Fig. 6c, d). Such a hybrid site arrangement enables the second insulin to bind either sites-1 or 2, while simultaneously contacting another site. This explains why we were able to observe two distinct conformations in the two insulins bound, asymmetric state.
Notably, in these Ƭ-shaped asymmetric conformations, the two L1/α-CT domains are largely separated and form a 90-degree angle with respect to each other (Fig. 6f; Extended Data Fig. 10b). To have sufficient length to bridge the higher and lower L1/α-CT motifs, the N-terminus of α-CT associated with the lower L1 domain has to become completely unfolded to form an extended loop (Fig. 6f; Extended Data Fig. 10b). Consequently, the two disulfide-linked α-CTs in the Ƭ-shaped asymmetric dimer adopt a largely stretched and kinked conformation, which restricts the further relocation of the lower L1 domain. The implication of this structural observation for the activation of IR will be discussed in the following section and supplemental discussion.
Discussion
The activation model of IR in the partially liganded states
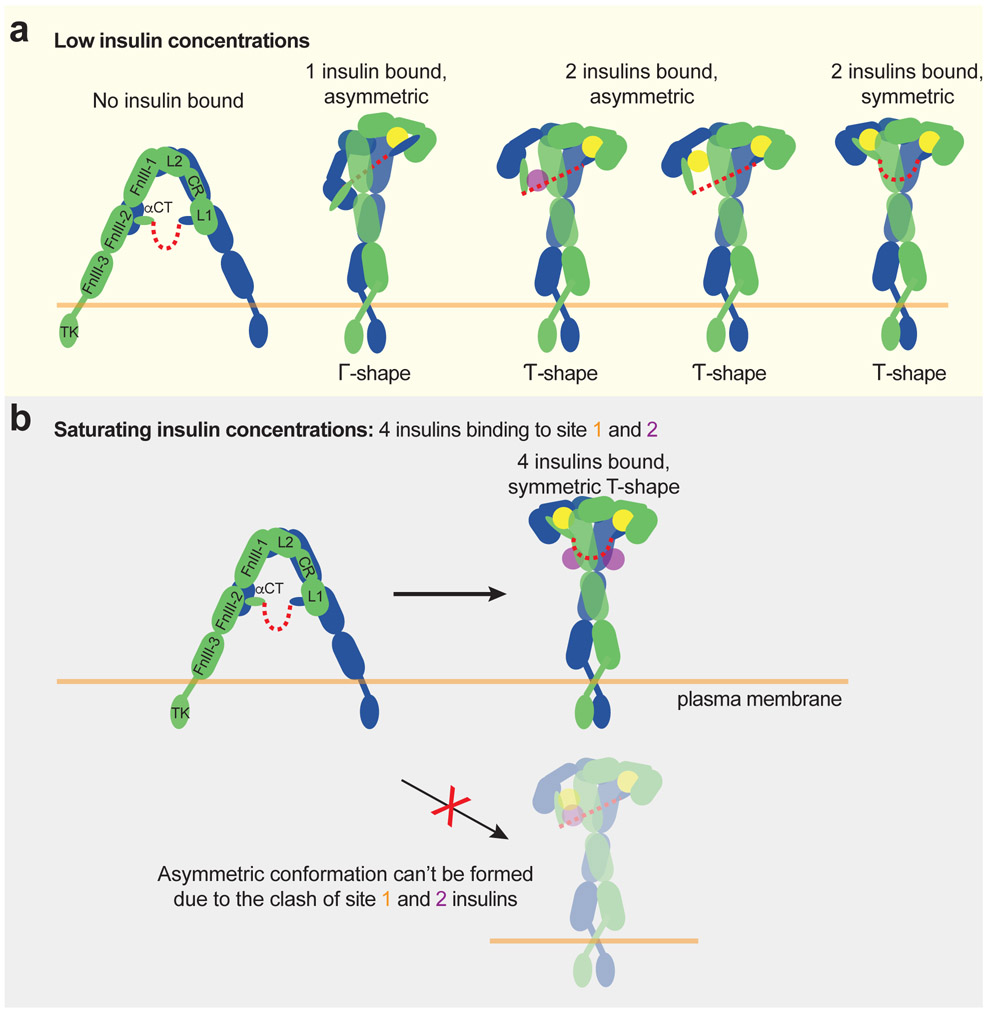
Our new structural and functional analyses of the IR/insulin LeuA13R and IR/insulin LeuB17R complexes, together with the partially liganded IR (Fig. 3, 4 and 6), provide mechanistic insights into the activation of the IR at various insulin concentrations (Fig. 7). Our cryo-EM results confirm that most particles are trapped in an asymmetric conformation when only one or two insulins are bound to the IR (Fig. 3, 4 and 6). The structural comparison between the apo- and asymmetric states suggests that, after the apo-state of IR is disrupted by one or two insulins binding to IR, a certain degree of IR activation could be achieved by a combination of inter-protomers rotation and intra-protomer hinge motion (Fig. 7a).
Figure 7. Working models for insulin-induced IR activation.
a. Insulin-induced IR activation in low insulin concentrations.
b. Insulin-induced IR activation in saturating insulin concentrations. The binding of multiple insulins to 2 distinct types of site-1 in apo-IR would trigger the structural transition of IR directly from Λ-shaped apo-form to T-shaped active form.
The binding of one insulin to the site-1 of apo-IR partially disrupts its auto-inhibited conformation, similar as seen in the IGF1-induced activation of IGF1R20(Fig. 6b). The released L1/α-CT motif (site-1a) together with bound insulin moves upward and subsequently makes strong interaction with top surface of FnIII-1 domain (site-1b) from the neighboring protomer, stabilizing the Γ-shaped IR dimer (Fig. 6b and 7a). In the bottom part of the asymmetric dimer, the unliganded L1 domain contacts both membrane-proximal domains, which places them in close proximity.
The binding of the second insulin to another site-1 in the Γ-shaped asymmetric IR dimer will release another L1/α-CT motif. The free L1/α-CT motif with bound insulin will undergo two different types of upward movement: (1) By long distance movement, it will reach the top surface of FnIII-1 domain (site-1b), and the IR will form T-shaped symmetric conformation (~20% of the particles); (2) By short distance movement, it will weakly interact the side surface of FnIII-1 domain (site-2), and the IR will form Ƭ-shaped asymmetric conformation (~80% of the particles) (Fig. 3, 4, and 7a). Strikingly, our results show that, in the middle part of the Ƭ-shaped dimer, the site-1 bound insulin could rotate around the α-CT motif by about 60-degrees and contact a side surface of FnIII-1 (site-2) (Fig. 6c, d; Extended Data Fig. 10c). In this conformation, insulin primarily binds at the site-2 of the IR but also contacts the α-CT motif of the adjacent site-1 (Fig. 6d). Thus, the Ƭ-shaped dimer could be crosslinked and stabilized by insulin via two different ways (Fig. 7a). In principle, insulin should prefer to bind site-1 than site-2, as site-1 has significantly higher insulin binding affinity16. Such alternative insulin binding between two distinct sites is made possible because the α-CT affiliated with the lower L1 domain of Ƭ-shaped IR dimer is shortened and assumes restricted conformation that likely causes reduced affinity for site-1 insulin binding (Fig. 6f; Extended Data Fig. 10b).
The activation model of IR in the fully liganded states
As noted above, the majority of particles that have one or two insulins bound adopts an asymmetric conformation, distinct from the T-shaped symmetric conformation induced by the binding of four insulins to both sites-1 and −2. This structural observation, combined with our functional data, implies that the binding of more than two insulins is necessary to overcome the energetic hurdle that allows IR to reach a more stable, fully active T-shaped conformation (Fig. 5).
Importantly, our new cryo-EM results provide a structural explanation for why IR cannot form an asymmetric conformation when four insulins are bound to both sites-1 and −2. As shown above, in the middle part of the Ƭ-shaped IR dimer with two insulin bound, one insulin is sandwiched between the site-1 of one protomer and site-2 of another protomer, in two different ways: (1) insulin primarily binds at site-1 but marginally contacts site-2 (conformation 1), or (2) insulin primarily binds at site-2 but marginally contacts site-1 (conformation 2) (Fig. 6c, d). The binding of another insulin to this hybrid site will certainly require the delocalization of the lower L1/α-CT domain to prevent the steric clashes between two insulins (Fig. 7a). Nevertheless, the two disulfide-linked α-CT motifs in the Ƭ-shaped IR dimer adopt a kinked and extended conformation (Fig. 6f; Extended Data Fig. 10b). Such stretched α-CT motifs will restrict the movement of lower L1 domain and thus prevent the binding of another insulin to this hybrid site (Fig. 7b). This explains why the T-shaped symmetric IR dimer is the only conformation captured in the cryo-EM datasets of IR in the presence of both insulin sites-1 and 2 mutants (Fig. 5) or saturated insulin WT14.
Summary
In conclusion, our structural and functional analyses provide a large body of information for defining the molecular mechanisms underlying the activation of IR that involve multi-sites insulin binding, and pave the way for the eventual therapeutic intervention of diseases caused by aberrant activation of the IR.
Methods
Mice
Animal work described in this manuscript has been approved and conducted under the oversight of the Columbia University Institutional Animal Care and Use Committee. All animals were maintained in a specific antigen-free barrier facility with 12hr light/dark cycles (6 a.m. on and 6 p.m. off). Mice were fed a standard rodent chow (Lab diet, #5053).
Cell Lines
FreeStyle™ 293-F
FreeStyle™ 293-F cells were obtained from Invitrogen (R79007). FreeStyle™ 293-F cells were cultured in FreeStyle™ 293 Expression Medium. FreeStyle™ 293-F cells were maintained in orbital shaker in 37°C incubator with a humidified atmosphere of 5% CO2.
293FT
293FT cells were obtained from Invitrogen (R70007). 293FT cells were cultured in high-glucose Dulbecco’s modified Eagle’s medium (DMEM) supplemented with 10% (v/v) fetal bovine serum (FBS), 2 mM L-glutamine, and 1% penicillin/streptomycin. 293FT cells were maintained in monolayer culture at 37°C and 5% CO2 incubator.
Sf9 cells
Spdoptera frugiperda (Sf9) cells were cultured in SF900 II SFM (Gibco) at 27°C with orbital shaking at 120 rpm.
Cell line validation
An aliquot of each cell line was passaged for only 3-4 weeks, after which a fresh batch of cells was thawed and propagated. No mycoplasma contaminations were detected.
Synthesis of Insulin Mutants
All standard solvents and reagents were obtained from Sigma-Aldrich unless otherwise specified, Fmoc-protected amino acid were purchased from New England Peptide, H-Rink-ChemMatrix resin (loading level: 0.47mmoml/g) from Gyros Technologies, trifluoroacetic acid (TFA) from EMD Millipore, piperidine from Alfa-Aesar, 1-hydroxy-6-chloro-benzotriazole (6-Cl-HOBt) from Creosalus-Advanced Chemtech, tri-isopropylsilane (TIS) from TCI. Lys-C endoprotease was obtained from Waco. Analytical chromatography was performed on an Agilent 1100 model system equipped with an auto sampler using Phenomenex columns as specified below. Preparative chromatography was conducted on a Waters Model 2525 binary pump system equipped with a Model 2487 absorbance detector.
The single-chain insulins (SCI) were synthesized as previously described in using a biomimetic single chain route 24,25. All six mutants as well as the WT are desB30 insulin sequences (ΔB30), lacking the C-terminal B-chain threonine, a residue that is not involved in the insulin-IR interaction. The 50-amino acid ‘mini-proinsulin’ sequences were assembled on 0.1mmol scale by automated solid-phase methods using an Applied Biosystems 433A synthesizer. A standard α-fluorenyl-methoxycarbonyl/t-butyl (Fmoc/tBu) based protecting group scheme was used with the following side chain protecting group scheme: Arg(Pbf), Asn(Trt), Asp(OtBu), Cys(Trt), Glu(OtBu), Gln(Trt), His(Trt), Lys(Boc), Ser(tBu), Thr(tBu), Tyr(tBu).The first residue, AsnA21 was incorporated by coupling Fmoc-Asp-α-OtBu-ester via its β-carboxyl side chain to the Rink-ChemMatrix support. The initial, and all subsequent coupling cycles utilized 6-Cl-hydroxybenztriazole (6-Cl-HOBt)/ diisopropylcarbodiimide (DIC) activation and 20% piperidine/DMF deprotection. Resin cleavage and side-chain deprotection were carried in 15ml of TFA containing 2% v/v of the following scavengers: water, thioanisole, 2-mercaptoethanol and TIS for 2 hours. The crude peptide was recovered by addition of excess cold diethyl ether, followed by several washes of the precipitate with diethyl ether and air drying. A typical synthesis yielded 450-500mg of crude linear peptide.
Oxidation/folding.
A typical procedure involved dissolving the crude peptide in of 25mM glycine buffer (pH 10.5) at a concentration of 1.0mg/ml, the addition of 20 equivalents each of cysteine hydrochloride and cystine (the latter pre-dissolved in a minimum amount of 1.0N NaOH). The pH was adjusted to 10.5 and the reaction was stirred and maintained at 4 °C overnight. The reaction was then acidified with 1.0N HCl to pH 2.0-2.5 and the peptide isolated by preparative HPLC chromatography using a Phenomenex Luna® 10μm C8(2) 250 x 21.2mm LC column and a 15-30%B gradient over 45 mins. The homogeneity of the purified peptides was assessed by analytical HPLC using a Phenomenex Gemini® 5μm C18 150 x 4.6mm analytical column and a linear gradient of 10-40%B over 30 minutes. The yields of the purified SCI peptides ranged from 10-12% based on the crude starting material.
Conversion of SCI to 2-chain insulins.
Enzymatic cleavage to two-chain insulins was achieved by dissolving 30mg of the SCI peptide in a minimal amount of ammonium bicarbonate buffer (25 mM, pH 8.0) and treating with 20 μg of Lys-C enzyme with incubation at 37 °C for two hours and overnight at room temperature. The resulting 2-chain insulin peptides were purified using a Phenomenex Luna® 5μm C8(2) 250 x 10mm LC semi-preparative column and a 15-30%B gradient over 45 mins. Homogeneity was confirmed by analytical chromatography and the molecular weight by high resolution mass spectrometry (HRMS) as described below, Extended Data Figure 1C.
MS/MS analysis
Samples were suspended in 10 μL of 5% (v/v) acetonitrile, 0.1% (v/v) trifluoroacetic acid and fractionated by direct injection on a Waters M-class Acquity column (BEH C18 column, 130 Å, 1.7 μm, 0.075 mm × 250 mm) at 0.3 μL min−1 using a nLC1000 (Thermo Scientific)26. Mobile phases used were (A) 0.1% formic acid aqueous and (B) 0.1% formic acid acetonitrile (ACN). Peptides were gradient eluted from 3 to 20% B in 24 min, 20 to 32% B in 5 min, and 32 to 85% B in 1 min. Mass spectrometry analysis was performed using an Orbitrap Fusion (Thermo Scientific). Samples were run in positive ion mode with a source spray of 1800V and an ion transfer tube temperature of 275 °C. MS1 scans were performed in the Orbitrap mass analyzer set to a mass range of 350–2000 m/z at a resolution of 120,000 and a target AGC of 4 × 10⁵.
Protein expression and purification
We used the amino acid numbering for IR starts after the signal peptide. The cDNA fragment of the short isoform of full-length mouse IR (NM_010568.3, MmIR, sharing 94% sequence homology with human IR) with kinase-dead mutation (D1122N) and IR substrates binding and endocytosis defective mutation (Y962F) was cloned into the pEZT-BM expression vector. The HRV-3C protease recognition sequence and the protein Tsi3 (T6SS secreted immunity protein three from Pseudomonas aeruginosa) which works as purification tag based on the high affinity of Tsi3-Tse3 protein, were fused to the C-terminus. MmIR was expressed in FreeStyle™ 293-F (Invitrogen, #R79007) cells using the BacMam system following the standard protocol. Briefly, the plasmid was transformed to E.coli strain DH10Bac to produce bacmid. Baculovirus was produced by transfecting bacmid to Sf9 cells. Protein was expressed in FreeStyle™ 293-F cells by infecting the virus at 1:10 (v:v) ratio. 6 hr after infection, 8 mM sodium butyrate was added to boost protein expression. The cells were cultured for 48-60 hr at 30 °C.
The cells were resuspended in lysis buffer A containing 40 mM Tris-HCl pH 8.0, 400 mM NaCl and protease inhibitor cocktail (Roche). The membrane fraction was obtained by ultracentrifuge the cell lysate for 1 hr at 100,000 g. 1% DDM was added with stirring to extract the MmIR from the membrane fraction. The solubilized protein was obtained by ultracentrifuge again for 1 hr at 100,000g. The supernatant was added with 1 mM CaCl2 and loaded to Tse3 protein conjugated Sepharose resin (GE Healthcare) by gravity flow. The resin was washed by wash buffer A (40 mM Tris-HCl, pH 8.0, 400 mM NaCl, 1 mM CaCl2, 5% glycerol, 0.08% DDM) and MmIR was eluted by HRV-3C protease cleavage. The protein was then run on Superose 6 increase 10/300 GL size-exclusion column (GE Healthcare) with buffer 20 mM Hepes-Na pH 7.4, 150 mM NaCl, 0.03% DDM. The dimer fraction was pooled and added with synthesized insulin mutants at ratio 1:4 (m:m), and with insulin WT at ratio 1:2. After incubation for half an hour, the protein was concentrated to 6 mg/ml for cryo-EM analyses. All the purification step were performed at 4 °C.
EM data acquisition
EM data acquisition, image processing, and model building, and refinement were performed following previous protocols with some modifications27.
The cryo-EM grid was prepared by applying 3 μl of the protein samples (4 – 6 mg/ml) to glow-discharged Quantifoil R1.2/1.3 300-mesh gold holey carbon grids (Quantifoil, Micro Tools GmbH, Germany). Grids were blotted for 4.0 seconds under 100% humidity at 4 °C before being plunged into the liquid ethane using a Mark IV Vitrobot (FEI). Micrographs were acquired on a Titan Krios microscope (FEI) operated at 300 kV with a K3 direct electron detector (Gatan), using a slit width of 20 eV on a GIF-Quantum energy filter. SerialEM 3.8 was used for the data collection 28. A calibrated magnification of 60,241 was used for imaging of IR/insulin ValA3E and IR/insulin ValA3E/insulin LeuA13R samples, yielding a pixel size of 0.83 Å on specimen. A calibrated magnification of 46,296 was used for imaging of IR/insulin LeuA13R and IR/insulin LeuB17R samples, yielding a pixel size of 1.08 Å on specimen. The defocus range was set from 1.6 μm to 2.6 μm. Each micrograph was dose-fractionated to 30 frames with a total dose of about 60 e−/Å2.
Image processing
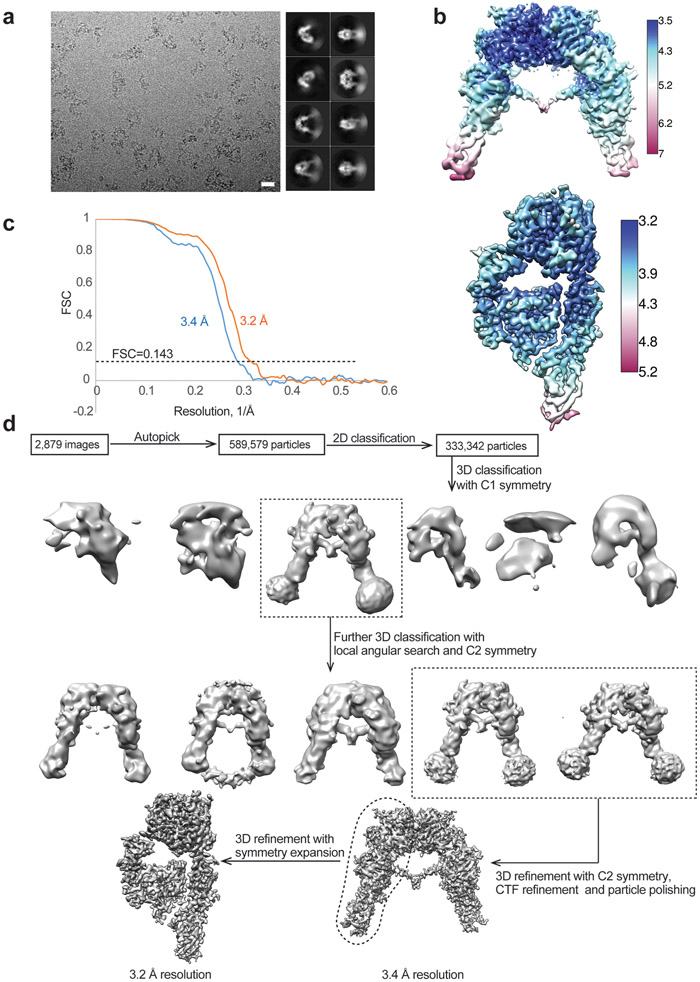
The cryo-EM refinement statists for all 4 datasets is summarized in Table 1. 2,879 movie frames of IR/insulin ValA3E micrographs were motion-corrected and binned two-fold, resulting in a pixel size of 1.08 Å, and dose-weighted using MotionCor2 29. The CTF parameters were estimated using Gctf 30. RELION3 was used for the following processing 31. Particles were first roughly picked by using the Laplacian-of-Gaussian blob method, and then subjected to 2D classification. Class averages representing projections of the IR/insulin ValA3E in different orientations were used as templates for reference-based particle picking. Extracted particles were binned three times and subjected to 2D classification. Particles from the classes with fine structural feature were selected for 3D classification using an initial model generated from a subset of the particles in RELION. Particles from one of the resulting 3D classes showing good secondary structural features were selected and re-extracted into the original pixel size of 1.08 Å. Subsequently, we performed finer 3D classification with C2 symmetry imposed by using local search in combination with small angular sampling, resulting two new good classes with improved density for the entire complex. The cryo-EM map after 3D refinement was resolved at 3.6 Å resolution, but the stalk region of the complex appeared blurred, suggesting relative swinging motions between two halves of the complexes. To improve the resolution, we performed C2 symmetry expansion and focused refinement as described previously 20. The modified particle set was subjected to another round of 3D refinement with a soft mask around one half of the complex, leading to a markedly improved resolution for the entire half complex to 3.2 Å.
Table 1.
CryoEM Data Collection and Refinement Statistics
| IR/insulin A- V3E |
IR/insulin A- L13R (symmetric) |
IR/insulin A- L13R (asymmetric) |
IR/insulin B- L17R (symmetric) |
IR/insulin B- L17R (asymmetric) |
IR/insulin A- V3E/insulin A- L13R |
IR/unsaturated insulin WT 2 insulins bound (symmetric) |
IR/unsaturated insulin WT 1 insulin bound (asymmetric) |
IR/unsaturated insulin WT 2 insulins bound (asymmetric, conformation 1) |
IR/unsaturated insulin WT 2 insulins bound (asymmetric, conformation 2) |
|
|---|---|---|---|---|---|---|---|---|---|---|
| EMD-25188 PDB: 7SL1 |
EMD-25190 PDB:7SL3 |
EMD-25189 PDB:7SL2 |
EMD-25192 PDB:7SL6 |
EMD-25191 PDB:7SL4 |
EMD-25193 PDB:7SL7 |
EMD-25428 PDB:7STH |
EMD-25429 PDB:7STI |
EMD-25430 PDB:7STJ |
EMD-25431 PDB:7STK |
|
| Data collection and processing | ||||||||||
| Magnification | 60,241 | 46,296 | 46,296 | 46,296 | 46,296 | 60,241 | 46,296 | 46,296 | 46,296 | 46,296 |
| Voltage (kV) | 300 | 300 | 300 | 300 | 300 | 300 | 300 | 300 | 300 | 300 |
| Electron exposure (e−/Å2) | 60 | 60 | 60 | 60 | 60 | 60 | 60 | 60 | 60 | 60 |
| Defocus range (μm) | 1.6 – 2.6 | 1.6 – 2.6 | 1.6 – 2.6 | 1.6 – 2.6 | 1.6 – 2.6 | 1.6 – 2.6 | 1.6 – 2.6 | 1.6 – 2.6 | 1.6 – 2.6 | 1.6 – 2.6 |
| Pixel size (Å) | 0.83 | 1.08 | 1.08 | 1.08 | 1.08 | 0.83 | 1.08 | 1.08 | 1.08 | 1.08 |
| Symmetry imposed | C2 | C2 | C1 | C2 | C1 | C2 | C2 | C1 | C1 | C1 |
| Initial particle images (no.) | 589,579 | 1,118,695 | 1,118,695 | 1,704,973 | 1,704,973 | 1,023,259 | 2,030,596 | 2,030,596 | 2,030,596 | 2,030,596 |
| Final particle images (no.) | 39,125 | 104,877 | 261,699 | 82,586 | 115,018 | 106,909 | 66,602 | 6,130 | 12,430 | 46,052 |
| Map resolution (Å) | 3.4 | 3.4 | 3.6 | 3.7 | 5 | 3.1 | 3.5 | 4.9 | 4.4 | 4 |
| FSC threshold | 0.143 | 0.143 | 0.143 | 0.143 | 0.143 | 0.143 | 0.143 | 0.143 | 0.143 | 0.143 |
| Refinement | ||||||||||
| Initial model used (PDB code) | 4ZXB | 6PXV | 6PXV, 4ZXB | 6PXV | 6PXV, 4ZXB | 6PXV | 6PXV | 6PXV | 6PXV | 6PXV |
| Model composition | ||||||||||
| Nonhydrogen atoms | 13,892 | 14,008 | 14,517 | 14,008 | 13,558 | 14,778 | 13,996 | 13,531 | 13,515 | 13,911 |
| Protein residues | 1,722 | 1,734 | 1,799 | 1,734 | 1,676 | 1,830 | 1,734 | 1,678 | 1,672 | 1,726 |
| Ligands | ||||||||||
| R.m.s. deviations | ||||||||||
| Bond lengths (Å) | 0.002 | 0.005 | 0.004 | 0.002 | 0.003 | 0.004 | 0.003 | 0.004 | 0.005 | 0.004 |
| Bond angles (°) | 0.624 | 0.7 | 0.589 | 0.577 | 0.607 | 0.697 | 0.544 | 0.659 | 0.696 | 0.572 |
| Validation | ||||||||||
| MolProbity score | 1.97 | 1.89 | 1.99 | 1.73 | 2.09 | 2.03 | 1.94 | 2.38 | 2.58 | 2.15 |
| Clashscore | 9.72 | 8.63 | 11.53 | 6.49 | 15.24 | 10.88 | 9.00 | 25.44 | 35.69 | 15.08 |
| Poor rotamers (%) | 0.06 | 0 | 0 | 0 | 0.07 | 0 | 0 | 0 | 0 | 0.06 |
| Ramachandran plot | ||||||||||
| Favored (%) | 92.79 | 93.42 | 93.75 | 94.59 | 93.98 | 92.35 | 92.64 | 92.12 | 90.10 | 92.64 |
| Allowed (%) | 7.21 | 6.46 | 6.25 | 5.18 | 5.9 | 7.49 | 7.36 | 7.75 | 9.84 | 7.07 |
| Disallowed (%) | 0 | 0.12 | 0 | 0.24 | 0.12 | 0.17 | 0 | 0.12 | 0.06 | 0.3 |
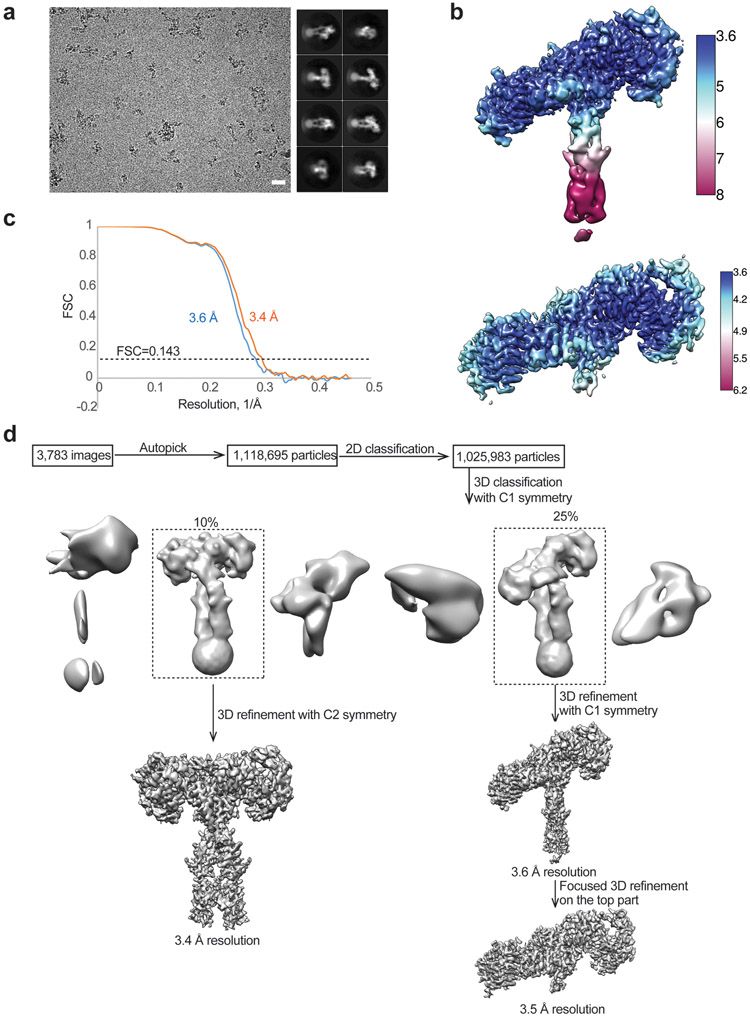
3,783 movie frames of IR/insulin LeuA13R micrographs were motion-corrected and binned two-fold, resulting in a pixel size of 1.08 Å, and dose-weighted using MotionCor2. CTF correction was performed using Gctf. Particles were first roughly picked by using the Laplacian-of-Gaussian blob method, and then subjected to 2D classification. Class averages representing projections of the IR/insulin LeuA13R complex in different orientations were used as templates for reference-based particle picking. A total of 1,118,695 particles were picked from 3,783 micrographs. Particles were extracted and binned by three times (leading to 3.24 Å/pixel) and subjected to another round of 2D classification. Particles in good 2D classes were chosen (1,025,983 in total) for 3D classification using an initial model generated from a subset of the particles in RELION3. After initial 3D classification IR/insulin LeuA13R particles set, two major classes were identified showing good secondary structural features (asymmetric and symmetric, respectively). Particles for asymmetric conformation or symmetric conformation were selected separately and re-extracted into the original pixel size of 1.08 Å. The final reconstructions of asymmetric-complex and symmetric-complex were resolved at 3.6 Å and 3.4 Å resolution, respectively. To improve the resolution for the top part in asymmetric-complex, we performed focused 3D refinement, by using a soft mask around the top region, leading to a 3D reconstruction at an overall resolution of 3.5 Å.
Movie frames of IR/insulin LeuB17R micrographs were motion-corrected and binned two-fold, resulting in a pixel size of 1.08 Å, and dose-weighted using MotionCor2. CTF correction was performed using GCTF. Particles were first roughly picked by using the Laplacian-of-Gaussian blob method, and then subjected to 2D classification. Class averages representing projections of the IR/insulin B-L17R complex in different orientations were used as templates for reference-based particle picking. A total of 1,704,973 particles were picked from 3,995 micrographs. Particles were extracted and binned by three times (leading to 3.24 Å/pixel) and subjected to another round of 2D classification. Particles in good 2D classes were chosen (1,580,944 in total) for 3D classification using an initial model generated from a subset of the particles in RELION3. After initial 3D classification IR/insulin LeuB17R particles set, one good class was identified showing good secondary structural features and asymmetric conformation. Subsequently, we performed finer 3D classification for the selected particles into 6 classes by using local search in combination with small angular sampling, resulting two different types of conformational states. One class shows prefect symmetric; whereas the other 5 classes show similar asymmetric conformation with structural variation in half of the complex. The final reconstructions of asymmetric-complex and symmetric-complex were resolved at 5 Å and 3.7 Å resolution, respectively.
A total of 1,023,259 particles were picked from 4,895 micrographs of IR/insulin ValA3E/insulin LeuA13R. 447,624 particles were selected by 2D classification. Subsequent 3D classification revealed one good class showing good density and symmetric conformation. 3D refinement of this class, along with CTF refinement and particle polishing, yielded a structure at 3.1 Å resolution. To improve the resolution for the top part in symmetric-complex, we performed focused 3D refinement, by using a soft mask around the top region, leading to a 3D reconstruction at an overall resolution of 2.8 Å.
3,635 movie frames of IR in the presence of subsaturated concentration of insulin WT were processed. Particles were first roughly picked by using the Laplacian-of-Gaussian blob method, and then subjected to 2D classification. Class averages representing projections of the IR/insulin WT complex in different orientations were used as templates for reference-based particle picking. A total of 2,030,569 particles were picked, and extracted and binned by three times (leading to 3.24 Å/pixel) and subjected to another round of 2D classification. Particles in good 2D classes were chosen (1,656,279 in total) for 3D classification using an initial model generated from a subset of the particles in RELION3. After initial 3D classification, one major class was identified showing good secondary structural features and asymmetric conformation. Particles from this good class were selected and re-extracted into the original pixel size of 1.08 Å. Subsequently, we performed finer 3D classification with C1 symmetry imposed by using local search in combination with small angular sampling, resulting two new good class showing symmetric and asymmetric conformations, respectively. The cryo-EM map of the symmetric conformation was resolved at 3.5 Å resolution after 3D refinement with C2 symmetry, CTF refinement and particles polishing. We performed another round of 3D classification for the asymmetric class, leading to the identification of three distinct conformations for the asymmetric particles. Among these three new classes, one of them has one insulin bound, but the other two have 2 insulins bound. The refinement of these three classes resolved three new cryo-EM maps at 4.9 Å, 4.4 Å and 4 Å resolution, respectively. Resolution was estimated by applying a soft mask around the protein density. The Fourier Shell Correlation (FSC) 0.143 criterion was used. Local resolution was calculated in RELION3.
Model building and refinement
Model buildings of IR/insulin ValA3E, IR/insulin LeuA13R, IR/insulin LeuB17R, IR/insulin ValA3E/insulin LeuA13R and IR/subsaturated insulin WT complexes were initiated by rigid-body docking of individual domains from the cryo-EM/crystal structures of L1, CR, L2, and FnIII1-3 domains of IR and insulin. Manual building was carried out using the program Coot 32. The model was refined by using the real-space refinement module in the Phenix package (V1.17) 33. Restraints on secondary structure, backbone Ramachandran angels, residue sidechain rotamers were used during the refinement to improve the geometry of the model. MolProbity 4.5 as a part of the Phenix validation tools was used for model validation (Table 1). Figures were generated in Chimera 1.14 34.
Primary hepatocytes isolation
Primary hepatocytes were isolated from 2-month-old female mice with a standard two-step collagenase perfusion procedure35,36. Following anesthesia, the inferior vena cava was cannulated, and the liver was perfused with Liver Perfusion Medium (Thermo Scientific, Cat. #17701038) using peristaltic pump (perfusion rate as 3 ml/min). After 1-2 sec upon appearance of white spots in the liver, we cut the portal vein with scissors to wash out blood, and then the liver was perfused with 30 ml of Liver Digest Medium (Thermo Scientific, Cat. #17703034). Dissected liver was gently washed with low glucose DMEM and transferred to sterile culture dish containing 15 ml Liver Digest Medium. The isolated liver cells were filtered through the 70 μm cell strainer into a 50 ml tube. After centrifuge at 50 g for 5 min at 4°C, cells were washed with cold low glucose DMEM three times. Cells were resuspended with attached medium [Williams’ Medium E supplemented with 5% (v/v) FBS, 10 nM insulin, 10 nM dexamethasone, and 1% penicillin/streptomycin] and plated on collagen (Sigma, #C3867)-coated dishes. After 2hr, the medium was changed to serum free low-glucose DMEM. After 14 hr, the cells were treated with insulin analogs to analyze IR signaling.
Insulin receptor activation and signaling assay
The insulin receptor activation and signaling assay were performed as described earlier with some modifications14. For the activation assay, the short isoform of human IR in pCS2-MYC was used as described previously14,35. Plasmid transfections into 293FT cells were performed with Lipofectamin™ 2000 (Invitrogen). One day later, the cells were serum starved for 14 hr and treated with the indicated concentrations of insulin analogs.
The insulin mutants-treated cells were incubated with the lysis buffer B [50 mM Hepes pH 7.4, 150 mM NaCl, 10% Glycerol, 1% Triton X-100, 1 mM EDTA, 100 mM sodum fluoride, 2 mM sodium orthovanadate, 20 mM sodium pyrophosphate, 0.5 mM dithiothreitol (DTT), 2 mM phenylmethylsulfonyl fluoride (PMSF)] supplemented with cOmplete Protease Inhibitor Cocktail (Roche) and PhosSTOP (Sigma) on ice for 1 hr. After centrifuge at 20,817 g at 4°C for 10 min, the concentrations of cell lysate were measured using Micro BCA Protein Assay Kit (Thermo Scientific). About 50 μg total proteins were analyzed by SDS-PAGE and quantitative Western blotting. The following antibodies were purchased from commercial sources: Anti-IR-pY1150/1151 (WB, 1:1000; 19H6; labeled as pY IR), anti-AKT (WB, 1:1000; 40D4), anti-pS473 AKT (WB, 1:1000; D9E), anti-ERK1/2 (WB, 1:1000; L34F12), anti-pERK1/2 (WB, 1:000; 197G2, Cell Signaling); anti-IR (WB, 1:500, CT-3, Santa Cruz; labeled as IR for primary hepatocytes); anti-Myc (WB, 1:2000; 9E10, Roche; labeled as IR for 293FT cells). For quantitative western blots, anti-rabbit immunoglobulin G (IgG) (H+L) (Dylight 800 conjugates) and anti-mouse IgG (H+L) (Dylight 680 conjugates) (Cell Signaling) were used as secondary antibodies. The membranes were scanned with the Odyssey Infrared Imaging System (Li-COR, Lincoln, NE). Levels of phosphorylation were normalized to total protein and shown as intensities relative to that in cells treated with 10 nM insulin WT for 10 min (Fig. 2f, g; Fig. 4d-g; Extended Data Fig. 1f, g; Extended Data Fig. 7) or 100 nM insulin WT for 1 min (Fig. 5c, d).
In vitro insulin-binding assay
In vitro insulin-binding assay was conducted as previously described37 with slight modifications (). Briefly, to conjugate insulin analogs with Alexa Fluor® 488 NHS Ester dissolved in dimethylsulfoxide (DMSO) at a molar ratio of 1:2 and incubated for 3 hr at 4°C. Labeled insulin analogs were separated from the free dye by size exclusion chromatography (Superdex 75 increase 10/300GL, GE Healthcare) in the buffer containing 20 mM Hepes pH7.4 and 150 mM NaCl.
To isolate IR WT in 293FT cells, plasmid transfection was performed with Lipofectamine™ 2000 (Invitrogen). One day later, the cells were serum starved for 14 hr. The cells were incubated with the lysis buffer B without DTT supplemented with cOmplete™ Protease Inhibitor cocktail (Roche) and PhosSTOP (Sigma) on ice for 1hr. After centrifugation at 20,817g at 4°C for 10 min, the concentrations of cell lysate were measured using Micro BCA Protein Assay Kit (Thermo Fisher Scientific). Cell lysates and anti-c-Myc magnetic beads (88842, Thermo Fisher Scientific, 250 ug of beads per 3 mg of total cell lysates) were incubated at 4°C for 2hr. The beads were washed two times with the washing buffer B [50 mM Hepes pH 7.4, 400 mN NaCl, 0.05% NP-40] supplemented with cOmplete™ Protease Inhibitor cocktail (Roche) and PhosSTOP (Sigma). The beads were washed once with binding buffer [20 mM Hepes pH 7.4, 200 mM NaCl, 0.03% DDM, and 0.003% CHS (Anatrace)] supplemented with cOmplete™ Protease Inhibitor cocktail (Roche) and 100 nM BSA and resuspended in 25 μl of the binding buffer. 7 μl of IR-bound beads and the indicated amount of Alexa Fluor® labeled insulin analogs were incubated on a rotator at 4°C for 1hr. For competition binding assay, 10 ul of IR site-2 mutant (K484E/L552A)-bound beads, 10 nM Alexa Fluor® labeled human insulin 14, and the indicated amount of insulin analogs were incubated on a rotator at 4°C for 1hr. The beads were washed two times with the binding buffer. The bound proteins were eluted with 50 μl of binding buffer containing 2% SDS at 50 °C for 10 min. The samples were diluted with 150 μl of binding buffer. The fluorescence intensities were measured in a microplate reader (Cytation 5; Biotek). Non-specific binding was measured in samples of Alexa Fluor® labeled insulin analogs with beads without IR and subtracted from the data. The levels of IR were analyzed by western blotting (Anti-Myc; WB, 1:2000; 9E10, Roche).
FnIII-1 expression and purification
The coding sequence of FnIII-1 domain (residues 460-596) from human insulin receptor with mutation (C468A, C524A, DFR496-498AAA) was optimized for expression in E.coli and subcloned into pET-28a with His tag and Sumo tag on N terminus. The mutation was designed to avoid the intermolecular disulfide bonds and disrupt the insulin binding site-1b 14. The protein was expressed in the E.coli strain BL21(DE3) overnight at 16 °C with 0.2 mM isopropyl β-D-1-thiogalactopyranoside (IPTG). The bacteria lysate in the buffer A containing 25 mM Tris-HCl, pH 7.5, 150 mM NaCl was loaded on Ni2+-Sepharose 6 Fast Flow resin (GE healthcare). The resin was washed with 10 column volume buffer A, followed by ULP1 enzyme cleavage to obtain FnIII-1 domain without tag. The protein was further purified by gel filtration chromatography with a Superdex 75 column in the buffer B containing (20 mM Hepes-Na, pH 7.5, 150 mM NaCl).
L1-CR-L2/α-CT expression and purification
The coding sequence of L1-CR-L2 domain (residues 1-468), linker GGSGSGSGGS, α-CT (residues 690-719) and His tag were inserted into pEZT-BM vector. This plasmid was transformed into the DH10Bac bacteria for production of bacmid DNA. Recombinant baculovirus was produced by transfecting Sf9 cells with the bacmid DNA using Cellfectin (Cellfectin Reagent, Invitrogen). Protein was expressed with FreeStyle™ 293-F cells by infecting the virus at a ratio 1:20 virus: cell (v/v). The infected cells were supplemented with 5 mM sodium butyrate to boost protein expression. The medium was collected after expression for 4 days at 37 °C and 8% CO2. The medium was filtered by 0.45 μm membrane (Millipore) and loaded directly onto Ni Sepharose excel resin (GE healthcare) by gravity flow. The resin was washed by 10 column volume of buffer A with 20 mM imidazole. After eluted from Ni resin by buffer A with 250 mM imidazole, the protein was further purified by gel filtration chromatography with a Superdex 200 column in the buffer B.
The isothermal titration calorimetry (ITC) assay
L1-CR-L2/α-CT and FnIII-1 domains, and insulin WT and mutants (ValA3E and LeuA13R) were dialyzed against same buffer containing 20 mM Hepes-Na, pH 7.5, 150 mM NaCl overnight at 4 °C. The titrations were carried out in an iTC200 calorimeter (Malvern, Malvern, UK) at 20 °C. For IR site1-insulin binding measurement, 21 injections (1 x 0.5 μl + 20 x 1.9 μl) of insulin (200 μM) were made into 20 μM L1-CR-L2/α-CT domains in the cell. For IR site2-insulin binding measurement, 21 injections (1 x 0.5 μl + 20 x 1.9 μl) of insulin (250 μM) were made into 25 μM FnIII-1 domain in the cell. The concentrations of L1-CR-L2/α-CT, FnIII-1 domain and insulin proteins (WT, ValA3E and LeuA13R) were determined by using extinction coefficients ε280nm of 56.320 mM−1cm−1, 37.930 mM−1cm−1 and 6.335 mM−1cm−1, respectively. Two titrations were performed per insulin sample. From the resulting thermograms, integrated isotherm data points and respective error bars were calculated using NITPIC 2.07 38 and were globally analyzed in Sedphat 15.2 39. The confidence intervals were obtained using the error-surface projection method 39. All ITC illustrations were rendered in GUSSI 40.
Insulin tolerance test
Insulin tolerance tests were performed as described previously 35,36. Briefly, mice were fasted for 2 hr and their blood glucose levels (T=0) were measured with tail bleeding using a glucometer (AlphaTRAK). After then, mice were injected intraperitoneally with insulin WT and mutants at 1 U per kg body weight (For Fig. 5f, 1.5U per kg body weight were used), and their blood glucose levels were measured at the indicated time points after injection.
Quantification and statistical analysis
Prism was used for the generation of graphs and for statistical analyses. Results are presented as mean ± s.d. or mean ± s.e.m. Two-tailed unpaired t tests were used for pairwise significance analysis. Mann-Whitney test, a non-parametric test, was used for insulin tolerance test analysis. Sample sizes were determined on the basis of the maximum number of mice and power analysis for sample sizes were not performed. Randomization and blinding methods were not used, and data were analyzed after the completion of all data collection in each experiment.
Extended Data
Extended Data Fig. 1. Domains of insulin receptor (IR) and activities of insulin analogs in primary mouse hepatocytes.
a. Domains and disulfide connectivity of IR. L1 and L2, leucine rich domains 1 and 2; CR, cysteine rich domain; F1, F2 and F3, fibronectin III (FnIII) domains; ID, insert in FnIII-2 domain; TM, transmembrane domain; TK, tyrosine kinase domain.
b. HPLC traces for each of the insulins synthesized and utilized for both functional and structural studies.
c. MS1 spectra of the purified insulins in B analyzed in the Orbitrap mass analyzer.
d. Binding of insulin WT and site-1 mutant (IleA2A;ValA3A) labeled with Alexa Fluor 488 to purified IR WT in the indicated conditions (Mean ± SD, WT, n=9 independent experiments; IleA2A;ValA3A, n=3). Significance calculated using two-tailed student t-test; **p<0.01 and ***p<0.001 (The exact p values are provided in the source data).
e. Insulin competition-binding assay for isolated FnIII-1 domain and insulin WT and mutants (ValA3E and LeuB17R) (Mean ± SD, n=3).
f. Insulin-induced IR autophosphorylation in 293FT cells expressing IR wild-type (WT). Cells were treated with the indicated insulin WT or site-2 mutants for 10 min. The IR autophosphorylation levels were assessed by quantitative western blotting with a phospho-tyrosine (pY) IRβ antibody. Expression levels of IRβ were monitored by anti-Myc blotting against the C-terminal Myc-tag.
g. Quantification of the western blot data shown in e (Mean ± SD). Each experiment was repeated four times. Significance calculated using two-tailed student t-test; *p<0.05; **p<0.01, ***p<0.001, and ****p<0.0001 (The exact p values are provided in the source data). Uncropped images for all blots and gels are available as source data.
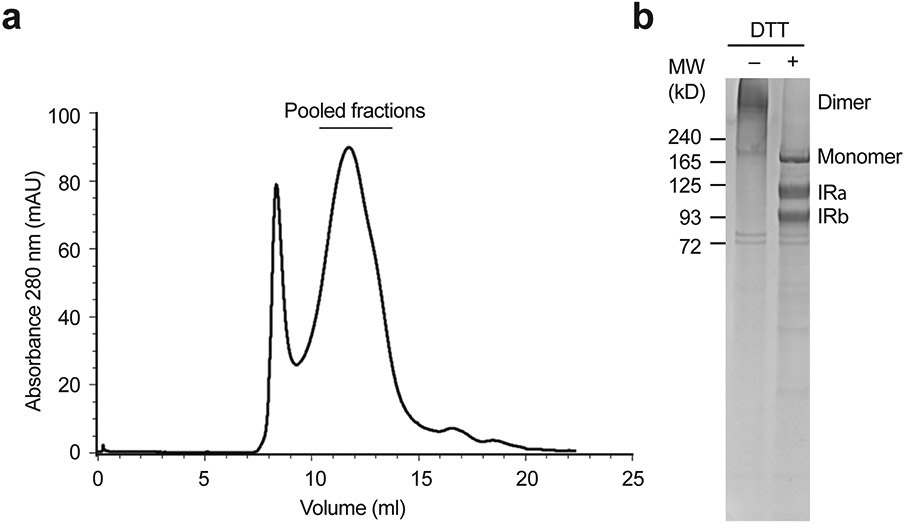
Extended Data Fig. 2. Purification of the full-length mouse insulin receptor (IR).
a. A representative size-exclusion chromatography of IR.
b. The peak fractions were combined and visualized on SDS-PAGE by Coomassie staining, in the absence or presence of dithiothreitol (DTT). Most of IR was processed into α-chain (IRα) and β-chain (IRβ). This experiment was repeated for 10 times independently with similar results.
Extended Data Fig. 3. Cryo-EM analysis of the IR-insulin site-1 mutant (ValA3E) complex.
a. Representative electron micrograph and 2D class averages of the IR-insulin site-1 mutant (ValA3E) complex. Scale bar: 200Å. This experiment was repeated for 2,879 times independently with similar results.
b. Unsharpened cryo-EM map colored by local resolution.
c. The gold-standard Fourier Shell Correlation (FSC) curve for the cryo-EM map shown in Fig. 2a.
d. Flowchart of cryo-EM data processing.
Extended Data Fig. 4. Cryo-EM analysis of the IR-insulin site-2 mutant (LeuA13R) complex.
a. Representative electron micrograph and 2D class averages of the IR-insulin site-2 mutant (LeuA13R) complex. Scale bar: 200Å. This experiment was repeated for 3,783 times independently with similar results.
b. Unsharpened cryo-EM map colored by local resolution.
c. The gold-standard Fourier Shell Correlation (FSC) curve for the cryo-EM map shown in Fig. 3a.
d. Flowchart of cryo-EM data processing.
Extended Data Fig. 5. Close-up view of asymmetric IR/insulin LeuA13R complex.
a. Overall view of asymmetric IR/insulin LeuA13R complex in two orthogonal views.
b. The close-up view of the contact of site-1 bound insulin LeuA13R at FnIII-1 domain in the asymmetric IR/insulin LeuA13R complex. The location of this interaction in the asymmetric dimer is indicated by a blue box in a.
c. The close-up view of the binding of a dimeric insulin at asymmetric IR/insulin LeuA13R complex. The location of this interaction in the asymmetric dimer is indicated by a red box in a.
Extended Data Fig. 6. Cryo-EM analysis of the IR-insulin site-2 mutant (LeuB17R) complex.
a. Representative electron micrograph and 2D class averages of the IR-insulin site-2 mutant (LeuB17R) complex. Scale bar: 200Å. This experiment was repeated for 3,995 times independently with similar results.
b. Unsharpened cryo-EM map colored by local resolution.
c. The gold-standard Fourier Shell Correlation (FSC) curve for the cryo-EM map shown in Fig. 4a.
d. Flowchart of cryo-EM data processing.
Extended Data Fig. 7. Insulin binding to site-2 of IR facilitates IR activation and signaling.
a. IR signaling in 293FT cells expressing IR wild-type (WT). Cells were treated with the 10 nM insulin WT and site-2 mutants for the indicated times. Cell lysates were blotted with the indicated antibodies.
b. Quantification of the western blot data shown in a (Mean ± SEM, For pY/IR, n=7 independent experiments; pAKT/AKT, n=4, pERK/ERK, n=6). Significance calculated using two-tailed student t-test; *p<0.05; **p<0.01, ***p<0.001, and ****p<0.0001 (The exact p values are provided in the source data).
c. IR signaling in primary mouse hepatocytes treated with the indicated concentrations of insulin for 10 min. Cell lysates were blotted with the indicated antibodies. Quantification of the western blot data shown in Fig. 4e.
d. IR signaling in primary mouse hepatocytes treated with 10 nM insulin for the indicated times. Cell lysates were blotted with the indicated antibodies. Quantification of the western blot data shown in Fig. 4g. Uncropped images for all blots and gels are available as source data.
Extended Data Fig. 8. Cryo-EM analysis of the IR-insulin site-1 (ValA3E) and site-2 (LeuA13R) mutants complex.
a. Representative electron micrograph and 2D class averages of the IR-insulin site-1 (ValA3E) and site-2 (LeuA13R) mutants complex. Scale bar: 200Å. This experiment was repeated for 4,895 times independently with similar results.
b. Unsharpened cryo-EM map colored by local resolution.
c. The gold-standard Fourier Shell Correlation (FSC) curve for the cryo-EM map shown in Fig. 5a, b.
d. Flowchart of cryo-EM data processing.
Extended Data Fig. 9. Cryo-EM analysis of the IR-insulin WT complex at subsaturated insulin concentrations.
a. Representative electron micrograph and 2D class averages of the IR-insulin WT complex at subsaturated insulin concentrations. Scale bar: 200Å. This experiment was repeated for 3,635 times independently with similar results.
b. Unsharpened cryo-EM maps colored by local resolution.
c. The gold-standard Fourier Shell Correlation (FSC) curve for the cryo-EM map shown in Fig. 6a-d.
d. Flowchart of cryo-EM data processing.
Extended Data Fig. 10. Close-up view of insulin, α-CT in asymmetric IR dimer and membrane proximal domains in asymmetric and symmetric IR dimer.
a. The close-up view of the contact of site-2 bound insulin at α-CT in the asymmetric IR/insulin complex.
b. Close-up view of α-CT in 1 and 2 insulins bound asymmetric IR dimer.
c. Superposition of the hybrid sites between the *****Ƭ-shaped asymmetric conformations 1 and 2, showing the rotation of insulin around the α-CT and two different insulin binding modes.
d. Close-up view of the membrane proximal domains in asymmetric and symmetric IR dimer.
e. Superposition between the membrane proximal domains in asymmetric and symmetric IR dimer.
Supplementary Material
Acknowledgements
Cryo-EM data were collected at the University of Texas Southwestern Medical Center (UTSW) Cryo-Electron Microscopy Facility, funded in part by the Cancer Prevention and Research Institute of Texas (CPRIT) Core Facility Support Award RP170644. We thank Dr. Stoddard for facility access. This work is supported in part by grants from the National Institutes Health (R01GM136976 to X.-C.B., R35GM142937, P30DK063608, and UL1TR001873 to E.C., AG061829 to M.H.B.S, R35GM130289 to X.Z), the Welch foundation (I-1944 to X.-C.B. and I-1702 to X.Z.), CPRIT (RP160082 to X.-C.B.), the MCDB Neurodegenerative Disease Fund (M.H.B.S), the T. Curtius Peptide Facility (M.H.B.S.) and the Alice Bohmfalk Charitable (to E.C.). X.-C.B. and X.Z. are Virginia Murchison Linthicum Scholars in Medical Research at UTSW.
Footnotes
Declaration of Interests
The authors declare no competing interests.
Data availability
All reagents generated in this study are available with a completed Materials Transfer Agreement. All cryo-EM maps and models reported in this work has been deposited into EMDB/PDB database, under the entry ID: EMD-25188/PDB 7SL1, EMD-25189/PDB 7SL2, EMD-25190/PDB 7SL3, EMD-25191/PDB 7SL4, EMD-25192/PDB 7SL6, EMD-25193/PDB 7SL7, EMD-25428/PDB 7STH, EMD-25249/PDB 7STI, EMD-25430/7STJ, and EMD-25431/7STK. Source data are provided with this paper.
References
- 1.Haeusler RA, McGraw TE & Accili D Biochemical and cellular properties of insulin receptor signalling. Nat Rev Mol Cell Biol 19, 31–44, doi: 10.1038/nrm.2017.89 (2018). [DOI] [PMC free article] [PubMed] [Google Scholar]
- 2.Ullrich A et al. Human insulin receptor and its relationship to the tyrosine kinase family of oncogenes. Nature 313, 756–761, doi: 10.1038/313756a0 (1985). [DOI] [PubMed] [Google Scholar]
- 3.White MF Insulin signaling in health and disease. Science 302, 1710–1711, doi: 10.1126/science.1092952 (2003). [DOI] [PubMed] [Google Scholar]
- 4.Boucher J, Kleinridders A & Kahn CR Insulin receptor signaling in normal and insulin-resistant states. Cold Spring Harb Perspect Biol 6, doi: 10.1101/cshperspect.a009191 (2014). [DOI] [PMC free article] [PubMed] [Google Scholar]
- 5.Petersen MC & Shulman GI Mechanisms of Insulin Action and Insulin Resistance. Physiol Rev 98, 2133–2223, doi: 10.1152/physrev.00063.2017 (2018). [DOI] [PMC free article] [PubMed] [Google Scholar]
- 6.Olefsky JM The insulin receptor: its role in insulin resistance of obesity and diabetes. Diabetes 25, 1154–1162, doi: 10.2337/diab.25.12.1154 (1976). [DOI] [PubMed] [Google Scholar]
- 7.Lawrence MC Understanding insulin and its receptor from their three-dimensional structures. Mol Metab, 101255, doi: 10.1016/j.molmet.2021.101255 (2021). [DOI] [PMC free article] [PubMed] [Google Scholar]
- 8.De Meyts P Insulin/receptor binding: the last piece of the puzzle? What recent progress on the structure of the insulin/receptor complex tells us (or not) about negative cooperativity and activation. Bioessays 37, 389–397, doi: 10.1002/bies.201400190 (2015). [DOI] [PubMed] [Google Scholar]
- 9.Ferguson KM, Hu C & Lemmon MA Insulin and epidermal growth factor receptor family members share parallel activation mechanisms. Protein Sci 29, 1331–1344, doi: 10.1002/pro.3871 (2020). [DOI] [PMC free article] [PubMed] [Google Scholar]
- 10.McKern NM et al. Structure of the insulin receptor ectodomain reveals a folded-over conformation. Nature 443, 218–221, doi: 10.1038/nature05106 (2006). [DOI] [PubMed] [Google Scholar]
- 11.Scapin G et al. Structure of the insulin receptor-insulin complex by single-particle cryo-EM analysis. Nature 556, 122–125, doi: 10.1038/nature26153 (2018). [DOI] [PMC free article] [PubMed] [Google Scholar]
- 12.Gutmann T, Kim KH, Grzybek M, Walz T & Coskun U Visualization of ligand-induced transmembrane signaling in the full-length human insulin receptor. J Cell Biol 217, 1643–1649, doi: 10.1083/jcb.201711047 (2018). [DOI] [PMC free article] [PubMed] [Google Scholar]
- 13.Weis F et al. The signalling conformation of the insulin receptor ectodomain. Nat Commun 9, 4420, doi: 10.1038/s41467-018-06826-6 (2018). [DOI] [PMC free article] [PubMed] [Google Scholar]
- 14.Uchikawa E, Choi E, Shang G, Yu H & Bai XC Activation mechanism of the insulin receptor revealed by cryo-EM structure of the fully liganded receptor-ligand complex. Elife 8, doi: 10.7554/eLife.48630 (2019). [DOI] [PMC free article] [PubMed] [Google Scholar]
- 15.Gutmann T et al. Cryo-EM structure of the complete and ligand-saturated insulin receptor ectodomain. J Cell Biol 219, doi: 10.1083/jcb.201907210 (2020). [DOI] [PMC free article] [PubMed] [Google Scholar]
- 16.Kristensen C et al. Alanine scanning mutagenesis of insulin. J Biol Chem 272, 12978–12983, doi: 10.1074/jbc.272.20.12978 (1997). [DOI] [PubMed] [Google Scholar]
- 17.Schaffer L A model for insulin binding to the insulin receptor. Eur J Biochem 221, 1127–1132, doi: 10.1111/j.1432-1033.1994.tb18833.x (1994). [DOI] [PubMed] [Google Scholar]
- 18.De Meyts P & Whittaker J Structural biology of insulin and IGF1 receptors: implications for drug design. Nat Rev Drug Discov 1, 769–783, doi: 10.1038/nrd917 (2002). [DOI] [PubMed] [Google Scholar]
- 19.Bai XC, Rajendra E, Yang G, Shi Y & Scheres SH Sampling the conformational space of the catalytic subunit of human gamma-secretase. Elife 4, doi: 10.7554/eLife.11182 (2015). [DOI] [PMC free article] [PubMed] [Google Scholar]
- 20.Li J et al. Cryo-EM analyses reveal the common mechanism and diversification in the activation of RET by different ligands. Elife 8, doi: 10.7554/eLife.47650 (2019). [DOI] [PMC free article] [PubMed] [Google Scholar]
- 21.Ciszak E & Smith GD Crystallographic evidence for dual coordination around zinc in the T3R3 human insulin hexamer. Biochemistry 33, 1512–1517, doi: 10.1021/bi00172a030 (1994). [DOI] [PubMed] [Google Scholar]
- 22.Kavran JM et al. How IGF-1 activates its receptor. Elife 3, doi: 10.7554/eLife.03772 (2014). [DOI] [PMC free article] [PubMed] [Google Scholar]
- 23.Xu Y et al. How ligand binds to the type 1 insulin-like growth factor receptor. Nat Commun 9, 821, doi: 10.1038/s41467-018-03219-7 (2018). [DOI] [PMC free article] [PubMed] [Google Scholar]
- 24.Tofteng AP, Jensen KJ, Schaffer L & Hoeg-Jensen T Total synthesis of desB30 insulin analogues by biomimetic folding of single-chain precursors. Chembiochem 9, 2989–2996, doi: 10.1002/cbic.200800430 (2008). [DOI] [PubMed] [Google Scholar]
- 25.Zaykov AN, Mayer JP, Gelfanov VM & DiMarchi RD Chemical synthesis of insulin analogs through a novel precursor. ACS Chem Biol 9, 683–691, doi: 10.1021/cb400792s (2014). [DOI] [PubMed] [Google Scholar]
- 26.Ball KA et al. An isothermal shift assay for proteome scale drug-target identification. Commun Biol 3, 75, doi: 10.1038/s42003-020-0795-6 (2020). [DOI] [PMC free article] [PubMed] [Google Scholar]
- 27.Uchikawa E, Chen Z, Xiao GY, Zhang X & Bai XC Structural basis of the activation of c-MET receptor. Nat Commun 12, 4074, doi: 10.1038/s41467-021-24367-3 (2021). [DOI] [PMC free article] [PubMed] [Google Scholar]
- 28.Mastronarde DN Automated electron microscope tomography using robust prediction of specimen movements. J Struct Biol 152, 36–51, doi: 10.1016/j.jsb.2005.07.007 (2005). [DOI] [PubMed] [Google Scholar]
- 29.Zheng SQ et al. MotionCor2: anisotropic correction of beam-induced motion for improved cryo-electron microscopy. Nat Methods 14, 331–332, doi: 10.1038/nmeth.4193 (2017). [DOI] [PMC free article] [PubMed] [Google Scholar]
- 30.Zhang K Gctf: Real-time CTF determination and correction. J Struct Biol 193, 1–12, doi: 10.1016/j.jsb.2015.11.003 (2016). [DOI] [PMC free article] [PubMed] [Google Scholar]
- 31.Zivanov J et al. New tools for automated high-resolution cryo-EM structure determination in RELION-3. Elife 7, doi: 10.7554/eLife.42166 (2018). [DOI] [PMC free article] [PubMed] [Google Scholar]
- 32.Emsley P, Lohkamp B, Scott WG & Cowtan K Features and development of Coot. Acta Crystallogr D Biol Crystallogr 66, 486–501, doi: 10.1107/S0907444910007493 (2010). [DOI] [PMC free article] [PubMed] [Google Scholar]
- 33.Liebschner D et al. Macromolecular structure determination using X-rays, neutrons and electrons: recent developments in Phenix. Acta Crystallogr D Struct Biol 75, 861–877, doi: 10.1107/S2059798319011471 (2019). [DOI] [PMC free article] [PubMed] [Google Scholar]
- 34.Pettersen EF et al. UCSF Chimera--a visualization system for exploratory research and analysis. J Comput Chem 25, 1605–1612, doi: 10.1002/jcc.20084 (2004). [DOI] [PubMed] [Google Scholar]
- 35.Choi E, Zhang X, Xing C & Yu H Mitotic Checkpoint Regulators Control Insulin Signaling and Metabolic Homeostasis. Cell 166, 567–581, doi: 10.1016/j.cell.2016.05.074 (2016). [DOI] [PMC free article] [PubMed] [Google Scholar]
- 36.Choi E et al. Mitotic regulators and the SHP2-MAPK pathway promote IR endocytosis and feedback regulation of insulin signaling. Nat Commun 10, 1473, doi: 10.1038/s41467-019-09318-3 (2019). [DOI] [PMC free article] [PubMed] [Google Scholar]
- 37.Li J, Choi E, Yu H & Bai XC Structural basis of the activation of type 1 insulin-like growth factor receptor. Nat Commun 10, 4567, doi: 10.1038/s41467-019-12564-0 (2019). [DOI] [PMC free article] [PubMed] [Google Scholar]
- 38.Keller S et al. High-precision isothermal titration calorimetry with automated peak-shape analysis. Anal Chem 84, 5066–5073, doi: 10.1021/ac3007522 (2012). [DOI] [PMC free article] [PubMed] [Google Scholar]
- 39.Brautigam CA, Zhao H, Vargas C, Keller S & Schuck P Integration and global analysis of isothermal titration calorimetry data for studying macromolecular interactions. Nat Protoc 11, 882–894, doi: 10.1038/nprot.2016.044 (2016). [DOI] [PMC free article] [PubMed] [Google Scholar]
- 40.Brautigam CA Calculations and Publication-Quality Illustrations for Analytical Ultracentrifugation Data. Methods Enzymol 562, 109–133, doi: 10.1016/bs.mie.2015.05.001 (2015). [DOI] [PubMed] [Google Scholar]
Associated Data
This section collects any data citations, data availability statements, or supplementary materials included in this article.
Supplementary Materials
Data Availability Statement
All reagents generated in this study are available with a completed Materials Transfer Agreement. All cryo-EM maps and models reported in this work has been deposited into EMDB/PDB database, under the entry ID: EMD-25188/PDB 7SL1, EMD-25189/PDB 7SL2, EMD-25190/PDB 7SL3, EMD-25191/PDB 7SL4, EMD-25192/PDB 7SL6, EMD-25193/PDB 7SL7, EMD-25428/PDB 7STH, EMD-25249/PDB 7STI, EMD-25430/7STJ, and EMD-25431/7STK. Source data are provided with this paper.


