

Abstract
This study aimed to determine the structural features between immature and mature articular cartilage from the humeral and femoral joints of rabbits. Specimens of articular cartilage (n = 6 for immature tissue, n = 6 for mature tissue) that were still attached to the underlying bone from a humerus (shoulder joint) or femur (knee joint) were imaged using microscopic MRI (µMRI) and polarized light microscopy (PLM). Quantitative µMRI data with a pixel resolution of 11.7–13.2 µm revealed a number of differences between the immature and mature cartilage, including total thickness, and T2 and T1ρ relaxation values. Quantitative PLM data with a pixel resolution of 0.25–1 µm confirmed the µMRI results and revealed additional differences in cellular features between the tissues. The mature cartilage had a clearly defined tidemark, which was absent in the immature tissue. The ability to differentiate specific maturation‐related cartilage characteristics could be beneficial to translational studies of degenerative diseases such as osteoarthritis.
Keywords: µMRI, articular cartilage, Collagen network, MRI relaxation anisotropy, optical angle and retardation, polarized light microscopy
Mature articular cartilage is thinner with a more clearly defined tidemark than immature articular cartilage. Based on MRI, shorter T2 values in mature cartilage demonstrated a tighter interaction between water and macromolecules as compared to immature cartilage tissue. Humeral cartilage was found to have a more classical three‐zone fibril structure as compared to femoral cartilage.

1. INTRODUCTION
Preclinical studies involving rabbit articular cartilage as the model of osteoarthritis have become increasingly important in recent years, because rabbit cartilage has structural similarities to human cartilage and bridges the gap between small and large animal models required for preclinical research (Kingfisher, Volume 1, No. 2). Structurally, articular cartilage, which is aneural and avascular (Fox et al., 2009), lines the ends of bones in joints to reduce friction and support weight bearing (Carballo et al., 2017). Compositionally, articular cartilage consists of a small number of chondrocytes and an extracellular matrix (ECM) that includes collagen (mostly type II), proteoglycans, non‐collagenous proteins, and water (Shah et al., 2007). The collagen fibers are the most abundant macromolecule in cartilage and define the depth‐dependent ultrastructure of the tissue. The chondrocytes are resident cells that play an exceptional role in maintenance, repair, and development of the ECM (Levin et al., 2005). Through specific biologic activities of the chondrocytes, there is a growth of articular cartilage in distinct regions of the tissue, which may be mediated through an increase in matrix volume fraction or an increase in cell volume fraction by proliferation or hypertrophy (Jadin et al., 2005; Williams et al., 2008).
Magnetic resonance imaging (MRI) has been employed in preclinical studies of articular cartilage (Xia, 2000; Xia et al., 2008). MRI is non‐invasive and can have sufficient resolution to detect localized lesions at different depths of cartilage (Wang et al., 2015). In this study, microscopic MRI (µMRI) was used to assess articular cartilage at high resolution (Wang & Xia, 2012). The imaging pulse sequences used in this study were able to quantify T2 and T1ρ relaxation at microscopic resolution. T2 relaxation measures the decay in phase coherence among the nuclear spins in the transverse plane. T1ρ measures the reduction of the macroscopic magnetization when it is locked along a transverse axis and is sensitive to slow motion interactions between water and macromolecular proteins in biological tissues (Wang & Xia, 2012). In addition to the non‐invasive imaging by µMRI, polarized light microscopy (PLM) has been used to study cartilage at higher resolutions, which can provide quantifiable information on the cartilage tissue optical retardation and angular orientations (Xia et al., 2001).
This study aimed to compare mature and immature articular cartilage quantitatively and qualitatively using different imaging techniques. Since the biomechanical properties of cartilage are maintained mostly by the ECM, tissue maturity is a significant factor that affects the biomechanical and biochemical properties of articular cartilage (Levin et al., 2005), which differ from fetal development to skeletal maturity (Xia et al., 2016). It is, therefore, important to know the structural features of cartilage during different stages of its growth and development. We used rabbit cartilage from shoulder (humerus) and knee (femur) joints in this study.
2. METHODS
2.1. Sample preparation
Shoulder and knee joints were obtained from New Zealand White Rabbits sacrificed from an unrelated biomedical study (the uses of animals were approved by the relevant institutional review committees). The intact carcasses were frozen immediately after sacrifice at −80°C and later thawed at 4°C before the joints were excised. Three immature rabbits aged 3–4 months and three mature rabbits aged 12–18 months were used in the study. From each animal, two cartilage‐bone specimens were harvested from both a humeral head (Figure 1a) and a femoral condyle (Figure 1b), which gave the total number of specimens of 12. Each specimen, measuring approximately 3×2×2 mm3 (Figure 1c), was immersed in saline with protease inhibitor (PI). The cartilage‐bone specimens were individually sealed in glass tubes with PI saline for µMRI. After µMRI, all specimens were used for histology.
FIGURE 1.

Photos of rabbit immature and mature joints. (a) Humeral heads from the shoulder joints and (b) femoral heads from the knee joints. (c) Several cartilage‐bone blocks were harvested from both humeri and femurs for high‐resolution imaging. The rectangular boxes in (a) and (b) indicate where the sample blocks were taken from the joint surfaces
2.2. µMRI Methods
The µMRI equipment used in this study was a Bruker AVANCE IIIHD 300 NMR spectrometer, which has a 7‐tesla, 89‐mm superconducting magnet, and a microscopic imager. All specimens were imaged individually for quantitative T2 and T1ρ relaxation times, with the normal axis of the specimen surface set at 0° and 55° with respect to the external magnetic field (B0). These two orientations correspond to the maximum and minimum influence of the dipolar interaction to spin relaxation, based on the characteristics of its geometrical factor (3cos2θ − 1) (Xia, 1998). The µMRI experiments used magnetization‐prepared imaging protocols (Xia, 1998), where the echo time (TE) in the 2D mapping segment was kept constant at 7.19 ms. The TE values used in the quantitative T2 experiments, and the spin‐lock durations used in quantitative T1ρ imaging, are summarized in Table 1. The slice thickness was 0.8 mm and the repetition time (TR) was 1800 ms in both T2 and T1ρ imaging at all orientations. The field of view (FOV) was 3.4×3.4 mm for all specimens with the exception of mature femoral specimens, for which it was 3×3 mm. The 2D matrix was 256×128, which was reconstructed into 256×256 during quantitative analysis. These imaging parameters gave a pixel resolution for all cartilage specimens of 13.2 µm, with the exception of mature femoral cartilage at 11.7 µm. T1ρ imaging was carried out at the spin‐lock field of 2 kHz. The choice of 2 kHz was based on our previous studies on T1ρ (Wang & Xia, 2012), where the measurement was found to be approximately isotropic (hence less susceptible to the orientational differences of the specimens).
TABLE 1.
Echo Times (TE) used in quantitative T2 and T1ρ imaging experiments
| Cartilage | Orientation | T2 experiments | T1ρ experiments (spin‐lock = 2 kHz) | ||
|---|---|---|---|---|---|
| Immature TE (ms) | Mature TE (ms) | Immature TE (ms) | Mature TE (ms) | ||
| Humeral | 0° | 2, 8, 16, 24 | 2, 6, 10, 14 | 2, 16, 46, 80 | 2, 16, 46, 60 |
| 55° | 2, 16, 46, 60 | 2, 16, 46, 60 | 2, 16, 46, 80 | 2, 16, 46, 60 | |
| Femoral | 0° | 2, 8, 16, 32 | 2, 4, 10, 12 | 2, 16, 46, 60 | 2, 16, 46, 60 |
| 55° | 2, 16, 28, 40 | 2, 8, 16, 32 | 2, 16, 46, 60 | 2, 16, 46, 60 | |
2.3. PLM methods
All cartilage‐bone specimens after µMRI were fixed in 10% buffered formalin and sent to Yale Pathology Tissue Services (New Haven, CT) for histological services. The paraffin method was used to treat the specimens; three 6‐µm thick sections were made from each specimen. Histological sections were made on all specimens so that the histology slices coincided with the µMRI slices. All sections were imaged using a PLM system that consists of a digital imaging attachment mounted on a polarized light microscope (Xia et al., 2001). Imaging with 10x and 40x objectives produced 2D images with a pixel resolution of 1 µm and 0.25 µm, respectively. The final results from each PLM imaging were one pair of quantitative 2D images of optical retardation and angular orientation for each section (Oldenbourg and Mei, 1995).
2.4. Data analysis
1D cross sectional profiles were generated from 2D µMRI and PLM images, from the selected regions of interest (ROI) using the public domain software Image J (version 1.52a). The ROI was taken in such a way that similar locations from the PLM and µMRI images were used. 10 and 132 parallel neighboring columns on quantitative 2D images from µMRI and PLM were used to generate the 1D profiles. Depth‐dependent profiles with standard deviations were made using KaleidaGraph (version 4.5.4), whose student t‐test function was used for statistical analysis between µMRI and PLM data. A t‐probability <0.05 was considered significant. The established tissue‐sub‐division criteria were used to determine the zonal thicknesses (Xia et al., 2001; Lee & Xia, 2013).
3. RESULTS
3.1. Quantitative T2 and T1ρ Maps in µMRI
Figure 2 summarizes the µMRI results for both mature and immature tissues, where the laminar appearance of cartilage can be seen in all samples when their orientations are at 0° with respect to the external magnetic field B0. For immature cartilage at 0°orientation, cartilage and bone are visible in both humeral and femoral tissues (Figure 2a,c). For mature cartilage at 0° orientation, however, it is difficult to distinguish the deep cartilage from the bone in both humeral and femoral tissues (Figure 2b,d), even at the shortest TE (2 ms). When the tissue is oriented at 55° to the external magnetic field (i.e., at the magic angle), all cartilage samples appear homogenous as a result of the minimization of the dipolar interaction. Furthermore, when all imaging parameters are equal, the image intensity of mature tissue is lower than the intensity of immature tissue.
FIGURE 2.

MRI images of immature (a, c) and mature (b, d) cartilage blocks from humeri (a, b) and femurs (c, d) at 0° and 55°° orientations to the magnetic field (B0), which points vertically up, respectively. The first four columns contain T2 weighted intensity images, while the last column contains the calculated T2 images. All relevant images are plotted on the same gray scale
From the quantitative T2 and T1ρ images in Figure 2, the depth‐dependent relaxation profiles of the humeral cartilage were extracted and compared in Figure 3, between immature and mature tissues. Several features of these profiles can be noted. First, the mature cartilage is about 25% thinner (based on Tables 2 and 3) than the immature cartilage. Second, the mature cartilage has lower T2 and T1ρ values than the immature cartilage, which is the reason why it is difficult to distinguish the deep cartilage from the bone in both humeral and femoral tissues in µMRI (Figure 2b,d). Third, T2 profiles of both mature and immature cartilage (Figure 3a,b) have a similar magic angle effect, which has a sharp peak at about 50 µm below the articular surface when the specimens were oriented at 0°. In comparison, the T2 profiles of both mature and immature cartilage lost this peak when the specimens were oriented at the magic angle (~55°). This T2 anisotropy feature is similar to what has been observed in cartilage from large animals such as canines. Finally, the T1ρ profiles at 2 kHz spin‐lock frequency do not have a significant difference between the 0° and 55° profiles, and both have higher values than the corresponding T2 profiles.
FIGURE 3.
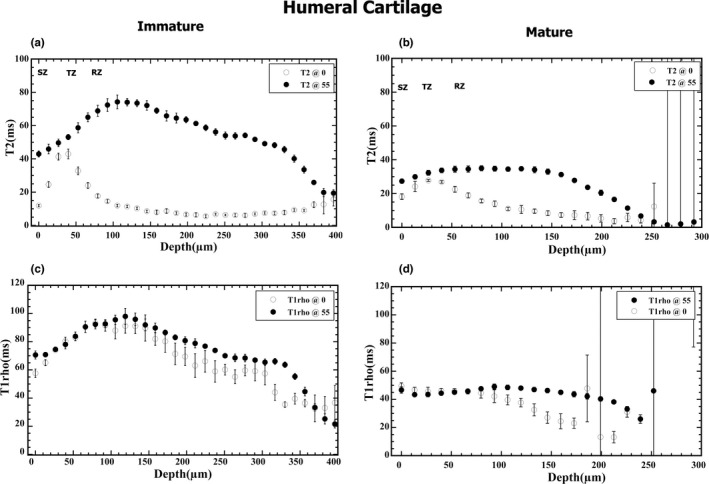
T2 (a, b) and T1ρ (c, d) depth‐dependent profiles of immature (a, c) and mature (b, d) cartilage of the humerus at 0° and 55° orientations to B0, respectively. Note that each of these profiles was from a single image, where 10 and 132 parallel neighboring columns on quantitative images were averaged to generate the 1D profiles. The error bars were from the column averaging
TABLE 2.
Averaged zonal thicknesses based on T2 profiles. σ represents the standard error. % is the relative percent thickness of each zone based on the total tissue thickness
| Cartilage specimens | Superficial zone (µm) | Transitional zone (µm) | Radial zone (µm) | Total thickness (µm) |
|---|---|---|---|---|
| Humeral | ||||
| (A) Immature | ||||
| 23LS | 26.4 | 52.8 | 303.6 | 382.8 |
| 13RS | 26.4 | 26.4 | 250.8 | 303.6 |
| 18RS | 39.6 | 39.6 | 264.0 | 343.2 |
| Mean ± σ | 30.8 ± 4.4 | 39.6 ± 7.6 | 272.8 ± 115.9 | 343.2 ± 22.9 |
| % | 9 | 12 | 79 | 100 |
| (B) Mature | ||||
| 1305LS | 26.4 | 26.4 | 198.0 | 237.6 |
| 1305RS | 13.2 | 39.6 | 184.8 | 250.8 |
| BMH3LS | 11.7 | 35.1 | 234.0 | 280.8 |
| Mean ± σ | 17.1 ± 4.7 | 33.7 ± 3.9 | 205.6 ± 14.7 | 256.4 ± 12.7 |
| % | 7 | 13 | 80 | 100 |
| Femoral | ||||
| (C) Immature | ||||
| 16RF | 26.4 | 39.6 | 330.0 | 396.0 |
| 11RF | 35.1 | 35.1 | 234.0 | 304.0 |
| 16LF | 29.1 | 48.5 | 388.0 | 465.0 |
| Mean ± σ | 30.2 ± 2.6 | 41.1 ± 3.9 | 317.0 ± 44.9 | 388.3 ± 46.7 |
| % | 8 | 11 | 81 | 100 |
| (D) Mature | ||||
| 1305LF | 11.7 | 23.4 | 175.5 | 210.6 |
| BMH3LF | 23.4 | 35.1 | 198.9 | 187.2 |
| BMH3RF | 23.4 | 35.1 | 128.7 | 163.8 |
| Mean ± σ | 19.5 ± 3.9 | 31.2 ± 3.9 | 167.7 ± 20.6 | 218.0 ± 20.6 |
| % | 9 | 14 | 79 | 100 |
TABLE 3.
Correlations of average total thickness in mature and immature tissues between MRI and PLM
| µMRI total thickness (µm) | PLM total thickness (µm) | t probability | |
|---|---|---|---|
| (A) Humeral Cartilage | |||
| Immature | 343.2 ± 22.9 | 381.0 ± 31.0 | 0.53 |
| Mature | 256.4 ± 12.7 | 259.0 ± 9.0 | 0.73 |
| t probability | 0.2 | 0.06 | |
| (B) Femoral Cartilage | |||
| Immature | 388.0 ± 46.7 | 410.0 ± 10.0 | 0.65 |
| Mature | 218.0 ± 20.6 | 249.0 ± 31.0 | 0.38 |
| t probability | 0.01 | 0.04 | |
Figure 4 shows the depth‐dependent T2 and T1ρ profiles of the femoral cartilage from the knee joints, comparing immature and mature tissues. Nearly identical features can be found in the femoral cartilage, with one exception. In humeral cartilage (Figure 3), the peaks of the T2 0° profiles reach the values of the corresponding T2 55° profiles. The peaks of the T2 0° profiles in the femoral cartilage, in contrast, did not reach the values of the corresponding T2 55° profiles. The error bars in these quantitative plots (Figures 3 and 4) come from the depth‐dependent row‐averaging in data analysis, where the large error bars in the deep cartilage merely mean there were some miscalculated T2 or T1ρ values within the adjacent rows, commonly occurring at the regions where cartilage interfaces irregularly with the bone.
FIGURE 4.

T2 (a, b) and T1ρ (c, d) depth‐dependent profile of immature (a, c) and mature (b, d) cartilage of femurs at 0° and 55° orientations B0, respectively. (Each of these profiles was from a single image, as in Figure 3)
The zonal thicknesses in these cartilage specimens are summarized in Table 2. The zonal averaged T2 relaxation times are summarized in Table 4. From Table 2, the superficial zones and transitional zones of the immature cartilage show a slight increase in thickness as compared to mature cartilage in both humeral and femoral articular cartilage. When compared with the mature cartilage of both cartilage types, one notices a significant increase in the relative thickness of the radial zone in immature cartilage for both cartilage types (about an average of 27% increment). At 0°, the transitional zones in the immature cartilage types are seen to have increased T2 values as compared to the mature cartilage types with varied T2 values for the rest of the zones (Table 4). Also at 55°, there is a general increase in T2 values in the immature cartilage types in all zones as compared to the mature cartilage types.
TABLE 4.
Zonal averaged T2 and T1ρ values of cartilage based on the orientation‐dependent profiles shown in Figures 3 and 4
| T2 (ms) | T1ρ (ms) | |||||||
|---|---|---|---|---|---|---|---|---|
| Immature | Mature | Immature | Mature | |||||
| 0° | 55° | 0° | 55° | 0° | 55° | 0° | 55° | |
| (A) Humeral cartilage | ||||||||
| SZ | 17.0 ± 1.7 | 57.3 ± 6.9 | 20.4 ± 6.6 | 44.5 ± 10.9 | 59.65 ± 1.7 | 70.2 ± 1.4 | 47.0 ± 4.9 | 45.0 ± 1.6 |
| TZ | 35.5 ± 3.4 | 49.7 ± 3.5 | 24.80 ± 6.89 | 46.43 ± 10.1 | 82.4 ± 3.4 | 81.6 ± 2.5 | 45.2 ± 1.9 | 47.0 ± 0.3 |
| RZ | 8.95 ± 0.4 | 49.0 ± 5.0 | 8.6 ± 1.7 | 36.43 ± 6.4 | 67.0 ± 3.2 | 76.8 ± 3.4 | 35.4 ± 1.7 | 42.5 ± 2.5 |
| (B) Femoral cartilage | ||||||||
| SZ | 33.8 ± 5.4 | 77.5 ± 6.4 | 16.3 ± 2.1 | 32.7 ± 9.5 | 129.6 ± 7.1 | 147.9 ± 2.8 | 54.0 ± 0.8 | 63.1 ± 1.4 |
| TZ | 47.8 ± 11.6 | 68.2 ± 1.3 | 19.0 ± 2.3 | 37.6 ± 8.0 | 138.6 ± 3.2 | 149.8 ± 7.8 | 57.9 ± 2.1 | 65.8 ± 1.4 |
| RZ | 10.50 ± 2.9 | 54.4 ± 12.4 | 10.9 ± 1.0 | 39.2 ± 3.5 | 107.8 ± 10.5 | 136.5 ± 2.0 | 39.2 ± 3.0 | 62.8 ± 6.0 |
3.2. Quantitative retardation and angle maps in PLM
Figure 5 shows the 2D angle and retardation images and their depth‐dependent profiles of humeral cartilage, comparing immature and mature tissues. In these types of quantitative angle images, the blue and red colors represent the fibril orientations that are 90° apart. One can see that both immature and mature cartilage have a well‐recognized fibril transition of ~90° between the surface fibers and the deep fibers, which is consistent with similar data from large animals. In the quantitative retardation images, larger values mean better organization among the fibers. One can easily tell that the retardation profiles of mature cartilage in rabbits have features that are consistent with mature tissue from larger animals such as canines, which have the lowest dip at 50 µm below the articular surface, representing the middle of the transitional zone. At the same time, the peak at the deep tissue, about 300 µm in‐depth, represents the tidemark that separates the uncalcified cartilage from the rest of the deep tissue that interfaces with the subchondral bone. In comparison, the retardation profile of the immature cartilage has an ill‐defined dip in the transitional zone and no clear tidemark in the deep tissue. Similar observations can be found in femoral cartilage when comparing immature and mature tissues, as shown in Figure 6.
FIGURE 5.

2D angle and retardation images (a, c) of immature and mature humeral cartilage and their depth‐dependent profiles (b, d). The rectangular boxes on 2D images indicate where the regions of interest (ROI) were taken for the profile analysis
FIGURE 6.

2D angle and retardation images (a, c) of immature and mature femoral cartilage and their depth‐dependent profiles (b, d). The rectangular boxes on 2D images indicate where the regions of interest (ROI) were taken for the profile analysis
The thicknesses of the cartilage as measured by µMRI and PLM are summarized in Table 3. In general, there were large differences in thickness between the immature and mature tissue, for both humeral and femoral cartilage. Statistically, the t‐probabilities are significant for the differences between the immature and mature femoral tissues by µMRI and PLM (t‐probability <0.05), while those for humeral cartilages were weaker.
Figure 7 shows a selection of the higher resolution angle and retardation images obtained by the 40x objective (hence 0.25 µm per pixel), from the same tissue sections shown in Figures 5 and 6, on which the cellular structures are now visible. Since the particular histology procedure did not preserve the cellular details, the black ‘holes’ inside the articular cartilage in the retardation images are the locations where the cells and cell clusters used to reside. (The same cellular regions are not obviously recognizable in the angle images due to the algorithm in the quantitative calculation). Several features can be identified from these high‐resolution optical images. First, there is a clear difference in the sizes of cells or cellular clusters between the surface tissue and the deep tissue, where the cellular sizes are smaller in the surface tissue. Second, since the long axis of the cell and cell clusters follow the fibril orientation of the territorial matrix in cartilage, one can easily determine a 90° zonal orientation of the collagen fibers in the arched territorial matrix by the orientation of the cellular clusters between the surface tissue and deep tissue. Finally, higher retardation values can be found in the proximity of cells and cellular clusters, which indicates the presence of a cocoon‐shaped fibril structure surrounding each cell or each group of cells. (The same cocoon‐shaped fibril structure could also be seen if we enlarge the quantitative angle images, in which the values of the fibril angle change in the order of blue‐white‐red‐black colors.)
FIGURE 7.

(a) and (b) are 2D angle images, and (c) and (d) are retardation images of the same cartilage sections at higher resolution (0.25 µm per pixel) for both humeral (a, c) and femoral (b, d) cartilage. The arrows indicate estimate of tidemarks
4. DISCUSSION
The development of articular cartilage involves the formation of specific structural patterns in cellular organization (Flandry & Hommel, 2011) and other tissue components such as the collagen network and proteoglycans. The high‐resolution imaging modalities used in this study allow us to determine the structure of cartilage through their cells and the ECM components.
4.1. Immature vs. mature cartilage
In both humeral and femoral cartilage, the immature cartilage viewed from the joint had a translucent, dark‐pinkish appearance as compared to mature cartilage, which appeared more solid and bright pink (Figure 1). This might be from depletion of iron in mature tissues resulting from an increased level of hepcidin (Fairweather‐Tait et al., 2014).
The MRI images from the mature cartilage appeared darker in intensity than the immature tissue, even at the shortest echo time of 2 ms (Figure 2b,d). From the point of view of MRI, the dark images were due to the short T2 values in the tissue, which were evident from the T2 profiles (Figures 3 and 4), where the T2 of mature cartilage had lower values than the immature cartilage. Since T2 is sensitive to the motional dynamics of water molecules in the tissue, which is determined by the interactions between water and macromolecules (proteoglycans and collagen fibers), short T2 means tight interactions between water and macromolecules. This conclusion is supported by the PLM retardation images and profiles (Figures 5 and 6), where the retardation of the mature cartilage is about 50% higher than the immature cartilage. Since the retardation values in PLM are proportional to the fibril content (concentration, packing density, etc.) in cartilage, our imaging data collectively demonstrated that the mature cartilage has higher fibril content than the immature cartilage, which is consistent with the previous results (Jadin et al., 2005).
The second MRI parameter used in this study, T1ρ relaxation time, is known to be sensitive to a different aspect of molecular motion, which has motion frequencies in the range of tens of kHz, higher than those influencing the T2 relaxation. In this study, for the same tissue, T1ρ relaxation time behaved as expected, which included having values higher than the corresponding T2 relaxation, and having little anisotropy between 0° and 55° when the spin‐lock frequency was at 2 kHz (Wang & Xia, 2011). Comparing T1ρ data between the immature and mature tissues, however, we see that the immature tissue had higher T1ρ values, which is consistent with T2 values being higher in the immature tissues (i.e., more water, less organized fibril structure).
PLM is the gold standard in the studies of collagen‐rich connective tissues such as articular cartilage (Alhadlaq et al., 2007). In our digital setup, two quantitative images are calculated for each tissue section on a pixel‐by‐pixel basis, which generates a 2D map of retardation that quantifies the collagen organization, and a 2D map of angle that quantifies the collagen orientation (Xia et al., 2001). The retardation profile in the mature tissue had a nearly linear increase from its lowest point (which is the middle of the transitional zone) toward the cartilage‐bone interface, where the peak in the deep cartilage signals the tidemark (c.f., Figures 5 and 6). This feature is similar to what has been observed in other large animals (Lee & Xia, 2013). The retardation profile in immature tissue, although also had a near linear increase from its lowest point toward the cartilage‐bone interface, had a less steep profile (hence less variation in fibril organization) and lacked a clearly recognizable peak in the deep cartilage (which signals the tidemark). These differences show the tissue maturation process under the adaptive use of joints for load bearing (Williamson et al., 2001).
4.2. Femoral vs. humeral cartilage
Despite various differences between mature and immature cartilage, the femoral cartilage showed more differences compared to the humeral cartilage. In both mature and immature humeral cartilage (Figure 3), the T2 0° peaks in the transitional zone reached the T2 55° values, which can be explained by the classical three‐zone fibril structure and are consistent with the characteristics of other mature cartilage such as from canines (Xia et al., 2001). In contrast, in both mature and immature femoral cartilage (Figure 4), the peak values of the T2 0° profiles (which occur in the middle of the transitional zone) did not reach the peak values of the T2 55° profiles, which show the morphological differences between the two kinds of cartilage (humeral vs femoral). Consequently, the minimization of the dipolar interaction in µMRI at the magic angle (55°) was not able to remove completely the influence of the relaxation characteristics in femoral cartilage. Further experiments are needed to differentiate the various physical mechanisms that influence the spin relaxation in femoral cartilage.
In addition, while humeral cartilage has a set of features more consistent and uniform over the joint surface, femoral cartilage has more variation. For example, comparing Figures 5 and 6, one can see that even over the length of the specimen, the image and profiles of the femoral cartilage have different features between the left and right end of the specimen (merely 3 mm in length). These differences between humeral and femoral cartilage might be the consequence of different loading patterns of the individual joints during the maturation.
4.3. µMRI vs. PLM
Two different microscopic imaging techniques were used in this study. Based on the same physics principles as in clinical MRI, µMRI is extremely sensitive to different molecular motions in soft tissues, which can be quantified by the relaxation times. In comparison, PLM is the gold standard in histology and capable of quantifying the fibril organization and orientation based on the optical birefringent information. Between the two imaging techniques, µMRI is totally non‐invasive and non‐destructive, while PLM is destructive and can image only thin sections. In addition, the principles of imaging are totally different between µMRI and PLM, where PLM enjoys higher optical resolution.
This study found that immature cartilage was on average thicker than mature cartilage for both the humerus and femur, which is evident from the profiles both by µMRI (Figures 3 and 4) and PLM (Figures 5 and 6). Since PLM has higher image resolution, it offers better determination of the tissue thickness. For the mature tissue, the thickness of the non‐calcified cartilage is commonly determined from its articular surface to its tidemark in PLM (Xia et al., 2001), which signals the front of mineralization where cartilage interfaces with the underlining subchondral bone (Williams et al., 2008). In immature cartilage, however, the lack of the tidemark results in a less accurate determination of the non‐calcified tissue thickness in PLM; we measured the total tissue until the cartilage and bone interface, which might slightly overestimate the total thickness.
A note could be made here with regard to the quantitative relaxation measurements. In MRI, quantitative relaxation maps are obtained by acquiring several intensity images, each with a different relaxation weighting (i.e., different delay times in the pulse sequence). The selection of a finite number of delay times (for T1 and T2) or spin‐lock durations (for T1ρ) in any quantitative MRI is always a compromise, given that the tissue's relaxation values are depth‐dependent, and it is only possible timewise to do 3–6 weighted images. If the delay time is short, then the long relaxation values will be poorly determined; in contrast, if the delay time is long, the short relaxation values will be poorly determined. The pulse sequences and parameters in this experiment were established in one of our previous studies (Mahar et al., 2018). We have done sufficient preliminary experiments to know this set of weightings is adequate.
5. CONCLUSION
Immature and mature cartilage have significant structural differences in terms of their T2 and T1ρ relaxation times, thicknesses, cellular and physical appearances, and optical properties. For studies and models involving MRI, any pulse sequence with shorter echo delays (e.g. UTE, or ultra‐short‐echo) could be more beneficial if the cartilage‐bone interface is of concern. Any detailed determination of the ECM and cellular architectures would benefit from the employment of optical birefringence in PLM at higher resolution. Better knowledge of the characteristic differences between immature and mature cartilage could lead to an improved understanding of developmental biology and special needs in translational research that involves rabbit models.
AUTHOR CONTRIBUTIONS
Y.X. designed and provided the concept of study, finalized the data analysis and figures, and wrote the final manuscript. H.M carried out the MRI experiments, analysis and initial draft. S.B., A.S. and F.B. were instrumental in the MRI experiments and data analysis. M.H. carried out the PLM experiments.
ACKNOWLEDGMENTS
Yang Xia is grateful to the National Institutes of Health (NIH) for an R01 grant (AR 69047). The authors thank Dr. Adam Lauver and Ms. Barbara Christian (Department of Pharmacology & Toxicology, Michigan State University) for providing the immature rabbit samples, and Ms. Carol Searight and Dr. Brad Roth (Department of Physics, Oakland University) for linguistic editing.
Mantebea, H. , Batool, S. , Singh, A. , Hammami, M. , Badar, F. & Xia, Y. (2022) Structural differences between immature and mature articular cartilage of rabbits by microscopic MRI and polarized light microscopy. Journal of Anatomy, 240, 1141–1151. Available from: 10.1111/joa.13620
DATA AVAILABILITY STATEMENT
The data that support the findings of this study are available from the corresponding author upon reasonable request.
REFERENCES
- Alhadlaq, H.A. , Xia, Y. , Hansen, F.M. , Les, C.M. & Lust, G. (2007) Morphological changes in articular cartilage due to static compression: Polarized light microscopy study. Connective Tissue Research, 48(2), 76–84. [DOI] [PubMed] [Google Scholar]
- Carballo, C.B. , Nakagawa, Y. , Sekiya, I. & Rodeo, S.A. (2017) Basic science of articular cartilage. Clinics in Sports Medicine, 36, 413–425. [DOI] [PubMed] [Google Scholar]
- Fairweather‐Tait, S.J. , Wawer, A.A. , Gillings, R. , Jennings, A. & Myint, P.K. (2014) Iron status in the elderly. Mechanisms of Ageing and Development, 136‐137, 22–28. [DOI] [PMC free article] [PubMed] [Google Scholar]
- Flandry, F. & Hommel, G. (2011) Normal anatomy and biomechanics of the knee. Sports Medicine and Arthroscopy Review, 19(2), 82–92. [DOI] [PubMed] [Google Scholar]
- Fox, A.J. , Bedi, A. & Rodeo, S.A. (2009) The basic science of articular cartilage: Structure, composition, and function. Sports Health, 1(6), 461–468. [DOI] [PMC free article] [PubMed] [Google Scholar]
- Jadin, K.D. , Wong, B.L. , Bae, W.C. , Li, K.W. , Williamson, A.K. , Schumacher, B.L. et al. (2005) Depth‐varying density and organization of chondrocytes in immature and mature bovine articular cartilage assessed by 3D imaging and analysis. Journal of Histochemistry and Cytochemistry, 53(9), 1109–1119. [DOI] [PubMed] [Google Scholar]
- Kingfisher, (Volume 1; No. 2) Kingfisher Biotech Circular Subject: Rabbit as an Animal Model. Available from: https://www.Kingfisherbiotech.com/newsletter/Rabbit_Animal_Model_Newsletter.pdf (Accessed 15th February 2021).
- Lee, J.H. & Xia, Y. (2013) Quantitative zonal differentiation of articular cartilage by microscopic magnetic resonance imaging, polarized light microscopy, and Fourier‐transform infrared imaging. Microscopy Research and Technique, 76(6), 625–632. [DOI] [PMC free article] [PubMed] [Google Scholar]
- Levin, A.S. , Chen, C.T.C. & Torzilli, P.A. (2005) Effect of tissue maturity on cell viability in load‐injured articular cartilage explants. Osteoarthritis and Cartilage, 13(6), 488–496. [DOI] [PubMed] [Google Scholar]
- Mahar, R. , Batool, S. , Badar, F. & Xia, Y. (2018) Quantitative measurement of T2, T1ρ and T1 relaxation times in articular cartilage and cartilage‐bone interface by SE and UTE imaging at microscopic resolution. Journal of Magnetic Resonance, 297, 76–85. [DOI] [PMC free article] [PubMed] [Google Scholar]
- Oldenbourg, R. & Mei, G. (1995) New polarized light microscope with precision universal compensator. J Microscopy, 180, 140–147. [DOI] [PubMed] [Google Scholar]
- Shah, M.R. , Kaplan, K.M. , Meislin, R.J. & Bosco, J.A. (2007) Articular cartilage restoration of the knee. Bulletin of the NYU Hospital for Joint Diseases, 65(1), 51–60. [PubMed] [Google Scholar]
- Wang, N. , Badar, F. & Xia, Y. (2015) MRI properties of a unique hypo‐intense layer in degraded articular cartilage. Physics in Medicine and Biology, 60(22), 8709–8721. [DOI] [PMC free article] [PubMed] [Google Scholar]
- Wang, N. & Xia, Y. (2011) Dependencies of multi‐component T2 and T1ρ relaxation on the anisotropy of collagen fibrils in bovine nasal cartilage. Journal of Magnetic Resonance, 212, 124–132. [DOI] [PMC free article] [PubMed] [Google Scholar]
- Wang, N. & Xia, Y. (2012) Orientational dependent sensitivities of T2 and T1ρ towards trypsin degradation and Gd‐DTPA 2‐ presence in bovine nasal cartilage. Magnetic Resonance Materials in Physics, Biology and Medicine, 25(4), 297–304. [DOI] [PMC free article] [PubMed] [Google Scholar]
- Williams, G.M. , Klisch, S.M. & Sah, R.L. (2008) Bioengineering cartilage growth, maturation, and form. Pediatric Research, 63(5), 527–534. [DOI] [PubMed] [Google Scholar]
- Williamson, A.K. , Chen, A.C. & Sah, R.L. (2001) Compressive properties and function‐composition relationships of developing bovine articular cartilage. Journal of Orthopaedic Research, 19(6), 1113–1121. [DOI] [PubMed] [Google Scholar]
- Xia, Y. (1998) Relaxation anisotropy in cartilage by NMR microscopy (µMRI) at 14‐µm resolution. Magnetic Resonance in Medicine, 39(6), 941–949. [DOI] [PubMed] [Google Scholar]
- Xia, Y. (2000) Magic‐angle effect in magnetic resonance imaging of articular cartilage. Investigative Radiology, 35, 602–621. [DOI] [PubMed] [Google Scholar]
- Xia, Y , Momot, K.I. , Chen, Z. , Chen, C.T. , Kahn, D. & Badar, F. (2016) CHAPTER 1. Introduction to Cartilage. In: Xia, Y. & Momot, K. (Eds.) Biophysics and Biochemistry of Cartilage by NMR and MRI. Cambridge: Royal Society of Chemistry, pp. 1–43. [Google Scholar]
- Xia, Y. , Alhadlaq, H. , Ramakrishnan, N. , Bidthanapally, A. , Badar, F. & Lu, M. (2008) Molecular and morphological adaptations in compressed articular cartilage by polarized light microscopy and Fourier‐transform infrared imaging. Journal of Structural Biology, 164(1), 88–95. [DOI] [PMC free article] [PubMed] [Google Scholar]
- Xia, Y. , Moody, J.B. , Burton‐Wurster, N. & Lust, G. (2001) Quantitative in situ correlation between microscopic MRI and polarized light microscopy studies of articular cartilage. Osteoarthritis and Cartilage, 9(5), 393–406. [DOI] [PubMed] [Google Scholar]
Associated Data
This section collects any data citations, data availability statements, or supplementary materials included in this article.
Data Availability Statement
The data that support the findings of this study are available from the corresponding author upon reasonable request.