Abstract
Aberrant insulin signaling has been considered one of the risk factors for the development of Alzheimer’s disease (AD) and has drawn considerable attention from the research community to further study its role in AD pathophysiology. Herein, we describe the development of an insulin-based novel positron emission tomography (PET) probe, [68Ga]Ga-NOTA-insulin, to noninvasively study the role of insulin in AD. The developed PET probe [68Ga]Ga-NOTA-insulin showed a significantly higher uptake (0.396 ± 0.055 SUV) in the AD mouse brain compared to the normal (0.140 ± 0.027 SUV) mouse brain at 5 min post injection and also showed a similar trend at 10, 15, and 20 min post injection. In addition, [68Ga]Ga-NOTA-insulin was found to have a differential uptake in various brain regions at 30 min post injection. Among the brain regions, the cortex, thalamus, brain stem, and cerebellum showed a significantly higher standard uptake value (SUV) of [68Ga]Ga-NOTA-insulin in AD mice as compared to normal mice. The inhibition of the insulin receptor (IR) with an insulin receptor antagonist peptide (S961) in normal mice showed a similar brain uptake profile of [68Ga]Ga-NOTA-insulin as it was observed in the AD case, suggesting nonfunctional IR in AD and the presence of an alternative insulin uptake route in the absence of a functional IR. The Gjedde–Patlak graphical analysis was also performed to predict the input rate of [68Ga]Ga-NOTA-insulin into the brain using MicroPET imaging data and supported the in vivo results. The [68Ga]Ga-NOTA-insulin PET probe was successfully synthesized and evaluated in a mouse model of AD in comparison with [18F]AV1451 and [11C]PIB to noninvasively study the role of insulin in AD pathophysiology.
Introduction
The peptide hormone insulin plays a critical role in glucose metabolism by facilitating glucose uptake into cells via insulin receptor (IR) binding. This triggers an intracellular metabolic pathway change via a transmembrane signal, which allows glucose to be transported across the cell membrane.1 Insulin also contributes to protein and lipid metabolism, as well as cell growth and division.2 Since insulin participates in several vital biological roles, impaired insulin function has severe negative effects on metabolic balance and cellular homeostasis. These effects are linked to several diseases, such as type 2 diabetes mellitus (T2DM), which is characterized by peripheral insulin resistance.
It was only in the past 50 years that insulin was also found in the brain, an organ previously assumed to be insulin-independent.3 Since this discovery, several epidemiological and clinical association studies have indicated that insulin resistance in the brain may contribute to Alzheimer’s disease (AD) pathology. Craft showed a correlation between insulin resistance and hyperinsulinemia in AD patients and the regulation of β-amyloid (Aβ) peptide, memory, and inflammation.4 Another study demonstrated that high insulin levels are associated with higher Aβ levels as well as multiple inflammatory markers and modulators.5 Gasparini et al. demonstrated that hyperinsulinemia promoted greater extracellular levels of Aβ.6 This indicates that increased insulin and insulin resistance may contribute to the formation of Aβ plaques, one of the primary pathological hallmarks of the AD brain. Contrarily, there is also evidence that amyloid β oligomers (AβO) block insulin receptor activation in the neurons and trigger insulin resistance.7 However, it is unclear whether an impaired insulin function or the buildup of extracellular AβOs develops first.
The association between peripheral/brain insulin resistance and AD has led some to use the term “type 3 diabetes” to refer to AD and to investigate the causal link between the two conditions. The research in this area has been somewhat inconclusive. Janson et al. documented that patients with AD were more likely to develop T2DM and noted a possible link between AβOs and the islet amyloid polypeptide, which is overproduced in T2DM, much like Aβ in AD.8 Profenno et al. also showed that diabetes is a risk factor for developing AD.9 On the other hand, another study could only demonstrate that T2DM was associated with increased AD risk when no other major AD risk factors were present.10
Insulin mediates its cellular response by binding to the extracellular site of transmembrane tyrosine protein kinase, the insulin receptor. On binding to insulin, the insulin receptor autophosphorylates and gets activated. Thereafter, the activated insulin receptor recruits and phosphorylates insulin receptor substrates (IRS 1–4). The phosphorylated IRS 1–4 triggers the insulin signaling pathway through the activation of the MAP kinase pathway and the PI3 kinase/Akt pathway. The altered MAP kinase and PI3 kinase/Akt signaling pathways have been shown to contribute to impaired insulin signaling in the AD brain.11,12
In addition to impaired insulin signaling pathways in AD, the levels of insulin and insulin receptors (IRs) themselves might also play a critical role in the dysregulation of insulin signaling in AD brain pathology.13,14 In another study, Moloney et al. found no difference in the protein levels of IR in age-matched postmortem AD and normal mid-temporal cortex tissues.15 However, differences were observed in the subcellular location of the IR in the AD and normal neurons. In AD neurons, the IR was concentrated intracellularly within and surrounding the nucleus, whereas in normal neurons, the IR showed localization throughout the cell soma and apical dendrites.15 The absence of the IR at the membrane in AD neurons could explain one of the mechanisms involved in disrupted IR signaling in the AD brain.
Much is still unknown about AD pathology, and since AD is currently the most common form of dementia and the sixth leading cause of death for all US adults, it is crucial to elucidate the cause and the characteristics of the disease, so that effective treatment and prevention can be developed.16 Some advances have been made using noninvasive brain imaging techniques, such as positron emission tomography (PET). Using [18F]FDG, a metabolic decrease of 21–22% was reported in the posterior cingulate cortex in patients with early-stage AD.17 In another PET study, reduced [18F]FDG uptake in the temporoparietal cortex in AD patients indicated a metabolic reduction for that brain region.18 Several other PET probes have also been used to help further characterize AD, such as [11C]C-PiB and [18F]F-AV1451.19−22 However, these probes are not adequate for discerning the role of insulin in the brain. Even [18F]FDG can only provide indirect evidence of insulin action. To better understand the effects of insulin resistance and AD, a new insulin-based PET probe has been developed. The developed PET probe, [68Ga]Ga-NOTA-insulin, is structurally similar to insulin with only addition of a gallium chelator—NOTA, which enables it to chelate the 68Ga isotope. The half-life (T1/2 = 67.7 min) and imaging property (β+ 89.14%, Emean = 0.836 MeV) of 68Ga are suitable for PET imaging of insulin. Prior to our work, insulin was also labeled with 124I as a PET probe, but low positron emission (25.6%), longer half-life (T1/2 = 4.15 days), and high-energy γ-rays were not ideal for imaging using 124I.23 The developed PET probe can serve as a noninvasive tool to manifest changes in insulin uptake, distribution, and metabolism in AD, as well as in other insulin-associated diseases, such as T2DM. In this study, we designed, synthesized, and evaluated the uptake and biodistribution of [68Ga]Ga-NOTA-insulin with and without the insulin receptor inhibitor (S961 acetate) in both normal (B6SJL) and AD (APP/PS1) mice. We also evaluated the uptake and biodistribution of [18F]AV1451 and [11C]PIB in the same normal (B6SJL) and AD (APP/PS1) mice for the purpose of comparison and to better understand the AD pathophysiology.
Results and Discussion
Synthesis of [68Ga]Ga-NOTA-Insulin
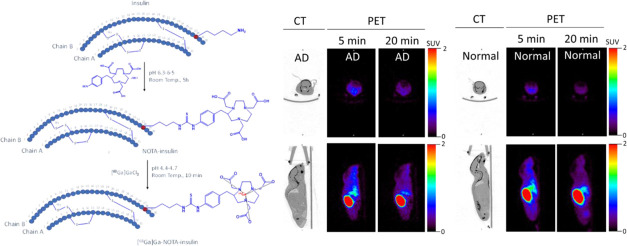
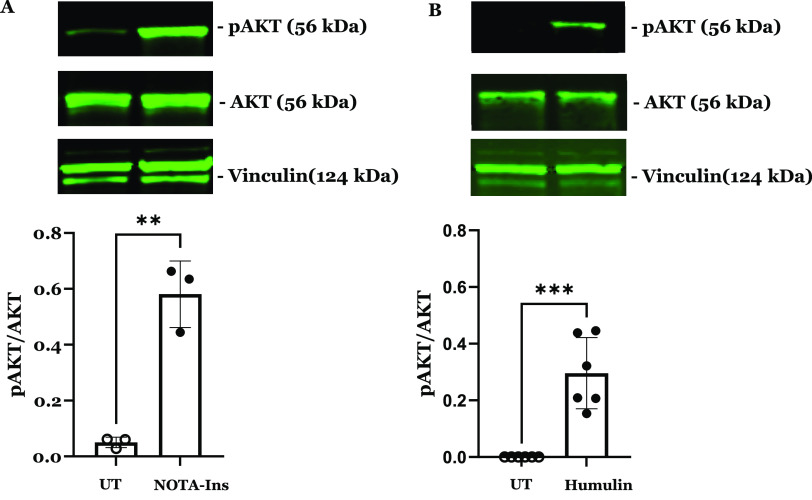
To develop an insulin-based PET probe, 2-S-(4-isothiocyanatobenzyl)-1,4,7-triazacyclonone-1,4,7-triacetic acid (p-SCN-Bn-NOTA) was covalently linked to the primary amine of the lysine residue of the insulin chain B by stirring at room temperature for 5 h at pH 6.3–6.5 (Figure 1). During the insulin and p-SCN-Bn-NOTA conjugation reaction for 5 h at room temperature, the products of the conjugation reaction were analyzed by high-performance liquid chromatography (HPLC) at 1, 2, 3, and 4 h (Figure S1) to optimize and achieve the highest product yield. The obtained product NOTA-insulin was purified with a PD-10 column (size exclusion) to remove unreacted p-SCN-Bn-NOTA. After PD-10 purification, different fractions were collected and analyzed with an analytical HPLC system to determine the relative percentages of unreacted insulin, mono-NOTA-insulin, di-NOTA-insulin, or in some cases tri-NOTA-insulin (Figures S2 and S3). After reaction optimization, the predominant product was mono-NOTA-insulin (>90%) (Figure S3). Before optimization, the mixture was injected into a preparative HPLC column, and each of the product peaks was collected and characterized by MALDI-TOF analysis, including free insulin, and later purified samples were also used as reference compounds (Figures S4–S6). It was observed that keeping the pH of the reaction mixture close to 6.3 and not allowing it to increase above 6.5 was key to getting predominantly mono-NOTA-insulin (∼90%) (Figures S3 and S6). To ensure that the addition of NOTA on insulin had not affected the function of insulin, we performed both an insulin tolerance test (ITT) in normal mice and an insulin functional assay by investigating the effects of NOTA-insulin on the polarized hCMEC/D3 monolayers, a widely used blood–brain barrier (BBB) model in vitro. Insulin is well-known to stimulate insulin signaling pathways via the insulin receptor (IR) and insulin-like growth factor 1 receptor (IGF-1R), which converge at several downstream metabolic signaling kinases such as PI3K/AKT. Therefore, the phosphorylation of AKT is often used as an indicator of insulin signaling pathway stimulation. As indicated in Figure 2, NOTA-insulin stimulated the phosphorylation of Akt in hCMEC/D3 monolayers as observed with Humulin, which confirmed the function of NOTA-insulin. Additionally, the insulin tolerance test (ITT) also confirmed that NOTA-insulin lowered blood glucose levels similar to that of Humulin (Table 1).
Figure 1.
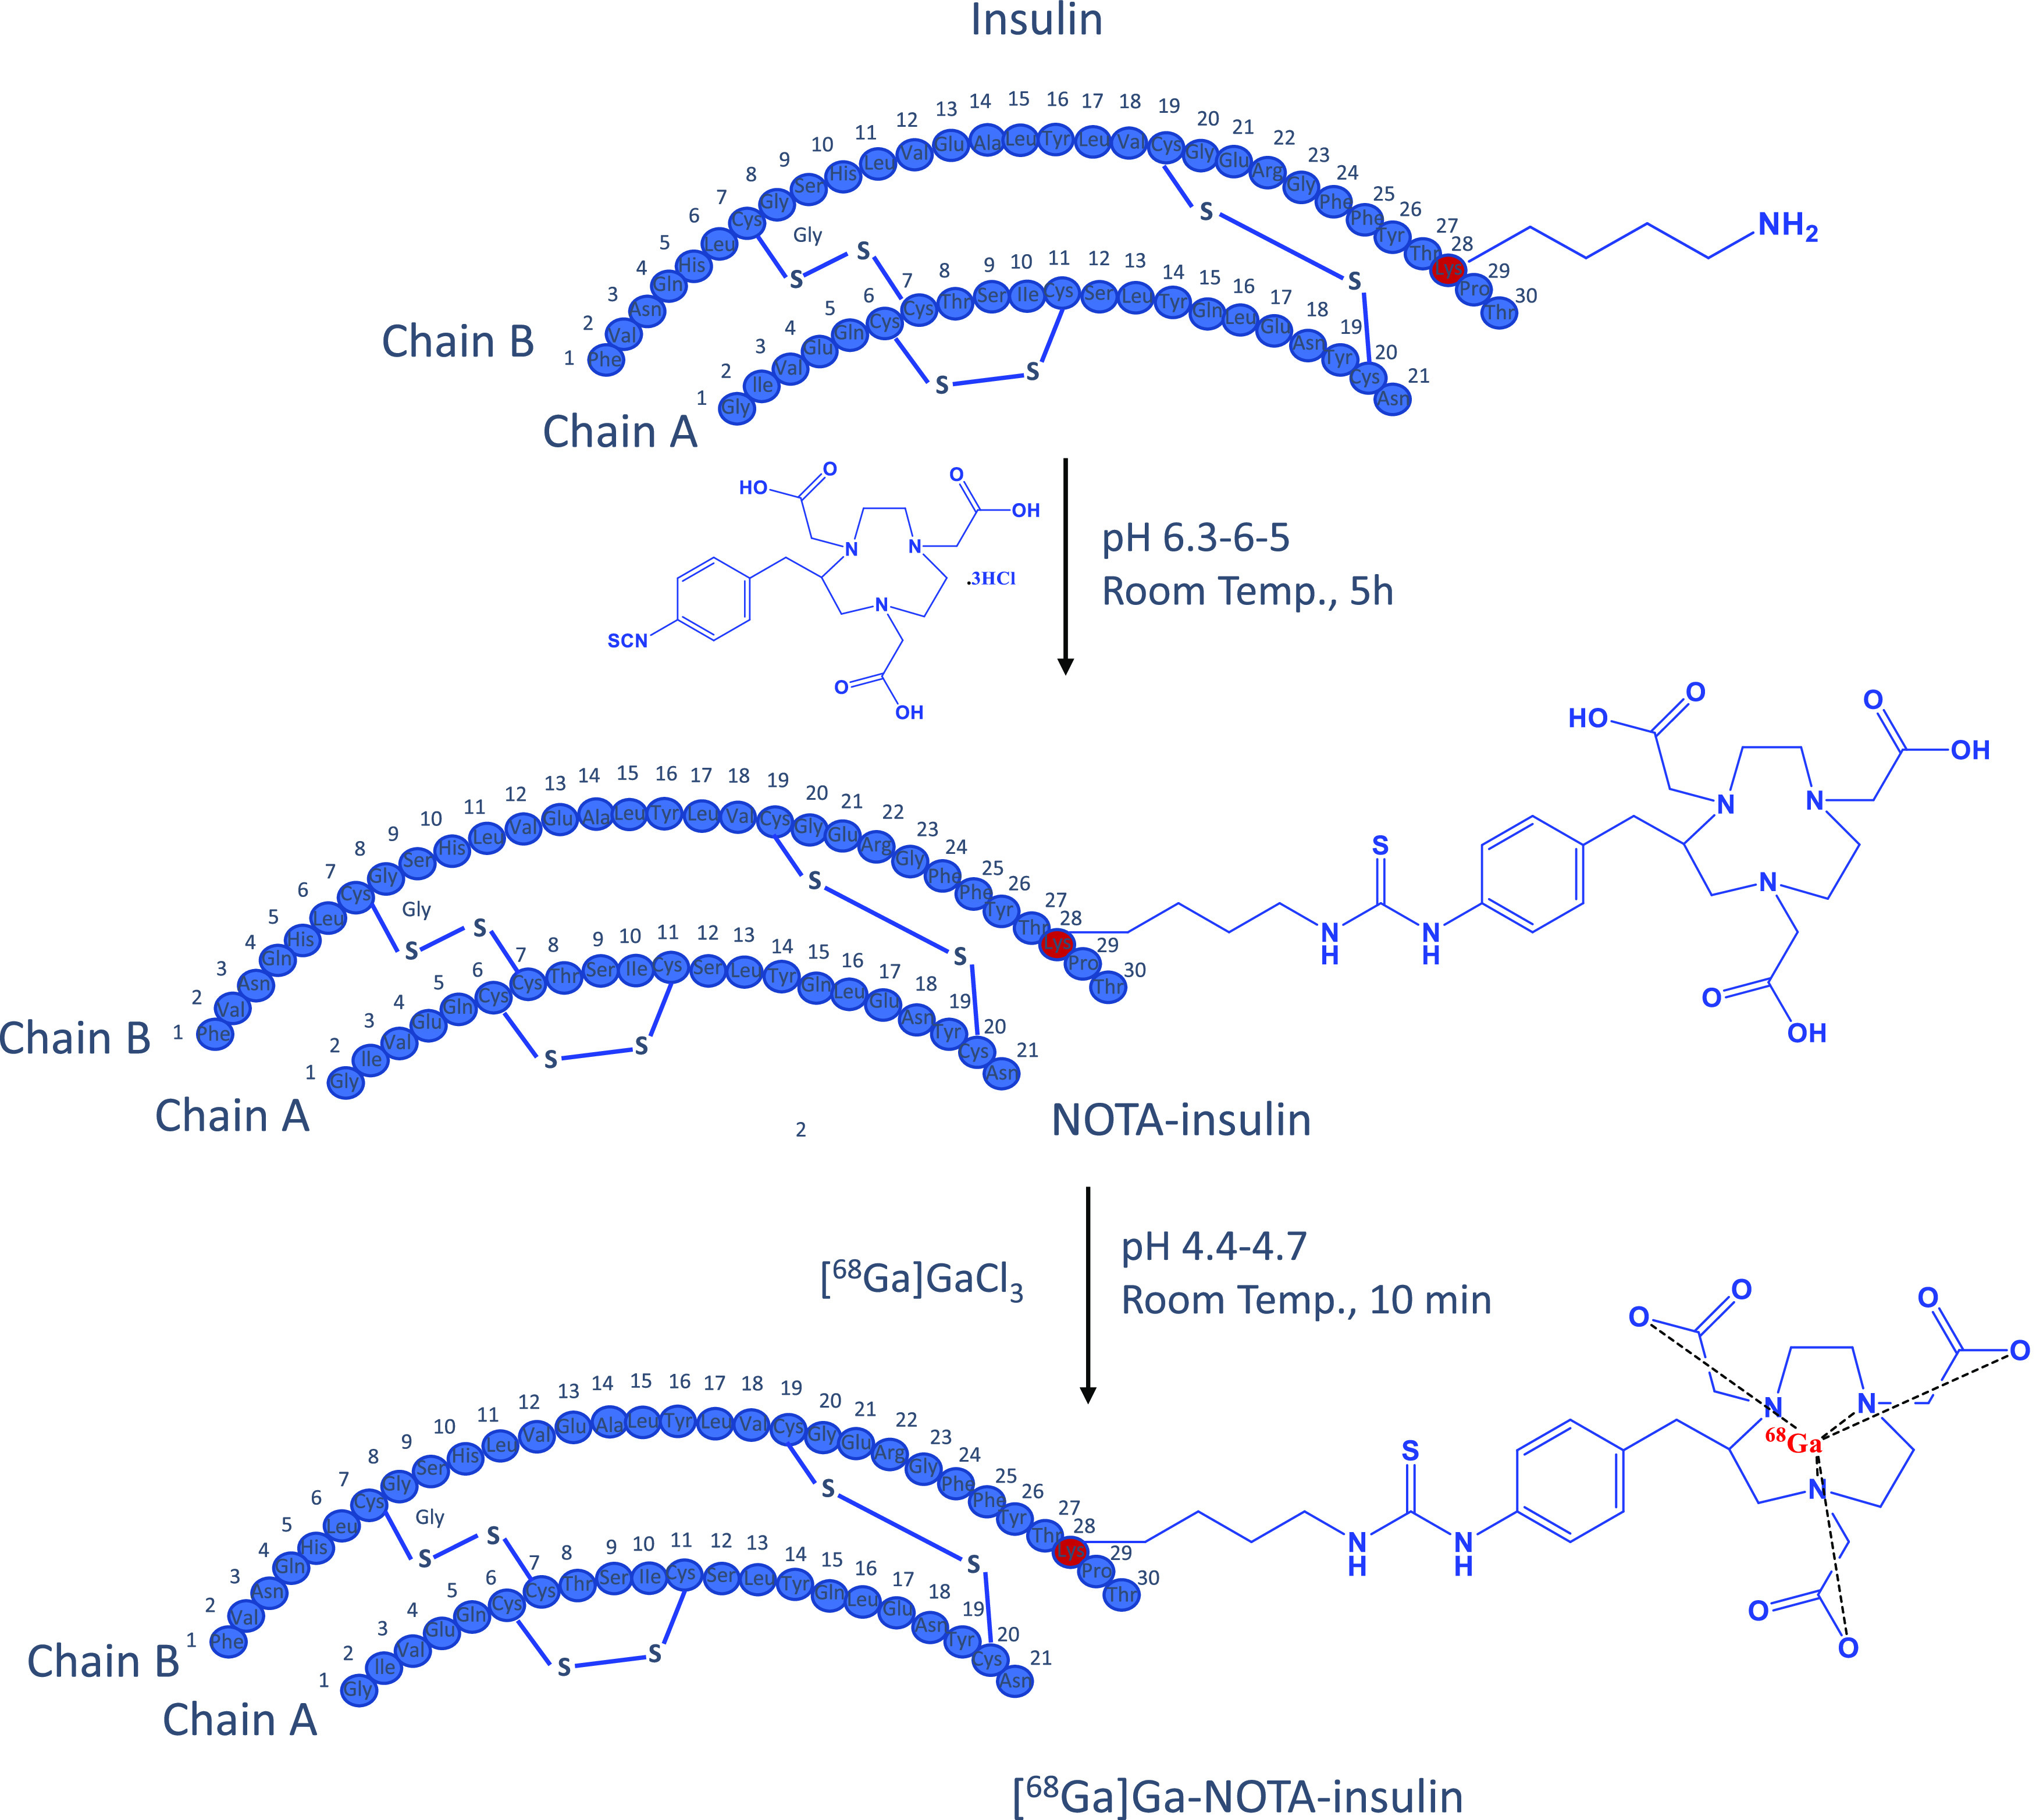
Synthesis of NOTA-insulin and [68Ga]Ga-NOTA-insulin.
Figure 2.
NOTA-insulin stimulates the insulin signaling pathway in polarized BBB endothelial cell monolayers similar to Humulin. Western blots were performed to assess the expression and phosphorylation of insulin signaling kinases in hCMEC/D3 monolayers following 20 min treatment with or without 100 nM of (A) NOTA-insulin or (B) Humulin. Representative immunoblots and bar charts of the p-AKT/AKT ratio are shown (mean ± standard deviation, SD; n = 3: NOTA-insulin, and n = 6 Humulin). **p < 0.01, ***p < 0.005; unpaired Student’s t-tests.
Table 1. Comparative Response of NOTA-Insulin and Humulin on Blood Glucose during the Insulin Tolerance Test in Normal (B6SJL) Mice.
| glucose
levels at different time points after NOTA-insulin or Humulin administration |
|||||
|---|---|---|---|---|---|
| 0 min | 15 min | 30 min | 60 min | 120 min | |
| NOTA-insulin (n = 3) | 100 ± 0% | 98 ± 4% | 73 ± 5% | 59 ± 6% | 69 ± 8% |
| Humulin (n = 4) | 100 ± 0% | 81 ± 3% | 68 ± 2% | 55 ± 5% | 74 ± 6% |
After the successful synthesis of predominantly mono-NOTA-insulin, it was radiolabeled with a PET isotope 68Ga using [68Ga]GaCl3, which was obtained either from a 68Ge/68Ga generator (GalliaPharm Generator) or from a cyclotron (liquid target).24−26 Radiolabeling of mono-NOTA-insulin (NOTA-insulin) was successfully performed at pH 4.4–4.7 at room temperature in 10 min using both cyclotron-produced and generator-eluted [68Ga]GaCl3 to prepare [68Ga]Ga-NOTA-insulin. However, for ease and simplicity, the [68Ga]GaCl3 eluted from the generator was used for the synthesis of [68Ga]Ga-NOTA-insulin in all biological studies.
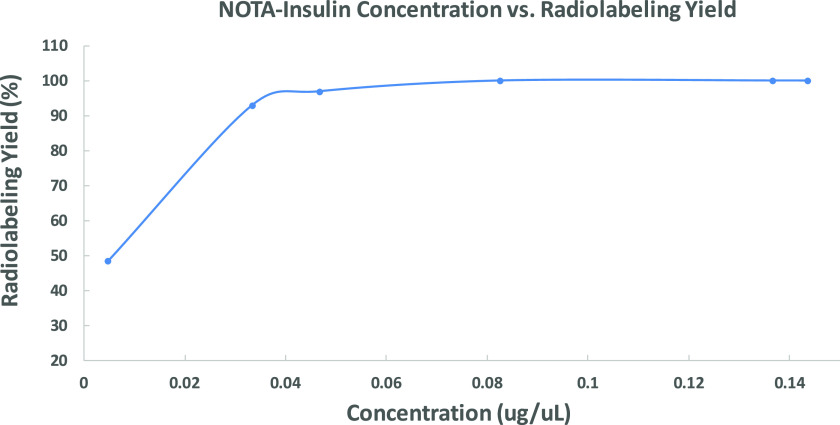
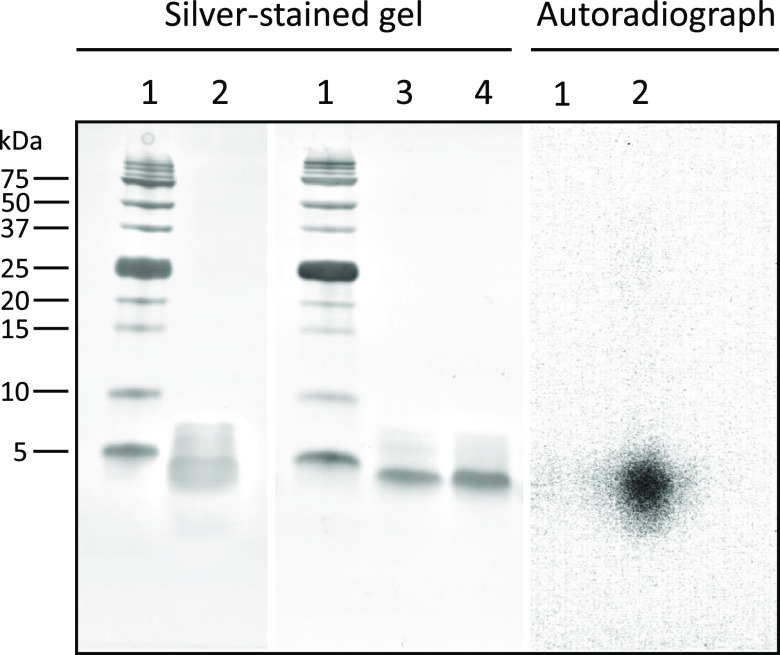
During optimization of radiolabeling conditions, it was noticed that the radiolabeling yield was dependent on the NOTA-insulin concentration. Therefore, we optimized the radiolabeling condition by changing the concentration of NOTA-insulin (μg/μL) and found that a concentration of >0.07 μg/μL NOTA-insulin afforded >99% radiolabeling yield (Figure 3) and 1.1 ± 0.26 GBq/μmol (n = 11) molar activity (Am) at the end of the synthesis (Table S1). The radiolabeling yield was measured by r-TLC (Figure S7). After successful radiolabeling, the stability of [68Ga]Ga-NOTA-insulin was measured over time after adjusting the pH of the final solution of [68Ga]Ga-NOTA-insulin to 7.0 while keeping it at room temperature for over 4 h. It was observed that [68Ga]Ga-NOTA-insulin was stable with >97% purity up to 4 h (Figure 4). To ensure that radiolabeling has no immediate detrimental effect on the structural integrity of [68Ga]Ga-NOTA-insulin, we performed a comparative sodium dodecyl sulfate-polyacrylamide gel electrophoresis (SDS-PAGE) with [68Ga]Ga-NOTA-insulin, NOTA-insulin, and insulin, followed by silver staining (Figure 5) and 68Ga autoradiography of the same gel (Figure 5). It was found that radiolabeling with 68Ga did not cause any significant structural change to insulin, confirming the suitability of the novel PET probe [68Ga]Ga-NOTA-insulin for further biological evaluation in mouse models.
Figure 3.
Radiolabeling yield of [68Ga]Ga-NOTA-insulin synthesized as a function of the concentration of NOTA-insulin. Labeling pH = 4.7. The data points represent means of a range of radiolabeling yield of NOTA-insulin. From left to right for each data point, n = 1, 1, 2, 8, 6, 6.
Figure 4.
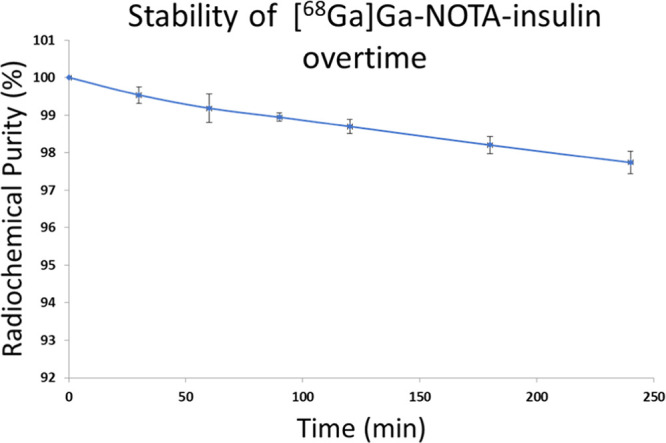
Stability of [68Ga]Ga-NOTA-insulin over 4 h post labeling. Stability was determined in terms of radiochemical purity via radio-iTLC analysis. All samples were synthesized with >0.07 μg/μL NOTA-insulin at a pH of 4.7, but stability was measured at pH 7.0. Data are reported as average ± SD, and n = 3.
Figure 5.
Silver stained SDS-PAGE picture of an intact protein marker (1, 2–250 kDa; Bio-Rad #1610377), [68Ga]Ga-NOTA-insulin (2), NOTA-insulin (3), and intact insulin (4) and autoradiography of [68Ga]Ga-NOTA-insulin (2).
Biodistribution and MicroPET/CT Imaging of [68Ga]Ga-NOTA-Insulin in a Mouse Model
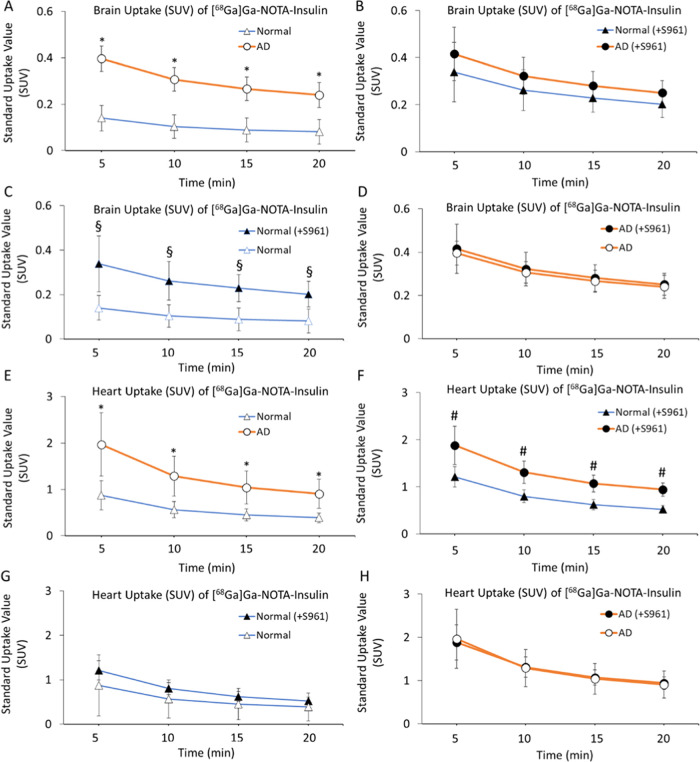
After confirming the stability, structural integrity, and biological activity of [68Ga]Ga-NOTA-insulin similar to insulin, we performed the in vivo evaluation of [68Ga]Ga-NOTA-insulin in an AD mouse model (∼6-month-old APP/PS1 mice) in comparison with normal (6-month-old B6SJL mice). Both AD and normal mice were administered with [68Ga]Ga-NOTA-insulin via the tail vein/femoral vein having a specific activity of 0.13–0.61 MBq/μg at the time of injection (Table S1). A dynamic microPET/CT imaging was performed for 20 min, and PET/CT images were analyzed to determine the standard uptake value (SUV) in the brain and heart at 5, 10, 15, and 20 min. The obtained SUVs are listed in Table 2, which showed a significantly higher SUV of 0.396 ± 0.055 for [68Ga]Ga-NOTA-insulin in the AD mouse brain compared to 0.140 ± 0.027 SUV in the normal mouse brain at 5 min. In addition, a significantly higher SUV of [68Ga]Ga-NOTA-insulin was also found in the AD mouse brain compared to the normal mouse brain at 10, 15, and 20 min time points (Table 2 and Figure 6A–D). It was noticed that the [68Ga]Ga-NOTA-insulin probe was slowly washing out over time from both AD and normal mice brains. We also observed a significantly higher SUV of [68Ga]Ga-NOTA-insulin in the heart of AD animals compared to the normal group of mice at all time points of 5, 10, 15, and 20 min (Table 3 and Figure 6E–H), indicating a slower clearance of [68Ga]Ga-NOTA-insulin from blood. In fact, the heart has also been shown to be negatively affected in APP/PS1 mice due to an altered cardiomyocyte contractile function.27 This is in accordance with high cardiovascular events observed in patients suffering from AD.28 Additionally, there is growing evidence that AD not only affects the brain but also confers systemic changes in the body by altering metabolism in multiple organs, including organs like the heart, liver, kidney, etc., as demonstrated by high throughput multiorgan metabolomics in APP/PS1 mice.29
Table 2. Uptake (SUV) of [68Ga]Ga-NOTA-Insulin without and with the Insulin Receptor Inhibitor (S961) in the Brain of AD (APP/PS1) and Normal (B6SJL) Mice Post Intravenous Administration Measured via microPET/CT Image Analysis and Drawing the Region of Interest (ROI) on Whole Mice Brain and Whole Heart at Different Time Points.
| time points (min) | AD brain (avg. SUV ± SD, n = 6) | AD brain (+S961) (avg. SUV ± SD, n = 5) | normal brain (avg. SUV ± SD, n = 4) | normal brain (+S961) (avg. SUV ± SD, n = 3) | P value AD brain vs AD brain (+S961) | P value normal brain vs normal brain (+S961) | P value AD vs normal | P value AD (+S961) vs normal (+S961) |
|---|---|---|---|---|---|---|---|---|
| 5 | 0.396 ± 0.055 | 0.416 ± 0.113 | 0.140 ± 0.027 | 0.339 ± 0.126 | 0.356 | <0.05 | <0.05 | 0.201 |
| 10 | 0.307 ± 0.050 | 0.323 ± 0.077 | 0.104 ± 0.019 | 0.262 ± 0.086 | 0.345 | <0.05 | <0.05 | 0.172 |
| 15 | 0.266 ± 0.051 | 0.281 ± 0.061 | 0.089 ± 0.017 | 0.229 ± 0.060 | 0.344 | <0.05 | <0.05 | 0.144 |
| 20 | 0.240 ± 0.054 | 0.251 ± 0.051 | 0.081 ± 0.015 | 0.202 ± 0.057 | 0.368 | <0.05 | <0.05 | 0.127 |
Figure 6.
Uptake (SUV) of [68Ga]Ga-NOTA-insulin in the brain (A–D) and heart (E–H) of AD (n = 6), AD (+S961) (n = 5), normal (n = 4) and normal (+S961) (n = 3) mice at 5, 10, 15, and 20 min post intravenous (i.v.) administration. The uptake (SUV) data were extracted from microPET/CT images by drawing the region of interest (ROI) at different time points. *p value < 0.05 AD vs normal, #p value < 0.05 AD (+S961) vs normal (+S961), and §p value < 0.05 normal vs normal (+S961).
Table 3. Uptake (SUV) of [68Ga]Ga-NOTA-Insulin without and with the Insulin Receptor Inhibitor (+S961) in the Heart of AD (APP/PS1) and Normal (B6SJL) Mice Post Intravenous Administration Measured via microPET/CT Image Analysis and Drawing the Region of Interest (ROI) on Whole Mice Brain and Whole Heart at Different Time Points.
| time points (min) | AD heart (avg. SUV ± SD, n = 6) | AD heart (+S961) (avg. SUV ± SD, n = 5) | normal heart (avg. SUV ± SD, n = 4) | normal heart (+S961) (avg. SUV ± SD, n = 3) | P value AD heart vs AD heart (+S961) | P value normal heart vs normal heart (+S961) | P value AD vs normal | P value AD (+S961) vs normal (+S961) |
|---|---|---|---|---|---|---|---|---|
| 5 | 1.968 ± 0.685 | 1.884 ± 0.408 | 0.751 ± 0.170 | 1.213 ± 0.219 | 0.408 | 0.164 | <0.05 | <0.05 |
| 10 | 1.291 ± 0.430 | 1.312 ± 0.238 | 0.499 ± 0.117 | 0.800 ± 0.137 | 0.462 | 0.173 | <0.05 | <0.05 |
| 15 | 1.040 ± 0.354 | 1.072 ± 0.178 | 0.408 ± 0.100 | 0.622 ± 0.106 | 0.431 | 0.212 | <0.05 | <0.05 |
| 20 | 0.906 ± 0.311 | 0.943 ± 0.148 | 0.353 ± 0.084 | 0.525 ± 0.079 | 0.407 | 0.240 | <0.05 | <0.05 |
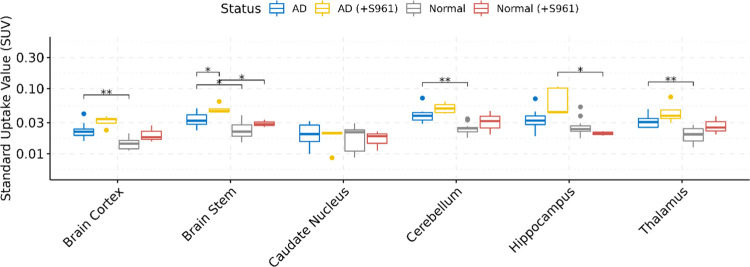
We also performed whole-body biodistribution of [68Ga]Ga-NOTA-insulin in both AD and normal groups of animals at 30 min following the administration of the PET probe. After 30 min, the animals were sacrificed, and their vital organs like the heart, lung, liver, spleen, pancreas, kidneys, stomach, gut, skin, blood, bone, and muscle along with different brain regions, including the cortex, caudate nucleus, hippocampus, thalamus, brain stem, and cerebellum, were harvested and analyzed for the presence of radioactivity as the SUV. Among the brain regions, the cortex, thalamus, brain stem, and cerebellum showed a significantly higher SUV of [68Ga]Ga-NOTA-insulin in AD mice as compared to normal mice (Table 4 and Figure 7). It is also important to mention here that at 30 min post administration of the PET probe, the SUV of [68Ga]Ga-NOTA-insulin in various brain regions was low, but nonetheless, remainder radioactivity was sufficient to display a differential SUV of [68Ga]Ga-NOTA-insulin among the various brain regions. We observed a significantly higher SUV of [68Ga]Ga-NOTA-insulin in the AD cortex, which is the brain region affected in AD (Table 4 and Figure 7). Multivariate testing of overall differences in brain region values was also statistically significant.
Table 4. Uptake (SUV) of [68Ga]Ga-NOTA-Insulin without and with the Insulin Receptor Inhibitor (+S961) in Different Brain Regions of Normal (B6SJL) and AD (APP/PS1) Mouse Models at 30 min Post Intravenous Administration Measured via Organ/Tissue Harvesting.
| SUV: mean ± SD |
adj. P value |
|||||||
|---|---|---|---|---|---|---|---|---|
| mouse brain regions | AD (n = 12) | AD (+S961) (n = 5) | normal (n = 13) | normal (+S961) (n = 3) | AD vs normal | AD (+S961) vs normal (+S961) | normal vs normal (+S961) | AD vs AD (+S961) |
| caudate nucleus | 0.021 ± 0.007 | 0.018 ± 0.001 | 0.019 ± 0.007 | 0.017 ± 0.0055 | 0.403 | 0.888 | 0.955 | 0.613 |
| cortex | 0.023 ± 0.007 | 0.032 ± 0.001 | 0.014 ± 0.003 | 0.02 ± 0.0062 | 0.002 | 0.221 | 0.310 | 0.077 |
| hippocampus | 0.035 ± 0.014 | 0.068 ± 0.031 | 0.027 ± 0.010 | 0.021 ± 0.0016 | 0.220 | 0.045 | 0.115 | 0.147 |
| thalamus | 0.032 ± 0.007 | 0.045 ± 0.011 | 0.020 ± 0.005 | 0.028 ± 0.0093 | 0.002 | 0.240 | 0.341 | 0.240 |
| brain stem | 0.034 ± 0.008 | 0.049 ± 0.001 | 0.024 ± 0.008 | 0.029 ± 0.0038 | 0.019 | 0.032 | 0.215 | 0.019 |
| cerebellum | 0.040 ± 0.011 | 0.051 ± 0.001 | 0.025 ± 0.005 | 0.032 ± 0.013 | 0.002 | 0.290 | 0.538 | 0.139 |
Figure 7.
Boxplots of uptake (SUV) and the biodistribution of [68Ga]Ga-NOTA-insulin in different brain regions of AD (n = 12), AD (+S961) (n = 5), normal (n = 13), and normal (+S961) (n = 3) mice at 30 min post intravenous (i.v.) administration. The y-axis is presented on the log10 scale. Statistically significant differences indicated by symbols above (** = P < 0.01, * = P < 0.05).
The AD pathology is mostly manifested in the cortex of APP/PS1 mice.30,31 It is encouraging to observe a significant difference in the uptake of [68Ga]Ga-NOTA-insulin in the AD cortex vs normal cortex. In addition, AD cerebellum also showed a significant increase in the uptake of [68Ga]Ga-NOTA-insulin, which was also previously reported as one of the brain regions to be affected in APP/PS1 mice with a significant increase in soluble amyloid-β (Aβ).32 The toxic effect of soluble amyloid-β (Aβ) is known in AD, and its role in the dysregulation of insulin signaling is being investigated in the field.33−35 It is safe to assume that the whole brain could be affected in the APP/PS1 AD mouse model, and that could be the reason for differences in the uptake of [68Ga]Ga-NOTA-insulin in almost all brain regions of the AD brain vs normal brain as observed in our study. Moreover, studies have shown the expression of the IR in various brain regions, including the hypothalamus, olfactory bulb, hippocampus, striatum, cortex, and cerebellum, further suggesting that these brain regions might also be affected in AD.36
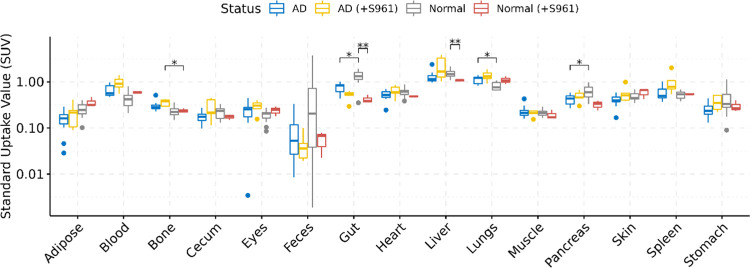
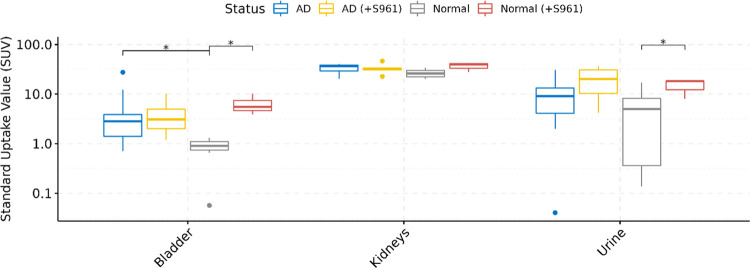
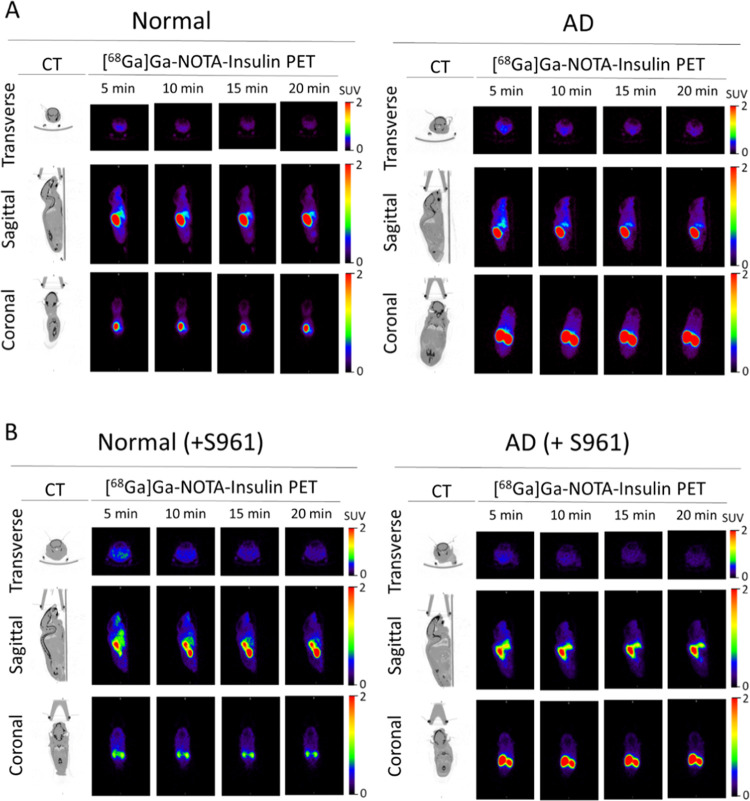
Upon analyzing the whole-body distribution of [68Ga]Ga-NOTA-insulin, it was found that the PET probe distributes throughout the body and accumulates in the liver, lung, heart, spleen, pancreas, blood, and gut among both AD and normal groups of mice (Table 5 and Figure 8). The higher SUV of [68Ga]Ga-NOTA-insulin in the kidneys of both AD and normal groups is indicative of renal excretion as the predominant clearance route for the PET probe (Table 5 and Figure 9). In the highly perfused peripheral organs, the SUV of [68Ga]Ga-NOTA-insulin was significantly lower among AD mice in the liver, pancreas, and gut tissues (Figure 8). The representative microPET/CT images (transverse, sagittal, and coronal views) at various time points (5, 10, 15, and 20 min) of both AD and normal groups of animals are presented in Figure 10. Our observation of the altered uptake of [68Ga]Ga-NOTA-insulin in the heart, lung, liver, pancreas, gut, adipose, stomach, etc. in the APP/PS1 mouse model also supports the hypothesis of the systemic nature of AD pathogenesis.37
Table 5. Uptake (SUV) of [68Ga]Ga-NOTA-Insulin without and with the Insulin Receptor Inhibitor (+S961) in Normal (B6SJL) and AD (APP/PS1) Mouse Models at 30 min Post Intravenous Administration Measured via Organ/Tissue Harvesting.
| SUV: mean ± SD |
adj. P value |
|||||||
|---|---|---|---|---|---|---|---|---|
| organ/tissue | AD (n = 12) | AD (+S961) (n = 5) | normal (n = 13) | normal (+S961) (n = 3) | AD vs normal | AD (+S961) vs normal (+S961) | normal vs normal (+S961) | AD vs AD (+S961) |
| blood | 0.658 ± 0.194 | 0.955 ± 0.331 | 0.447 ± 0.21 | 0.591 ± 0.038 | 0.051 | 0.173 | 0.076 | 0.221 |
| heart | 0.520 ± 0.122 | 0.635 ± 0.181 | 0.620 ± 0.142 | 0.486 ± 0.0197 | 0.290 | 0.295 | 0.087 | 0.373 |
| lungs | 1.115 ± 0.221 | 1.366 ± 0.361 | 0.830 ± 0.167 | 1.097 ± 0.214 | 0.016 | 0.373 | 0.225 | 0.315 |
| liver | 1.293 ± 0.395 | 2.217 ± 1.251 | 1.582 ± 0.294 | 1.070 ± 0.055 | 0.152 | 0.220 | 0.002 | 0.290 |
| spleen | 0.566 ± 0.185 | 1.021 ± 0.591 | 0.519 ± 0.094 | 0.545 ± 0.0211 | 0.701 | 0.220 | 0.484 | 0.220 |
| pancreas | 0.422 ± 0.103 | 0.489 ± 0.131 | 0.644 ± 0.202 | 0.323 ± 0.078 | 0.044 | 0.225 | 0.100 | 0.484 |
| bone | 0.305 ± 0.077 | 0.359 ± 0.061 | 0.242 ± 0.073 | 0.237 ± 0.027 | 0.087 | 0.048 | 0.863 | 0.249 |
| gut | 0.755 ± 0.177 | 0.510 ± 0.121 | 1.414 ± 0.316 | 0.422 ± 0.085 | 0.026 | 0.483 | 0.004 | 0.139 |
| feces | 0.098 ± 0.105 | 0.045 ± 0.031 | 0.830 ± 1.325 | 0.056 ± 0.030 | 0.290 | 0.660 | 0.267 | 0.483 |
| adipose | 0.153 ± 0.072 | 0.214 ± 0.121 | 0.251 ± 0.083 | 0.366 ± 0.086 | 0.064 | 0.215 | 0.195 | 0.473 |
| stomach | 0.258 ± 0.096 | 0.371 ± 0.141 | 0.447 ± 0.327 | 0.300 ± 0.086 | 0.215 | 0.574 | 0.484 | 0.240 |
| skin | 0.413 ± 0.117 | 0.570 ± 0.241 | 0.478 ± 0.095 | 0.582 ± 0.142 | 0.229 | 0.862 | 0.483 | 0.290 |
| muscle | 0.234 ± 0.073 | 0.210 ± 0.031 | 0.219 ± 0.038 | 0.195 ± 0.048 | 0.591 | 0.695 | 0.610 | 0.564 |
| cecum | 0.177 ± 0.055 | 0.277 ± 0.141 | 0.227 ± 0.070 | 0.175 ± 0.023 | 0.225 | 0.341 | 0.267 | 0.325 |
| eyes | 0.235 ± 0.111 | 0.295 ± 0.091 | 0.189 ± 0.058 | 0.241 ± 0.057 | 0.912 | 0.547 | 0.310 | 0.341 |
| bladder | 5.59 ± 7.969 | 4.297 ± 3.571 | 0.852 ± 0.335 | 6.550 ± 3.265 | 0.019 | 0.341 | 0.019 | 0.912 |
| kidneys | 33.348 ± ± 7.118 | 33.144 ± 8.551 | 27.010 ± 4.926 | 36.689 ± 7.604 | 0.088 | 0.613 | 0.240 | 0.955 |
| urine | 11.405 ± 10.548 | 20.892 ± 14.51 | 4.973 ± 6.119 | 14.900 ± 5.880 | 0.337 | 0.881 | 0.045 | 0.310 |
Figure 8.
Boxplots of uptake (SUV) and biodistribution of [68Ga]Ga-NOTA-insulin in AD (n = 12), AD (+S961) (n = 5), normal (n = 13), and normal (+S961) (n = 3) mice at 30 min post intravenous (i.v.) administration. The y-axis is presented on the log10 scale. Statistically significant differences indicated by symbols above (** = P < 0.01, * = P < 0.05).
Figure 9.
Boxplots of uptake (SUV) and biodistribution of [68Ga]Ga-NOTA-insulin in the excretory organs of AD (n = 12), AD (+S961) (n = 5), normal (n = 13), and normal (+S961) (n = 3) mice at 30 min post intravenous (i.v.) administration. The y-axis is presented on the log10 scale. Statistically significant differences indicated by symbols above (* = P < 0.05).
Figure 10.
Representative microPET/CT images of [68Ga]Ga-NOTA-insulin in (A) normal and AD mice and (B) normal (+S961) and AD (+S961) mice at different time points post intravenous (i.v.) administration.
Effect of Insulin Receptor Inhibition
It was intriguing to observe the higher uptake [68Ga]Ga-NOTA-insulin in the AD brain vs the normal brain of mice. To better understand the meaning of a higher uptake of [68Ga]Ga-NOTA-insulin in the AD brain, we used an insulin receptor antagonist peptide (S961) to block insulin receptors and performed the [68Ga]Ga-NOTA-insulin uptake study in the AD and normal groups of mice. After coinjection of S961 along with [68Ga]Ga-NOTA-insulin in the normal group of mice, we noticed a significantly higher uptake of [68Ga]Ga-NOTA-insulin in the brain of the normal group as we observed in the case of the AD group without blocking IR at all time points (Table 2 and Figure 6A–D). This result indicates nonfunctional IR in the AD group of mice. However, we did not notice a significantly higher uptake of [68Ga]Ga-NOTA-insulin in the heart of the normal group, when coinjected with S961 (Table 3 and Figure 6E–H), suggesting a much smaller prevalence of IR in the myocardium than in the brain. Furthermore, the coinjection of S961 with [68Ga]Ga-NOTA-insulin in the normal group showed a similar trend of uptake of [68Ga]Ga-NOTA-insulin within the different brain regions (Figure 7) and also in other organs, as observed in the AD group without IR inhibition (Table 5, Figures 8, and 9). Additionally, we did not observe any difference in the uptake of [68Ga]Ga-NOTA-insulin in the AD group with or without S961 coinjection (Tables 2–5 and Figures 6–9). Based on these observations, it is evident that the inhibition of the insulin receptor does not negatively impact the uptake of insulin in both the heart and brain, irrespective of whether it is normal or AD. In fact, inhibition of the insulin receptor might activate an insulin receptor-independent insulin uptake mechanism in the normal heart and normal brain, which we think is active in AD. The presence of insulin receptor-independent insulin uptake in AD could be the reason for no effect of inhibition of the insulin receptor on the insulin uptake in the AD brain and AD heart (Figure 6).
Among all of the organs and tissues, the AD group with and without S961 treatment showed no significant difference in the uptake of [68Ga]Ga-NOTA-insulin (Table 5 and Figure 8). Within the normal group, after the S961 treatment, a decreased uptake of [68Ga]Ga-NOTA-insulin was observed in the liver and gut. This suggests that the insulin receptor-mediated insulin uptake might be important in the liver and gut in the normal group.
In the case of excretory organs (Table 5 and Figure 9), no difference was seen in the uptake of [68Ga]Ga-NOTA-insulin in the kidneys/bladder and excretion in urine in the S961-treated AD group and untreated AD group. A similar trend was observed when the S961-treated normal and S961-treated AD groups were compared. Within the normal group, S961 treatment increased the uptake of [68Ga]Ga-NOTA-insulin in the bladder and excretion in the urine as compared to the untreated normal group. The present work clearly demonstrates that there might be an alternative mechanism of insulin uptake independent of the IR in AD. However, more work is needed to better understand the insulin dysregulation in AD in the context of insulin receptors and uptake.
AD Pathology Decreases the Brain Influx Clearance of [68Ga]Ga-NOTA-Insulin and Increases the Instantaneous Interaction of [68Ga]Ga-NOTA-Insulin with the BBB
The SUV measurements at various time points in the brain may not adequately capture the dynamic interactions of insulin with the receptors at the BBB and the subsequent influx into the brain in AD vs normal mice. Hence, we have evaluated the plasma pharmacokinetics of [68Ga]Ga-NOTA-insulin, interactions with the BBB, and influx clearance into the brain. Since the influx of large molecules like insulin into the brain is substantially lower than their plasma concentrations, the actual brain uptake can only be reliably determined after deconvolving the plasma radioactivity circulating in the cerebral vasculature. Therefore, we conducted Gjedde–Patlak graphical analysis (Figure 11A–H) to predict the influx clearance of [68Ga]Ga-NOTA-insulin into the brain. In this analysis, we considered the heart ROI, which represents a reversible compartment and a surrogate for plasma levels of [68Ga]Ga-NOTA-insulin. However, no difference between AD or normal mice was observed in either Ki or y-intercept values (Figure 11B–D), which may be due to the substantial accumulation of insulin in the heart tissue that could violate the assumption of the heart as a reversible compartment. Hence, using compartmental analysis described in our previous work,38 we predicted the plasma concentrations of [68Ga]Ga-NOTA-insulin by deconvolving heart tissue accumulation from the whole heart ROI. The plasma levels of [68Ga]Ga-NOTA-insulin thus obtained were higher in AD mice compared to normal mice (Figure 11E), which agrees with the observed trends (Figure 11A). The plasma pharmacokinetics of the probe thus estimated were used to predict the brain influx clearance (Ki) and vascular volume (y-intercept) of [68Ga]Ga-NOTA-insulin (Figure 11F). The Ki estimate was found to be ∼4-fold lower (p = 0.0550, two-tailed t-test) in AD mice compared to normal mice (Figure 11G). Interestingly, the y-intercept of [68Ga]Ga-NOTA-insulin, the vascular volume of distribution V0, was found to be ∼1.3-fold higher (p < 0.05, two-tailed t-test) in the AD compared to normal mice (Figure 11H). In agreement with our previous studies using [125I]I-insulin, higher V0 indicates greater binding of insulin to its receptor. But a higher V0 in AD mice neither enhanced the brain insulin uptake nor increased downstream insulin signaling.39 The molecular mechanisms driving this behavior in AD mice are currently under investigation.
Figure 11.
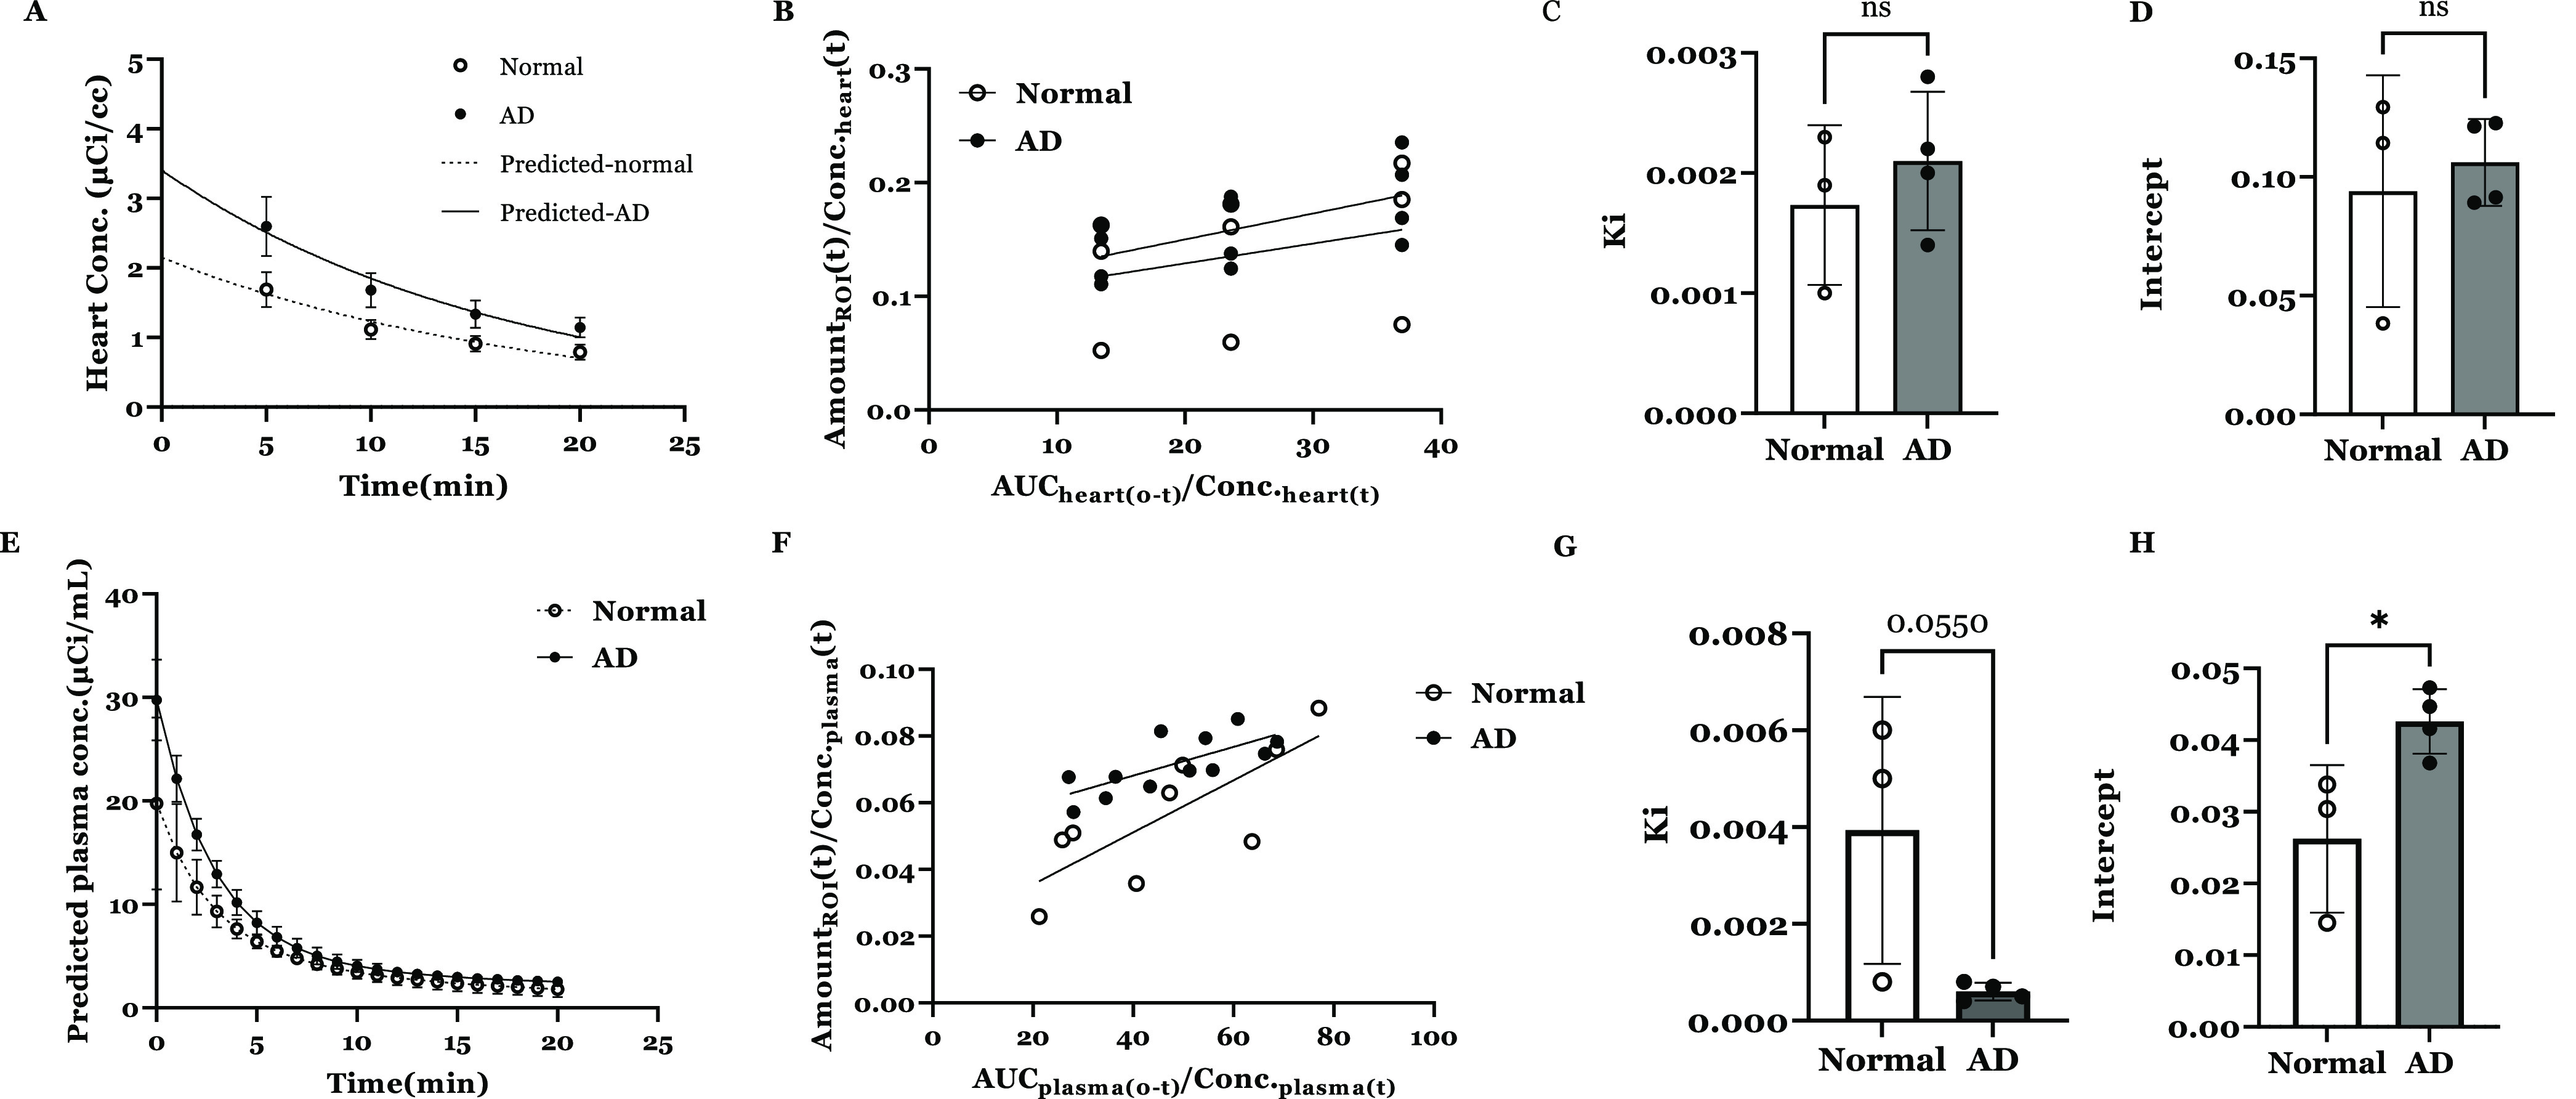
(A) Heart concentration vs time profile of [68Ga]Ga-NOTA-insulin in normal vs AD mice. Observed values (mean ± SD, normal: n = 4, AD: n = 3) overlaid with the predicted curves are shown. (B) Gjedde–Patlak plot describing the Ga-insulin influx clearance and ligand binding with the receptor at the BBB interface in the normal vs AD mouse using heart concentration data. Observed values (mean ± SD) are shown. Bar graph of the brain influx clearance (C) and instantaneous interaction with the BBB (D) of [68Ga]Ga-NOTA-insulin were estimated by the slope and intercept obtained from Gjedde–Patlak graphical analysis. Observed values (mean ± SD) and unpaired Student’s t-test are shown. (E) Predicted plasma concentration vs time profile of [68Ga]Ga-NOTA-insulin in normal vs AD mice. Observed values (mean ± SD) overlaid with the predicted curves are shown. (F) Gjedde–Patlak plot describing the [68Ga]Ga-NOTA-insulin influx clearance and instantaneous interaction with the BBB in the normal vs AD mouse using predicted plasma concentration data. Observed values (mean ± SD) are shown. Bar graph of the brain influx clearance (G) and the receptor binding at the BBB interface (H) of [68Ga]Ga-NOTA-insulin were estimated by the slope and intercept obtained from Gjedde–Patlak graphical analysis. Observed values (mean ± SD) and unpaired Student’s t-test (*p < 0.05) are shown.
Uptake and Biodistribution of [11C]PIB and [18F]AV1451 in Normal (B6SJL) and AD (APP/PS1) Mouse Models
Since we observed a significant difference in the uptake of [68Ga]Ga-NOTA-insulin in normal vs AD mice. We were curious to study the uptake profile of [11C]PIB and [18F]AV1451 in the same normal (B6SJL) and AD (APP/PS1) mouse models in the hope that the uptake profile of [11C]PIB and [18F]AV1451 will shed more light on the AD pathophysiology. Both [11C]PIB and [18F]AV1451 were manufactured in our PET facility as described in the method section and administered in the same normal (B6SJL) and AD (APP/PS1) mouse models. The in vivo evaluation of [11C]PIB and [18F]AV1451 in normal and AD mice showed the uptake of both the tracers from the brain and heart but slowly washed out over time and neither of them showed any significant difference in the uptake between normal and AD groups at any time point (Tables S2–S7 and Figures S8–S11). These observations support the inability of [11C]PIB to image AβO in the APP/PS1 mouse model.40 Additionally, the absence of tau pathologies involving the formation of tau fibrils in the APP/PS1 mouse model was the reason for no observed differences in the uptake of [18F]AV1451 in the normal and AD groups.41
Conclusions
This study describes the successful design, synthesis, and preliminary evaluation of a novel PET probe, [68Ga]Ga-NOTA-insulin, to noninvasively study the role of insulin in the pathophysiology of AD via PET imaging. The synthesis of NOTA-insulin was achieved successfully in >90% yield, and the formation of NOTA-insulin was characterized by MALDI-TOF analysis. The functional nature of NOTA-insulin similar to insulin was also confirmed by demonstrating the phosphorylation of insulin signaling kinases in hCMEC/D3 monolayers with NOTA-insulin to ensure that its functional activity is intact even after modification. Radiolabeling of NOTA-insulin was successfully performed with 68Ga at room temperature in 10 min in >99% radiochemical purity and in high molar activity (1.1 ± 0.26 GBq/μmol) at the end of synthesis. The intravenous injection of [68Ga]Ga-NOTA-insulin was very well tolerated by both AD and normal groups of animals. The developed PET probe showed a significantly higher uptake in the AD mouse brain than the normal mouse brain at 5, 10, 15, and 20 min time points post administration. The biodistribution study demonstrated the differential uptake of [68Ga]Ga-NOTA-insulin in the AD brain, including a significantly higher uptake in the cortex, thalamus, brain stem, and cerebellum, of the AD mouse brain than those of the normal mouse brain. Although the reason for this difference was not determined, the time course of AD/normal differences in the heart and brain implies increased BBB permeability in the AD group. Nevertheless, the developed insulin-based PET probe showed a relatively lower SUV in the brain regions at 30 min post injection, which may limit its immediate clinical translation. Furthermore, imaging and biodistribution results demonstrated that [68Ga]Ga-NOTA-insulin was preferentially cleared by the kidneys. The kinetic modeling study using Gjedde–Patlak graphical analysis demonstrated a lower influx clearance of insulin in AD mice. Additionally, a blocking study with an insulin receptor antagonist peptide (S961) showed a higher uptake of [68Ga]Ga-NOTA-insulin in the normal group as it was observed in the AD case, suggesting a nonfunctional IR in AD and the presence of an alternative mechanism of insulin uptake in the absence of a functional IR.
Materials and Methods
Chemicals and Instruments
Sodium bicarbonate, acetonitrile (HPLC grade), and trifluoroacetic acid (TFA, 99%) were purchased from Sigma-Aldrich (St. Louis, MO). The i-TLC paper was purchased from Agilent Technologies (Palo Alto, CA). The labeling precursor p-SCN-Bn-NOTA (B-605, ≥94%) was purchased from Macrocyclics, Plano, TX. The radioactive samples were counted using a Wizard 2480 gamma counter (PerkinElmer, Waltham, MA). The radioactivity readings were recorded using a CRC dose calibrator (416 setting for 68Ga, CRC-55tPET, Capintec, Ramsey, NJ). The MALDI-TOF analysis was performed at the Mass Spectrometry Facility, School of Chemical Sciences, University of Illinois at Urbana-Champaign. The radio-iTLC was performed on an Eckert & Ziegler scanner (Valencia, CA). The glucose level was measured using a handheld glucometer with Bayer Breeze 2, Whippany, NJ. The microPET/CT was performed on an Inveon Multiple Modality PET/CT scanner by Siemens Medical Solutions, Inc. Knoxville, TN. Autoradiography was performed using a Cyclone Plus Storage Phosphor System by PerkinElmer Corporation, Waltham, MA.
Synthesis of NOTA-Insulin
NOTA-NCS (3.2 mg, 0.0057 mmol, 2.46 equiv) (Macrocyclics, Plano, TX) was weighed in a clean, dry, glass vial with a magnetic stir bar. The NOTA-NCS was dissolved in molecular biology grade water (400 μL) (Sigma-Aldrich, St. Louis, MO). Free insulin (13.5 mg, 0.0023 mmol, 1.00 equiv) was added to the reaction vessel. The pH was adjusted to 6.3–6.5 by the addition of 0.1 N Na2CO3 (78 μL), and the reaction was stirred at room temperature for 5 h. The crude product was stored at −20 °C.
Purification of NOTA-Insulin by Size Exclusion Chromatography
A PD-10 column (GE Healthcare, Chicago, IL) was prepared according to the manufacturer’s instructions. The column was equilibrated with 4 column volumes of 1.0 M sodium acetate buffer (pH = 6.5). The crude NOTA-insulin was transferred from the reaction vessel to the column with a micropipette, and then the reaction vessel was washed with 1.0 mL of 1.0 M sodium acetate buffer (pH = 6.5). The wash was loaded onto the column, and the flow-through was discarded. The NOTA-insulin was eluted into 6 × 1 mL fractions with 1.0 M sodium acetate buffer (pH = 6.5).
HPLC
Analytical HPLC of the purified NOTA-insulin was performed on a Luna 5 μm C18(2) 100 Å LC Column 250 × 4.6 mm at a UV detector wavelength of 214 nm. The flow rate was 0.5 mL/min. A gradient mobile phase was used (Eluent A: 0.1% TFA in acetonitrile; Eluent B: 0.1% TFA in water): 25% A at 0 min, then 30% A at 5 min, and then 32.2% A from 10 to 90 min. The obtained fractions were analyzed for chemical purity. Yield: 13.2 mg (91%).
MALDI-TOF
Observed m/z 6256.3 calculated 6258 (Figure S6).
Synthesis of [11C]C-PiB and [18F]F-AV1451
Both [11C]C-PiB42 and [18F]F-AV145143 were synthesized as part of our routine clinical practice and used as such as they were used in patients. Briefly, both [11C]C-PiB (Am = 86.34 ± 43.96 GBq/μmol, n = 4) and [18F]F-AV1451 (Am = 163.56 ± 48.24 GBq/μmol, n = 4) were formulated in 0.9% saline and had <10% ethanol in their final formulations.42,43
Insulin Tolerance Test (ITT) and Insulin Functional Assay
Insulin tolerance test (ITT) was performed in vivo in a group of normal (B6SJL, female) mice subjected to fasting for 4 h by injecting 0.2 IU/kg NOTA-insulin (intraperitoneally). After the injection of NOTA-insulin, the blood glucose level was measured at different time intervals, including time zero, 15, 30, 60, and 120 min by collecting blood from the tail vein cut. The glucose level was measured using a handheld glucometer (Bayer Breeze 2, Whippany, NJ), which was calibrated prior to the use. In our test, we used NOTA-insulin concentration in a way to match the concentration of NOTA-insulin present in our final [68Ga]Ga-NOTA-insulin formulation.
Cell Culture
The immortalized human cerebral microvascular endothelial cell line (hCMEC/D3) was kindly obtained as a gift from P-O Couraud (Institut Cochin, France). The cells were cultured as described previously.44,45
Western Blot
Western blots were performed as described in our previous publications.46,47 Briefly, hCMEC/D3 monolayers cultured on 6-well plates were treated with or without NOTA-insulin or Humulin (100 nM) in Dulbecco’s modified Eagle medium (DMEM) for 20 min at 37 °C. Following this, the cells were washed three times with PBS and lysed in a radioimmunoprecipitation assay (RIPA) buffer containing protease and phosphatase inhibitors (Sigma-Aldrich, St. Louis. MO). Total protein concentrations in the lysates were determined by the bicinchoninic acid (BCA) assay (Pierce, Waltham, MA). Lysates (20 μg of protein per lane) were loaded onto 4–12% Criterion XT precast gels and resolved by SDS-PAGE under reducing conditions (Bio-Rad Laboratories, Hercules, CA). The proteins were then electroblotted onto a 0.45 μm nitrocellulose membrane. Membranes were blocked with 5% nonfat dry milk protein (Bio-Rad Laboratories, Hercules, CA) and then incubated overnight at 4 °C with primary antibodies (1:1000) against Vinculin, Akt, p-Akt (S473) (Cell Signaling Technology, Danvers, MA), followed by incubation with dye-conjugated secondary antibody (1:2000) for 1 h at room temperature. Immunoreactive bands were then imaged (Odyssey CLx; LI-COR Inc, Lincoln, NE) and the band intensities were quantified by densitometry (Image Studio Lite Software, LI-COR Inc, Lincoln, NE).
Radiosynthesis of [68Ga]Ga-NOTA-Insulin
To 1.0 mL of [68Ga]GaCl3 eluted from the 68Ge/68Ga generator (Eckert & Ziegler, Valencia, CA) added in a clean, dry, glass vial, 70 μL of 3.0 M sodium acetate buffer (pH = 8.5) was added to adjust the pH to 4.4–4.7. NOTA-insulin (100 μL) was added to the mixture, and the reaction was stirred at room temperature for 10 min. The final pH was adjusted to 6.1–6.5 by the addition of 170 μL of 3 M sodium acetate buffer (pH = 8.5). The final product was then passed through a Millex-GV 0.22 μm sterile filter unit (Merck, Kenilworth, NJ). The yield of the reaction was found to be >99% (Figure 3) and molar activity (Am) at end of the synthesis was found to be 1.1 ± 0.26 GBq/μmol (n = 11) (Table S1). Molar activity (Am) was measured by dividing the radioactivity (GBq) present at the end of the synthesis with the amount of NOTA-insulin (μmol) present in the final formulation, whereas specific activity (As) was measured by dividing the radioactivity (MBq) present at the time of injection with the amount of NOTA-insulin (μg) present in the injected volume. The amount of insulin in the final formulation was estimated by the Bradford assay.48
Radio-iTLC
Radio-iTLC was performed using iTLC-SG paper (Agilent Technologies, Santa Clara, CA). The paper was developed in 0.1 M sodium citrate solution (pH = 7) and analyzed on a radio-iTLC scanner (Eckert & Ziegler, Valencia, CA). [68Ga]Ga-NOTA-insulin Rf = 0.0–0.2, and free [68Ga] Rf = 0.8–1.0.
Stability Analysis
The [68Ga]Ga-NOTA-insulin was tested for stability at room temperature at the following time increments after the end of synthesis: 0, 30, 60, 90, 120, 180, and 240 min. The test was carried out using radio-iTLC to check the radiochemical purity. Extremely low amounts of radioactivity were left after 240 min to continue further stability analysis.
SDS-PAGE and Autoradiography
The SDS-PAGE was performed as per the established protocol.49 Insulin, NOTA-insulin, and [68Ga]Ga-NOTA-insulin were diluted with 1:1 Tricine Sample Buffer + 2% β-mercaptoethanol. The diluted protein samples were reduced at 80 °C for 3 min. The reduced proteins were resolved by one-dimensional SDS-PAGE in 16.5% Mini-PROTEAN Tris-Tricine Gel (Bio-Rad laboratories, Hercules, CA) in 1× Tris-Tricine-SDS Running Buffer. Precision Plus Protein Dual Xtra Standards (2–250 kDa) (Bio-Rad Laboratories, Hercules, CA) were used as the protein marker. After electrophoresis, autoradiography for detecting [68Ga]Ga-NOTA-insulin in the gel was performed using a Cyclone Plus Storage Phosphor System (PerkinElmer Corporation, Waltham, MA). Following autoradiography, gels were silver stained using the ProteoSilver Plus Silver Stain Kit (Sigma, St. Louis, MO).
MicroPET Imaging and Ex Vivo Biodistribution
Experiments were performed with ∼6-month-old B6SJL mice and ∼6-month-old APP/PS1 mice (Mutant Mouse Resource & Research Centers—The Jackson Laboratory, Bar Harbor, ME). The [68Ga]Ga-NOTA-insulin (0.057–10.81 MBq/μg) was injected intravenously through a tail vein or femoral vein. The animals then immediately underwent a dynamic 20 min PET scan, followed by a 7 min CT scan using Siemens Inveon preclinical small-animal PET/CT system. Following imaging, the mice were sacrificed, tissues were extracted, and radioactivity was counted using a gamma counter to evaluate the biodistribution of 68Ga radioactivity. PET images were normalized to units of standardized uptake value (SUV) = [activity concentration in tissue/(injected dose/g whole body wt)] and presented as transverse, coronal, and sagittal sectional images.50,51 The [11C]PIB (183.77 ± 135.08 MBq/μg) and [18F]AV1451 (456.53 ± 141.70 MBq/μg) were injected intravenously through a tail vein or femoral vein of the mice. In the case of the [68Ga]Ga-NOTA-insulin group, the radiolabeled insulin was coinjected without or with 10 μg of the insulin receptor inhibitor, S961 acetate (MedChemExpress, Monmouth Junction, NJ) per animal.52 The PET images were visualized using MIM software (MIM Software Inc., Cleveland, OH) and SUVs in the brain and heart at different time points were computed using PMOD software (PMOD Technologies LLC, Zürich, Switzerland).
Measurement of the Blood-to-Brain Influx Clearance
The blood-to-brain influx clearance of [68Ga]Ga-NOTA-insulin was determined by Gjedde–Patlak graphical analysis,53 which involves plotting
where XROI (t) is the brain radioactivity (μCi) at time t (min), Cp (t) is the plasma concentration (μCi/mL) at time t (min), and AUCp0t is the area under the predicted plasma concentration or heart activity concentration vs time profile (μCi*min/mL) from time 0–t obtained by the logarithmic trapezoidal method. The slope and intercept obtained from the regression of the linear portion of the curve correspond to the brain influx clearance (Ki, mL/min) and the instantaneous interaction with the BBB (mL), respectively. To construct the plots for [68Ga]Ga-NOTA-insulin, the plasma concentrations at each imaging time point were predicted using the three-compartment heart deconvolution model in SAAMII simulation software (The Epsilon Group, Charlottesville, VA) or heart imaging data were used as a surrogate for plasma pharmacokinetics.
Heart Deconvolution Model
Heart radioactivity was measured by PET/CT dynamic imaging after the intravenous injection of [68Ga]Ga-NOTA-insulin. A three-compartment model was then constructed including intact (compartment 1) and degraded (compartment 2) radiotracer in the heart plasma as well as both intact or degraded [68Ga]Ga-NOTA-insulin in the heart tissue (compartment 3). The intact and degraded [68Ga]Ga-NOTA-insulin are defined by forcing functions as presented below
where q1 and q2 are radioactivities of intact and degraded [68Ga]Ga-NOTA-insulin in the heart vascular space, Vp is the volume of the heart vascular space, and A, B, α, β, B0, and B1 are parameters defining intact/degraded [68Ga]Ga-NOTA-insulin plasma concentrations.
The model was fitted to the heart radioactivity time data of [68Ga]Ga-NOTA-insulin, and plasma pharmacokinetic parameters (A, B, α, β) for intact [68Ga]Ga-NOTA-insulin were predicted.
Statistical Analysis
All statistical analyses were performed using GraphPad Prism (GraphPad software; La Jolla, CA) and R v4.0.3 (R Core Team; Vienna, Austria). Unpaired two-tailed t-tests were used to compare brain influx clearances (Ki) and intercepts of the Gjedde–Patlak plot in normal vs AD mice, as well as protein expression or phosphorylation levels in cells pretreated with vs without NOTA-insulin and/or insulin. Uptake values for the biodistribution analyses were summarized by means and standard deviations. Statistical comparisons of log-transformed uptake values between groups by tissue type were performed using two-sample Welch t-tests for four pairwise comparisons of interest: AD vs normal, AD vs AD (+S961), normal vs normal (+S961), and AD (+S961) vs normal (+S961). P-values for these comparisons were adjusted for multiple testing using the Benjamini-Hochberg false discovery rate method. A multivariate comparison of brain region levels across the four groups was performed using a one-way nonparametric MANOVA-type test via permutation. For all analyses, an adjusted two-sided p value of ≤0.05 was considered statistically significant.
Ethical Statement
All of the studies were conducted under the recommended guidelines following the approval of the Institutional Animal Care and Use Committee (IACUC) of the Mayo Clinic Rochester MN.
Acknowledgments
This project was funded by the Minnesota Partnership for Biotechnology and Medical Genomics and the Department of Radiology, Mayo Clinic, Rochester, Minnesota, United States. The authors thank Dr. Surendra R. Gundam and Sujala Ghatamaneni for their assistance during the study.
Glossary
Abbreviations
- Aβ
β-amyloid peptide
- AβO
β-amyloid oligomers
- AD
Alzheimer’s disease
- CT
computed tomography
- [18F] FDG
2-deoxy-2-[18F]fluoroglucose
- IR
insulin receptor
- MAD
median absolute deviation
- NOTA
1,4,7-triazacyclononane-N,N′,N″-triacetic acid
- NOTA-NCS
2-(4-isothiocyanatobenzyl)-1,4,7-triazacyclononane-1,4,7-triacetic acid
- PET
positron emission tomography
- T2DM
type 2 diabetes mellitus
- RO1
region of interest
- SUV
standardized uptake value
- S961
an insulin receptor antagonist peptide
- [18F]AV1451
[18F]flortaucipir or 7-(6-[18F]fluoropyridin-3-yl)-5H-pyrido[4,3-b]indole
- [11C]PIB
Pittsburgh compound B or N-methyl [11C] 2-(4′-methylaminophenyl)-6-hydroxy-benzothiazole
- IRS
insulin receptor substrate
- MAP kinase
mitogen-activated protein kinase
- PI3 kinase
phosphoinositide 3-kinase
- Akt
protein kinase B
Supporting Information Available
The Supporting Information is available free of charge at https://pubs.acs.org/doi/10.1021/acs.bioconjchem.2c00126.
MALDI-TOF and HPLC traces of insulin and NOTA-insulin at different steps of synthesis and purification have been included in the supporting information; rad-TLC trace of [68Ga]Ga-NOTA-insulin; molar activity of [68Ga]Ga-NOTA-insulin and results of uptake of [18F]AV1451 and [11C]PIB; microPET/CT images of [18F]AV1451 and [11C]PIB and their biodistribution (PDF)
Author Contributions
⊥ J.C.T. and N.R.N. contributed equally to this study.
The authors declare no competing financial interest.
Supplementary Material
References
- Kahn C. R. The molecular mechanism of insulin action. Annu. Rev. Med. 1985, 36, 429–451. 10.1146/annurev.me.36.020185.002241. [DOI] [PubMed] [Google Scholar]
- Wilcox G. Insulin and insulin resistance. Clin. Biochem. Rev. 2005, 26, 19–39. [PMC free article] [PubMed] [Google Scholar]
- Havrankova J.; Schmechel D.; Roth J.; Brownstein M. Identification of insulin in rat brain. Proc. Natl. Acad. Sci. U.S.A. 1978, 75, 5737–5741. 10.1073/pnas.75.11.5737. [DOI] [PMC free article] [PubMed] [Google Scholar]
- Craft S. Insulin resistance syndrome and Alzheimer’s disease: age- and obesity-related effects on memory, amyloid, and inflammation. Neurobiol. Aging 2005, 26, 65–69. 10.1016/j.neurobiolaging.2005.08.021. [DOI] [PubMed] [Google Scholar]
- Fishel M. A.; Watson G. S.; Montine T. J.; Wang Q.; Green P. S.; Kulstad J. J.; Cook D. G.; Peskind E. R.; Baker L. D.; Goldgaber D.; et al. Hyperinsulinemia provokes synchronous increases in central inflammation and beta-amyloid in normal adults. Arch. Neurol. 2005, 62, 1539–1544. 10.1001/archneur.62.10.noc50112. [DOI] [PubMed] [Google Scholar]
- Gasparini L.; Gouras G. K.; Wang R.; Gross R. S.; Beal M. F.; Greengard P.; Xu H. Stimulation of beta-amyloid precursor protein trafficking by insulin reduces intraneuronal beta-amyloid and requires mitogen-activated protein kinase signaling. J. Neurosci. 2001, 21, 2561–2570. 10.1523/JNEUROSCI.21-08-02561.2001. [DOI] [PMC free article] [PubMed] [Google Scholar]
- Zhao W. Q.; De Felice F. G.; Fernandez S.; Chen H.; Lambert M. P.; Quon M. J.; Krafft G. A.; Klein W. L. Amyloid beta oligomers induce impairment of neuronal insulin receptors. FASEB J. 2008, 22, 246–260. 10.1096/fj.06-7703com. [DOI] [PubMed] [Google Scholar]
- Janson J.; Laedtke T.; Parisi J. E.; O’Brien P.; Petersen R. C.; Butler P. C. Increased Risk of Type 2 Diabetes in Alzheimer Disease. Diabetes 2004, 53, 474–481. 10.2337/diabetes.53.2.474. [DOI] [PubMed] [Google Scholar]
- Profenno L. A.; Porsteinsson A. P.; Faraone S. V. Meta-analysis of Alzheimer’s disease risk with obesity, diabetes, and related disorders. Biol. Psychiatry 2010, 67, 505–512. 10.1016/j.biopsych.2009.02.013. [DOI] [PubMed] [Google Scholar]
- Akomolafe A.; Beiser A.; Meigs J. B.; Au R.; Green R. C.; Farrer L. A.; Wolf P. A.; Seshadri S. Diabetes Mellitus and Risk of Developing Alzheimer Disease: Results From the Framingham Study. Arch. Neurol. 2006, 63, 1551–1555. 10.1001/archneur.63.11.1551. [DOI] [PubMed] [Google Scholar]
- Pei J. J.; Braak H.; An W. L.; Winblad B.; Cowburn R. F.; Iqbal K.; Grundke-Iqbal I. Up-regulation of mitogen-activated protein kinases ERK1/2 and MEK1/2 is associated with the progression of neurofibrillary degeneration in Alzheimer’s disease. Mol. Brain Res. 2002, 109, 45–55. 10.1016/S0169-328X(02)00488-6. [DOI] [PubMed] [Google Scholar]
- Gabbouj S.; Ryhänen S.; Marttinen M.; Wittrahm R.; Takalo M.; Kemppainen S.; Martiskainen H.; Tanila H.; Haapasalo A.; Hiltunen M.; et al. Altered Insulin Signaling in Alzheimer’s Disease Brain—Special Emphasis on PI3K-Akt Pathway. Front. Neurosci. 2019, 13, 629 10.3389/fnins.2019.00629. [DOI] [PMC free article] [PubMed] [Google Scholar]
- Craft S.; Peskind E.; Schwartz M. W.; Schellenberg G. D.; Raskind M.; Porte D. Jr. Cerebrospinal fluid and plasma insulin levels in Alzheimer’s disease: relationship to severity of dementia and apolipoprotein E genotype. Neurology 1998, 50, 164–168. 10.1212/WNL.50.1.164. [DOI] [PubMed] [Google Scholar]
- De Felice F. G. Alzheimer’s disease and insulin resistance: translating basic science into clinical applications. J. Clin. Invest. 2013, 123, 531–539. 10.1172/JCI64595. [DOI] [PMC free article] [PubMed] [Google Scholar]
- Moloney A. M.; Griffin R. J.; Timmons S.; O’Connor R.; Ravid R.; O’Neill C. Defects in IGF-1 receptor, insulin receptor and IRS-1/2 in Alzheimer’s disease indicate possible resistance to IGF-1 and insulin signalling. Neurobiol. Aging 2010, 31, 224–243. 10.1016/j.neurobiolaging.2008.04.002. [DOI] [PubMed] [Google Scholar]
- Matthews K. A.; Xu W.; Gaglioti A. H.; Holt J. B.; Croft J. B.; Mack D.; McGuire L. C. Racial and ethnic estimates of Alzheimer’s disease and related dementias in the United States (2015-2060) in adults aged ≥ 65 years. Alzheimers Dement. 2019, 15, 17–24. 10.1016/j.jalz.2018.06.3063. [DOI] [PMC free article] [PubMed] [Google Scholar]
- Minoshima S.; Giordani B.; Berent S.; Frey K. A.; Foster N. L.; Kuhl D. E. Metabolic reduction in the posterior cingulate cortex in very early Alzheimer’s disease. Ann. Neurol. 1997, 42, 85–94. 10.1002/ana.410420114. [DOI] [PubMed] [Google Scholar]
- Friedland R. P.; Budinger T. F.; Ganz E.; Yano Y.; Mathis C. A.; Koss B.; Ober B. A.; Huesman R. H.; Derenzo S. E. Regional cerebral metabolic alterations in dementia of the Alzheimer type: positron emission tomography with [18F]fluorodeoxyglucose. J. Comput. Assist. Tomogr. 1983, 7, 590–598. 10.1097/00004728-198308000-00003. [DOI] [PubMed] [Google Scholar]
- Schubert J. J.; Veronese M.; Marchitelli L.; Bodini B.; Tonietto M.; Stankoff B.; Brooks D. J.; Bertoldo A.; Edison P.; Turkheimer F. E. Dynamic 11C-PiB PET Shows Cerebrospinal Fluid Flow Alterations in Alzheimer Disease and Multiple Sclerosis. J. Nucl. Med. 2019, 60, 1452–1460. 10.2967/jnumed.118.223834. [DOI] [PMC free article] [PubMed] [Google Scholar]
- Peretti D. E.; Vállez García D.; Reesink F. E.; van der Goot T.; De Deyn P. P.; de Jong B. M.; Dierckx R. A. J. O.; Boellaard R. Relative cerebral flow from dynamic PIB scans as an alternative for FDG scans in Alzheimer’s disease PET studies. PLoS One 2019, 14, e0211000 10.1371/journal.pone.0211000. [DOI] [PMC free article] [PubMed] [Google Scholar]
- Mattsson N.; Smith R.; Strandberg O.; Palmqvist S.; Schöll M.; Insel P. S.; Hägerström D.; Ohlsson T.; Zetterberg H.; Blennow K.; et al. Comparing 18F-AV-1451 with CSF t-tau and p-tau for diagnosis of Alzheimer disease. Neurology 2018, 90, e388–e395. 10.1212/WNL.0000000000004887. [DOI] [PMC free article] [PubMed] [Google Scholar]
- Passamonti L.; Vázquez Rodríguez P.; Hong Y. T.; Allinson K. S.; Williamson D.; Borchert R. J.; Sami S.; Cope T. E.; Bevan-Jones W. R.; Jones P. S.; et al. 18F-AV-1451 positron emission tomography in Alzheimer’s disease and progressive supranuclear palsy. Brain 2017, 140, 781–791. 10.1093/brain/aww340. [DOI] [PMC free article] [PubMed] [Google Scholar]
- Glaser M.; Brown D. J.; law M. P.; Iozzo P.; Waters S. L.; Poole K.; Knickmeier M.; Camici P. G.; Pike V. W. Preparation of no-carrier-added [124I]A14-iodoinsulin as a radiotracer for positron emission tomography. J. Labelled Compd. Radiopharm. 2001, 44, 465–480. 10.1002/jlcr.482. [DOI] [Google Scholar]
- Pandey M. K.; Byrne J. F.; Jiang H.; Packard A. B.; DeGrado T. R. Cyclotron production of 68Ga via the 68Zn(p,n)68)Ga reaction in aqueous solution. Am. J. Nucl. Med. Mol. Imaging 2014, 4, 303–310. [PMC free article] [PubMed] [Google Scholar]
- Pandey M. K.; Byrne J. F.; Schlasner K. N.; Schmit N. R.; DeGrado T. R. Cyclotron production of 68Ga in a liquid target: Effects of solution composition and irradiation parameters. Nucl. Med. Biol. 2019, 74–75, 49–55. 10.1016/j.nucmedbio.2019.03.002. [DOI] [PubMed] [Google Scholar]
- Pandey M. K.; DeGrado T. R. Cyclotron Production of PET Radiometals in Liquid Targets: Aspects and Prospects. Curr. Radiopharm. 2021, 14, 325–339. 10.2174/1874471013999200820165734. [DOI] [PMC free article] [PubMed] [Google Scholar]
- Turdi S.; Guo R.; Huff A. F.; Wolf E. M.; Culver B.; Ren J. Cardiomyocyte contractile dysfunction in the APPswe/PS1dE9 mouse model of Alzheimer’s disease. PLoS One 2009, 4, e6033 10.1371/journal.pone.0006033. [DOI] [PMC free article] [PubMed] [Google Scholar]
- Stampfer M. J. Cardiovascular disease and Alzheimer’s disease: common links. J. Intern. Med. 2006, 260, 211–223. 10.1111/j.1365-2796.2006.01687.x. [DOI] [PubMed] [Google Scholar]
- González-Domínguez R.; García-Barrera T.; Vitorica J.; Gómez-Ariza J. L. High throughput multiorgan metabolomics in the APP/PS1 mouse model of Alzheimer’s disease. Electrophoresis 2015, 36, 2237–2249. 10.1002/elps.201400544. [DOI] [PubMed] [Google Scholar]
- Holcomb L.; Gordon M. N.; McGowan E.; Yu X.; Benkovic S.; Jantzen P.; Wright K.; Saad I.; Mueller R.; Morgan D.; et al. Accelerated Alzheimer-type phenotype in transgenic mice carrying both mutant amyloid precursor protein and presenilin 1 transgenes. Nat. Med. 1998, 4, 97–100. 10.1038/nm0198-097. [DOI] [PubMed] [Google Scholar]
- Whitesell J. D.; Buckley A. R.; Knox J. E.; Kuan L.; Graddis N.; Pelos A.; Mukora A.; Wakeman W.; Bohn P.; Ho A.; et al. Whole brain imaging reveals distinct spatial patterns of amyloid beta deposition in three mouse models of Alzheimer’s disease. J. Comp. Neurol. 2019, 527, 2122–2145. 10.1002/cne.24555. [DOI] [PMC free article] [PubMed] [Google Scholar]
- Hoxha E.; Boda E.; Montarolo F.; Parolisi R.; Tempia F. Excitability and synaptic alterations in the cerebellum of APP/PS1 mice. PLoS One 2012, 7, e34726 10.1371/journal.pone.0034726. [DOI] [PMC free article] [PubMed] [Google Scholar]
- Goure W. F.; Krafft G. A.; Jerecic J.; Hefti F. Targeting the proper amyloid-beta neuronal toxins: a path forward for Alzheimer’s disease immunotherapeutics. Alzheimers Res. Ther. 2014, 6, 42 10.1186/alzrt272. [DOI] [PMC free article] [PubMed] [Google Scholar]
- Heras-Sandoval D.; Ferrera P.; Arias C. Amyloid-β protein modulates insulin signaling in presynaptic terminals. Neurochem. Res. 2012, 37, 1879–1885. 10.1007/s11064-012-0800-7. [DOI] [PubMed] [Google Scholar]
- Vandal M.; White P. J.; Tremblay C.; St-Amour I.; Chevrier G.; Emond V.; Lefrançois D.; Virgili J.; Planel E.; Giguere Y.; et al. Insulin reverses the high-fat diet-induced increase in brain Aβ and improves memory in an animal model of Alzheimer disease. Diabetes 2014, 63, 4291–4301. 10.2337/db14-0375. [DOI] [PubMed] [Google Scholar]
- Scherer T.; Sakamoto K.; Buettner C. Brain insulin signalling in metabolic homeostasis and disease. Nat. Rev. Endocrinol. 2021, 17, 468–483. 10.1038/s41574-021-00498-x. [DOI] [PubMed] [Google Scholar]
- Peng Y.; Gao P.; Shi L.; Chen L.; Liu J.; Long J. Central and Peripheral Metabolic Defects Contribute to the Pathogenesis of Alzheimer’s Disease: Targeting Mitochondria for Diagnosis and Prevention. Antioxid. Redox Signaling 2020, 32, 1188–1236. 10.1089/ars.2019.7763. [DOI] [PMC free article] [PubMed] [Google Scholar]
- Wang Z.; Wang L.; Curran G. L.; Vernon C. J.; Min P. H.; Lowe V. J.; Kandimalla K. K. In Prediction of Plasma Pharmacokinetics from Dynamic Heart Imaging Data, AAPS Annual Meeting, Philadelphia, PA, 2021.
- Sarma V.; Swaminathan S. K.; Jaruszewski K. M.; Curran G. L.; Kalari K. R.; Lowe V. J.; Kandimalla K. K. In Alzheimer’s Disease Aβ Peptides Impair the Dynamics of Insulin Transport Across the Blood-Brain Barrier, AAPS Annual Meeting, San Diego, CA, 2016.
- Klunk W. E.; Lopresti B. J.; Ikonomovic M. D.; Lefterov I. M.; Koldamova R. P.; Abrahamson E. E.; Debnath M. L.; Holt D. P.; Huang G. F.; Shao L.; et al. Binding of the positron emission tomography tracer Pittsburgh compound-B reflects the amount of amyloid-beta in Alzheimer’s disease brain but not in transgenic mouse brain. J. Neurosci. 2005, 25, 10598–10606. 10.1523/JNEUROSCI.2990-05.2005. [DOI] [PMC free article] [PubMed] [Google Scholar]
- Metaxas A.; Thygesen C.; Kempf S. J.; Anzalone M.; Vaitheeswaran R.; Petersen S.; Landau A. M.; Audrain H.; Teeling J. L.; Darvesh S.; et al. Ageing and amyloidosis underlie the molecular and pathological alterations of tau in a mouse model of familial Alzheimer’s disease. Sci. Rep. 2019, 9, 15758 10.1038/s41598-019-52357-5. [DOI] [PMC free article] [PubMed] [Google Scholar]
- Mathis C. A.; Wang Y.; Holt D. P.; Huang G. F.; Debnath M. L.; Klunk W. E. Synthesis and evaluation of 11C-labeled 6-substituted 2-arylbenzothiazoles as amyloid imaging agents. J. Med. Chem. 2003, 46, 2740–2754. 10.1021/jm030026b. [DOI] [PubMed] [Google Scholar]
- Lowe V. J.; Curran G.; Fang P.; Liesinger A. M.; Josephs K. A.; Parisi J. E.; Kantarci K.; Boeve B. F.; Pandey M. K.; Bruinsma T.; et al. An autoradiographic evaluation of AV-1451 Tau PET in dementia. Acta Neuropathol. Commun. 2016, 4, 58 10.1186/s40478-016-0315-6. [DOI] [PMC free article] [PubMed] [Google Scholar]
- Weksler B.; Romero I. A.; Couraud P. O. The hCMEC/D3 cell line as a model of the human blood brain barrier. Fluids Barriers CNS 2013, 10, 16 10.1186/2045-8118-10-16. [DOI] [PMC free article] [PubMed] [Google Scholar]
- Zhou A. L.; Swaminathan S. K.; Curran G. L.; Poduslo J. F.; Lowe V. J.; Li L.; Kandimalla K. K. Apolipoprotein A-I Crosses the Blood-Brain Barrier through Clathrin-Independent and Cholesterol-Mediated Endocytosis. J. Pharmacol. Exp. Ther. 2019, 369, 481–488. 10.1124/jpet.118.254201. [DOI] [PMC free article] [PubMed] [Google Scholar]
- Swaminathan S. K.; Ahlschwede K. M.; Sarma V.; Curran G. L.; Omtri R. S.; Decklever T.; Lowe V. J.; Poduslo J. F.; Kandimalla K. K. Insulin differentially affects the distribution kinetics of amyloid beta 40 and 42 in plasma and brain. J. Cereb. Blood Flow Metab. 2018, 38, 904–918. 10.1177/0271678X17709709. [DOI] [PMC free article] [PubMed] [Google Scholar]
- Gali C. C.; Fanaee-Danesh E.; Zandl-Lang M.; Albrecher N. M.; Tam-Amersdorfer C.; Stracke A.; Sachdev V.; Reichmann F.; Sun Y.; Avdili A.; et al. Amyloid-beta impairs insulin signaling by accelerating autophagy-lysosomal degradation of LRP-1 and IR-β in blood-brain barrier endothelial cells in vitro and in 3XTg-AD mice. Mol. Cell. Neurosci. 2019, 99, 103390 10.1016/j.mcn.2019.103390. [DOI] [PMC free article] [PubMed] [Google Scholar]
- Bradford M. M. A rapid and sensitive for the quantitation of microgram quantitites of protein utilizing the principle of protein-dye binding. Anal. Biochem. 1976, 72, 248–254. 10.1016/0003-2697(76)90527-3. [DOI] [PubMed] [Google Scholar]
- Schägger H.; von Jagow G. Tricine-sodium dodecyl sulfate-polyacrylamide gel electrophoresis for the separation of proteins in the range from 1 to 100 kDa. Anal. Biochem. 1987, 166, 368–379. 10.1016/0003-2697(87)90587-2. [DOI] [PubMed] [Google Scholar]
- Pandey M. K.; DeGrado T. R.; Qian K.; Jacobson M. S.; Hagen C. E.; Duclos R. I. Jr.; Gatley S. J. Synthesis and preliminary evaluation of N-(16-18F-fluorohexadecanoyl)ethanolamine (18F-FHEA) as a PET probe of N-acylethanolamine metabolism in mouse brain. ACS Chem. Neurosci. 2014, 5, 793–802. 10.1021/cn400214j. [DOI] [PubMed] [Google Scholar]
- Pandey M. K.; Belanger A. P.; Wang S.; DeGrado T. R. Structure dependence of long-chain [18F]fluorothia fatty acids as myocardial fatty acid oxidation probes. J. Med. Chem. 2012, 55, 10674–10684. 10.1021/jm301345v. [DOI] [PMC free article] [PubMed] [Google Scholar]
- Rhea E. M.; Rask-Madsen C.; Banks W. A. Insulin transport across the blood-brain barrier can occur independently of the insulin receptor. J. Physiol. 2018, 596, 4753–4765. 10.1113/JP276149. [DOI] [PMC free article] [PubMed] [Google Scholar]
- Patlak C. S.; Blasberg R. G.; Fenstermacher J. D. Graphical evaluation of blood-to-brain transfer constants from multiple-time uptake data. J. Cereb. Blood Flow Metab. 1983, 3, 1–7. 10.1038/jcbfm.1983.1. [DOI] [PubMed] [Google Scholar]
Associated Data
This section collects any data citations, data availability statements, or supplementary materials included in this article.


