Abstract
This study assessed the effect of kaolinite edge surfaces on solid-state reactions. Specifically, Tb3+-doped metastable CaAl2Si2O8 showing green phosphorescence was prepared via a solid-state reaction between expanded kaolinite, a methoxy-modified kaolinite, having Tb3+ ions adsorbed on its edge surfaces and CaCO3. This material cannot be obtained by the conventional grinding of kaolinite, CaCO3 and Tb2O3, indicating that the use of kaolinite edge surfaces is advantageous as a means of achieving certain solid-state reactions.
The effect of kaolinite edge surfaces on a solid-state reaction was demonstrated by the synthesis of Tb3+-doped metastable CaAl2Si2O8, indicating the importance of Tb3+ adsorbed on kaolinite edge surfaces.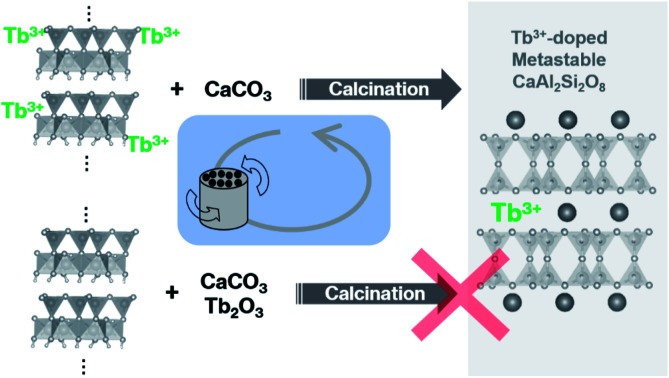
Introduction
The grinding of two or more raw materials that have been mixed together is known to promote various solid-state reactions that can generate numerous inorganic solid products.1,2 This grinding procedure also disrupts the stacking order of layered inorganic solids.3–9 In previous report by our group using expanded kaolinite as a raw material, this disordering process was facilitated by layer expansion, resulting in the rapid formation of target products.9 Kaolinite is a layered clay mineral having the formula Al2Si2O5(OH)4 and, while each layer in the kaolinite structure is neutral, each edge represents a crystal fracture surface bearing cation exchange sites.10,11 The number of available kaolinite edges was also found to increase as a result of layer expansion in our previous study, and so we are interested in the possibility of using these edges to promote solid-state reactions.12
Experimental
Solid-state reaction
The present study examined the solid-state reactions of kaolinite on which Tb3+ was adsorbed in conjunction with grinding with calcium carbonate (CaCO3) to form Tb3+-doped metastable CaAl2Si2O8. This compound is a member of the layered materials having the formula RAl2Si2O8 where R is an alkaline earth metal ion.13 The raw materials and grinding conditions used in this research were identical to those employed in our previous study.9 The kaolinite raw material was expanded Kanpaku kaolinite (JCSS-1101c, obtained from the Clay Science Society of Japan) without impurities (referred to herein as Ex-Kaol), a methoxy-modified kaolinite.9 This material was used to rapidly generate metastable CaAl2Si2O8 containing minimal byproducts (referred to herein as m-CAS).9 All the chemicals used in this study were reagent grade. In each reaction, a quantity of the kaolinite products was combined with CaCO3 (Hayashi Pure Chemical Ind., Ltd.) in a 1 : 1 molar ratio and roughly mixed using an agate mortar and pestle. A 358 mg portion of the resulting solid was subsequently dispersed in methanol (8 mL) and milled in a planetary ball mill at 250 rpm for 12 h using a resin vessel (12.5 mL) and 120 silicon carbide balls (2.5 mm in diameter). After milling, the solid was separated by centrifugation at 5000 rpm for 1 min and then dried at 80 °C for 1 h, to provide the product referred to herein as the “ground raw material”. The calcination of this material was performed by heating at 900 °C for 4.5 h. The majority of the calcinations in this study were conducted under air at a heating rate of 10 °C min−1 with subsequent furnace cooling.
Solid-state reactions including Tb3+ or Tb2O3
A portion of the ground raw material (125 mg) generated using the process described above was immersed in 5 mL of an aqueous solution containing 0.50 mol L−1 terbium chloride (TbCl3, Wako Pure Chemical) for 24 h. The solid was subsequently recovered by centrifugation, washed with distilled water to remove chloride ions (as determined by adding a silver nitrate solution to the supernatant) and dried at 80 °C for 24 h. The resulting material was calcined at 900 °C for 12 h (referred to herein as m-CAS-Tb-Edge). For comparison purposes, Ex-Kaol was also mixed with CaCO3 containing either 0.3 or 0.075 mol% Terbium oxide (Tb2O3, Kojundo Chemical Laboratory) and subjected to the same grinding procedure described above, followed by calcination at 900 °C for 12 h. These products are designated herein as m-CAS-Tb-X, where X is the Tb2O3 content. When producing these specimens, the CaCO3 amount was decreased to offset the increase in Tb2O3. In addition, a portion of the same ground raw material used to produce the m-CAS-Tb-0.3 was instead subjected to a 900 °C calcination for 4.5 h (referred to herein as m-CAS-Tb-0.3-4.5 h). A reference green phosphor specimen was obtained by performing, a solid-state reaction between the Ex-Kaol and barium carbonate (BaCO3, Wako Pure Chemical) together with 0.3 mol% Tb2O3 to form Tb3+-doped BaAl2Si2O8 (BAS-Tb-0.3), based on a procedure reported in a previous paper.8 This sample was processed using similar grinding conditions to those employed in generating the m-CAS and was calcined at 1100 °C for 12 h.8 Notably, layered BaAl2Si2O8 has previously been used to synthesize a Tb3+-doped phosphorescent material.14
Solid-state reactions including Ca2+ or a reducing atmosphere
The reaction mechanism in this work was examined by performing, the same immersion procedure described above but using 125 mg of the ground raw material and 5 mL of an aqueous solution containing 0.50 mol L−1 calcium chloride (CaCl2, Wako Pure Chemical). The resulting solid was then calcined at 900 °C for 4.5 h (referred to herein as m-CAS-Ca-Edge). In addition, a portion of the ground raw materials used to produce the m-CAS were calcined at 900 °C for 4.5 h under a nitrogen containing 3 vol% hydrogen gas to provide a reducing environment, producing a specimen referred to herein as m-CAS-R.
Characterization
The crystalline phases and particle morphologies of the various materials were characterized by acquiring X-ray diffraction (XRD) patterns (XRD-6100, Shimadzu) at a scan rate of 1° min−1 and by field-emission scanning electron microscopy (FE-SEM, spra40, Zeiss), respectively. Prior to obtaining FE-SEM images, samples were sputter-coated with platinum. The Tb concentration in the m-CAS-Tb-Edge (with the Tb present in the form of Tb2O3) was assumed to equal that in the raw material before calcination, which was estimated to be 0.12 mol% in the material based on inductively coupled plasma (ICP) analysis (ICPE-9000, Shimadzu). Prior to this analysis, a 50 mg portion of the ground raw material (comprising Ex-Kaol and CaCO3) that had been immerse in the Tb3+ solution was dispersed in a 1 mol L−1 hydrochloric acid (5 mL), and stirred for 1 h. Following this, the product was recovered by centrifugation at 5000 rpm for 5 min, and then washed twice, each time with 10 mL of the same hydrochloric acid solution. All the supernatants were mixed and appropriately diluted prior to assessment by ICP. The product colourations were also assessed by visible-light reflectance spectroscopy (v-670 with an ARSN-733 attachment, JASCO). Prior to these analyses, samples were mixed with barium sulfate (BaSO4, Wako Pure Chemical). The luminescence of each product was characterized by fluorescence spectroscopy (FP-6500 with an integrating sphere unit, ISF-513, JASCO) with excitation at 376 nm.14 The valence state of Tb ion was characterized by X-ray photoelectron spectroscopy (XPS; JPS-9030, JEOL).
Results and discussion
Photographic images showing the colour of a specimen under 254 nm irradiation before and after the acid treatment are provided in Fig. S1.† These images indicate the disappearance of the green phosphorescence under 254 nm irradiation following exposure to acid. This disappearance and the cause of the weak green phosphorescence obtained from the powder before the acid treatment are discussed further.
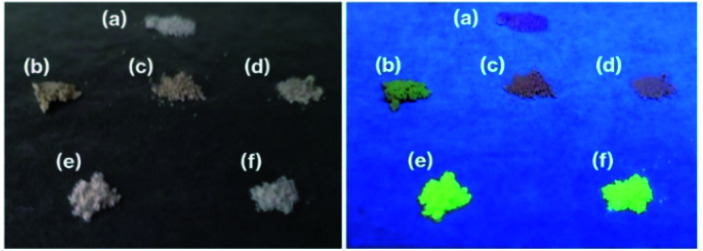
Fig. 1 presents photographic images of the various solid products. The m-CAS had a white colouration (Fig. 1a), in agreement with the previous report.9 Interestingly, this white colour was not obtained when Ex-Kaol was not used as the raw material.9 In contrast to the m-CAS, the m-CAS-Tb-0.3 and −0.075 were light brown and thus had a similar colour to that of Tb2O3 (Fig. 1b–d). The m-CAS-Tb-Edge was white and was found to emit intense green phosphorescence upon excitation at 254 nm (Fig. 1e). This behaviour matched that of the BAS-Tb-0.3 (Fig. 1f), which also exhibited green phosphoresence.14 The fluorescence spectrum of the m-CAS-Tb-Edge (Fig. 2) is typical for Tb3+ ions, with green emission due to the 5D4 → 7F5 transition at 543 nm.14 This emission is absent in the spectra of the m-CAS and m-CAS-Tb-0.075 (data not shown). The product colourations observed under normal lighting were in agreement with the visible-light spectra shown in Fig. S2.† The absorption at relatively short wavelengths evident in the m-CAS and m-CAS-Tb-Edge spectra is attributed to the presence of silicate layers (Fig. S2a and b†).15,16 Compared with the m-CAS and m-CAS-Tb-Edge, the m-CAS-Tb-0.075 and -0.3 as well as the Tb2O3 all exhibited increased absorption in the shorter wavelength region (Fig. S2c–e†). Specifically, the spectrum of each contained a shoulder at approximately 450 nm. This was likely due to the presence of Tb4+ ions, which were found to produce darker sample colours in a prior study.17 It should be noted that the oxidation of Tb3+ to Tb4+ is known to be responsible for the change in the colour of terbium oxide from white (Tb2O3) to dark brown (Tb7O12 or Tb11O20).18,19 In the present study, the Tb2O3 was originally light brown (Fig. 1b). The XPS spectrum of the Tb2O3 used in this study as presented in Fig. S3† displayed a broad signal that was deconvoluted into peaks at 156.5 and 150.5 eV, corresponding to Tb4+ and Tb3+, respectively.20 Therefore, this material contained Tb4+ and, based on the respective peak integrals, the Tb4+/Tb3+ molar ratio was estimated at 0.22. When Tb2O3 is heated in air, the original TbO1.5 (Tb2O3) compound is oxidized to TbO1.714 (Tb7O12) in the 500–900 °C range, while TbO1.714 (Tb7O12) is reduced back to TbO1.5 (Tb2O3) above 1000 °C.19
Fig. 1. Photographic images of (a) m-CAS, (b) Tb2O3, (c) m-CAS-Tb-0.3, (d) m-CAS-Tb-0.075, (e) m-CAS-Tb-Edge, and (f) BAS-Tb-0.3 acquired under (left) normal lighting and (right) 254 nm irradiation.
Fig. 2. Fluorescence spectrum of the m-CAS-Tb-Edge.
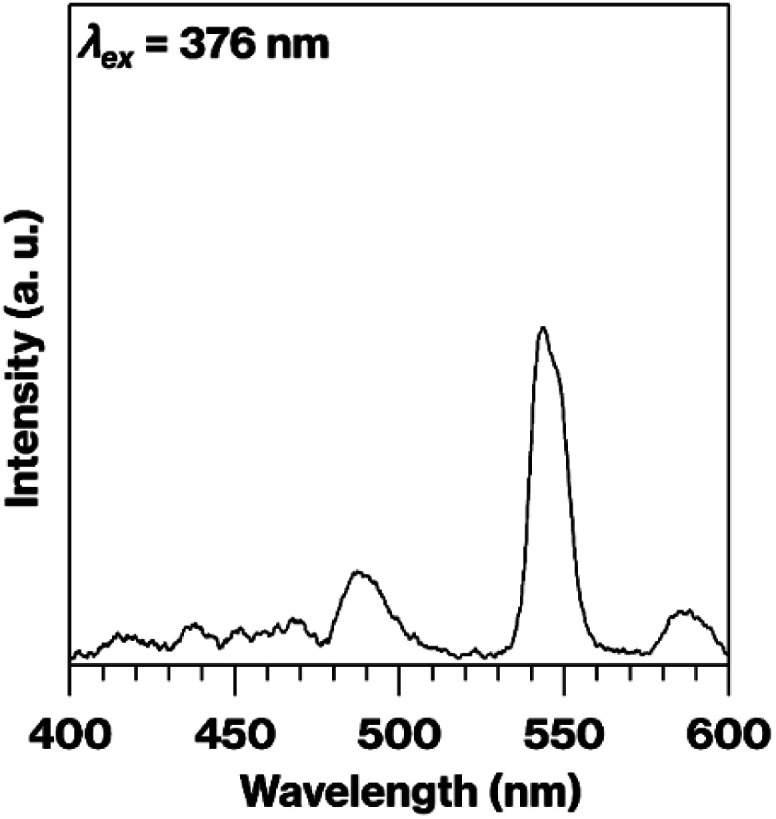
Fig. S4† shows FE-SEM images of the raw materials and the calcined products. The Ex-Kaol was evidently composed of hexagonal plate-like particles (Fig. S4a†)12 while the CaCO3 comprised cubic or rhombus-like particles with various sizes (Fig. S4b†). The m-CAS, m-CAS-Tb-0.3 and m-CAS-Tb-Edge (Fig. S4d and e†) had different morphologies from those of the Ex-Kaol, CaCO3 and Tb2O3 (Fig. S4a–c†), and contained hexagonal plate or rhombus-like particles with sizes on the order of 500 nm. In addition, the images of those calcined products are similarly (Fig. S4d and e†). It is noteworthy that metastable-CaAl2Si2O8 is composed of hexagonal plate-like particles.21,22
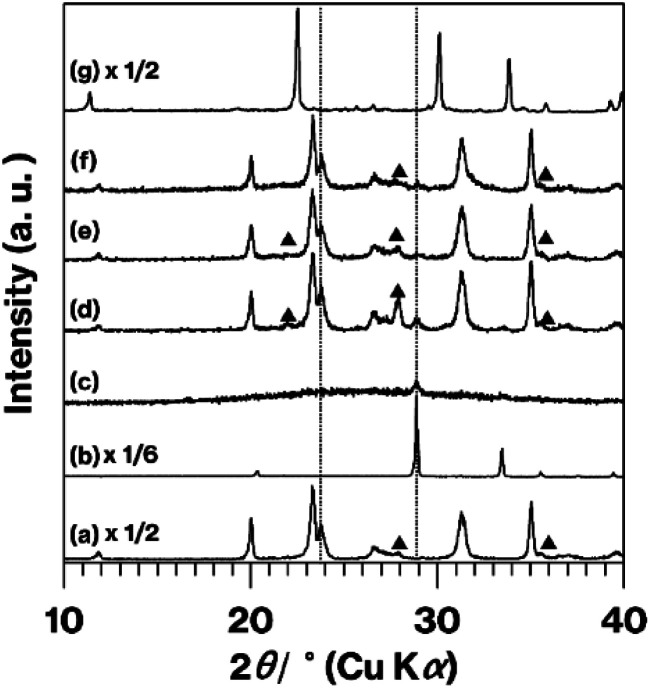
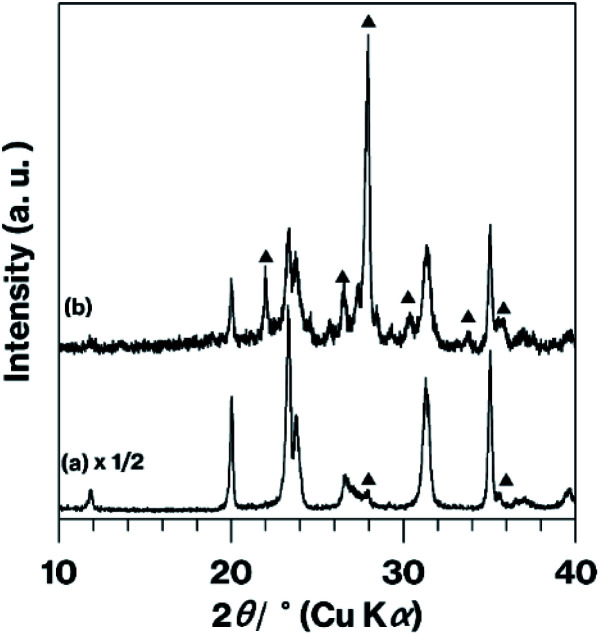
Fig. 3 presents XRD patterns obtained from the various products and from pure Tb2O3. The m-CAS pattern (Fig. 3a) shown here matches that reported previously.9 The intense reflection at 28.9° (two theta) that appears in the Tb2O3 pattern (Fig. 3b) is also present in the patterns for the CAS-based products (Fig. 3c–f) but was not generated by BAS-Tb-0.3 (Fig. 3g), which produced a pattern similar to those previously published in the literature.14 The m-CAS-Tb-0.3-4.5 h primarily produced a halo pattern (Fig. 3c). In addition, the reflections observed in the m-CAS pattern are present in those obtained from the other CAS-based products (Fig. 3d–f). None of the patterns generated by the CAS products contained any reflections due to CaCO3, Ex-Kaol, or the raw ground material, as demonstrated by Fig. S5.† Of note, the pattern for the CaCO3 used in this study displayed reflections due to calcite,23 while that for Ex-Kaol exhibited 0.86 and 0.72 nm diffraction lines resulting from the basal spacings of Ex-Kaol and pristine kaolinite, respectively, in agreement with a previous report.9 In particular, the 0.72 nm diffraction line is commonly observed in studies of kaolinite intercalation.5 The intensity of the reflection due to Tb2O3 (2θ = 28.9°) relative to the intensity of the m-CAS reflections increases in the order of m-CAS-Tb-0.3, m-CAS-Tb-Edge and m-CAS-Tb-0.075, which is consistent with the relative Tb2O3 concentrations in these materials of 0.30, 0.12 and 0.075 mol%, respectively. In addition, the relative intensities of the reflections due to anorthite (the stable phase of CaAl2Si2O8)7,9 decrease in the same order. Notably, the position (2θ = 23.8°) of the (004) reflection21 due to the stacking direction of the aluminosilicate layers of metastable CaAl2Si2O8 remains constant in the patterns for the CAS-based products (Fig. 3a and d-f). It is also evident that more intense anorthite reflections were generated by the m-CAS-Ca-Edge compared with the m-CAS (Fig. 4). In previously published XRD patterns for Tb2O3 containing Tb4+,18,19 the Tb2O3 reflections became broader with increasing the Tb4+ concentration. The reflection due to Tb2O3 observed in the XRD pattern for the Tb2O3 used in this study (Fig. 3b) has the same general shape in these prior patterns.18,19
Fig. 3. XRD patterns for (a) m-CAS, (b) Tb2O3, (c) m-CAS-Tb-0.3-4.5 h, (d) m-CAS-Tb-0.3, (e) m-CAS-Tb-0.075, (f) m-CAS-Tb-Edge, and (g) BAS-Tb-0.3. Filled triangles indicate anorthite reflections. Some of these profiles have been vertically compressed to allow easier comparison.
Fig. 4. XRD patterns for (a) m-CAS and (b) m-CAS-Ca-Edge. Filled triangles indicate anorthite reflections. The bottom profile has been vertically compressed to allow easier comparison.
Based on the formulae for the various terbium oxides, more than half of the Tb in TbO1.714 (Tb7O12) is in the form of Tb3+, while the more oxidized state of TbO1.75 (Tb4O7) contains equivalent amounts of Tb3+ and Tb4+. Taking the light brown colouration, visible-light spectra, XPS spectrum, and XRD patterns of the m-CAS-Tb-0.30 and m-CAS-Tb-0.075 (Fig. 1c, d, S2c, e,† and 3b–f) into consideration, these products likely contained partially oxidized Tb2O3. In contrast, the m-CAS-Tb-Edge was a white powder (Fig. 1e) with a Tb2O3 concentration of 0.12 mol%. In a previous study, Tb2O3 was formed by heat treatment of Tb(OH)3.24 It is well-known that rare-earth ions typically form inner and outer sphere complexes25,26 surrounded by water molecules on kaolinite edge and layer surfaces, respectively.27,28 In addition, the TbCl3 removed upon washing in the present study was converted into Tb7O12 by the heat treatment.29
The data presented herein demonstrate that the m-CAS-Tb-Edge exhibited green phosphorescence (Fig. 1f and 2) as a consequence of immersing the ground raw materials in an aqueous solution of Tb3+. It should be noted that this light emission could not be obtained when using a conventional grinding procedure (Fig. 1b–d and 3c–e), indicating that Tb3+ ions were not readily incorporated in the metastable CaAl2Si2O8 based on the solid-state reactions of Ex-Kaol, CaCO3 and Tb2O3. In contrast, the green phosphor BAS-Tb-0.3 forms as described in a previous report.14 In the present study, the metastable CaAl2Si2O8 and layered BaAl2Si2O8 were calcined at 900 and 1100 °C, respectively. The formulas for terbium oxide could be TbO1.714 (Tb7O12) and TbO1.5 (Tb2O3) at these respective temperatures.19 Although more than 50% of the Tb in the former material is in the form of Tb3+, the presence of Tb4+ likely interfered with the incorporation of Tb3+ in the metastable CaAl2Si2O8. According to Shannon,30 the ionic radii of Ba2+ (0.142 nm) and Ca2+ (0.110 nm) are larger than those of Tb3+ (0.104 nm) and Tb4+ (0.88 nm). The larger ionic radius of Ba2+ compared with Ca2+ implies that the basal spacing of metastable CaAl2Si2O8 is smaller than that of layered BaAl2Si2O8.14 Also, the differences in ionic radius between Ca2+ ions and Tb ions indicates that the basal spacing of metastable CaAl2Si2O8 is insufficient to incorporate Tb3+ ions. Even so, the appearance of the product (Fig. 1e), the ICP data, and the disappearance of green phosphorescence after the acid treatment (Fig. S1†) highly indicate that the immersion of the raw ground EX-Kaol in an aqueous solution containing Tb3+ ions caused these ions to be adsorbed on the kaolinite edge surfaces, which can function as cation exchange sites.10,11 The 0.12 mol% Tb2O3 concentration in the m-CAS-Tb-Edge is a reasonable result because this value is smaller than the maximum Tb2O3 content of 0.32 mol% estimated based on the cation exchange capacity of pristine kaolinite (2.3 mmol/100 g clay).11 In addition, the Tb3+ adsorbed on the edges likely formed inner sphere complexes according to previous reports.27,28 It is therefore probable that Tb3+ can be effectively incorporated into metastable CaAl2Si2O8 by adsorption on the kaolinite edges.
Because the XRD reflections generated by the metastable CaAl2Si2O8 were originally broad, changes in the positions of these reflections were difficult to detect (Fig. 3). Since rare-earth ions can also form outer sphere complexes on kaolinite layer surfaces,27,28 the Tb3+ in this material could have been surrounded by water molecules and converted into Tb2O3 on the m-CAS-Tb-Edge surfaces, as has been proposed in previous reports.24–28 The XRD pattern (Fig. 3f) and Tb2O3 concentration (0.12 mol %−1) for m-CAS-Tb-Edge together with the relatively weak luminescence from the original Tb2O3 (Fig. 1b) demonstrate that Tb2O3 would have made only a minor contribution to the green luminescence from m-CAS-Tb-Edge. Additionally, although anorthite is a mother material for Tb3+-containing phosphors,31,32 the relatively weak reflection attributed to anorthite (Fig. 3f) indicates that the green luminescence from m-CAS-Tb-Edge was due to the formation of Tb3+-doped metastable CaAl2Si2O8. In our previous studies,7,9 the kaolinite grinding process was found to generate new hydroxyl groups by breaking Al–O–Si bonds7 and the expanded kaolinite increased the available edge surfaces.9 The present immersion method could therefore be an effective means of doping the ground mixture of Ex-Kaol and CaCO3. Because the ground raw material exhibited some green phosphorescence after immersion in the Tb3+ solution (Fig. S1,† left), there may have been limited adsorption of Tb3+ on the CaCO3 surface. Notably, the effect of the kaolinite edges was also confirmed by the results obtained with the present m-CAS-Ca-Edge (Fig. 4), which exhibited more rapid formation of anorthite compared with m-CAS. This result suggests that the formation of this stable phase was promoted by Ca2+ ions that were possibly present on the kaolinite edges. In contrast to m-CAS, those materials containing Tb3+ slowly formed metastable CaAl2Si2O8 along with an increase in byproduct formation (see Fig. 1a–f and the experimental procedures). In this case, Tb3+ can be regarded as an impurity that suppressed the rapid formation of metastable CaAl2Si2O8, in good agreement with our previous result.9 However, further study will be required to clarify the detailed mechanisms associated with the effects of kaolinite edges on which various cations are adsorbed.
Interestingly, m-CAS-R was black in colour and produced an XRD pattern containing anorthite reflections (Fig. 5). It is assumed that the solid-state reaction of kaolinite and CaCO3 together with various Tb3+ compounds inhibited the formation of a metastable CaAl2Si2O8-based phosphor under a reductive atmosphere. The action of the kaolinite edges is therefore necessary for the formation of a green phosphor via a solid-state reaction under air. It should also be noted that grinding of kaolinite nanoscrolls to form nanoparticles33 could potentially increase the edge surface area. The present Tb3+-doped ground materials are likely similar to Tb3+-containing substances previously prepared by sol–gel reactions, some of which could be calcined to form phosphors under a reductive atmosphere.34 To the best of our knowledge, there have been few reports of the colour of such materials in powder form after preparation based on a solid-state reaction. The present study clearly demonstrates the formation of a material that emits green light in response to excitation by the solid-state reaction of Tb3+-adsorbed raw materials under air.
Fig. 5. XRD pattern and photographic image (inset) for the m-CAS-Ca-Edge.

Conclusions
We have demonstrated the effect of kaolinite edges on a solid-state reaction. Specifically, the incorporation of Tb3+ in metastable CaAl2Si2O8 was accomplished using ground raw materials containing kaolinite with Tb3+ adsorbed on its edge surfaces. The resulting product could be useful not only as a phosphor but also as a composite material.22 Furthermore, the present method could be applied to promote other solid-state reactions of cation-exchangeable layered inorganic solids.35
Author contributions
Shingo Machida: conceptualization, data curation, investigation, writing—original draft, supervision. Ken-ichi Katsumata: writing—review and editing. Atsuo Yasumori: project administration.
Conflicts of interest
There are no conflicts to declare.
Supplementary Material
Acknowledgments
Special thanks to Mr Kaishi Hasegawa, MSc student at the Tokyo University of Science, for performing the ICP analyses.
Electronic supplementary information (ESI) available. See https://doi.org/10.1039/d2ra02199d
Notes and references
- Cohn G. Chem. Rev. 1948;42:527. doi: 10.1021/cr60133a002. [DOI] [PubMed] [Google Scholar]
- Rainer D. N. Morris R. E. Dalton Trans. 2021;50:8995. doi: 10.1039/D1DT01440D. [DOI] [PMC free article] [PubMed] [Google Scholar]
- Takahashi H. Bull. Chem. Soc. Jpn. 1959;32:235. doi: 10.1246/bcsj.32.235. [DOI] [Google Scholar]
- Takahashi H. Bull. Chem. Soc. Jpn. 1959;32:252. doi: 10.1246/bcsj.32.252. [DOI] [Google Scholar]
- Weiss A. Angew. Chem., Int. Ed. 1963;12:697. doi: 10.1002/anie.196306971. [DOI] [Google Scholar]
- Frost R. L. Kristof J. Mako E. Martens W. Langmuir. 2002;18:6491. doi: 10.1021/la0201422. [DOI] [Google Scholar]
- Okada K. Watanabe N. Jha K. V. Kameshima Y. Yasumori A. MacKenzie K. J. D. Appl. Clay Sci. 2003;23:329. doi: 10.1016/S0169-1317(03)00132-7. [DOI] [Google Scholar]
- Okada K. Watanabe N. Jha K. V. Kameshima Y. Yasumori A. MacKenzie K. J. D. Mater. Lett. 2003;57:3554. doi: 10.1016/S0167-577X(03)00124-1. [DOI] [Google Scholar]
- Machida S. Katsumata K. Yasumori A. RSC Adv. 2021;11:38473. doi: 10.1039/D1RA07762G. [DOI] [PMC free article] [PubMed] [Google Scholar]
- Schoonheydt R. A. and Johnston C. T., Surface and Interface Chemistry Minerals, in Developments in Clay Science Volume 5 A Handbook of Clay Science, ed. F. Bergaya and G. Lagaly, Elsevier, Oxford, UK, 2nd edn, 2013, pp. 145–148 [Google Scholar]
- Nakao A. Funakawa S. Kosaki T. Clay Sci. 2013;17:75. [Google Scholar]
- Machida S. Katsumata K. Yasumori A. Materials. 2022;15:588. doi: 10.3390/ma15020588. [DOI] [PMC free article] [PubMed] [Google Scholar]
- Töpel-Schadt J. Müller W. F. Pentinghaus H. J. Mater. Sci. 1978;13:1809. doi: 10.1007/BF00548745. [DOI] [Google Scholar]
- Hakeem D. A. Kim Y. Park K. J. Nanosci. Nanotechnol. 2016;16:1761. doi: 10.1166/jnn.2016.12021. [DOI] [PubMed] [Google Scholar]
- Carbonaro C. M. Corpino R. Ricci R. C. Chiriu D. AIP Conf. Proc. 2014;1624:15. doi: 10.1063/1.4900451. [DOI] [Google Scholar]
- Huang Z. Li L. Li Z. Li H. Wu J. Materials. 2020;13:3811. doi: 10.3390/ma13173811. [DOI] [PMC free article] [PubMed] [Google Scholar]
- Saiduzzaman M. Tsuchioka N. Noritake F. Kumada N. Takei T. J. Ceram. Soc. Jpn. 2021;129:181. doi: 10.2109/jcersj2.20210. [DOI] [Google Scholar]
- Balabanov S. S. Permin D. A. Rostokina E. Y. Egorov S. V. Sorokin A. A. Kuznetsov D. D. Ceram. Int. 2017;43:16569. doi: 10.1016/j.ceramint.2017.09.044. [DOI] [Google Scholar]
- Zhang J. Chen H. Wang J. Wang D. Han D. Zhang J. Wang S. Scr. Mater. 2019;171:108. doi: 10.1016/j.scriptamat.2019.06.030. [DOI] [Google Scholar]
- Gupta P. Mahapatra P. K. Choudhary R. N. P. Phys. Status Solidi B. 2019:19002316. [Google Scholar]
- Akatsuka K. Yasumori A. Maeda K. Mater. Lett. 2019;242:163. doi: 10.1016/j.matlet.2018.12.080. [DOI] [Google Scholar]
- Maeda K. Akatsuka K. Okuma G. Yasumori A. Crystals. 2021;206(11):393. doi: 10.3390/cryst11040393. [DOI] [Google Scholar]
- Al-Jaroudi S. S. Ul-Hamid A. Mohammed A.-R. I. Saner S. Powder Technol. 2007;175:115. doi: 10.1016/j.powtec.2007.01.013. [DOI] [Google Scholar]
- Tang Q. Shen J. Zhou W. Zhang W. Yu W. Qian Y. J. Mater. Chem. 2003;13:3103. doi: 10.1039/B308713A. [DOI] [Google Scholar]
- Stumm W., The Inner-Sphere Surface Complex, in Aquatic Chemistry, ed. C. P. Huang, C. R. O'Melia and J. J. Morgan, America Chemical Society, Washington, DC, 1995, pp. 1–32 [Google Scholar]
- Strawn D. G. Soil Syst. 2021;5:13. doi: 10.3390/soilsystems5010013. [DOI] [Google Scholar]
- Borst A. M. Smith M. P. Finch A. A. Estrade G. Villanova-de-Benavent C. Nason P. Marquis E. Horsburgh N. J. Goodenough K. M. Xu C. Kynichký J. Geraki K. Nat. Commun. 2020;11:4386. doi: 10.1038/s41467-020-17801-5. [DOI] [PMC free article] [PubMed] [Google Scholar]
- Zhou J. Liu H. Liu D. Yuan P. Bu H. Du P. Fan W. Li M. Appl. Clay Sci. 2022;216:106356. doi: 10.1016/j.clay.2021.106356. [DOI] [Google Scholar]
- Xue S.-F. Wu W. Y. Bian X. J. Northeast. Univ., Nat. Sci. 2018;39:1423. [Google Scholar]
- Shannon R. D. Acta Crystallogr., Sect. A: Cryst. Phys., Diffr., Theor. Gen. Crystallogr. 1976;32:751. doi: 10.1107/S0567739476001551. [DOI] [Google Scholar]
- Li M. Yu X. Xu X. Cheng S. Zhang B. Qiu J. J. Am. Ceram. Soc. 2015;98:2008. doi: 10.1111/jace.13656. [DOI] [Google Scholar]
- Jiao H. Chen Q. Wang P. IOP Conf. Ser.: Mater. Sci. Eng. 2018;452:022048. [Google Scholar]
- Machida S. Gotoh T. Katsumata K. Yasumori A. Appl. Clay Sci. 2021;214:106295. doi: 10.1016/j.clay.2021.106295. [DOI] [Google Scholar]
- Naik R. Prashantha S. C. Nagabhushana H. Naik Y. V. Girish K. M. Mater. Sci. Res. India. 2018;15:252. [Google Scholar]
- Ogawa M. Saito K. Sohmiya M. Dalton Trans. 2014;43:10340. doi: 10.1039/C4DT00147H. [DOI] [PubMed] [Google Scholar]
Associated Data
This section collects any data citations, data availability statements, or supplementary materials included in this article.


